committed to sustainable productivity fileq2 figures in summary orders received were msek 25 934,...
TRANSCRIPT

COMMITTED TO
SUSTAINABLE
PRODUCTIVITY
Q2 2016 results
July 15, 2016

Q2 IN BRIEF
Solid industrial business – mining and construction demand weak
– Record order intake for Compressor Technique and Industrial Technique
Operating profit margin increased sequentially – down year-on-year
– Negative currency effect compared to Q2 2015
Healthy operating cash flow – further reduction of working capital
July 15, 2016
Atlas Copco - Q2 results 2016
2

Q2 FIGURES IN SUMMARY
Orders received were MSEK 25 934, organic decline of 1%
Revenues were MSEK 25 438, unchanged organically
Adjusted operating profit of MSEK 4 822 (5 162), margin at 19.0% (19.8)
– Items affecting comparability of MSEK -47 (-90)
– Reported operating profit of MSEK 4 775 (5 072), margin at 18.8% (19.4)
Profit for the period of MSEK 3 188 (3 651)
Basic earnings per share SEK 2.62 (3.00)
Operating cash flow at MSEK 3 487 (3 481)
July 15, 2016
Atlas Copco - Q2 results 2016
3
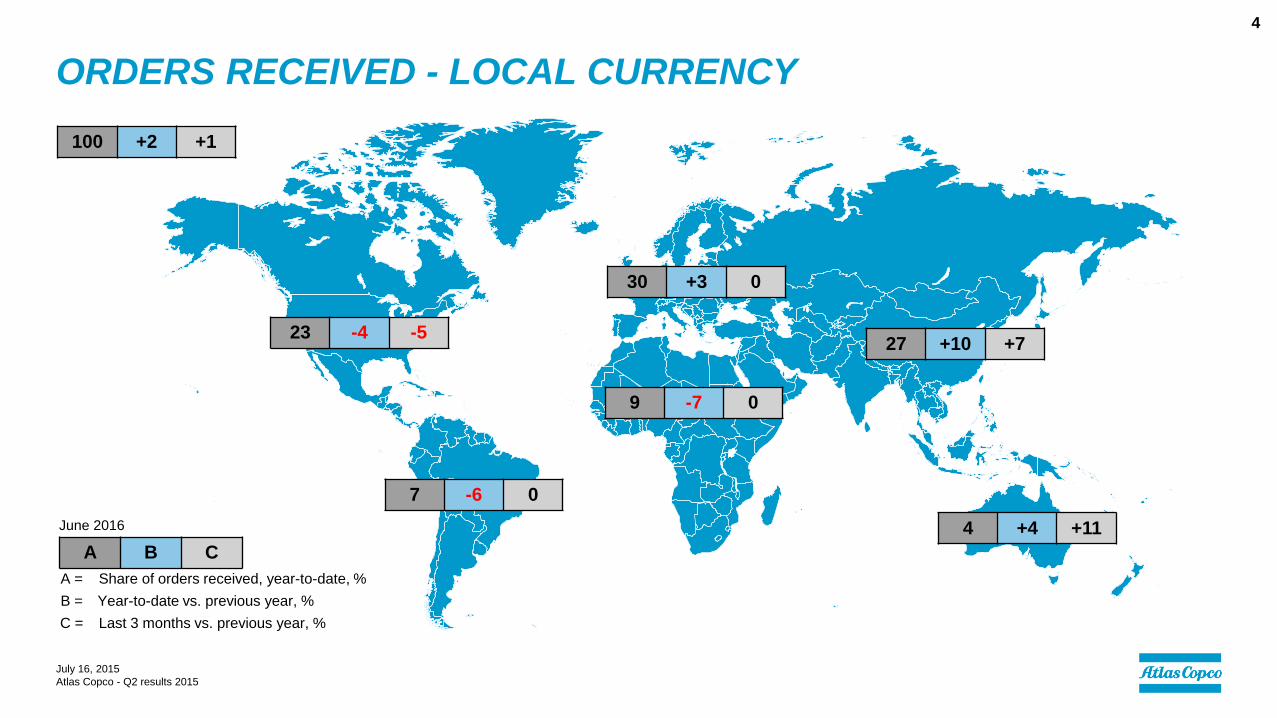
ORDERS RECEIVED - LOCAL CURRENCY
July 16, 2015
Atlas Copco - Q2 results 2015
4
June 2016
100 +2 +1
A = Share of orders received, year-to-date, %
B = Year-to-date vs. previous year, %
C = Last 3 months vs. previous year, %
A B C
23 -4 -5
7 -6 0
30 +3 0
9 -7 0
27 +10 +7
4 +4 +11

ORDER GROWTH PER QUARTERGrowth excl. currency
July 15, 2016
Atlas Copco - Q2 results 2016
5
-20
-10
0
10
20
30
40
11 Q
1
11 Q
2
11 Q
3
11 Q
4
12 Q
1
12 Q
2
12 Q
3
12 Q
4
13 Q
1
13 Q
2
13 Q
3
13 Q
4
14 Q
1
14 Q
2
14 Q
3
14 Q
4
15 Q
1
15 Q
2
15 Q
3
15 Q
4
16 Q
1
16 Q
2
Growth, excl. currency, % (volume, price and structure)

SALES BRIDGE
July 15, 2016
Atlas Copco - Q2 results 2016
6
Orders Orders
MSEK received Revenues received Revenues
2015 26 775 26 111 52 245 50 856
Structural change, % +2 +1 +1 +1
Currency, % -4 -4 -4 -4
Price, % +0 +0 +0 +0
Volume, % -1 +0 +0 -1
Total, % -3 -3 -3 -4
2016 25 934 25 438 50 655 48 575
April - June January - June

ATLAS COPCO GROUP
Compressor Technique
Industrial Technique
Mining and Rock Excavation
Technique
Construction Technique
Revenues by business area
July 15, 2016
Atlas Copco - Q2 results 2016
7
14%
25%
15%
46%
12 months through June 2016

COMPRESSOR TECHNIQUE
Record order intake, organic growth of 1%
– Solid growth for service
– Stable orders for compressors and vacuum
equipment
– Growth in Asia
Operating margin at 22.6% (22.7)
Acquisition of Leybold approved
0%
5%
10%
15%
20%
25%
30%
0
2 500
5 000
7 500
10 000
12 500
15 000
Q12014
Q22014
Q32014
Q42014
Q12015
Q22015
Q32015
Q42015
Q12016
Q22016
Orders received, MSEK Revenues, MSEK
Operating margin, % Adjusted operating margin, %
July 15, 2016
Atlas Copco - Q2 results 2016
8
Centrifugal compressor with
remote monitoring capabilities
and an energy efficiency gain
of approximately 6%.

INDUSTRIAL TECHNIQUE
Record order intake, organic growth of 6%
– Growth for tools and systems from the motor
vehicle and general industries
– Continued strong growth in the service business
Operating margin at 22.1% (23.4), negatively
affected by product mix
0%
5%
10%
15%
20%
25%
0
1 000
2 000
3 000
4 000
5 000
Q12014
Q22014
Q32014
Q42014
Q12015
Q22015
Q32015
Q42015
Q12016
Q22016
Orders received, MSEK Revenues, MSEK Operating margin, %
July 15, 2016
Atlas Copco - Q2 results 2016
9
Electric pistol-grip tightening tool that combines increased
productivity with improved ergonomics

MINING AND ROCK EXCAVATION TECHNIQUE
Orders received decreased 4%, organically
– Continued weak demand for equipment
– Service business down year-on-year – stable
sequentially
– Consumables stable year-on-year
Operating margin up sequentially
Further efficiency measures
0%
3%
6%
9%
12%
15%
18%
21%
24%
0
1 000
2 000
3 000
4 000
5 000
6 000
7 000
8 000
Q12014
Q22014
Q32014
Q42014
Q12015
Q22015
Q32015
Q42015
Q12016
Q22016
Orders received, MSEK Revenues, MSEK
Operating margin, % Adjusted operating margin, %
July 15, 2016
Atlas Copco - Q2 results 2016
10
Battery driven underground loader
0000
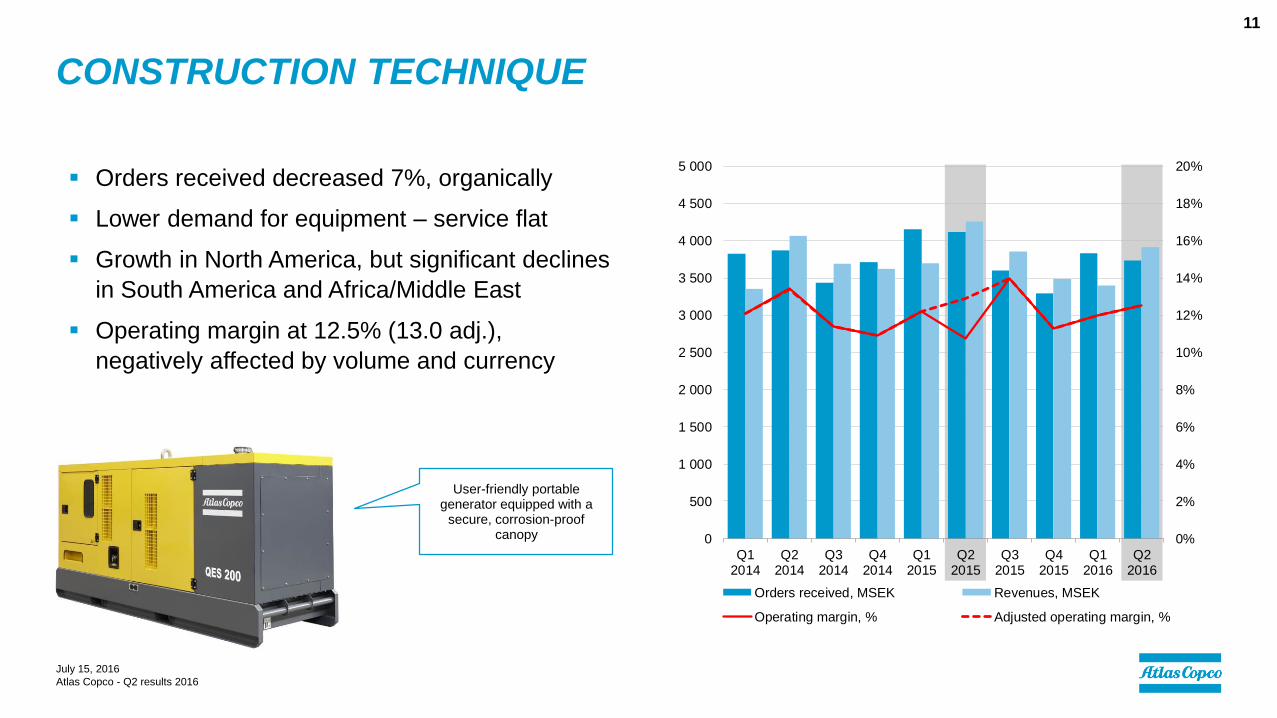
CONSTRUCTION TECHNIQUE
Orders received decreased 7%, organically
Lower demand for equipment – service flat
Growth in North America, but significant declines
in South America and Africa/Middle East
Operating margin at 12.5% (13.0 adj.),
negatively affected by volume and currency
0%
2%
4%
6%
8%
10%
12%
14%
16%
18%
20%
0
500
1 000
1 500
2 000
2 500
3 000
3 500
4 000
4 500
5 000
Q12014
Q22014
Q32014
Q42014
Q12015
Q22015
Q32015
Q42015
Q12016
Q22016
Orders received, MSEK Revenues, MSEK
Operating margin, % Adjusted operating margin, %
July 15, 2016
Atlas Copco - Q2 results 2016
11
User-friendly portable generator equipped with a
secure, corrosion-proof canopy

GROUP TOTAL
MSEK 2016 2015 %
Orders received 25 934 26 775 -3%
Revenues 25 438 26 111 -3%
Operating profit 4 775 5 072 -6%
– as a percentage of revenues 18.8 19.4
Profit before tax 4 420 4 850 -9%
– as a percentage of revenues 17.4 18.6
Income tax expense -1 232 -1 199 3%
– as a percentage of profit before tax -27.9 -24.7
Profit for the period 3 188 3 651 -13%
Basic earnings per share, SEK 2.62 3.00
Return on capital employed, % 27 25
April - June
0%
5%
10%
15%
20%
25%
30%
0
5 000
10 000
15 000
20 000
25 000
30 000
Q12014
Q22014
Q32014
Q42014
Q12015
Q22015
Q32015
Q42015
Q12016
Q22016
Orders received, MSEK Revenues, MSEK
Operating margin, % Adjusted operating margin, %
April – June 2016 vs. 2015
July 15, 2016
Atlas Copco - Q2 results 2016
12

26 111 25 438375 7
1 055
0
5 000
10 000
15 000
20 000
25 000
30 000
Q2 2015 One-time +acquisitions
Currency Volume, price, mixand other
Q2 2016
Revenues
5 0724 775
175
117 31540
0
1 000
2 000
3 000
4 000
5 000
6 000
Q2 2015 LTI (options) One-time +acquisitions
Currency Volume, price,mix and other
Q2 2016
Operating profit
PROFIT BRIDGEApril – June 2016 vs. 2015
July 15, 2016
Atlas Copco - Q2 results 2016
13
Volume, price, One-time items Share based
MSEK Q2 2016 mix and other Currency Acquisitions LTI programs Q2 2015
Atlas Copco Group
Revenues 25 438 7 -1 055 375 26 111
Operating profit 4 775 -40 -315 175 -117 5 072
% 18.8% nm 19.4%

PROFIT BRIDGE – BY BUSINESS AREAApril – June 2016 vs. 2015
July 15, 2016
Atlas Copco - Q2 results 2016
14
Volume, price, One-time items
MSEK Q2 2016 mix and other Currency Acquisitions Q2 2015
Compressor Technique
Revenues 11 929 527 -350 290 11 462
Operating profit 2 700 182 -90 5 2 603
% 22.6% 34.5% 22.7%
Industrial Technique
Revenues 3 622 -5 -75 5 3 697
Operating profit 799 -56 -10 0 865
% 22.1% nm 23.4%
Mining and Rock Excavation Technique
Revenues 6 124 -291 -455 0 6 870
Operating profit 1 041 -102 -180 65 1 258
% 17.0% 35.1% 18.3%
Construction Technique
Revenues 3 915 -246 -175 80 4 256
Operating profit 490 -42 -30 105 457
% 12.5% 17.1% 10.7%

BALANCE SHEET
July 15, 2016
Atlas Copco - Q2 results 2016
15
MSEK
Intangible assets 34 451 32% 33 860 32% 33 520 33%
Rental equipment 2 993 3% 3 113 3% 3 076 3%
Other property, plant and equipment 9 037 8% 9 508 9% 8 947 9%
Other non-current assets 3 905 4% 3 690 4% 4 128 4%
Inventories 18 297 17% 18 968 18% 16 906 16%
Receivables 27 021 25% 27 398 26% 25 985 25%
Current financial assets 2 170 2% 1 910 2% 1 576 2%
Cash and cash equivalents 8 891 8% 6 301 6% 8 861 9%
Assets classified as held for sale 10 0% 34 0% 11 0%
TOTAL ASSETS 106 775 104 782 103 010
Total equity 46 220 43% 43 074 41% 46 750 45%
Interest-bearing liabilities 26 383 25% 28 943 28% 25 214 24%
Non-interest-bearing liabilities 34 172 32% 32 765 31% 31 046 30%
TOTAL EQUITY AND LIABILITIES 106 775 104 782 103 010
Jun. 30, 2016 Jun. 30, 2015 Dec. 31, 2015

CASH FLOW
July 15, 2016
Atlas Copco - Q2 results 2016
16
MSEK 2016 2015
Operating cash surplus 5 665 6 170
of which depreciation added back 1 042 1 059
Net financial items 82 367
Taxes paid -3 609 -1 199
Pension funding -36 36
Change in working capital 441 -520
Increase in rental equipment, net -196 -272
Cash flows from operating activities 2 347 4 582
Investments of property, plant & eq., net -292 -399
Other investments, net -391 -194
Cash flow from investments -683 -593
Adjustment, currency hedges of loans -427 -508
Adjustment, tax payment in Belgium 2 250 0
Operating cash flow 3 487 3 481
Company acquisitions/ divestments -357 -22
April - June

NEAR-TERM OUTLOOK
The overall demand for the Group is expected to remain at current level.
July 15, 2016
Atlas Copco - Q2 results 2016
17

COMMITTED TO
SUSTAINABLE PRODUCTIVITY.
July 15, 2016
Atlas Copco - Q2 results 2016
18


CAUTIONARY STATEMENT
“Some statements herein are forward-looking and the actual outcome could be materially
different. In addition to the factors explicitly commented upon, the actual outcome could be
materially and adversely affected by other factors such as the effect of economic conditions,
exchange-rate and interest-rate movements, political risks, the impact of competing products and
their pricing, product development, commercialization and technological difficulties, supply
disturbances, and major customer credit losses.”
July 15, 2016
Atlas Copco - Q2 results 2016
20