committee for economic development - child care …...bureau economic census and county business...
TRANSCRIPT

Child Care in State Economies2019 Update
EXECUTIVE SUMMARY

About This ReportChild Care can allow parents to participate in the labor force and pursue education or training; the organized child care industry itself is an integral part of state economies. This report, produced by RegionTrack, Inc., an economic research firm, and commissioned by the Committee for Economic Development of The Conference Board with funding from the Alliance for Early Success, provides a broad overview of the child care industry, taking into account both of these perspectives.
First, the report examines the role of the industry from the traditional labor force perspective of child care as a means for parents to work and child care’s potential in that role to support regional economic growth and development.
Second, the report provides extensive details regarding the paid child care industry in state economies, including usage rates, the role of public funding, revenues, and business structure. The report estimates the state-level economic spillover effects of the child care industry.
Child Care in State Economies: 2019 Update uses a consistent data set for all states that reflects the use of paid, or market-based, child care services. The overall size of the paid child care industry (i.e., number of establishments, employment, and revenue) at the national and state levels is determined using U.S. Census Bureau Economic Census and County Business Pattern data as well as Non-employer Statistics data reported by the Census Bureau for 2016. The definition of child care varies greatly across the states (i.e., licensed care, registered care, listed care, certified care, license-exempt care, etc.). Therefore, industry estimates may vary state by state depending upon the data sources used. The U.S. Census Bureau data used in this report reflects data sets with regard to sole proprietors (businesses that have no paid employees and are subject to federal income tax who report child care income) and data related to child care centers (businesses with paid employees in the child care industry sector). Both nonprofit and tax-paying entities are reflected.

Child Care in State Economies: 2019 Update 3
The child care industry in the U.S. produced revenue totaling $47.2
billion and generated an additional $52.1 billion in "spillover" (output) in other industries for a total economic
impact of $99.3 billion.
Key Findings
Child Care Usage » More than half (58.7 percent) of the nation’s preschoolers under age 5 participate in a regular, weekly care arrangement with a nonparental provider.
» The likelihood of a young child being in child care increases as the child ages. While 47.4 percent of all infants (less than 1 year old) are reported in regular care, 54 percent of 1- and 2-year-olds and 73 percent of 3- and 4-year-olds are in non-parental care.
» The use of regular non-parental child care for preschoolers is highest among two-parent families with both parents working full time (88.4 percent) and single-parent families with the parent working 35 hours or more per week (83.5 percent).
» More educated mothers make greater use of non-parental child care arrangements. Two-thirds (67.5 percent) of parents with a bachelor’s degree or higher use regular weekly care versus less than half (44.6 percent) of parents with a high school education or less.
» Families’ use of child care declines when siblings are present. In single-parent families, those with one child (78.9 percent) are more likely to use formal care than in families with siblings (58.8 percent).
» The cost of child care is a significant financial challenge for many parents, and especially for low-skilled parents. Center-based infant care costs 12.2 percent of median household income in Mississippi and Alabama and exceeds 20 percent of median income in 21 states and the District of Columbia.
The Child Care Industry’s Role in Regional Economic Growth» In 2016, more than 675,000 market-based child care providers produced revenue totaling $47.2 billion and employed 1.52 million wage and salary and self-employed workers in the U.S.
» Service industries of comparable size include medical and diagnostic labs ($47.2 billion), spectator sports ($46 billion), pipeline transportation ($44.5 billion), and water transportation ($43.3 billion).
» The child care industry is estimated to support another $52.1 billion in “spillover” (output) in other industries.
» Child care supports regional economic growth primarily through its support of labor force participation and education of parents in the workforce.
» Especially for low-wage workers with children, the decision to work or seek additional education may depend on the availability of affordable child care.
» Subsidized child care can encourage low-skilled parents to maintain their connection to the labor force or to upgrade their skills through education, thereby contributing to economic growth and productivity over the longer term.
4 Child Care in State Economies: 2019 Update
The Role of Organized Child Care in State EconomiesThis report focuses on organized child care providers who offer care on a paid basis.
This definition of the industry captures market-based forms of care that produce measurable economic activity. This is not meant to suggest that unpaid child care does not constitute meaningful economic activity, but simply that it is difficult to measure the value of this production because it is not traded in any market.
The report addresses four broad questions regarding the role organized child care plays in state economies:
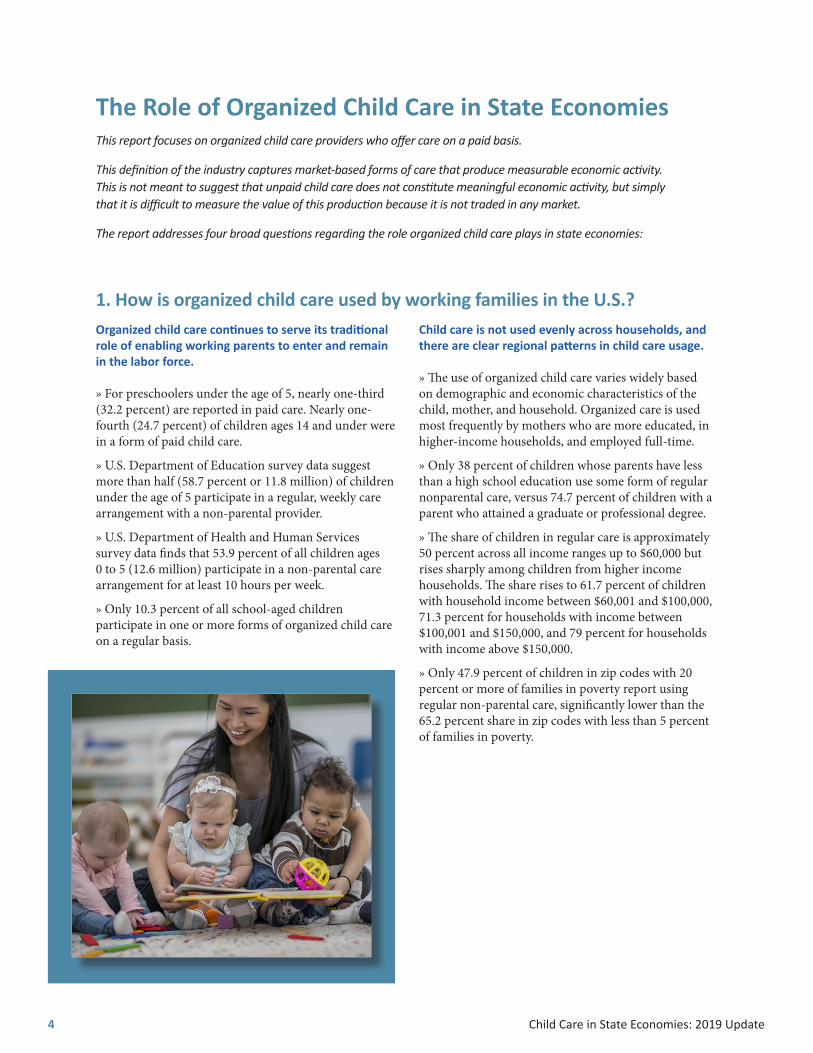
1. How is organized child care used by working families in the U.S.?Organized child care continues to serve its traditional role of enabling working parents to enter and remain in the labor force.
» For preschoolers under the age of 5, nearly one-third (32.2 percent) are reported in paid care. Nearly one-fourth (24.7 percent) of children ages 14 and under were in a form of paid child care.
» U.S. Department of Education survey data suggest more than half (58.7 percent or 11.8 million) of children under the age of 5 participate in a regular, weekly care arrangement with a non-parental provider.
» U.S. Department of Health and Human Services survey data finds that 53.9 percent of all children ages 0 to 5 (12.6 million) participate in a non-parental care arrangement for at least 10 hours per week.
» Only 10.3 percent of all school-aged children participate in one or more forms of organized child care on a regular basis.
Child care is not used evenly across households, and there are clear regional patterns in child care usage.
» The use of organized child care varies widely based on demographic and economic characteristics of the child, mother, and household. Organized care is used most frequently by mothers who are more educated, in higher-income households, and employed full-time.
» Only 38 percent of children whose parents have less than a high school education use some form of regular nonparental care, versus 74.7 percent of children with a parent who attained a graduate or professional degree.
» The share of children in regular care is approximately 50 percent across all income ranges up to $60,000 but rises sharply among children from higher income households. The share rises to 61.7 percent of children with household income between $60,001 and $100,000, 71.3 percent for households with income between $100,001 and $150,000, and 79 percent for households with income above $150,000.
» Only 47.9 percent of children in zip codes with 20 percent or more of families in poverty report using regular non-parental care, significantly lower than the 65.2 percent share in zip codes with less than 5 percent of families in poverty.

Child Care in State Economies: 2019 Update 5
Usage rates are above average among children in suburbs but below average among those living in towns and rural regions.
» Usage of paid child care is highest in the upper Plains, New England, and portions of the Mid-Atlantic region. Usage is much less prevalent in the Mountain West, much of the Southwest, Southern Plains, the Appalachia region, much of the Southeast, California, and Hawaii.
Usage of paid care is higher for families with children under age 5 compared to families with school-age children. The highest overall usage rates for families with children under age 5 are found in Minnesota (54.4 percent), South Dakota (50 percent), Vermont (49.9 percent), District of Columbia (48.8 percent), North Dakota (47.6 percent), Maryland (43.5 percent), Nebraska (41.6 percent), Wisconsin (41.5 percent), Iowa (41.4 percent), and New Hampshire (40.4 percent).
The six states with the lowest rates of paid care for children under age 5 include Hawaii (18 percent), Oklahoma (20.4 percent), West Virginia (20.8 percent), New Mexico (21.1 percent), Utah (21.4 percent), and Arizona (25.2 percent).
While the labor force participation rate for women has stabilized since 1999 and declined slightly in recent years (along with overall U.S. participation rates), participation rates for mothers with children under the age of 6 increased steadily between 2005 and 2017.
» The need for child care is greater among single-parent families than married families.
In 2017, single mothers with children under 18 were far more likely to participate in the labor force (73.2 percent) than married mothers (67.3 percent) and more likely to use organized child care.
Across all living arrangements, only 68.9 percent of children under age 18 lived with two married parents in 2017. This share is down steadily from about 88 percent in 1960 when estimates were first reported.
As a result, more than one in four (27 percent) children in the United States live in a household with only one parent present.

6 Child Care in State Economies: 2019 Update
2. What are key factors driving the use of organized child care in the U.S.?Female labor force participation is highly correlated with use of organized child care.
» After rising for decades, female labor force participation began declining slightly in 1999, reaching 57 percent in 2017. However, participation rates for mothers with children under the age of 6 increased between 2005 and 2017 to 65.1 percent.
Mothers with an infant are the least likely (58.5 percent) to participate in the labor force, although more than half are active participants. The rate rises to 62.3 percent for mothers with children under 3 years of age and to 65.1 percent for those with children under 6 years of age. The participation rate peaks at 75.7 percent among mothers with school-aged children (ages 6 to 17).
The cost of organized child care presents a substantial financial hurdle for many working parents with children, especially those working for low wages.
Significant public funding assists families in paying for child care.
» Federal and state child care subsidy programs provided $13.9 billion in the most recent fiscal year to help low-income families offset the high cost of child care. Federal sources provided $9.5 billion (68 percent) and states contributed the remaining $4.4 billion (32 percent).
» Federal child care tax credits provided an additional $3.6 billion in assistance to mostly middle-income families with children in paid care in tax year 2016. In addition, approximately half the states allow tax deductions or credits for child care expenses. The average credit totaled $560, or less than 10 percent of the typical annual cost of full-time care.
» Total federal and state child care assistance ($17.6 billion) equals more than one third (37.3 percent) of total U.S. child care industry revenue.
The child care industries in ten states (Delaware, Indiana, New Mexico, Ohio, Pennsylvania, Rhode Island, Utah, Vermont, Washington, and Wisconsin) are highly dependent upon public assistance programs. In those states, this funding represents more than 50 percent of total child care industry revenue.
Subsidized child care can encourage low-skilled parents to maintain
their connection to the labor force or to upgrade their skills through
education, thereby contributing to economic growth and productivity
over the longer term.

Child Care in State Economies: 2019 Update 7
3. What is the size and structure of the U.S. child care industry?The U.S. child care industry consists of a large number of mostly very small businesses.
» More than 675,000 market-based child care providers produced revenue of $47.2 billion in 2016.
» The average child care provider in the U.S. remains relatively small, producing only about $70,000 in annual revenue.
» Two major types of child care providers commonly operate within the industry— larger, more organized establishments with paid employees (mostly child care centers) and smaller establishments operated by a sole proprietor with no employees (mostly family child care homes).
» Child care establishments were staffed by 1.5 million workers and home-based owners who received earnings of $24.2 billion in 2016.
» Most providers are sole proprietors with no paid employees. But most children are cared for by larger, multi-employee establishments. Incomes received by workers in the industry are low.
The number of non-employers who provide primarily home-based care declined 20 percent between 2010 and 2016, from more than 752,000 to only 599,000.
While more research is needed to identify the primary cause of the decline in family child care homes, factors that could be related to the decline include:
» The strength and low jobless rate in the U.S. labor market which can lead some providers to instead seek higher-paying employment in the community.
» The cost of care outpacing subsidy growth.
» Low net earnings from operating a home-based child care business.
» An aging home-based child care workforce reaching retirement age.
» The cost of compliance with health and safety regulations as the federal government and states have sought to better protect the safety of children in child care (depending upon the level of deficiencies among home-based programs).
For working parents, the decline in home-based care has limited options for parents among child care settings and reduced the availability of the care option that typically has the lowest cost.
» As an industry, child care revenue is comparable to other important service-providing industries including medical and diagnostic labs ($47.2 billion), spectator sports ($46 billion), pipeline transportation ($44.5 billion), and water transportation ($43.3 billion).
The $47.2 billion in direct economic output of the child care industry in turn produces spillover (economic activity) that essentially doubles the gross market-based economic activity related to the industry for a total economic impact of $99.3 billion.
» The child care industry produces spillover economic activity through two primary channels: (i) the “indirect” effects of the child care businesses’ purchases of goods and services from other industries; and (ii) the “induced” economic activity from purchases of goods and services that child care workers make using their child care earnings.
» Regional model-based estimates suggest approximately $52.1 billion in additional spillover effects to state economies from the child care industry: $19.5 billion in “indirect” activity from the child care industry’s purchases of goods and services from other industries and $32.6 billion in “induced” activity from consumer spending out of child care wages and salaries.
» The child care industry employs 1.5 million individuals supporting an additional 507,090 jobs in other industry sectors throughout the U.S.
The number of non-employers who provide primarily home-based care
declined 20 percent between 2010 and 2016, from more than 752,000
to only 599,000.

1530 WILSON BLVD., SUITE 400, ARLINGTON, VA 22209 WWW.CED.ORG
4. What role can child care play in regional economic growth?Child care can facilitate a region’s economic growth through its support of increased labor force participation and education of the regional workforce.
» Especially for low-wage workers with children, the decision to work or seek additional education may depend on the availability of affordable child care.
» Affordable child care may encourage low-skilled parents to maintain their connection to the labor force or to upgrade their skills through education, both of which contribute to economic growth and productivity over the long term.
» State labor force participation rates are positively correlated with income levels and negatively correlated with poverty rates in the states.
» Similarly, the average years of education in a state is positively correlated with state per capita income.
Child care subsidies encourage greater labor force participation, which in turn increases overall economic output in a region. Subsidies trigger changes in wage rates, the mix of low- and high-skilled labor used in the state, prices of goods and services, and trade flows.
» State output increases by roughly $3.80 per dollar of additional federal spending on child care subsidies.
Understanding the various economic roles played by child care and the
forces shaping the size and structure of the child care industry is vital to
informing effective child care policy.
8 Child Care in State Economies: 2019 Update