committee on national statistics february 6, 2014
TRANSCRIPT

Charlie Catlett, DirectorSenior Fellow, Computation Institute of the University of Chicago and Argonne National
LaboratorySenior Computer Scientist, Argonne National Laboratory
Presentation to the National Academy of SciencesCommittee on National Statistics
February 6, 2014
400million city dwellers
China will add
221Chinese cities will have 1M or more people.
And by 2030...
Rapid Urbanization in Developing Economies
of Chinese people will live in cities with 1M or more people.
In 2025:
70%....requiring the
construction of one New York City every year for
several decades
Source: Foreign Policy Magazine, Sep/Oct 2010, Megacities, Richard Dobbs (McKinsey
Global Institute)
ppppppppppppppppppppppppppp p gpppppppppppppppppppppppppppppppppppp ggggggggggggggggggggggggggggggggggggggggg
Landsat images of the Pearl River Delta in 1980 and 2005, illustrating the impact of urbanization on the planet.
Between now and 2020, the Guangdong province will invest $229B in 202 ongoing and 258 new transport
infrastructure projects to create a single 50M person city.

UrbanCCD Programs Environment Infrastructure Society
Computational Modeling
Data Analytics
Embedded Systems
Science-based design and planning. Timescales: years to decades.
Evidence-based measurement and predictive analytics. Timescales: hours to months.
Decision-support and new ways to interact with the built environment. Timescales: seconds to hours.
UrrrrrUrrUrrrrrrrUUUUUUUUUUUUUUUUUUUUUUUUUUUUUUUUUUUUUUUUUU banCCCCCCCCCCCCCCC DCDDDDDDDDDDDDDDCDDCDDDDCDDCDDCDDDCDCDDCDDDDCDCDCDCDCDCDDCDDDCDCDCDCDCDCDCDCDDCCCCCCCCCCCCCCCCCCCC PrPrPrrPrPrPrPrPrPrPrPrPrPrPPPP goggogggoggggggggggggggggoggggggogggggggggogogogggogoggogoooooooooooooooooooooooooooo rararararaaraaaaarararaaraararaaaraararaarrrrrrrrrrrrrrrrrrrrrrrrrrrr msssmsssmssssmsssmsmssmsmsmssssmsmsmssmssmsmmmmmmmmmmmmmmmmmmmmmmmmmmmmmmmmmmmmmmmmmmmmmmmmmmmmmmmmm
Site plan (zoning, phasing)
Climate Change Scenario A
Zoning Phasing

Produced by: S. Jiang, J. Ferreira, M. Gonzalez (2011)Data Source: CMAP Travel Tracker Data, 2008.Reference: Jiang, S., J. Ferreira, and M. González. 2012.Clustering Daily Patterns of Human Activities in the City. Data Mining and Knowledge Discovery. Volume 25, Number 3, Pages 478-510
Chicago Human Activity Patterns: Weekday
l (2011)l
TemperatureHumidityLightSoundCO2IRMotionPrecipitationAnemometer...
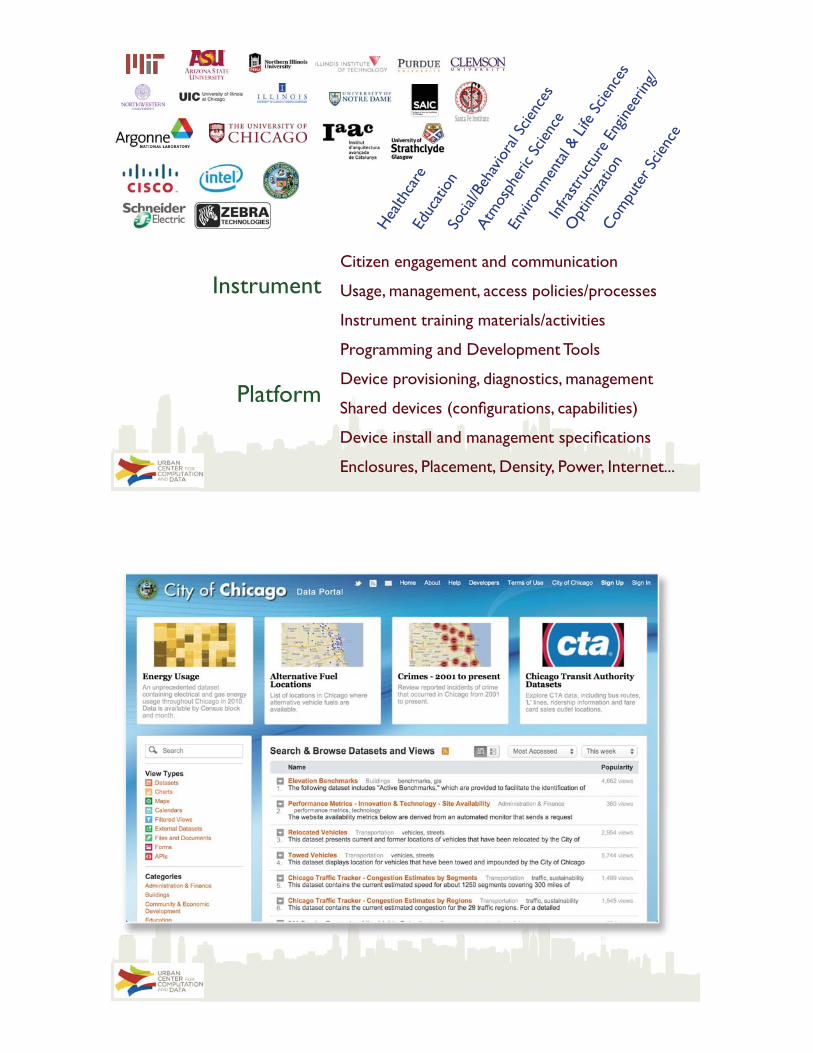
Platform
Instrument
Enclosures, Placement, Density, Power, Internet...
Device install and management specifications
Shared devices (configurations, capabilities)
Device provisioning, diagnostics, management
Programming and Development Tools
Instrument training materials/activities
Usage, management, access policies/processes
Citizen engagement and communication

City Decision-Makers
Scientists and Engineers(City Partners)
Aldermen, City Employees
External organizations, citizens
Data Sources
City Databases Sensors Video GPS Social Media
Automated Continuous DataAnalytics
Visual Interaction, Mapping, Analysis Tools
Data Access, Authorization, Privacy
Application Programming InterfacesScalable Data
Handling (pre-processing, cleaning, merging, de-duplication,
access…)
Daniel B. Neill (Carnegie Melon University - Event and Pattern Detection Laboratory), Brett Goldstein (fmr Chicago CIO/CDO; Fellow, Harris School of Public Policy, Computation Institute, UChicago)

Rodent Infestation
Critical violation found in prior inspectionsSanitation code complaints through 311Rodent sighting reported through 311Request for garbage carts (per-ward)Three-day moving avg of high temp before the inspectionType of facility (e.g., restaurant versus grocery store)
Food Safety Inspections
Black Market Cigarettes
Liquor license (decreased likelihood)Low-risk v. high-risk gas station (both less likely than non-gas station)Tobacco licenseNeighborhoodCommon names (e.g., Tom's market) in store name
Tom Schenk, City of Chicago
2004 SNAP Households with at least one child under 5
Bob Goerge

Lowers property value
Crime
Lost taxes
C
Unknown owner
Unpaid bills
Contaminated land
Negative Impacts
Legal Obstacles
Guiding Indicators
Housing stability
Affordability
Vacancy
Matt Gee, UChicago

Equitable DevelopmentCommunity Development
Habitat and Ecosystems FunctionWater, Wastewater, and Stormwater
EnergyMaterials Management and Waste
Health and Well-BeingAccess and Mobility
Matt Gee, UChicagoKate McGee, City of San Francisco
Metrics Generated from 53 Datasets
• Built Environment• Neighborhood Assets• Housing and Rental Prices• Building-level Energy Use• Solar installations• Renewables generation• Longitudinal Surveys• Employment records• Waste tonnage by block• Transportation• Traffic density• Air quality• Emissions
Matt Gee, UChicagoKate McGee, City of San Francisco

No API - must download individual (huge) flat files or use online tool ( OnTheMap ).
Significant effort to enable geographic queries/navigation
Data is 1-2 yrs old. Ideally could use local data to fill gaps.
Example Federal data source: LODES
(US Census Longitudinal Employer-Household Dynamics Origin-Destination Employment
Statistics)
Matt Gee, UChicagoDerek Eder, DataMade

Internal non-City data(e.g. private utilities, other government
agencies)
Internal City data
Public DataNew combinations of data...
Cities are creating (open) data resources
Many critical city decisions also rely on county, state, federal data
Spatial and temporal resolution are key (along with timely data)
Modern Data Infrastructure with APIs
Open Source Tools for Common Tasks
Strategically chosen standards and requirements
ACCESS
PREPARATION
INCENTIVES
How Can the Federal Government Help?
Fund city/academic exemplars to provide replicable/sharable capabilities and to assist other (esp. smaller) cities.
ACCELERATION
Summary