committee on payment and settlement systemseftemkt.tcmb.gov.tr/pdf/turkey-redbook.pdf · the...
TRANSCRIPT

Committee on Payment and Settlement Systems
Payment systems in Turkey Prepared by the Central Bank of the Republic of Turkey and the Committee on Payment and Settlement Systems of the central banks of the Group of Ten countries June 2007

Copies of publications are available from:
Bank for International Settlements Press & Communications CH-4002 Basel, Switzerland
E-mail: [email protected]
Fax: +41 61 / 280 9100 and +41 61 / 280 8100
This publication is available on the BIS website (www.bis.org).
© Bank for International Settlements 2007. All rights reserved. Brief excerpts may be reproduced or translated provided the source is cited.
ISBN 92-9131-739-X (print)
ISBN 92-9197-739-X (online)

CPSS – Payment systems in Turkey, 2007 iii
Foreword
The Committee on Payment and Settlement Systems (CPSS) periodically publishes – under the aegis of the Bank for International Settlements (BIS) – reference works on payment systems in various countries, widely known as Red Books. The CPSS has also invited the central banks of a number of countries where important developments in payment systems are under way to prepare – in collaboration with its Secretariat at the BIS – separate volumes on their respective payment systems. The present volume, the second edition of the Red Book for Turkey, is a further step towards increasing our understanding of the way payment systems work in different countries.
Properly functioning payment systems enhance the stability of the financial system, reduce transaction costs in the economy, promote the efficient use of financial resources, improve financial market liquidity and facilitate the conduct of monetary policy. In recent years, issues relating to the economic efficiency and financial risks of all types of payment systems have come to the fore.
Central banks have a strong interest in promoting safety and improving efficiency in payment systems as part of their overall concern with financial stability. They play a key role in domestic payment system development and, in many cases, operate large-value payment systems. Central banks in many countries have been influential in improving public understanding of payment and settlement arrangements in their countries and public awareness of the various policy issues connected with such arrangements. This volume aims to portray the significant steps taken by the Central Bank of the Republic of Turkey in promoting safe and efficient payment systems in Turkey.
We hope that this volume will contribute to the general understanding and awareness of payment and securities settlement arrangements in Turkey, both domestically and internationally.
Timothy F Geithner Chairman, Committee on Payment and Settlement Systems
Durmuş YılmazGovernor
Central Bank of theRepublic of Turkey


CPSS – Payment systems in Turkey, 2007 v
Contents
Foreword.................................................................................................................................. iii Introduction...............................................................................................................................1 1. Institutional aspects.........................................................................................................2
1.1 The general institutional framework .......................................................................2 1.1.1 Regulatory institutions.................................................................................2 1.1.2 The legal framework for the payment and settlement systems...................3 1.1.3 The role of financial intermediaries .............................................................4
1.2 The role of the CBRT .............................................................................................6 1.2.1 General responsibilities...............................................................................7 1.2.2 Administration of accounts..........................................................................7 1.2.3 Payment systems oversight ........................................................................8 1.2.4 Activities in the area of securities clearing and settlement systems ...........8 1.2.5 The operational role of the CBRT ...............................................................9 1.2.6 Cooperation with other institutions..............................................................9
1.3 The role of other private and public sector bodies .................................................9 1.3.1 Banks Association of Turkey.......................................................................9 1.3.2 Participation Banks Association of Turkey................................................10 1.3.3 Istanbul Stock Exchange (ISE) .................................................................10 1.3.4 ISE Settlement and Custody Bank, Inc (Takasbank) ................................10 1.3.5 Central Registry Agency ...........................................................................11
2. Payment media used by non-banks ..............................................................................11 2.1 Cash payments ....................................................................................................11 2.2 Non-cash payments .............................................................................................12
2.2.1 Paper-based payments .............................................................................12 2.2.2 Cheques....................................................................................................12 2.2.3 Postal cheques .........................................................................................13 2.2.4 Promissory notes ......................................................................................13 2.2.5 Credit transfers .........................................................................................13 2.2.6 Payment cards ..........................................................................................13 2.2.7 ATMs and POS terminals .........................................................................15 2.2.8 Other access channels for banking and payments ...................................15
2.3 Recent developments ..........................................................................................15 3. Interbank exchange and settlement systems ................................................................16
3.1 General overview .................................................................................................16 3.2 The real-time gross settlement system ................................................................17

vi CPSS – Payment systems in Turkey, 2007
3.2.1 Operating rules......................................................................................... 17 3.2.2 Participants in the system ........................................................................ 17 3.2.3 Types of transactions handled ................................................................. 17 3.2.4 Operation of the system ........................................................................... 18 3.2.5 Operating hours........................................................................................ 18 3.2.6 Transaction processing environment ....................................................... 18 3.2.7 Settlement procedures ............................................................................. 19 3.2.8 Pricing policies ......................................................................................... 20 3.2.9 Risks and risk management in TIC-RTGS ............................................... 20 3.2.10 Statistical data .......................................................................................... 22
3.3 The large-value payment system ........................................................................ 22 3.3.1 Operating rules......................................................................................... 22 3.3.2 Participants in the system ........................................................................ 22 3.3.3 Types of transactions handled ................................................................. 22 3.3.4 Operation of the system ........................................................................... 22 3.3.5 Operating hours........................................................................................ 23 3.3.6 Transaction processing environment ....................................................... 23 3.3.7 Settlement procedures ............................................................................. 23 3.3.8 Pricing policies ......................................................................................... 23 3.3.9 Risk management .................................................................................... 24 3.3.10 Statistical data .......................................................................................... 24
3.4 Retail payment systems ...................................................................................... 24 3.4.1 Interbank Card Centre (BKM)................................................................... 24 3.4.2 Interbank Clearing Houses Centre (BTOM) ............................................. 25 3.4.3 E-money schemes.................................................................................... 26
3.5 Exchange and settlement systems for international transactions........................ 26 3.5.1 Cross-border payments............................................................................ 27 3.5.2 Retail payments (credit and debit cards).................................................. 27 3.5.3 Post Office remittances ............................................................................ 27 3.5.4 Traveller’s cheques .................................................................................. 27
4. Securities settlement systems ...................................................................................... 27 4.1 Government bonds, treasury bills and CBRT liquidity bills.................................. 27
4.1.1 Primary market operations ....................................................................... 28 4.1.2 The ISE market ........................................................................................ 28
4.2 Stocks.................................................................................................................. 29 4.2.1 Trading ..................................................................................................... 29 4.2.2 Clearing and Settlement........................................................................... 29

CPSS – Payment systems in Turkey, 2007 vii
4.3 The use of the securities infrastructure by the CBRT ..........................................29 4.3.1 Open market operations ...........................................................................30 4.3.2 Securities lending and borrowing market in the CBRT .............................30 4.3.3 CBRT securities settlement system (TIC-ESTS) ......................................30
5. The role of the central bank in interbank settlement systems .......................................31 5.1 TIC-RTGS and ESTS...........................................................................................31 5.2 Provision of settlement (and credit) facilities........................................................32
5.2.1 Use of central bank accounts for payments ..............................................32 5.2.2 Use of central bank accounts for securities transactions ..........................32
5.3 Monetary policy and payment systems ................................................................32 5.3.1 TRY interbank money market in the CBRT...............................................32 5.3.2 Foreign exchange and banknote market in the CBRT..............................32
Statistical tables......................................................................................................................35
Comparative tables.................................................................................................................49


CPSS – Payment systems in Turkey, 2007 ix
List of abbreviations
BAT Banks Association of Turkey
BKM Interbank Card Centre
BRSA Banking Regulation and Supervision Agency
BTOM Interbank Clearing Houses Centre
CBRT Central Bank of the Republic of Turkey
CMB Capital Markets Board of Turkey
CRA Central Registration Agency
CSD Central Securities Depository
DDNs Domestic Debt Notes (government bonds and treasury bills)
DVP Delivery versus payment
ICH Interbank Clearing House
ISE Istanbul Stock Exchange
RC Relay computer (front-end processor for connecting to TIC-RTGS and ESTS)
SDIF Savings Deposits Insurance Fund
TCA Turkish Competition Authority
TCS Takasbank Clearing System
TIC-ESTS Turkish Interbank Clearing – Electronic Securities Transfer and Settlement System
TIC-RTGS Turkish Interbank Clearing – Real-Time Gross Settlement System
TKBB Participation Banks Association of Turkey
TRL Turkish lira (national currency unit before 1 January 2005)
TRY New Turkish lira (national currency unit since 1 January 2005)
Ykr New kurus (sub-unit of the national currency, one 100th of the new Turkish lira)


CPSS – Payment systems in Turkey, 2007 1
Introduction
As a result of an extensive structural adjustment and liberalisation process launched in the early 1980s, the Turkish economy grew strongly up to the early 1990s. After a downturn in 2001, declining inflation and weakening fiscal dominance promoted high and stable growth, which surpassed the high-growth environment that existed during the 1990s. In the 2002–05 period, average growth in the economy reached 7.1% as opposed to the 3.2% average of the 1990–2001 period. Moreover, the volatility of growth declined fivefold, with the standard deviation falling from 5.9 in 1990–2001 to 1.2 in the post-2001 period.
Turkey managed a significant transformation in the aftermath of the 2001 financial crisis. This included measures for improving market efficiency, strengthening the financial sector and managing the transition to the status of a prospective European Union member.
The structural changes were broadly supported by institutional changes; central bank independence, a shift to the floating exchange rate regime and the setting-up of a supervisory banking institution were the major steps towards ensuring macroeconomic and financial stability. Along with institutional reform, policies were also altered. An “implicit” inflation targeting regime was initiated in 2002 to reduce inflation to single digits. The stability achieved and the success of the institutional reform process were reflected in the decline of inflation from 68.5% in 2001 to below 8% in 2005, and the extension of maturities, initially in public borrowing and later in private contracts.
Liberalisation and structural adjustments had a significant impact on the financial sector. The policy changes created a competitive environment as banks were allowed to widen their range of activities and the conditions for foreign banks’ entry into the domestic financial markets were liberalised. These changes provided the impetus for financial institutions in Turkey to make rapid strides in modernising their services. In particular, payment services have improved substantially with the introduction of new technology. The developments in the communications infrastructure and computer technology have helped banks to improve services throughout the country. Users have been quick to adopt the new instruments and services.
The Central Bank of the Republic of Turkey (CBRT) has played a leading role in the modernisation of payment services. It has developed secure, reliable and efficient interbank payment and settlement systems. In particular, the Turkish real-time gross settlement (RTGS) system, TIC-RTGS, has become an efficient funds transfer system and hence an indispensable component of the financial system.
2 CPSS – Payment systems in Turkey, 2007
1. Institutional aspects
1.1 The general institutional framework 1.1.1 Regulatory institutions In Turkey, there are five major regulators for financial institutions:
• The CBRT is responsible for securing the objectives of price stability and financial system stability. The CBRT is also responsible for the operation, regulation and oversight of payment systems in Turkey. The details of the CBRT’s role are described in Section 1.2.
• The Banking Regulation and Supervision Agency (BRSA), which was established under the Banks Law (Law No 4389 enacted in 1999; annulled by the Banking Law, Law No 5411 enacted in 2005), issues licences, and regulates and supervises all major financial institutions, including banks, financial holding companies, leasing, factoring and consumer finance companies. The BRSA also ensures that independent external auditing firms and rating agencies offering services to financial institutions act in accordance with the principles and methods set by the Agency.
• The BRSA aims to safeguard the rights and benefits of depositors and to create the proper environment in which banks can operate with market discipline in a healthy, efficient and globally competitive manner, thus contributing to the achievement of long-run economic growth and stability of the country.
• The Capital Markets Board of Turkey (CMB) is the regulatory and supervisory authority in charge of securities markets in Turkey. Authorised by the Capital Markets Law (Law No 2499 enacted in 1981), the CMB is responsible for regulating and supervising securities markets and institutions, determining the operational principles of capital markets, and protecting the rights and interests of investors.
• In this framework, the CMB regulates and supervises corporations offering securities to the public, securities market intermediaries, securities investment funds (mutual funds), investment companies (including real estate investment companies and venture capital investment companies), independent external auditing firms offering services to capital market institutions, stock exchanges and secondary markets in general, precious metal exchanges and derivatives exchanges, and other related institutions operating on the capital markets, such as ratings agencies, clearing and depository institutions.
• The regulation of capital market instruments, including futures and options, also falls under the regulatory scope of the CMB. In this framework, it also assumes responsibility for introducing and developing new instruments.
• Based on the overall objectives of ensuring the fair and orderly functioning of the markets and protecting the rights of investors, the major goal of the CMB is to take necessary measures to foster the development of capital markets, hence contributing to the efficient allocation of financial resources in the country while ensuring investor protection.
• The General Directorate of Insurance under the Turkish Treasury is responsible for the regulation and supervision of the insurance business, both life insurance and casualty insurance, in accordance with the Insurance Law (Law No 7397 on “Supervision of Insurance Companies”, enacted in 1959).
• The Turkish Competition Authority (TCA), which was established by the Protection of Competition Law (Law No 4054 enacted in 1994) and commenced operation in 1997, is responsible for preventing proposed mergers and acquisitions that would create a dominant position in the market and adversely affect competition.

CPSS – Payment systems in Turkey, 2007 3
In accordance with the Regulation on Mergers and Acquisitions Requiring Authorisation by the TCA (Communiqué No 1997/1 enacted in 1997), authorisation by the TCA is obligatory when the total market share of the undertakings, including banks, carrying out the merger or acquisition exceeds 25% of the relevant product market throughout the country or a part thereof, or when their total turnover exceeds TRY 25 million. The TCA may authorise a proposed merger or acquisition on condition that other measures deemed appropriate are taken and certain obligations are met.
1.1.2 The legal framework for the payment and settlement systems Although there are no laws dealing specifically with payment and settlement systems, a number of laws have a bearing on payment-related activities and institutions:
• The Law on the Central Bank of the Republic of Turkey (CBRT Law) (Law No 1211 enacted in 1970; last amended by Law No 4651 enacted in 2001) regulates the operations of the CBRT, whose major functions and responsibilities derive from this Law – inter alia the exclusive right to issue banknotes in Turkey. The Law authorises the CBRT to establish payment, securities transfer and settlement systems, to enact regulations to ensure the uninterrupted operation and oversight of existing or future systems, and to determine the methods and instruments, including the electronic environment for payments.
• The Banking Law (Law No 5411 enacted in 2005; amended by Law No 5472 enacted in 2006) regulates the business activities of all banks, namely deposit banks, participation banks and development and investment banks, in Turkey and Turkish branches of such institutions established abroad. The Law lays down rules and procedures governing the incorporation, management, transactions, transfer, merger, liquidation and supervision of banks, acceptance of deposits and participation funds, in order to protect the rights and interests of depositors. Its purpose is also to ensure the efficient functioning of the credit system by giving due consideration to confidence and stability in financial markets. All activities of financial holding companies, the Banks Association of Turkey (BAT), the Participation Banks Association of Turkey (TKBB), the Banking Regulation and Supervision Agency (BRSA) and the Savings Deposits Insurance Fund (SDIF) are also governed by the provisions of this Law.
• Article 79 of the Banking Law makes it obligatory for all deposit, development and investment banks subject to this Law to become a member of the BAT, and for all participation banks to become a member of the TKBB, within one month of receipt of their operating licence.
• The Capital Markets Law (Law No 2499 enacted in 1981; amended by Law No 4487 enacted in 1999) regulates and controls the secure, transparent and stable functioning of the capital markets and protects the rights and interests of investors, for the purpose of ensuring efficient and widespread participation by the public in the development of the economy through investment of savings in the securities market. Capital market instruments and their public offering and sale, exchange markets and other markets organised pursuant to the Law, capital market activities, capital market institutions and the Capital Markets Board are subject to the provisions of the Law. The Law focuses on shares offered to the public and does not apply to the issuance of shares not offered to the public by joint stock corporations that are not publicly held.
• The Cheque Law (Law No 3167 on “Arrangement of Payments by Cheque and Protection of Cheque Bearers”, enacted in 1985; amended by Law No 4814 enacted in 2003) governs all aspects of payment by cheque and provides the framework for

4 CPSS – Payment systems in Turkey, 2007
issuance, acceptance and payment of cheques. Article 6 of the Law governs the establishment and functioning of the interbank clearing houses (ICHs). Under the Central Bank Law, the CBRT is responsible for their supervision.
• The Bank Cards and Credit Cards Law (Law No 5464 enacted in 2006) aims to ensure the efficient functioning of card-based payment systems by establishing rules and procedures governing the issuance, usage and clearing of bank and credit cards. The Law also governs the issuance and revocation of operating licences, the obligations of card issuers, and the penalties and obligations of card bearers.
• The Public Finance and Debt Management Law (Law No 4749 enacted in 2002; last amended by Law No 5335 enacted in 2005) establishes rules and procedures for domestic and foreign public debt management. Article 6, paragraph 4, of the Law authorises the Undersecretariat of the Treasury and the CBRT to regulate the issuance of government bonds and treasury bills in book entry form. All securities transfers under this Law are registered with the Electronic Securities Transfer and Settlement System (TIC-ESTS), which is the securities settlement system of the CBRT. The final settlement of the related payments is provided by the national Real-Time Gross Settlement System (TIC-RTGS).
• The Turkish Commercial Code (Law No 6762 enacted in 1956) defines in Articles 557–815 the form and usage of negotiable instruments, namely promissory notes, bills and cheques, which are used widely for commercial payments.
• The rules and procedures governing participation in TIC-RTGS and TIC-ESTS are governed by a special agreement between the CBRT and participating banks. The banks sign a participation contract with the CBRT agreeing to comply with the provisions of the TIC-RTGS & ESTS Operational Rules. These rules define the relationship between the CBRT and the participating banks and between the participants concerning the services provided by TIC-RTGS and TIC-ESTS. In particular, they specify the roles of the various parties involved in the system. The operational procedures, rights, obligations and a clause stipulating arbitration as a means of dispute resolution are also governed by these rules.
1.1.3 The role of financial intermediaries As of the third quarter of 2006, the financial sector in Turkey comprised 50 banks, 77 leasing companies, 87 factoring companies, 45 insurance companies and nine consumer finance companies, along with 286 mutual funds, 30 investment companies, 106 securities brokerage firms and 11 pension companies (102 pension funds). However, as seen in Graph 1, banks dominate the financial system, and as of September 2006 87.8% of financial sector assets consisted of bank assets. As of the same date, the ratio of total bank assets to GDP stood at 86.5%. Compared to EU countries, the Turkish banking system is still small and has the potential to grow much further.
Prior to the Banks Law (Law No 4389 enacted in 1999; annulled by the Banking Law No 5411 enacted in 2005), the Undersecretariat of the Treasury and the CBRT jointly supervised the banks. While the CBRT was mainly involved in off-site supervision, the Treasury carried out on-site supervision and regulation. The Banks Law established the BRSA as the sole regulatory and supervisory body for the Turkish banking sector. With the establishment of the BRSA, the Savings Deposits Insurance Fund (SDIF), which had operated under the CBRT, was restructured under the BRSA. Finally, in December 2003, the SDIF became an autonomous body.
Leasing, factoring and consumer finance companies began to be supervised and regulated by the BRSA in 2006. Previously, these institutions were supervised by the Treasury. Insurance companies continue to be supervised and regulated by the Treasury. The CMB supervises capital market institutions and activities.

CPSS – Payment systems in Turkey, 2007 5
Graph 1
Share in financial assets September 2006
3.1 1.7 0.10.40.40.50.60.9
87.8
4.40
102030405060708090
100Ba
nks
(Incl
udin
g Pa
rtici
patio
nBa
nks)
1
Mut
ual F
unds
1
Insu
ranc
e C
ompa
nies
2
Leas
ing
Com
pani
es2
Fact
orin
g C
ompa
nies
2
Con
sum
er F
inan
ceC
ompa
nies
2
Secu
ritie
s Br
oker
age
Firm
s1
Rea
l Est
ate
Inve
stm
ent
Com
pani
es1
Pens
ion
Fund
s1
Inve
stm
ent C
ompa
nies
1
%
1 Data as of September 2006. 2 Data as of June 2006.
Sources: CBRT; BRSA, CMB, Treasury, Turkish Brokerage Firms Association.
1.1.3.1 Banks
Banks in Turkey are established as joint stock companies and are subject to the provisions of the Banking Law. In line with the criteria set forth in this Law, a bank established abroad may also operate in Turkey by opening a branch. There is no distinction between foreign and Turkish banks in terms of the regulatory and supervisory framework. Banks’ paid-up capital should not be less than TRY 30 million.
Banks in Turkey are grouped into deposit banks, investment and development banks, and participation banks. As of January 2007, there were 33 deposit banks (three public, 15 private and 15 foreign banks), 13 development and investment banks (three public, eight private and two foreign banks), and four participation banks. The total number of branches of all banks, including participation banks, was 7,304 and the total number of personnel was 150,851.
All types of deposit banks – private, public or foreign – perform traditional banking operations such as deposit-taking, payment services, foreign exchange operations and marketing of securities and other financial products. However, deposit banks are not allowed to provide financial leasing activities. Deposit banks, with a nationwide branch network, provide most of the payment services. Sight deposits are mostly used for funds transfers. Banks offer cheque and card facilities for account holders. Deposit banks are members of the national RTGS system and interbank clearing houses (ICHs).
Most banks have largely computerised their operations. Internet banking services are offered by all commercial banks. These services include a variety of technology-intensive applications such as online credit transfers, online investment accounts, trading of government bonds, mutual funds and equities. Many banks offer customers a real-time funds transfer service through TIC-RTGS.
1
1 2 2 2
2
1
1 11
1
1 2 2 2
2
1
1 11

6 CPSS – Payment systems in Turkey, 2007
The development and investment banks carry out all banking operations apart from deposit-taking. They provide investment advisory services and consultancy on transfer and merger issues, financial restructuring and efficient management practices in commercial enterprises. They also grant credits from their own funds and other funds under their management; they can offer cheque accounts and participate in ICH clearing. Development and investment banks’ total paid-in capital may not be less than two-thirds of that stipulated for other banks (ie TRY 20 million).
Participation banks (formerly known as special finance houses, or SFHs) operate pursuant to the Banking Law. Similar to deposit banks, they can collect deposits in Turkish liras and in foreign currency. However, they operate on profit and loss sharing principles and do not pay interest on deposits.
Participation banks provide payment services and cheque and card facilities and participate in clearing and settlement in the same manner as other banks. In contrast to deposit banks, participation banks are allowed to engage in leasing activities along with development and investment banks. Currently, there are four participation banks in Turkey and their share in the total financial system is around 2%.
Following the 2000–01 crisis period, a restructuring programme was initiated by the BRSA, based on four pillars: restructuring of state banks, resolution of the banks managed and controlled by the SDIF, strengthening of private banks and strengthening of the regulatory and supervisory framework. As a result, the banking sector entered into a consolidation process, the share and burden of state-owned or SDIF-controlled banks have declined, fragilities in the banking sector have diminished and the supervisory and regulatory framework has been upgraded to international standards and become more risk-focused. The increased soundness of the banking system as a result of this rehabilitation process is well demonstrated by the increasing interest shown by major foreign banks in Turkish banks. As of November 2006, the share of non-residents in the Turkish banking system has reached 20.2% in terms of banking sector assets.
1.1.3.2 The Post Office
The Post Office (the General Directorate of Posts, which comes under the Ministry of Transportation) plays a significant role in providing payment and remittance services to customers all over Turkey. At end-2006, there were 3,049 Post Office branches that handle remittances. The Post Office offers cheque accounts and money order services. The money order facility can be used for remitting money all over the country and beneficiaries are not required to have an account with the Post Office. In 2006, 24.5 million domestic money orders worth TRY 22 billion were processed by the Post Office. In addition to these services, Post Office branches can issue domestic traveller’s cheques, change foreign currency and receive postal money orders from abroad.
1.2 The role of the CBRT The CBRT was established in 1930 under the Central Bank Law (Law No 1715). In 1970, the Law on the Central Bank of the Republic of Turkey (CBRT Law) (Law No 1211) was enacted. This Law introduced considerable changes in central banking and the central bank’s responsibilities for managing and controlling currency circulation. To allow the CBRT to better fulfil its functions, the Law was amended several times between 1970 and 2001. With the last amendment in 2001, the primary objective of the CBRT was clearly set as achieving and maintaining price stability, and the CBRT was given direct authority to formulate monetary policy and to choose monetary instruments at its own discretion in order to achieve its primary objective. The CBRT has exclusive power and responsibility for designing and implementing its monetary policy.

CPSS – Payment systems in Turkey, 2007 7
The central bank’s head office is in Ankara. The CBRT has 21 branches in Turkey and four representative offices abroad, in Frankfurt, London, New York and Tokyo.
1.2.1 General responsibilities The CBRT determines monetary policy and the monetary instruments needed to achieve and maintain price stability. The CBRT Law sets out the fundamental duties and powers of the CBRT as follows:
• to take necessary measures jointly with the government to protect the domestic and international value of the national currency and to establish the exchange rate policy for determining the parity of the Turkish lira against gold and foreign currencies; to execute transactions, such as spot and forward purchases and sales of foreign currency, foreign exchange swaps and other derivatives transactions, in order to determine the value of the Turkish lira against other currencies;
• to regulate the volume and circulation of the Turkish lira;
• to establish payment, securities transfer and settlement systems, to enact regulations to ensure the uninterrupted operation and oversight of the existing or future systems, and to determine the methods and instruments, including the electronic environment for payments;
• to carry out open market operations;
• to conduct rediscount and advance transactions;
• to manage gold and foreign exchange reserves;
• to take precautions to enhance stability in the financial system and to adopt regulatory measures with respect to money and foreign exchange markets;
• to issue banknotes in Turkey, under the exclusive right and privilege given to it;
• to utilise the monetary policy instruments described in the Law and to identify and implement other monetary policy instruments directly when it so deems appropriate;
• as the lender of last resort, to carry out credit operations with the banks.
1.2.2 Administration of accounts The Treasury, banks, exchange offices, public entities (state-owned economic enterprises, ministries) and international organisations (IMF, World Bank, Asian Development Bank) hold accounts with the CBRT. Accounts, with the exception of reserve requirement accounts,1 do not bear interest, and are used for funds transfers between the account holders, including settlement of obligations arising from interbank clearing systems. Banks hold giro accounts, reserve requirement accounts and TIC-RTGS accounts. Giro accounts are mostly used for cash withdrawal. The funds maintained in giro accounts are usually a small portion of the total bank funds deposited with the CBRT. A separate account, the TIC-RTGS account, is used for payments routed through TIC-RTGS. Although banks’ reserve requirement accounts are separate from their settlement accounts, the balance of the former is transferred to the latter at the beginning of each day for settlement purposes.
Accounts are decentralised and the account holders may have accounts with more than one branch of the CBRT. These accounts are controlled exclusively by their holders and debits from them may be made only on the holders’ instructions.
1 Since August 2001, reserve requirement accounts have borne interest.

8 CPSS – Payment systems in Turkey, 2007
1.2.3 Payment systems oversight According to the CBRT Law, the CBRT is responsible for the oversight of payment systems in Turkey. The Law stipulates the fundamental duties and powers of the central bank, including:
“… to regulate the volume and circulation of the Turkish lira, to establish payment, securities transfer and settlement systems, to enact regulations to ensure the uninterrupted operation and oversight of the existing or future systems, and to determine the methods and instruments, including the electronic environment for payments.”
Consistent with the CBRT Law, the objectives and policies of the CBRT in the payment systems area are defined as follows:
• to make the necessary arrangements to ensure the smooth, reliable and efficient functioning of payment systems and to mitigate the possible risks involved in payment systems;
• to determine the appropriate tools and procedures for payments;
• to make the necessary arrangements to effectively apply monetary policy designed to ensure financial and monetary stability;
• to ensure public confidence in payment and securities transfer systems;
• to continuously monitor system compliance with the Core Principles for Systemically Important Payment Systems (Core Principles for SIPS)2 in order to prevent the systemic risks that can arise from payment systems;
• to monitor developments that can affect the effectiveness and reliability of the systems; and
• to coordinate its work with other supervisory authorities and system participants.
The CBRT has disclosed its major objectives and policies concerning payment systems to the public both on its website (www.tcmb.gov.tr) and in its publications.
Since its first day of operation, the CBRT has used various instruments in the performance of its oversight function for TIC-RTGS: issuance of regulations, moral suasion vis-à-vis the participants, direct provision of payment services (as the owner and operator of the system) and application of sanctions (as described in the TIC-RTGS and ESTS Operational Rules).
In line with the development of the payment system oversight concept, the CBRT has recently attempted to restructure and formalise its payment system oversight role.
1.2.4 Activities in the area of securities clearing and settlement systems The CBRT is the owner, operator and overseer of TIC-ESTS, the Electronic Securities Transfer and Settlement System. The TIC-ESTS system, which began operating in October 2000, has a real-time connection to TIC-RTGS and is used for the issuance and settlement of short- and medium-term debt instruments on behalf of the Treasury (see Section 4.3.3 for details).
2 See Committee on Payment and Settlement Systems, Core Principles for systemically important payment
systems, Basel, 2001.
CPSS – Payment systems in Turkey, 2007 9
1.2.5 The operational role of the CBRT The CBRT is the operator of TIC-RTGS and TIC-ESTS. The details of its operational role are described in Section 5.1.1.
1.2.6 Cooperation with other institutions Cooperation between the CBRT and other authorities is based on mutual understanding. For example, the CBRT has cooperated with the CMB on the project for safekeeping of customer securities under the customer’s name in the Central Registry Agency (see Sections 1.3.5 and 4.3.3.3). Similarly, the CBRT cooperated closely with the Undersecretariat of the Treasury on the project for the improvement of public payments processing.
The CBRT is entitled to receive financial information from financial institutions, including the BRSA, pursuant to the CBRT Law. Moreover, in August 2000, the CBRT, the Undersecretariat of the Treasury and the BRSA signed a memorandum of understanding on information sharing in the financial sector.
1.3 The role of other private and public sector bodies 1.3.1 Banks Association of Turkey The Banks Association of Turkey (BAT) was founded in 1958 under Article 57 of the Banks Law3 (Law No 7129 enacted in 1958). Its duties and powers have been revised in the new Banking Law (Law No 5411 enacted in 2005). A professional organisation, the BAT is a legal entity with the status of a public institution, and it is the representative body for all banks operating in Turkey with the exception of the participation banks.
According to its statute, the purpose of the BAT is to: preserve the rights and interests of banks; carry out studies aimed at enhancing the growth and robust operation of the banking sector, the development of the banking profession and the strengthening of competitiveness; adopt and implement all measures necessary for the prevention of unfair competition; and ensure implementation of these measures in line with the principles of open market economies and perfect competition and with the regulations, principles and rules of the banking industry. All deposit, investment and development banks operating in Turkey are legally bound to become members of the BAT. Each bank is represented in the Association by its chairperson, managing director or general manager.
The BAT is responsible for:
• ensuring the development of the banking profession;
• ensuring that banks function in a prudent and well disciplined manner as required by the Association and the banking profession in order to meet the needs of the national economy;
• adopting and implementing all measures necessary for the prevention of unfair competition among banks;
• determining the principles and conditions to be respected by banks, based on approval by the Banking Regulation and Supervision Agency.
The BAT monitors implementation of the decisions taken pursuant to the applicable legislation and measures required by the Agency. The organisational structure of the Association consists of the General Assembly, the Board of Directors, the Secretariat
3 The Banking Law (Law No 5411) superseded the Banks Law in 2005.

10 CPSS – Payment systems in Turkey, 2007
General and the Auditors. The operations of the Association are executed through several structural and functional groups.
1.3.2 Participation Banks Association of Turkey The Participation Banks Association of Turkey (TKBB) was founded in 2005 under Articles 79–81 of the Banking Law (Law No 5411). Like the BAT, the TKBB is an institutional association whose members are participation banks (see Section 1.1.3.1). The status of the TKBB was defined by the Participation Banks Association Decree of the Council of Ministers (No 2006/10018).
1.3.3 Istanbul Stock Exchange (ISE) The ISE, which began operation in 1986, is the only securities exchange in Turkey. It is a public institution regulated by the CMB. Government bonds, treasury bills, CBRT liquidity bills, capital market instruments, share income certificates and international securities are traded on the ISE.
The bonds and bills market is the only organised, fully automated market for both outright purchases and sales and repurchase/reverse repurchase transactions with fixed income securities. The market’s purpose is to provide a transparent, liquid, competitive and efficient environment for the secondary market of government bonds, treasury bills, revenue-sharing certificates, bonds issued by the Privatisation Administration and corporate bonds listed on the ISE. Treasury bills and government bonds are the most actively traded instruments. The bonds and bills market was established in June 1991, while repo/reverse repo transactions began in February 1993.
1.3.4 ISE Settlement and Custody Bank, Inc (Takasbank) Takasbank is the clearing and settlement institution of the ISE, the clearing house for the Turkish Derivatives Exchange, the official custodian for investment and pension funds, and the national numbering agency for securities issued in Turkey.
Takasbank is also a specialised bank dedicated to securities services in Turkey. It serves the financial markets in the capacity of a non-deposit-taking bank. In relation to banking services, Takasbank is regulated by the BRSA. With respect to clearing and settlement functions, Takasbank is regulated by the CMB and the ISE.
Takasbank was originally set up as a department of the ISE in 1988, with responsibility for settlement and custody. In 1991 it became an independent organisation and in 1996 it was converted into a bank. As a specialised bank, Takasbank provides ISE members with money market facilities. It offers short-term loans to capital market players through securities purchasing loans (cash credits) and ensures that money market transactions between banks and brokerage houses are carried out in a transparent, fast and reliable environment.
Takasbank, which is a participant in TIC-RTGS and ESTS, provides ISE members with indirect access to the system through an interface called TETS (Takasbank Electronic Transfer System). TETS enables brokerage houses to transfer both cash and government bonds and bills in and out of the Takasbank system electronically, through a real-time connection with the central bank’s TIC-RTGS and ESTS, and receive reports related to these transactions. Through TETS, brokerage houses can participate in treasury auctions, provide collateral for bids, and make other payments quickly and in a cost-effective manner.
Takasbank has giro and TIC-RTGS accounts at the CBRT. Payments in connection with securities transactions between Takasbank members are settled net in the Takasbank accounts (see Sections 3.3 and 4).

CPSS – Payment systems in Turkey, 2007 11
Takasbank also provides custody services for the portfolio assets of mutual funds and investment trusts and assumes various responsibilities regarding private pension funds (introduced in 2003 in the context of the private pension savings and investment system). The Bank also carries out custody, settlement and other related operations of pension fund transactions in capital markets.
Takasbank has a correspondent relationship with Euroclear Bank. In this capacity, Takasbank provides international settlement and custody services for foreign securities such as eurobonds, foreign bonds, depository receipts, etc. With these services, Takasbank has taken its expertise in clearing, settlement and custody services abroad, aiming to make post-trade services accessible to all financial institutions in terms of technical expertise, operational experience and cost. At end-2006, there were 74 institutions receiving international securities correspondent services from Takasbank.
Takasbank carries out settlement of securities trade in all ISE markets. The bank clears ISE trades in the Takasbank Clearing System (see Sections 3.3 and 4.1.2.2) by multilateral netting and settles accordingly. Payments are settled on a “delivery versus payment” (DVP) principle; the members do not get their receivables unless they fulfil their obligations. In case of partial fulfilment of an obligation, proportional payment or transfer out of the receivable is made to the member. Net obligations are legally binding, but Takasbank does not guarantee settlement.
The Securities lending and borrowing market (SLBM) was established in November 2005 to minimise potential defaults in the market. The SLBM provides an organised market environment for borrowing share certificates and exchange-traded fund certificates for a certain period against collateral as determined by Takasbank and approved by the CMB.
1.3.5 Central Registry Agency The Central Registry Agency (CRA) registers capital market instruments and rights related to them in book entry form. The CRA is a private company established in 2001 as a legal entity under the provisions of the Capital Markets Law and is regulated by the CMB. The CRA keeps records in electronic format with respect to issuers, intermediary institutions and owners of rights. The CMB can determine the rights to be recorded and the types of related capital market instruments.
The Central Dematerialisation System was put into operation in November 2005. The CRA took over central securities depository functions for equities upon completion of the dematerialisation system. All equities are registered as dematerialised shares in the Central Dematerialisation System. Clients’ safekeeping accounts were transferred from Takasbank to the CRA and book entry records were automatically registered by the CRA in line with the dematerialisation process and recorded at the beneficial owner level. Takasbank currently has a 65% stake in the share capital of the CRA. Takasbank will maintain its functions as the clearing and settlement institution for the Istanbul Stock Exchange, providing the omnibus account with the CRA for securities settlement purposes. The CRA and Takasbank systems will be interlinked in real time so calculated securities transfers will be reflected in the CRA instantaneously. Real-time gross DVP “member-to-member” settlement will continue to be executed via Takasbank.
2. Payment media used by non-banks
2.1 Cash payments Cash is the dominant retail payment medium in Turkey, although in recent years there has been a growing tendency to use alternative payment methods. No exact figures are available

12 CPSS – Payment systems in Turkey, 2007
for cash payments but households mostly use cash for their everyday payment requirements. However, the use of cash to pay wages, salaries and pensions is declining as an increasing proportion of such payments are being made by credit transfer.
The CBRT is the sole issuing authority for banknotes with the status of legal tender. As of 1 January 2005, six zeros were removed from the Turkish lira (TRL) and the currency was renamed as the new Turkish lira4 (TRY). The subunit, which is one 100th of a new Turkish lira, is called the new kurus (Ykr). Banknotes are issued in denominations of TRY 1, 5, 10, 20, 50 and 100. The TRY 50 note has the largest share of the currency in circulation. Coins are issued by the Undersecretariat of the Treasury in six denominations: 1, 5, 10, 25 and 50 new kurus (Ykr) and 1 new Turkish lira.
TRL banknotes and coins were withdrawn from circulation at the beginning of 2006. However, as from 1 January 2006, they will be converted into TRY at the CBRT and T.C. Ziraat Bank branches for a period of 10 years for banknotes and one year for coins.
As of September 2006, total banknotes and coins in circulation amounted to TRY 23.9 billion. The share of cash in M1 (52.5% in 2006) illustrates the dominance of cash payments in Turkey. Cash withdrawals are made mainly from bank branches or cash dispensers. Banks encourage the use of ATMs for cash withdrawals and their usage is increasing. Some banks share their ATM networks and this has allowed small banks to offer ATM facilities to their customers.
2.2 Non-cash payments
2.2.1 Paper-based payments Traditionally, cheques and promissory notes were the commonly used non-cash payment instruments. However, in recent years other payment methods, notably electronic and card-based instruments, have increasingly supplanted the paper-based instruments.
2.2.2 Cheques The Turkish Commercial Code and the Cheque Law govern all aspects of cheque payments and provide the framework for issuance, acceptance and payment of cheques. Banks provide a cheque account facility to their customers in accordance with the Cheque Law. The bank of issue pays the cheques directly or through clearing houses when other banks present them. Cheques are free of collection charges for both the drawer and the payee. However, if a cheque is paid by a branch other than the branch where the account is maintained, an authorisation charge is usually levied.
To facilitate electronic processing, cheques are coded with MICR (magnetic ink character recognition) code in E13B format.
Traveller’s cheques are issued by banks and are not accepted for interbank clearing. Banks collect traveller’s cheques and send them directly to the branch of the paying bank for payment. In 2006, clearing houses processed 23.6 million cheques with a total value of TRY 186.9 billion.
4 The word “new” will be dropped from the name of the currency at the end of a transition period, the end date
of which will be decided by the Council of Ministers. Hence, the text refers to the currency simply as Turkish lira, unless a value is specified.
CPSS – Payment systems in Turkey, 2007 13
2.2.3 Postal cheques The Post Office provides postal cheque account facilities to any firm or individual. These accounts do not pay interest but are free of any commission charges for operations conducted through them. Postal cheque accounts are used mostly by public institutions for collecting various types of tax and by companies for receiving payment instalments.
In 2006, there were over 692,000 postal cheque accounts, and 10.2 million postal cheques were processed, for a total value of TRY 15.6 billion.
2.2.4 Promissory notes Promissory notes are defined in the Turkish Commercial Code. They are widely used like cheques in the small and medium-sized business sector. They do not contain any bank information. They are signed by the two parties and indicate the amount to be paid and the value date. The beneficiary may obtain funds before the value date by having the promissory note discounted by a bank.
2.2.5 Credit transfers Credit transfers are an increasingly popular means of transferring funds among customers. To make such transfers, customers are required to maintain sight deposits, which carry a low rate of interest.
There are two categories of credit transfer: (1) credits to other account holders with any bank; (2) credits to non-account holders. The first is an ordinary credit transfer operation between two accounts. The account holder gives a written transfer order, which is carried out if there are enough funds in the account. The second category of credit transfer enables funds to be sent to a beneficiary who does not maintain an account with any bank. In this case, the customer making the payment specifies the name of the beneficiary, the address and the bank/branch where the payment is to be made. When the transfer reaches the counterpart bank/branch, the beneficiary is notified of the remittance and can go to the branch and withdraw the money.
All interbank and intrabank credit transfers are processed electronically. Most branches receive credit transfer instructions from customers in written form and these are sent electronically to the final destination. Most banks also provide a credit transfer facility via ATMs, the internet or telephone.
Bank customers can issue standing orders for regular payments that are executed automatically on specified dates. The Post Office also provides credit transfer facilities to its account holders.
In 2006, 142.3 million credit transfers5 were executed, up by 36.2% from 2004, with 94.2 million being processed via TIC-RTGS, 24.5 million via the Post Office and 23.6 million via the BTOM (interbank cheque clearing houses centre).
2.2.6 Payment cards 2.2.6.1 Credit cards
Credit cards offer a cashless payment medium combined with a revolving credit and cash advance facility. In recent years, many banks have also introduced a facility for paying back
5 Interbank transfers only; data on intrabank transfers are not available. The Post Office figure covers only
domestic transfers. For postal cheque transactions and international transfers by the Post Office, see Sections 2.2.3 and 3.5.3, respectively.
14 CPSS – Payment systems in Turkey, 2007
credit card transactions in instalments without incurring any interest charges. These features have made credit cards very popular and their numbers are steadily rising. Cardholders are charged an annual subscription fee while the merchants pay a commission to the acquirer.
Credit cards were first introduced in 1968, but their growth began in the early 1990s. In the last decade the number of credit cards provided to customers by banks and financial institutions has risen strongly. By the end of 2006, the total number of credit cards issued in Turkey reached 32.4 million, an increase of 63.3% since end-2003. In 2006, the total number of transactions inside and outside Turkey using cards issued in Turkey was 1.34 billion, for a total value of TRY 108.4 billion.
Turkey launched the chip and PIN method (PIN entrance and offline PIN validation for chip credit card purchases) on 31 March 2006, the third country in Europe to do so. The chip and PIN is a new payment method minimising the risk of credit card fraud by preventing counterfeit and lost or stolen card usage. End-2006 figures show that 91% of POS terminals and 82% of credit cards in the market are EMV-compliant. In a recent development, the Interbank Card Centre (BKM) has prepared local regulations for cash withdrawal with credit cards at the point of sale.
2.2.6.2 Debit cards
Debit cards are typically used to withdraw cash and to send remittances by debiting the holder’s account at ATMs. Since 1994, they may also be used for retail purchases direct from the current account via POS terminals at merchant establishments. To create awareness on debit card use at the point of sale, the Interbank Card Centre (BKM) launched an advertising campaign beginning in October 2004, with the aim of generalising the use of debit cards and convincing cardholders to use debit cards instead of cash when shopping. As a result, the total volume and value of such purchases increased by about 140% in two years, and reached 50 million transactions with a total value of TRY 1.52 billion in 2006. The BKM continued this effort in subsequent years and will continue in the upcoming years to promote debit card usage at the point of sale.
At the end of 2006, the total number of debit cards was 53.5 million. At end-2006, 1,282,658 POS terminals that accept debit cards were available at 840,059 merchant establishments, including department stores, supermarkets, petrol stations, numerous retailers covering such sectors as clothing and luxury goods, food, electronics, drugs and sanitary products, furniture, car rentals, etc.
The latest development in debit card services consists of allowing consumers to withdraw cash at selected retail stores through POS terminals. This “cashpoint” service, which was introduced by a major bank in January 2006, resembles a cash-back transaction, yet it does not require the consumer to purchase any item at the retail store. The service is free of charge and, as of June 2006, was available at 217 points.
Furthermore, in March 2006, the BKM prepared the infrastructure and the local regulations that allow all applicant member banks to provide a cash withdrawal service on a debit card purchase transaction (“cash-back”) at the point of sale.
2.2.6.3 Prepaid cards
The most frequently used prepaid cards are disposable phone cards issued by Turkish Telekom for making calls from public telephones, reloadable cellular phone cards issued by GSM operators, reloadable payment cards used at ticket gates of toll roads, and reloadable public transportation tickets issued by municipalities (see also Section 3.4.3).
The municipalities of some cities, including Istanbul and Izmir, are providing reloadable public transportation tokens and cards for travel on the metro, boats, buses and trams, as well as the natural gas and water utilities.
CPSS – Payment systems in Turkey, 2007 15
In 2006, TRY 107.1 million worth of phone cards were sold, while the total value reloaded on transportation cards issued by the municipalities of eight cities6 was over TRY 809 million.
2.2.7 ATMs and POS terminals The first ATM service in Turkey started in December 1987. Since then, ATMs have continually increased in number. At end-2006, there were a total of 16,511 ATMs installed in Turkey, representing a rise of 11.4% over 2005. ATMs allow consumers to check their current account balance, withdraw cash, initiate credit transfers, pay bills or credit card debts, access their investment accounts and generate transactions themselves. In addition, some banks have begun to operate advanced ATMs that allow consumers to deposit cash, which becomes instantly available in their current account. A major bank also allows withdrawals in foreign currencies through a limited number of ATMs, typically located in tourist areas.
BKM member banks have made significant investments in the payments infrastructure by installing POS terminals that authorise and record transactions at merchant outlets. At end-2006 there were 1.3 million POS terminals, an increase of 12.4% over 2005.
2.2.8 Other access channels for banking and payments 2.2.8.1 Telephone banking
Since the introduction of telephone banking in 1991, the range of phone banking services has increased. Besides being able to transfer funds and conduct account balance enquiries over the telephone, bank customers can also pay bills or credit card balances, trade mutual funds or stocks, and set up a time deposit.
2.2.8.2 Internet banking
The growth and spread of internet banking services has been unexpectedly high, reflecting a high degree of public acceptance. First introduced in 1997, internet banking is now provided by all deposit banks. This facility allows consumers to conduct account balance enquiries, transfer funds (including transfers to third-party accounts with other banks), trade mutual funds or stocks, apply for loans, pay credit card balances or bills, and trade or transfer foreign exchange. In addition, other services, such as operations related to insurance and pension funds, are increasingly available via internet banking.
2.2.8.3 Mobile banking
Since 2000, bank customers have been able to conduct banking transactions by means of GSM-based mobile phones. This feature, which was initiated for mobile phones with WAP-GPRS functionality, was extended to all types of phones after about a year. Using this channel, customers can do almost everything they can do via internet banking.
2.3 Recent developments In November 2004 a major bank introduced a new facility to transfer funds via mobile phones. This was followed by a similar facility from another major bank in September 2005. These facilities allow a customer to enter a funds transfer order via his or her mobile phone by specifying the amount and the phone number of the recipient. The latter receives an SMS message indicating the receipt of the transfer and a four-digit code, to be used at an ATM to withdraw the money transferred without needing a card.
6 In 2006, reIoadable transportation tokens were available in Istanbul, Izmir, Manisa, Denizli, Adana, Kocaeli,
Çanakkale and Bandirma.
16 CPSS – Payment systems in Turkey, 2007
3. Interbank exchange and settlement systems
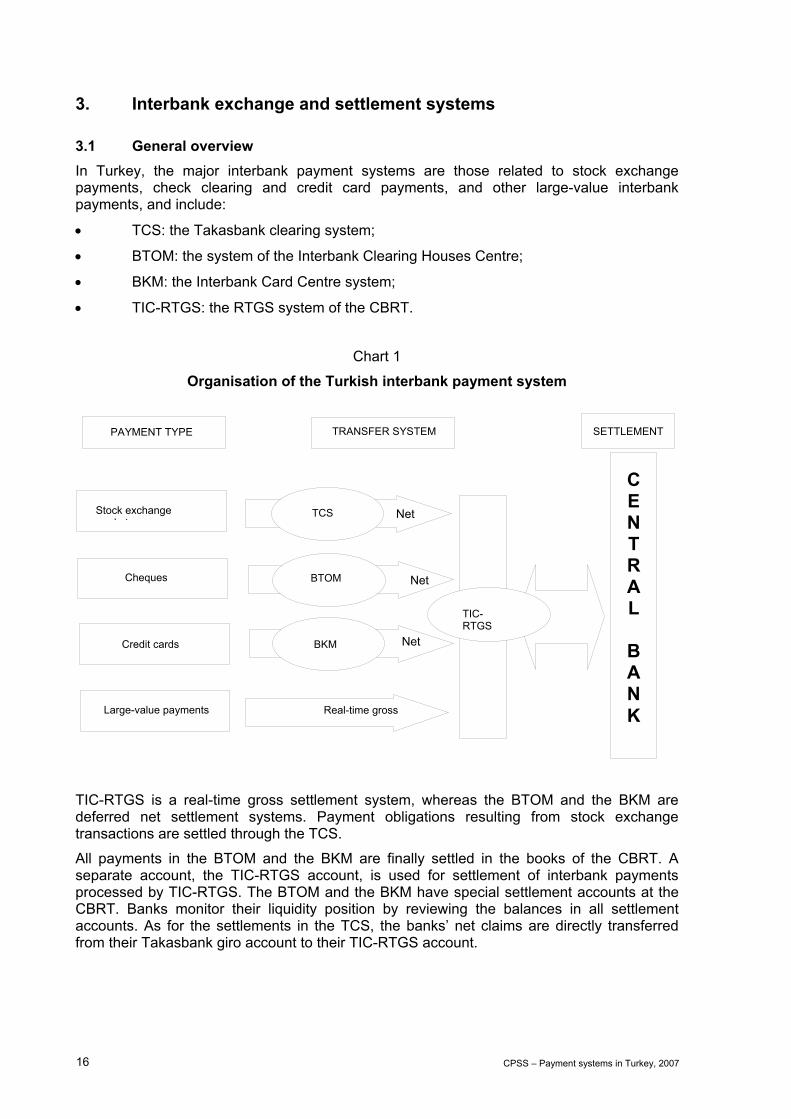
3.1 General overview In Turkey, the major interbank payment systems are those related to stock exchange payments, check clearing and credit card payments, and other large-value interbank payments, and include:
• TCS: the Takasbank clearing system;
• BTOM: the system of the Interbank Clearing Houses Centre;
• BKM: the Interbank Card Centre system;
• TIC-RTGS: the RTGS system of the CBRT.
Chart 1
Organisation of the Turkish interbank payment system
TIC-RTGS is a real-time gross settlement system, whereas the BTOM and the BKM are deferred net settlement systems. Payment obligations resulting from stock exchange transactions are settled through the TCS.
All payments in the BTOM and the BKM are finally settled in the books of the CBRT. A separate account, the TIC-RTGS account, is used for settlement of interbank payments processed by TIC-RTGS. The BTOM and the BKM have special settlement accounts at the CBRT. Banks monitor their liquidity position by reviewing the balances in all settlement accounts. As for the settlements in the TCS, the banks’ net claims are directly transferred from their Takasbank giro account to their TIC-RTGS account.
Credit cards
PAYMENT TYPE TRANSFER SYSTEM
Large-value payments
C E N T R A L
B A N K
Cheques
SETTLEMENT
Stock exchange k t
TCS Net
NetBTOM
TIC-RTGS
Real-time gross
NetBKM

CPSS – Payment systems in Turkey, 2007 17
3.2 The real-time gross settlement system TIC-RTGS is the real-time gross settlement system of Turkey. The system is owned and operated by the CBRT. The CBRT developed TIC-RTGS between October 1989 and March 1992 and put it into live operation in April 1992.
Driven by the changing demands of the banking sector and developments both in the payment systems area and in technology, a project was started in 1997 to develop the second generation of the system, which began operating in April 2000.
The second-generation RTGS system introduced an emergency backup centre and many new features, including a central queuing mechanism, funds management facilities, a direct debiting operation, phased closure of operations, and message bulking for low-value payments.
The scope of the second-generation project also covered the development of an electronic securities transfer and settlement system, TIC-ESTS, which went live in October 2000 (see Section 4.3.3).
TIC-RTGS and TIC-ESTS work in an integrated manner. Participant banks access them using a single interface, called SWITCH (a message switching system). TIC-RTGS and TIC-ESTS are directly connected to SWITCH through a proprietary network (TICNET).
Owing to their integration and common interface, TIC-RTGS and TIC-ESTS are usually regarded as a single system, which is referred to as TIC-RTGS and ESTS.
3.2.1 Operating rules The CBRT Law, as amended in April 2001, defines the central bank’s duties and responsibilities with respect to payment systems. The law authorises the CBRT to establish payment systems, determine the procedures and conditions of payment methods and instruments, and draw up regulations for ensuring their smooth operation.
The operational procedures, rights and obligations of the CBRT, as the system operator, and the participants in the system are governed by private agreements. These are supported by procedures and rules documented in the TIC-RTGS and ESTS Operational Rules, TIC-RTGS and ESTS User Guide, TIC-RTGS and ESTS Disaster Recovery Guide, and the relevant CBRT circulars.
3.2.2 Participants in the system Any bank acting pursuant to the Banking Law may participate in TIC-RTGS and ESTS. The participants must be established in Turkey and maintain giro accounts with the CBRT. It is not obligatory for all banks to participate in TIC-RTGS and ESTS. Banks that do not participate in the system may access it through one of the participant banks. At end-2006, there were 48 participants in TIC-RTGS and ESTS, including the CBRT.
For ISE members that are not direct participants in TIC-RTGS and ESTS (eg brokerage houses), Takasbank (see Section 1.3.4) has developed a proprietary system called TETS through which brokerage houses can access TIC-RTGS and ESTS for cash and securities (government bonds and T-bills) transfer purposes.
3.2.3 Types of transactions handled The TIC-RTGS system is used for interbank payments in Turkish liras relating to interbank operations (eg money market and securities settlement transactions), final settlements of cheque and credit card operations, and customer payments.
Since TIC-RTGS works in an integrated manner with TIC-ESTS, settlement of the payment leg of all DVP operations is also carried out in TIC-RTGS.

18 CPSS – Payment systems in Turkey, 2007
The system provides facilities for the exchange of payment-related information messages between participants.
3.2.4 Operation of the system TIC-RTGS is based on a V-shaped architecture, where the entire message is sent to the TIC-RTGS Centre by the sending bank. A payment instruction embodied in the message is executed only if the sending bank has sufficient covering funds in its TIC-RTGS account. A successful execution of the payment instruction will result in transfer of the payment from the sending to the receiving bank across their TIC-RTGS accounts. The message is then forwarded in real time to the receiving bank.
Payments that cannot be settled because of insufficient funds are placed in a centralised payments queue. The queuing algorithm is first-in-first-out (FIFO) within priorities. TIC-RTGS has a gridlock resolution algorithm for queued payments (see Section 3.2.9.2).
The settlement in TIC-RTGS is final and irrevocable. If an operational error occurs, the parties involved must resolve it bilaterally. Participants can check their TIC-RTGS accounts at any time during the business day from their relay computers (see Section 3.2.6) and from the TIC-RTGS Centre. The participants may obtain a number of reports from their relay computers.
3.2.5 Operating hours A typical business day lasts about 21 hours. The system opens at 08:007 on Monday and on those days following official holidays. On every workday, the participants log on to the system by 09:00. The system closes at 17:30 on regular workdays and at 13:00 on half workdays.8
During the end-of-day procedure, the balances of TIC-RTGS settlement accounts are transferred to the participants’ CBRT accounts. The housekeeping process lasts around three hours and at about 20:30 the system opens to receive messages with the next business value date. On Fridays and on the eve of official holidays, however, the system remains closed until 08:00 on the next business day. TIC-RTGS is closed during weekends and official holidays; hence, it operates 252 days a year on average.
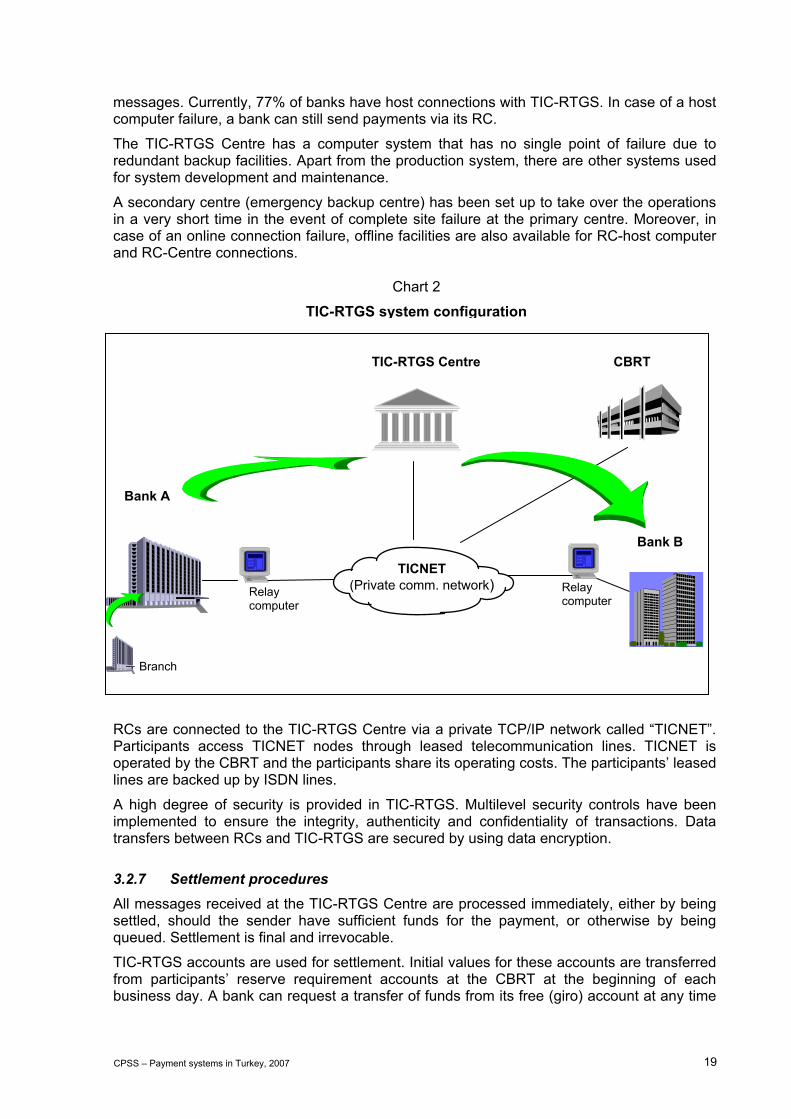
3.2.6 Transaction processing environment The TIC-RTGS system comprises a relay computer (RC) located on the participant’s premises, a proprietary communication network (TICNET), and a central computer system.
Every participant, including the CBRT, must have an RC to participate in TIC-RTGS. The RC system, which provides all the functionality needed by the participant, is a standard hardware and software configuration managed by the CBRT. The RC provides the participant with secure message entry, message verification, account enquiry, archiving and backup facilities. The RC has a mirror copy of the central computer’s reserve balances for each participant. This obviates the need for a query system on the central computer. The central bank’s RC has some additional facilities. The participant’s primary RC can be backed up online to a secondary RC in case of primary RC failure.
A participant’s host computer can be integrated into TIC-RTGS through a connection to the RC. In this way, a host terminal at a bank branch can be used to generate payment
7 Turkey’s time zone is CET + 1. 8 For the National Day (29 October) and two religious holidays (Bairams), the preceding day is officially a half
workday.
CPSS – Payment systems in Turkey, 2007 19
messages. Currently, 77% of banks have host connections with TIC-RTGS. In case of a host computer failure, a bank can still send payments via its RC.
The TIC-RTGS Centre has a computer system that has no single point of failure due to redundant backup facilities. Apart from the production system, there are other systems used for system development and maintenance.
A secondary centre (emergency backup centre) has been set up to take over the operations in a very short time in the event of complete site failure at the primary centre. Moreover, in case of an online connection failure, offline facilities are also available for RC-host computer and RC-Centre connections.
Error!
RCs are connected to the TIC-RTGS Centre via a private TCP/IP network called “TICNET”. Participants access TICNET nodes through leased telecommunication lines. TICNET is operated by the CBRT and the participants share its operating costs. The participants’ leased lines are backed up by ISDN lines.
A high degree of security is provided in TIC-RTGS. Multilevel security controls have been implemented to ensure the integrity, authenticity and confidentiality of transactions. Data transfers between RCs and TIC-RTGS are secured by using data encryption.
3.2.7 Settlement procedures All messages received at the TIC-RTGS Centre are processed immediately, either by being settled, should the sender have sufficient funds for the payment, or otherwise by being queued. Settlement is final and irrevocable.
TIC-RTGS accounts are used for settlement. Initial values for these accounts are transferred from participants’ reserve requirement accounts at the CBRT at the beginning of each business day. A bank can request a transfer of funds from its free (giro) account at any time
Bank A
Relay computer
Branch
Bank B
CBRT TIC-RTGS Centre
TICNET (Private comm. network) Relay
computer
Chart 2
TIC-RTGS system configuration

20 CPSS – Payment systems in Turkey, 2007
during the business day. At the end of the day, the balances in the TIC-RTGS accounts are transferred back to the participants’ reserve requirement accounts at the CBRT.
Funds are made available to the recipient bank immediately after settlement in the TIC-RTGS account. The TIC-RTGS and ESTS Operational Rules recommend that customer accounts be credited the same day.
In order to help settle as many payments as possible, the gridlock resolution algorithm (see Section 3.2.9.2) is manually run before the end of the day. Moreover, all funds reservations (see Section 3.2.9.2) are released upon the End-of-Day Announcement, a message issued by TIC-RTGS Centre five minutes before system closure. Any payments that remain unsettled are cancelled by the end-of-day procedure.
3.2.8 Pricing policies There is no entrance fee or annual fee for TIC-RTGS and ESTS participants. The CBRT charges a transaction fee in order to recover the long-term operational cost and the investment cost of setting up the system. Fees are based on the value of the transaction and charged to the sending participant.
TIC-RTGS & ESTS pricing structure, 20061
Up to TRY 4,000 (USD 2,837)
TRY 0.10 (USD 0.07)
TRY 4,000–420,000 (USD 4,785–297,872)
0.000025 × payment amount (USD 0.07–7.45)
Over TRY 420,000 (USD 296,296)
TRY 10.50 (USD 7.45)
Non-payment transaction TRY 0.10 (USD 0.07)
1 The USD exchange rate at end-2006 was TRY 1.41.
In addition to the transaction fees, there are communication network-related expenses, which are shared equally by all participants. The BAT coordinates maintenance and expense sharing for the RCs and network support.
3.2.9 Risks and risk management in TIC-RTGS 3.2.9.1 Credit risk
In TIC-RTGS, payment instructions are executed only if there are sufficient funds in the participant’s TIC-RTGS account. There is thus no credit risk for any payments accepted in the system for payments. Recipients are notified after the payments are settled. The central bank’s intraday liquidity provisions for system participants are fully collateralised.
3.2.9.2 Liquidity risk
As a tool for managing liquidity risk, the CBRT provides an intraday liquidity facility to the participants. The funds reservation facility, central queuing and gridlock resolution mechanisms, prioritisation of payments and advanced queue management facilities also help participants to contain liquidity risks, as described below.
In order to meet temporary liquidity shortages and hence to mitigate liquidity risk in TIC-RTGS, the CBRT provides banks with an intraday liquidity facility between 09:00 and

CPSS – Payment systems in Turkey, 2007 21
15:00 (since July 1999) and a late liquidity window facility between 16:00 and 16:30 (since July 2002), both of which are collateralised.
The intraday liquidity facility is provided to banks within their borrowing limits. Banks do not pay interest on this facility but only a commission of 0.0048% on the principal amount of each transaction. The facility must be repaid by the end of the day; otherwise, the bank’s collateral is liquidated and its intraday liquidity is converted into a penalised overnight credit.
As a lender of last resort, the CBRT also provides the late liquidity window facility to banks. Under this facility, banks can lend money to the CBRT at the central bank’s borrowing rate and borrow from the CBRT at the central bank’s lending rate without any limit, provided that their needs are fully collateralised.
The types of collateral that are accepted are chosen from among marketable and liquid assets. The CBRT also applies haircuts according to each asset type’s historical price volatility and liquidity. Collateral holdings are blocked on a transaction basis and the collateral is marked to market. There is a centralised system in place to monitor the status of the collateral. Market participants are not able to access this system directly.
Apart from these facilities, participants may use the funds reservation facility to preplan their payments. There are three mechanisms to manage funds reservations:
• Participant may reserve a quantity of liquidity against their account for use later in the day (headroom). Headroom is not associated with any particular anticipated payments, and remains reserved until the participant releases it, or until the end of the day.
• The participant may reserve funds for high-priority payments (priority reservations). Funds reserved in this way may be used only for the settlement of high-priority payments.
• The participant may reserve funds for a specific payment anticipated later the same day (earmark). Earmarks may be created for anticipated individual payments.
As a fourth facility to manage liquidity risk, TIC-RTGS has a centralised payment queue facility. Payments are released from the queue within each priority on a first-in-first-out (FIFO) basis. Participants have full real-time control over their payment queue. They can query their queue, change the priority and order of queued payments, and cancel a payment upon the approval of the TIC-RTGS and ESTS Operation Centre. They can also query the total amount of queued incoming payments.
Moreover, the system has a gridlock resolution facility that allows payment settlements from two or more queues simultaneously without altering predetermined payment priorities, even though the payments cannot be settled separately. The facility, which is transparent to the participants, may be used manually or automatically (in preset periods).
3.2.9.3 Operational risk
In order to minimise the operational risk of TIC-RTGS, every component of the system has its backup.
A remote emergency backup centre began operating in 2000. The disaster centre was developed to take over the operations in a very short time, in the event of complete site failure at the primary centre. In such a case, participants’ connections are automatically routed to the backup centre, which takes over the operation without any data loss or duplication.
Moreover, the business continuity arrangements in TIC-RTGS are well documented in the Disaster Recovery Guide and are available for implementation. The Disaster Recovery Guide describes the operational facilities to be used in the event of a failure in any component of the system, defines decision and notification procedures for handling abnormal situations,
22 CPSS – Payment systems in Turkey, 2007
and includes sample forms for information dissemination as well as the contact information of the teams that will be in charge in case of a problem. The guide also contains a section dedicated to the measures that should be taken by the participants to minimise the operational risks.
As part of the CBRT Contingency Plan, the emergency backup centre and the TIC-RTGS Disaster Recovery Guide are tested twice a year with different crisis scenarios.
3.2.10 Statistical data At end-2006, TIC-RTGS had 48 participants. There has been a trend increase in both volume and value of the messages over the years. In 2006, TIC-RTGS processed 94.2 million messages for a value of TRY 15.05 trillion (USD 10.53 trillion). The average volume and value of transactions settled per day during that period were 375,337 and TRY 60.0 billion (USD 41.9 billion), respectively.
3.3 The large-value payment system The Takasbank Clearing System (TCS) clears and settles large-value payments related to securities trades on the Istanbul Stock Exchange (ISE).
Takasbank, as the clearing and settlement institution of the ISE (see Sections 1.3.3 and 1.3.4), calculates the net obligations of parties involved in ISE markets on a multilateral basis. Both cash and securities settlement are handled by the TCS.
3.3.1 Operating rules The operational procedures, rights and obligations of the parties are governed by the Capital Markets Law, related CMB decrees, the ISE settlement regulations, and other relevant ISE and Takasbank circulars, all of which are available on the websites of these institutions (www.cmb.gov.tr, www.ise.org, www.takasbank.com.tr). The rules do not vary with regard to the identity, type and location of the member.
3.3.2 Participants in the system Members of the ISE are automatically members of Takasbank for settlement purposes and sign the standard agreement with Takasbank. The criteria for membership of the ISE are stated in the relevant clauses of the Capital Markets Act and in the ISE rules and regulations.
Members’ terminals are connected to the Takasbank system. Prior to connection to the system, members must meet certain criteria set by Takasbank, such as system configurations, leased lines, etc.
As of November 2006, the stock market had 97 members (only brokerage houses can operate in the stock market). The bills and bonds markets had 133 members, of which 40 were banks and 93 were brokerage houses.
3.3.3 Types of transactions handled The TCS handles the clearing and settlement of both the security and the cash legs of ISE operations.
3.3.4 Operation of the system Takasbank calculates and announces the net obligations of members resulting from their operations in ISE markets.

CPSS – Payment systems in Turkey, 2007 23
On the value date, members are obliged to provide sufficient funds in their funds debit and securities debit accounts by the cutoff times set by Takasbank.
Members can credit their Takasbank funds accounts by TIC-RTGS transfers, cash delivery, or transfers from other Takasbank members. It is also possible to cover their debit positions by their claims in other markets.
At the cutoff time, Takasbank transfers members’ liabilities from their funds accounts to a funds pool account. Members with net credit positions are then paid from this pool: for a bank member, its TIC-RTGS account is credited; for a non-bank member, its Takasbank giro account is credited.
If members fail to provide sufficient funds in their funds debit accounts by the cutoff time, they are charged a penalty. The penalty charges are transferred into the guarantee pool (see Section 3.3.9.1).
3.3.5 Operating hours For the bills and bonds market, same day value trading closes at 14:00, while forward value trading can be carried out until 17:00. At 15:15 on the settlement day, Takasbank announces members’ net obligations. Members then have until 16:30 to provide a sufficient balance in their funds debit account. For the stock market, Takasbank announces the debt positions in the morning on T + 1. Members are then expected to pay their funds obligations by 16:00 on the settlement day (T + 2). There is no end-of-day procedure. The balance of the funds debit accounts becomes zero as Takasbank debits them for settlement. Members usually transfer the balances of their giro accounts to their TIC-RTGS accounts.
3.3.6 Transaction processing environment In the TCS, all settlement members perform settlement-related transactions from their office terminals with their leased line connections to the Takasbank host system, using the programme products downloaded to their terminals by Takasbank. Takasbank has developed a disaster recovery plan which addresses all possible major risks that can interrupt operations. Takasbank also has a remote disaster recovery centre, which hosts a full duplicate of the primary system as well as data backups.
3.3.7 Settlement procedures Takasbank performs multilateral netting using its members’ funds and securities debit accounts. In order to minimise the principal risk, the DVP principle is used. Partial DVP is also applied, allowing members to receive the securities in amounts proportional to payment of their liabilities.
3.3.8 Pricing policies Takasbank charges neither an entrance fee nor an annual fee to its members. Settlement is also free of charge.

24 CPSS – Payment systems in Turkey, 2007
3.3.9 Risk management
3.3.9.1 Principal risk
In order to eliminate principal risk, all operations are performed according to DVP (model 3).9 Takasbank does not guarantee settlement, and a timely settlement depends on whether members pay their obligations on time. Two guarantee funds have been established under the ISE Regulation, one for each market, in order to facilitate timely settlement and reduce settlement risk. If a member fails to cover its funds obligations, the guarantee fund is used instead. If the amount of the unpaid obligation exceeds the guarantee fund, the security claims arising from the same settlement cycle that have been blocked for DVP settlement are liquidated to cover the outstanding obligations.
3.3.9.2 Operational risk
To mitigate the operational risk, Takasbank has established a remote disaster recovery centre, which hosts a full duplicate of the primary system as well as data backups.
3.3.10 Statistical data In 2006, the net settled cash value of transactions in the stock market and the bills and bonds market totalled TRY 31.6 billion (USD 22.4 billion) and TRY 437.9 billion (USD 310.6 billion), respectively.
3.4 Retail payment systems
3.4.1 Interbank Card Centre (BKM) The Interbank Card Centre (BKM) was founded as a non-profit organisation by 13 major public and private Turkish banks in 1990. As of December 2006 it had 28 members (10 shareholders) and six service providers. The regulations require that a member be either a bank or a VISA or MasterCard member.
The Centre’s main fields of activity are:
• to develop procedures to be applied by banks implementing credit card and debit card systems;
• to generate decisions by performing activities aimed at standardisation;
• to establish domestic rules via applications used throughout Turkey;
• to carry out interbank clearing transactions;
• to establish relations with foreign entities and commissions and, if necessary, to represent its members with these entities;
• to carry out transactions already being performed by banks in a more secure, faster and more cost-effective manner from a single centre.
In addition, payables and receivables arising from purchases by cardholders are cleared through the Centre’s domestic clearing and settlement system.
9 In a DVP model 1 the securities and funds are transferred on a gross basis. In a DVP model 2 the securities
are transferred on a gross basis while funds are settled on a net basis. In a DVP model 3 both securities and funds are simultaneously transferred on a net basis.
CPSS – Payment systems in Turkey, 2007 25
The BKM is the service provider handling all activities related to the processing of credit card and debit card payments. It clears and settles all domestic credit card payments and settles debit card payments between banks. It also establishes the legal and administrative infrastructure, sets technology standards, issues a national combined warning bulletin, operates the BKM system, and provides training and security services for its members.
The BKM system started operations in 1993, enabling banks to make rational use of infrastructure and resources, typically by sharing networks and ATMs. The system’s services include online credit card authorisation, standalone credit card authorisation, ATM and POS sharing for debit cards and gateways to external networks. Banks that share ATMs enable their debit cardholders to use each other’s ATMs under bilateral agreements.
The BKM has a separate settlement account with the CBRT under a special agreement. This account is used exclusively for credit and debit card settlement. The BKM advises the banks and the CBRT of each bank’s net debit or credit position. Banks with a debit position send instructions to the CBRT for payment out of their giro accounts. After these accounts have been debited, the payments are credited to the creditor banks. The CBRT has no responsibility for credit and debit card clearing other than providing settlement services. All debits and credits in the settlement account are booked on the basis of the details supplied by the BKM.
3.4.2 Interbank Clearing Houses Centre (BTOM)
3.4.2.1 Rules and participants
The Cheque Law defines the Interbank Clearing Houses Centre (BTOM) as a legal entity and empowers the CBRT to supervise and control the cheque clearing process nationwide. The Cheque Law and the CBRT’s by-law on the BTOM govern the establishment and functioning of the interbank clearing houses (ICHs), which operate as branches of the BTOM. The CBRT issues directives and regulates the functioning of all clearing houses.
Currently, there are two clearing houses located in Ankara and Istanbul. All cheque clearing transactions are carried out electronically in the BTOM. The BTOM only processes TRY cheques.
Only banks can be members of the BTOM. All banks that provide cheque account facilities are members of the BTOM. As of end-2006, the BTOM had a total of 41 members (the CBRT, 31 commercial banks, five development and investment banks and four participation banks).
The Executive Board of the BTOM consists of a representative from the CBRT as chairman and representatives from 12 banks forming the Executive Board of the BAT.
ICHs are administered by a committee which consists of the CBRT branch manager and three representatives from banks. Their operating expenses are financed by member banks according to the banks’ share in the total number of cheques processed over the year. Fixed expenditure on such items as acquisition of fixed assets, computer hardware or software is evenly distributed among member banks.
Legally, cheques are required to be presented to the clearing houses physically. However, to improve the efficiency of the clearing process and to avoid the risks associated with the physical delivery of cheques, a cheque truncation system was introduced in 1998. This allows cheques to be cleared without directly presenting them in the clearing house. This system is optional and is currently used by 32 banks. Banks wishing to use this facility are required to sign a protocol which sets out the procedures and defines obligations in the event of any legal dispute that may arise due to the non-physical presentation of cheques.
In order to improve the efficiency of the clearing process, a new electronic cheque clearing system has been in operation since September 2006.
26 CPSS – Payment systems in Turkey, 2007
3.4.2.2 Operation of the system
Cheques are cleared through the BTOM. Collecting banks transmit cheque information to the central computer of the clearing house around the clock. On the clearing day, information on cheques issued and received is transmitted by the banks until 06:00. This information is stored in the central computer and sent to the drawee banks where the cheque account is opened at 06:00. Although nine out of 41 banks carry out cheque transactions electronically, they also present cheques physically until 09:00 on the clearing day. Banks request provisions for cheques and the provision results (bad cheque information) are sent to the BTOM until 17:00 on the same day.
The BTOM sends a list of daily cheque clearing results to the central bank’s Ankara branch for final settlement.
In 2006, a total of 23,558,235 cheques amounting to TRY 186.9 billion (USD 132.5 billion) were processed through the BTOM.
3.4.2.3 Settlement
The BTOM determines the net debit or credit positions for each bank on a multilateral basis. Banks are informed about the outcome by 18:00 each day.
The CBRT maintains a separate settlement account for the BTOM at its Ankara branch. The final settlement of operations is carried out through this account. Debtor banks have to settle their daily clearing debt by payment from their giro deposits at the central bank’s Ankara branch or via TIC-RTGS not later than 12:00 on the following business day. Once all debtor banks have paid their debts, the Ankara branch makes payments to creditor banks through TIC-RTGS.
The BTOM Regulations define the rules to be applied if a participant in the system fails to fulfil its obligations. If a liquidity problem arises, the CBRT is authorised to use all the accounts of the participants at the CBRT. In addition, since the BTOM participants are banks and the CBRT provides a fully collateralised intraday liquidity facility to banks, BTOM participants may use this credit facility. Moreover, in case of failure of a participant (ie revocation or restriction of a participant’s operating licence), the net positions of other participants will be recalculated by excluding the failed participant.
3.4.3 E-money schemes Currently, e-money schemes in Turkey are limited to a few pilot projects at university campuses. A major private bank has started a pilot project at its headquarters in Istanbul and at three universities in three major Turkish cities: Ankara, Istanbul and Izmir. Smart cards issued by banks have an embedded chip that is capable of holding value and identification information for the user. Cards are used to purchase goods at vending machines and to allow users access to restricted areas. Money transfer to the card is performed at the bank’s ATMs. The total numbers of cards and merchant terminals for these projects are 59,000 and 45, respectively.
3.5 Exchange and settlement systems for international transactions Currently, there are 15 foreign banks (subsidiaries or branches of banks incorporated abroad) in Turkey. Turkish banks also have an extensive presence abroad. International transfers of both small- and large-value payments are mainly handled by the banks. The Post Office and credit card companies are also involved in small-value international payments. Like the banks, the CBRT uses the SWIFT system for foreign currency transactions.

CPSS – Payment systems in Turkey, 2007 27
3.5.1 Cross-border payments International payment messages are mostly transmitted through SWIFT, which was introduced in Turkey in 1989. As of 2006, 50 financial institutions in Turkey participated in this network. In 2006, the total (sent and received) message traffic of Turkey was about 0.7% of the worldwide SWIFT traffic, with a daily average of 83,126 messages. The total numbers of messages sent and received via SWIFT in 2006 were 9.75 million and 11.06 million, respectively. Banks may use either their foreign offices or correspondent banks for making cross-border payments.
3.5.2 Retail payments (credit and debit cards) Retail payments are made not only via banks, but also via credit card companies and the Post Office. Credit card payments are settled through the credit card companies. At end-2006, credit and debit cards issued by foreign banks had been used in Turkey for 16.4 million transactions for a total value of TRY 4.8 billion. As a result of credit and debit card transactions in the payment card system, BKM members have been instrumental in generating a considerable net foreign exchange inflow into Turkey.
3.5.3 Post Office remittances Cross-border remittances can be sent and received via the Post Office. The Post Office has agreements and contracts with its counterparts in 40 countries and accepts remittances only from them. Since there is no postal bank in Turkey, settlement is carried out via a correspondent bank. The Post Office mostly receives remittances from Turkish workers abroad. Due to the increasing number of Turkish bank branches abroad and the presence of foreign banks in Turkey, however, there has been a decline in the use of the Post Office for international transactions. In 2006, the Post Office processed a total of 141,000 international remittances, amounting to TRY 111.3 million.
3.5.4 Traveller’s cheques Traveller’s cheques are widely used in Turkey. Foreign banks issue them in all major currencies. Foreign currency traveller’s cheques are encashed by directly presenting them to the paying bank.
4. Securities settlement systems
4.1 Government bonds, treasury bills and CBRT liquidity bills Based on the Public Finance and Debt Management Law (Law No 4746 enacted in 2002), book entry government bonds and treasury bills (Domestic Debt Notes (DDNs)) are issued by the CBRT on behalf of the Undersecretariat of the Treasury in accordance with the financial services agreement between the Treasury and the CBRT.
The CBRT is the central securities depository for DDNs. It is possible to print and deliver physical certificates, but most DDNs are created by the CBRT only in the books of its securities settlement system, TIC-ESTS (see Section 4.3.3 for details). TIC-ESTS is integrated with TIC-RTGS so that a DVP model 1 is achieved.
CBRT liquidity bills are designed to absorb excess liquidity in the market in order to increase the effectiveness of the central bank’s monetary policy. The liquidity bills, with a maturity of up to 91 days, may also be subject to early redemption. The bills are created by the CBRT only in the books of TIC-ESTS.
28 CPSS – Payment systems in Turkey, 2007
Primary market operations involving DDNs and CBRT liquidity bills are performed in TIC-ESTS, while secondary market operations are mainly carried out in ISE markets. Trades on the ISE are cleared and settled by the ISE Settlement and Custody Bank (Takasbank).
4.1.1 Primary market operations The Treasury, which is the issuer of DDNs, determines the method and terms of issuance. The CBRT performs all operations related to issuance on behalf of the Treasury. The CBRT uses the TIC-RTGS and ESTS infrastructure to collect bids for the auctions. In the context of DDN auctions, the settlement is generally performed on T + 1, and sometimes T + 2.
Primary market settlement of DDNs and CBRT liquidity bills takes place in TIC-ESTS.
The CBRT initiates DVP settlement of the transactions based on the result of the auctions, and the participants then buy the associated securities. The settlement is performed in real time in a DVP model 1.
In addition to primary market operations, over-the-counter transactions and CBRT open market transactions are settled in TIC-ESTS on a gross basis.
4.1.2 The ISE market 4.1.2.1 Trading
Most DDN trades are performed in the ISE bonds and bills market, which is the organised, fully automated market for both outright purchases and sales and repurchase/reverse repurchase transactions. The purpose of the market is to provide a transparent, liquid, competitive and efficient environment for secondary market trading of fixed income securities comprising DDNs, CBRT liquidity bills, revenue-sharing certificates, bonds issued by the Privatisation Administration, and corporate bonds listed on the ISE. Although there is a market for the securities stated above, most of the transactions are conducted on treasury bills and government bonds.
Outright purchases and sales and repo/reverse repo transactions take place between 09:30 and 17:00 Monday to Friday. Same day value orders (the beginning value date for the repo/reverse repo market) can be matched until 14:00, whereas forward value orders are valid until 17:00. Same day value orders for mutual fund transactions can be executed until 17:00. Trading is halted during the lunch break, from 12:00 to 13:00.
4.1.2.2 Clearing and settlement
The DDN trades performed in the ISE bonds and bills market are cleared and settled by Takasbank, using the TCS. All securities intermediary institutions (brokerage houses and banks) that are certified by the CMB can be members of the ISE, and ISE members are automatically entitled to be settlement members of Takasbank.
Those trades that are matched by 14:00 are settled on the same day (T + 0). Multilateral netting is applied on a daily basis. Takasbank calculates and announces the net obligations of parties arising from their operations in ISE markets. Net obligations are legally binding but Takasbank does not guarantee settlement.
For settlement, the DVP (model 3) principle is observed, as members do not get their receivables unless they fulfil their obligations. In case of partial fulfilment of the obligation, a proportional amount of the receivable is transferred to the buyer.
Members must fulfil their obligations by transferring funds and DDNs to the specific Takasbank accounts by 16:30 through TIC-RTGS and ESTS or the Takasbank environment.
Up to 16:30 of every day, Takasbank debits member liabilities from their securities account at Takasbank and deposits them in a securities pool account. Members must have sufficient

CPSS – Payment systems in Turkey, 2007 29
securities in their accounts by 16:30. The securities can be transferred to the member accounts by TIC-ESTS transfers, physical delivery or transfers from other Takasbank accounts. At 16:30, the securities in the pool account are delivered to creditor members on condition that they fulfil their funds and securities obligations.
If members fail to provide sufficient securities and funds by the cutoff time, they are charged a penalty. The penalty charges are transferred into the guarantee fund.
4.2 Stocks Capital market instruments including stocks, and the capital markets themselves, are regulated and supervised by the CMB. All stocks are registered as dematerialised shares in the CRA, which is the central securities depository. Stocks are traded on the ISE and are cleared and settled by Takasbank.
4.2.1 Trading Stocks are traded on the ISE stock market. The fully computerised trading system enables ISE members to trade stocks and rights coupons. Prices are determined according to a “multiple price–continuous auction” method, utilising a computerised system that automatically matches buy and sell orders on a price and time priority basis. All information regarding transparency, except standing order IDs, is displayed in the trading system during the sessions.
4.2.2 Clearing and Settlement Financial institutions operating on the ISE stock market must open custody accounts with the CRA (the central securities depositary for stocks in Turkey) and fund settlement accounts at Takasbank. All securities intermediary institutions (brokerage houses and banks) that are certified by the CMB can be members of the ISE. ISE members are automatically entitled to be settlement members of Takasbank. Both the funds and the securities legs of ISE trades are settled in the TCS.
Takasbank calculates the stock and fund obligations of the parties using multilateral netting based on the data received by the ISE. The stock obligations are reported to the members and the CRA in customer details on the morning of the following business day (T + 1).
The settlement of stock trades on the ISE is done on T + 2 using electronic messaging between the CRA and Takasbank. The CRA blocks and transfers related stocks (obligations) from the participants’ accounts to the Takasbank pool account with the CRA. Members must make the stocks available to the CRA and the funds must be in Takasbank by 16:00.
The DVP model 3 is applied during the settlement process in Takasbank. Net obligations are legally binding in Turkey but Takasbank does not guarantee settlement. In case of partial fulfilment of the obligation, a proportional amount of the receivable is transferred to the buyer.
If members fail to provide enough stocks and funds by the cutoff time, they are charged a penalty. The penalty charges are transferred into the guarantee fund.
4.3 The use of the securities infrastructure by the CBRT The CBRT, being responsible for issuing treasury bills and government bonds on behalf of the Undersecretariat of the Treasury, developed an electronic securities transfer and settlement system, TIC-ESTS, in 2000. TIC-ESTS also provides an efficient infrastructure for the market operations carried out by the CBRT as part of its monetary policy operations and for managing collateral.
30 CPSS – Payment systems in Turkey, 2007
4.3.1 Open market operations To regulate the money supply and liquidity in the economy in the framework of monetary policy targets, the CBRT conducts open market operations against the Turkish lira, including outright purchase and sale of government securities, repo and reverse repo transactions, issuance of liquidity bills, and lending and borrowing of Turkish lira deposits and DDNs.
The cash settlement of these transactions takes place in the banks’ TIC-RTGS accounts. The securities settlement takes place in TIC-ESTS.
Open market operations can be performed in TIC-RTGS and ESTS or on the ISE.
4.3.2 Securities lending and borrowing market in the CBRT The collateralised securities lending and borrowing market, in which the CBRT acts as a blind broker, was established in the CBRT in 2003. Only six benchmark securities, chosen by the Treasury, are eligible for lending/borrowing transactions in this market and the transfer of loaned securities takes place through the accounts held in TIC-ESTS, as the custodian.
While primary dealers are allowed to borrow and lend, other banks can only lend securities in this market. Institutions and private investors can only lend, with banks as intermediaries.
4.3.3 CBRT securities settlement system (TIC-ESTS) As an agent of the Undersecretariat of the Treasury, the CBRT is responsible for issuing and settling DDNs (government bonds, T-bills) on behalf of the Treasury. In October 2000, the CBRT began operating the electronic securities transfer and settlement system, TIC-ESTS, for the issuance and settlement in book entry form of DDNs and other securities issued by governmental organisations.
The TIC-ESTS system provides real-time transfer and settlement of securities. With the online real-time TIC-RTGS connection, settlement of the securities and associated funds is synchronised so that a DVP model 1 is achieved. Settled operations are irrevocable.
TIC-ESTS handles:
• primary market operations (issuance and sale of securities by the CBRT);
• secondary market operations (DVP sales between participants, transfers related to the settlement of ISE market transactions, repo and reverse repo operations);
• free transfers between the participants;
• transfers between the sub-accounts of a participant (repositioning operations);
• transfers between physical and book entry forms (rematerialisation/dematerialisation);
• redemption and coupon payment notifications;
• online inquiry and periodic reporting facilities.
On the issuance day the securities are created in the books of TIC-ESTS in the CBRT sub-account. They are then transferred to the participants’ accounts in the context of primary market operations. Transfers resulting from secondary market operations are also conducted in TIC-ESTS. In addition, TIC-ESTS permits conversion of physical securities to electronic form and vice versa. In other words, securities in TIC-ESTS can be delivered in paper form if investors so require. Similarly, paper certificates may be entered into the electronic system once the holder physically submits them to a CBRT branch. As the fiscal agent of the Treasury, the CBRT issues securities in TIC-ESTS and makes principal and interest payments on government bonds and treasury bills.
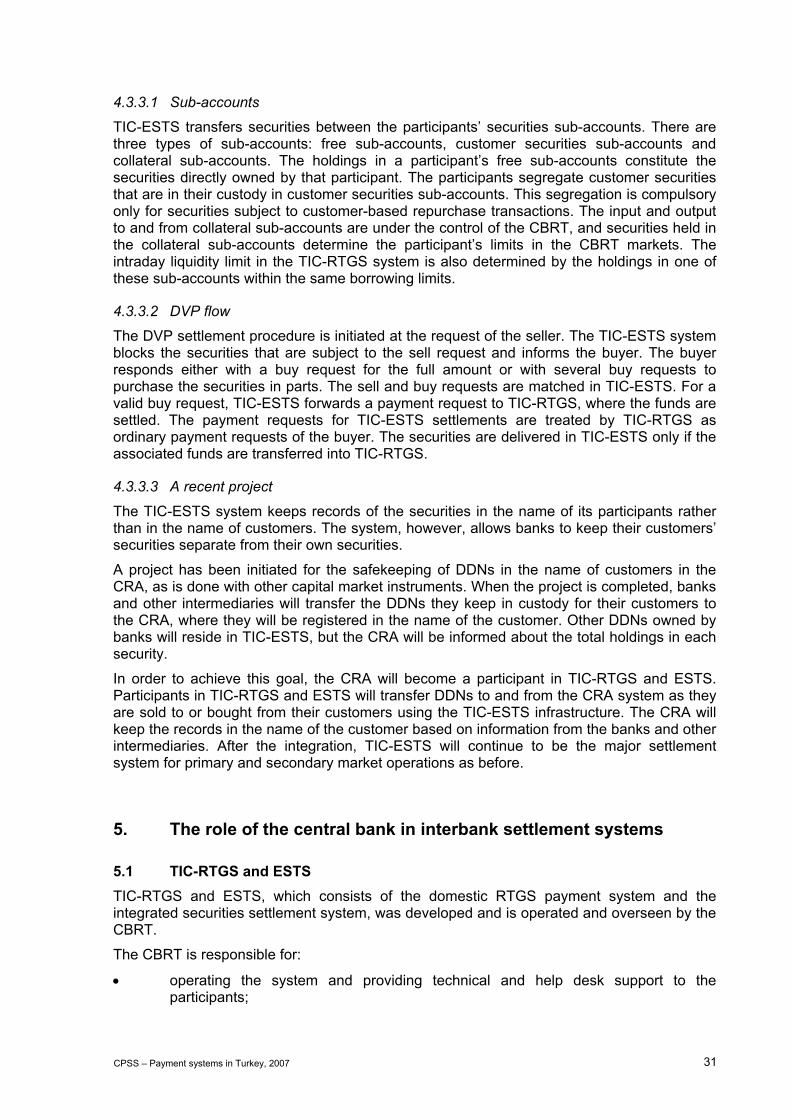
CPSS – Payment systems in Turkey, 2007 31
4.3.3.1 Sub-accounts
TIC-ESTS transfers securities between the participants’ securities sub-accounts. There are three types of sub-accounts: free sub-accounts, customer securities sub-accounts and collateral sub-accounts. The holdings in a participant’s free sub-accounts constitute the securities directly owned by that participant. The participants segregate customer securities that are in their custody in customer securities sub-accounts. This segregation is compulsory only for securities subject to customer-based repurchase transactions. The input and output to and from collateral sub-accounts are under the control of the CBRT, and securities held in the collateral sub-accounts determine the participant’s limits in the CBRT markets. The intraday liquidity limit in the TIC-RTGS system is also determined by the holdings in one of these sub-accounts within the same borrowing limits.
4.3.3.2 DVP flow
The DVP settlement procedure is initiated at the request of the seller. The TIC-ESTS system blocks the securities that are subject to the sell request and informs the buyer. The buyer responds either with a buy request for the full amount or with several buy requests to purchase the securities in parts. The sell and buy requests are matched in TIC-ESTS. For a valid buy request, TIC-ESTS forwards a payment request to TIC-RTGS, where the funds are settled. The payment requests for TIC-ESTS settlements are treated by TIC-RTGS as ordinary payment requests of the buyer. The securities are delivered in TIC-ESTS only if the associated funds are transferred into TIC-RTGS.
4.3.3.3 A recent project
The TIC-ESTS system keeps records of the securities in the name of its participants rather than in the name of customers. The system, however, allows banks to keep their customers’ securities separate from their own securities.
A project has been initiated for the safekeeping of DDNs in the name of customers in the CRA, as is done with other capital market instruments. When the project is completed, banks and other intermediaries will transfer the DDNs they keep in custody for their customers to the CRA, where they will be registered in the name of the customer. Other DDNs owned by banks will reside in TIC-ESTS, but the CRA will be informed about the total holdings in each security.
In order to achieve this goal, the CRA will become a participant in TIC-RTGS and ESTS. Participants in TIC-RTGS and ESTS will transfer DDNs to and from the CRA system as they are sold to or bought from their customers using the TIC-ESTS infrastructure. The CRA will keep the records in the name of the customer based on information from the banks and other intermediaries. After the integration, TIC-ESTS will continue to be the major settlement system for primary and secondary market operations as before.
5. The role of the central bank in interbank settlement systems
5.1 TIC-RTGS and ESTS TIC-RTGS and ESTS, which consists of the domestic RTGS payment system and the integrated securities settlement system, was developed and is operated and overseen by the CBRT.
The CBRT is responsible for:
• operating the system and providing technical and help desk support to the participants;

32 CPSS – Payment systems in Turkey, 2007
• setting up the legal and operational framework of the system;
• overseeing and controlling the system as a whole;
• investigating changes in participants’ requirements and the need for improvements to the system, and planning development in coordination with the participants and the BAT;
• assessing new trends and needs in the banking sector and their implications for the development of the system.
5.2 Provision of settlement (and credit) facilities
5.2.1 Use of central bank accounts for payments Banks, financial institutions, some brokerage houses and exchange offices hold cash accounts at CBRT branches. The funds in some of these accounts are used for reserve requirements and for operations in financial markets. Cheques can be drawn on these accounts.
5.2.2 Use of central bank accounts for securities transactions Most banks hold securities accounts in the TIC-ESTS system at the CBRT head office, except for a few banks that do not participate in TIC-ESTS and thus hold securities accounts at CBRT branches. Only securities listed in the Official Gazette (ie treasury bills and government bonds) may be held in these accounts in book entry form. Securities in some of these accounts are used as collateral for operations in the CBRT interbank money market, foreign exchange and banknote markets, the securities lending and borrowing market, and in open market operations. The CBRT sets operating limits for banks for each market. Transfer of securities from collateral accounts is subject to CBRT authorisation to prevent banks exceeding the defined limit.
5.3 Monetary policy and payment systems The CBRT determines monetary policy and uses monetary instruments to achieve and maintain price stability. It also aims at adjusting liquidity in such a way as to avoid disturbing market stability. The CBRT makes use of open market operations, the interbank money market and the foreign exchange market to maintain financial stability.
5.3.1 TRY interbank money market in the CBRT The interbank money market was established in 1986. Lending and borrowing operations in this market are effected through the CBRT, which performs the role of blind broker. The CBRT can also borrow and lend in this market in order to regulate liquidity in the system. On 2 December 2002, the CBRT abandoned its intermediary function in the interbank money market. Since then, the CBRT has continued to perform interbank money market operations on its own behalf based on the interest rates announced by the central bank.
5.3.2 Foreign exchange and banknote market in the CBRT The interbank foreign exchange market in Turkey is an over-the-counter market. The banks make foreign exchange transactions among themselves and through brokers. Payments related to these transactions are cleared via TIC-RTGS for Turkish liras and via SWIFT for foreign exchange. There is also a derivatives exchange established in the city of Izmir, where banks may buy and sell foreign exchange futures contracts.

CPSS – Payment systems in Turkey, 2007 33
Since 2002, the CBRT has ceased to act as a blind broker in the foreign exchange market. The CBRT conducts daily foreign exchange buying auctions to accumulate reserves only as long as market conditions prevail, and it occasionally intervenes in the market in the event of excess volatility.


CPSS – Payment systems in Turkey, 2007 35
Statistical tables


Table 1Basic statistical data
2001 2002 2003 2004 2005Population (thousands) 68,407 69,388 70,363 71,332 72,065GDP (TRY billions) 178.4 277.6 359.8 430.5 486.8GDP per capita (TRY) 2,608 4,000 5,113 6,035 6,756Consumer price inflation (per cent, end of year) 68.5 29.7 18.4 9.3 7.7Exchange rate (national currency TRY/USD):
end of year 1.4465 1.6424 1.4026 1.3486 1.3495average 1.2300 1.5244 1.5124 1.4292 1.3473
Table 2Settlement media used by non-banks(TRY billions, end of year)
2001 2002 2003 2004 2005Notes and coin in circulation outside banks 4.46 6.90 9.78 12.44 17.23Value of transferable deposits1 6.91 9.78 13.24 16.35 19.62Narrow money supply (M1) 11.37 15.83 23.01 28.79 36.85Memo:Transferable deposits in foreign currencies2 57.15 72.26 68.93 76.07 74.98Outstanding value on e-money storages3 nap nap nap nap nap
on card-based products nap nap nap nap napon software and network-based products nap nap nap nap nap
Table 3Settlement media used by banks(TRY billions)
2001 2002 2003 2004 2005Transferable balances held at the central bank 4.85 4.32 4.94 6.33 12.61of which (end of year) 1 :
required reserves 2 2.77 3.37 4.21 5.19 11.48free reserves 2.08 0.95 0.73 1.14 1.13
Transferable balances held at other banks 27.83 27.46 38.68 53.50 73.46Memo:Institutions' borrowing from the central bank 286.35 421.54 698.84 798.67 890.16of which (interbank market-year total):
intraday 78.27 212.03 199.40 39.55 27.72overnight 208.08 209.51 499.44 759.12 862.44longer refinancing operations 0 0 0 0 0
1 The figures are the average of the last reserve maintenance period. 2 The figures before 2002 are free deposits to be held forliquidity requirements.
1 Demand deposits. 2 FX deposits. 3 There is no fully operational electronic money scheme currently in place.
CPSS – Payment systems in Turkey, 2007 37
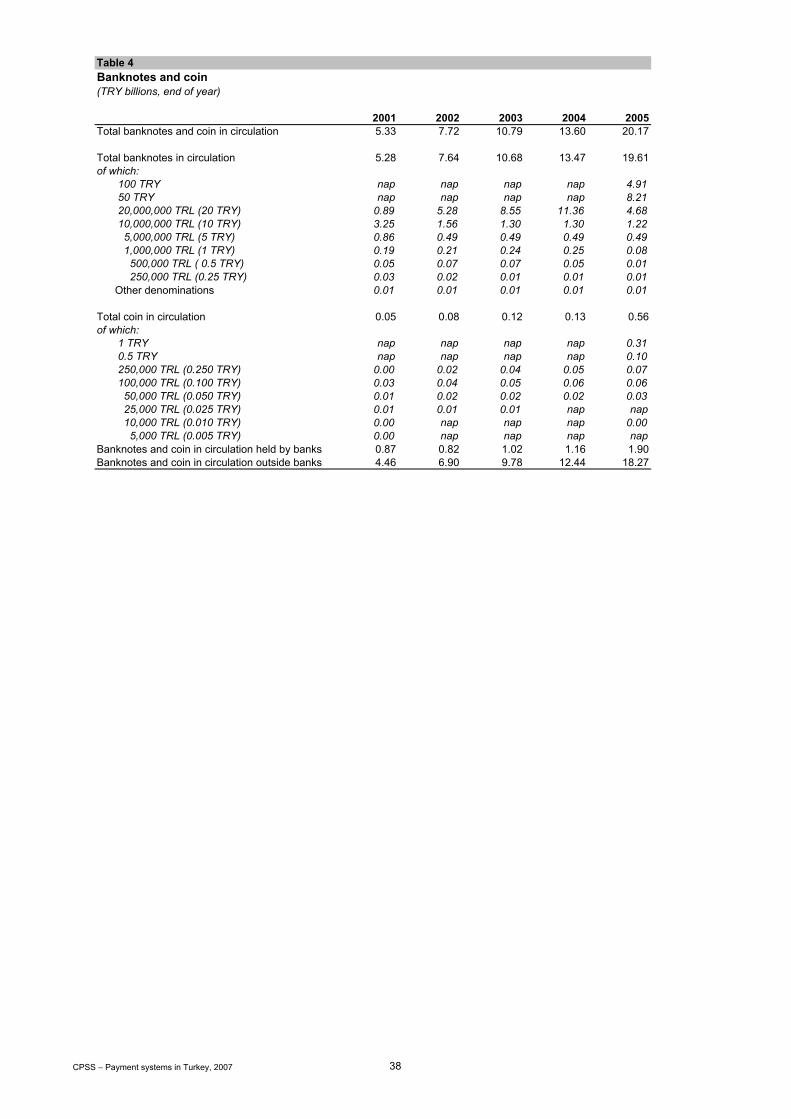
Table 4Banknotes and coin (TRY billions, end of year)
2001 2002 2003 2004 2005Total banknotes and coin in circulation 5.33 7.72 10.79 13.60 20.17
Total banknotes in circulation 5.28 7.64 10.68 13.47 19.61of which:
100 TRY nap nap nap nap 4.91 50 TRY nap nap nap nap 8.21 20,000,000 TRL (20 TRY) 0.89 5.28 8.55 11.36 4.68 10,000,000 TRL (10 TRY) 3.25 1.56 1.30 1.30 1.22 5,000,000 TRL (5 TRY) 0.86 0.49 0.49 0.49 0.49 1,000,000 TRL (1 TRY) 0.19 0.21 0.24 0.25 0.08 500,000 TRL ( 0.5 TRY) 0.05 0.07 0.07 0.05 0.01 250,000 TRL (0.25 TRY) 0.03 0.02 0.01 0.01 0.01Other denominations 0.01 0.01 0.01 0.01 0.01
Total coin in circulation 0.05 0.08 0.12 0.13 0.56of which:
1 TRY nap nap nap nap 0.31 0.5 TRY nap nap nap nap 0.10 250,000 TRL (0.250 TRY) 0.00 0.02 0.04 0.05 0.07 100,000 TRL (0.100 TRY) 0.03 0.04 0.05 0.06 0.06 50,000 TRL (0.050 TRY) 0.01 0.02 0.02 0.02 0.03 25,000 TRL (0.025 TRY) 0.01 0.01 0.01 nap nap 10,000 TRL (0.010 TRY) 0.00 nap nap nap 0.00 5,000 TRL (0.005 TRY) 0.00 nap nap nap nap
Banknotes and coin in circulation held by banks 0.87 0.82 1.02 1.16 1.90Banknotes and coin in circulation outside banks 4.46 6.90 9.78 12.44 18.27
CPSS – Payment systems in Turkey, 2007 38
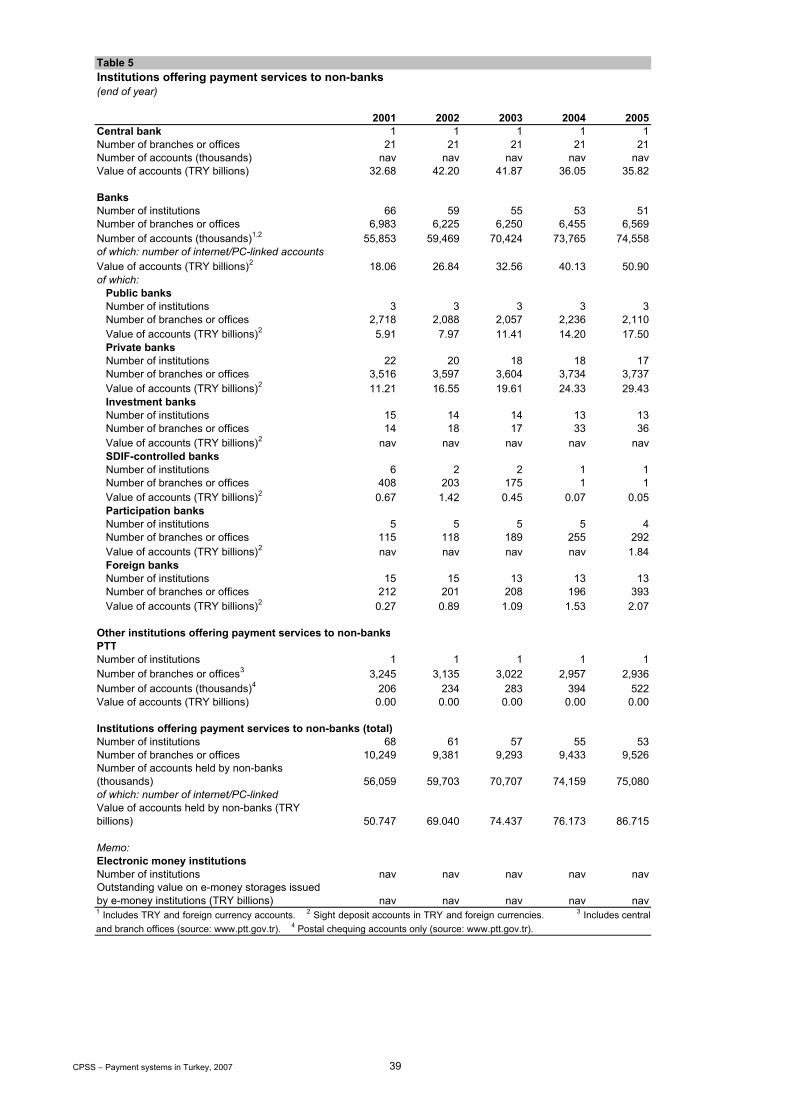
Table 5Institutions offering payment services to non-banks(end of year)
2001 2002 2003 2004 2005Central bank 1 1 1 1 1Number of branches or offices 21 21 21 21 21Number of accounts (thousands) nav nav nav nav navValue of accounts (TRY billions) 32.68 42.20 41.87 36.05 35.82
BanksNumber of institutions 66 59 55 53 51Number of branches or offices 6,983 6,225 6,250 6,455 6,569Number of accounts (thousands)1,2 55,853 59,469 70,424 73,765 74,558of which: number of internet/PC-linked accounts Value of accounts (TRY billions)2 18.06 26.84 32.56 40.13 50.90of which:
Public banksNumber of institutions 3 3 3 3 3Number of branches or offices 2,718 2,088 2,057 2,236 2,110Value of accounts (TRY billions)2 5.91 7.97 11.41 14.20 17.50Private banksNumber of institutions 22 20 18 18 17Number of branches or offices 3,516 3,597 3,604 3,734 3,737Value of accounts (TRY billions)2 11.21 16.55 19.61 24.33 29.43Investment banksNumber of institutions 15 14 14 13 13Number of branches or offices 14 18 17 33 36Value of accounts (TRY billions)2 nav nav nav nav navSDIF-controlled banksNumber of institutions 6 2 2 1 1Number of branches or offices 408 203 175 1 1Value of accounts (TRY billions)2 0.67 1.42 0.45 0.07 0.05Participation banksNumber of institutions 5 5 5 5 4Number of branches or offices 115 118 189 255 292Value of accounts (TRY billions)2 nav nav nav nav 1.84Foreign banksNumber of institutions 15 15 13 13 13Number of branches or offices 212 201 208 196 393Value of accounts (TRY billions)2 0.27 0.89 1.09 1.53 2.07
Other institutions offering payment services to non-banksPTTNumber of institutions 1 1 1 1 1Number of branches or offices3 3,245 3,135 3,022 2,957 2,936Number of accounts (thousands)4 206 234 283 394 522Value of accounts (TRY billions) 0.00 0.00 0.00 0.00 0.00
Institutions offering payment services to non-banks (total)Number of institutions 68 61 57 55 53Number of branches or offices 10,249 9,381 9,293 9,433 9,526Number of accounts held by non-banks (thousands) 56,059 59,703 70,707 74,159 75,080of which: number of internet/PC-linked Value of accounts held by non-banks (TRY billions) 50.747 69.040 74.437 76.173 86.715
Memo:Electronic money institutionsNumber of institutions nav nav nav nav navOutstanding value on e-money storages issued by e-money institutions (TRY billions) nav nav nav nav nav1 Includes TRY and foreign currency accounts. 2 Sight deposit accounts in TRY and foreign currencies. 3 Includes centraland branch offices (source: www.ptt.gov.tr). 4 Postal chequing accounts only (source: www.ptt.gov.tr).
CPSS – Payment systems in Turkey, 2007 39

Table 6Payment card functions and accepting devices(thousands, end of year)
2001 2002 2003 2004 2005Cards issued in the country1
Cards with a cash function 34,456 38,198 43,536 48,421 54,239Cards with a debit function 31,657 35,057 39,563 43,085 48,243Cards with a delayed debit function nav nav nav nav navCards with a credit function 13,997 15,705 19,863 26,681 29,978Cards with an e-money function nav nav nav nav navof which: cards with an e-money function which have been loaded at least once nav nav nav nav nav
Total number of cards (irrespective of the number of functions on the card) 45,654 50,763 59,427 69,766 78,221of which: cards with a combined debit, cash and e-money function
Memo:Retailer cards nav nav nav nav nav
Terminals located in the countryATMs 12 12 13 14 15of which:
ATMs with a cash withdrawal function 12 12 13 14 15ATMs with a credit transfer function 12 12 13 14 15
POS terminals 365 496 662 912 1,140of which: EFTPOS terminals nap nap nap nap napE-money card terminals nav nav nav nav navof which:
e-money card loading/unloading terminals nav nav nav nav nave-money card payment terminals nav nav nav nav nav
1 Source: www.bkm.com.tr - Interbanks Card Center website.
CPSS – Payment systems in Turkey, 2007 40

Table 7Indicators of the use of payment instruments and terminals by non-banks: volume of transactions(millions, total for the year)
2001 2002 2003 2004 2005Transactions per type of payment instrumentCredit transfers nav nav nav nav navof which:
paper-based nav nav nav nav navnon-paper-based nav nav nav nav nav
Direct debits nav nav nav nav navCard payments with cards issued in the country 468.44 602.55 799.42 1,099.92 1,274.75of which:
payments by cards with a debit function 5.44 8.55 12.42 19.92 33.75payments by cards with a delayed debit nav nav nav nav navpayments by cards with a credit function 463 594 787 1,080 1,241
E-money payment transactions nav nav nav nav navof which:
by cards with an e-money function nav nav nav nav navthrough other e-money storages nav nav nav nav nav
Cheques1 25.69 25.29 26.22 25.35 23.52Post office cheques and credit transfers 11.53 16.15 16.49 19.49 20.67
Total number of transactions with payment instruments 505.66 643.99 842.13 1,144.76 1,318.94of which: cross-border transactions sent nav nav nav nav nav
Memo:Cross-border transactions received nav nav nav nav nav
Transactions per type of terminal2Total transactions at terminals in the country 763.78 936.85 1,187.35 1,569.86 1,822.12
Cash transactions 294.63 331.79 386.97 470.4 547.76ATM cash withdrawals 294.63 331.79 386.97 470.4 547.76ATM cash deposits nav nav nav nav nav
POS payment transactions (irrespective of type of card used) 469.15 605.06 800.38 1,099.46 1,274.36E-money card loading/unloading transactions nav nav nav nav nav
E-money card payment transactions nav nav nav nav nava) Transactions at terminals in the country by cards issued in the country 752 924 1,175 1,555 1,805
Cash transactions 288 326 381 463 539ATM cash withdrawals 288 326 381 463 539ATM cash deposits nav nav nav nav nav
POS payment transactions 464 598 794 1,092 1,266E-money card loading/unloading transactions nav nav nav nav nav
E-money card payment transactions nav nav nav nav navb) Transactions at terminals in the country by cards issued outside the country 11.78 12.85 12.35 14.86 17.123
Cash transactions 6.63 5.79 5.97 7.4 8.8of which:
ATM cash withdrawals 6.63 5.79 5.97 7.4 8.8ATM cash deposits nav nav nav nav nav
POS payment transactions 5.15 7.06 6.38 7.46 8.36E-money card loading/unloading transactions nav nav nav nav nav
E-money card payment transactions nav nav nav nav navc) Transactions at terminals outside the country by cards issued in the country 3.47 4.2 5.51 6.95 8.85
Cash transactions 0.61 0.53 0.53 0.76 1.28of which:
ATM cash withdrawals 0.61 0.53 0.53 0.76 1.28ATM cash deposits nav nav nav nav nav
POS payment transactions 2.86 3.67 4.98 6.19 7.57E-money card loading/unloading transactions nav nav nav nav navE-money card payment transactions nav nav nav nav nav
1 Only those cheques processed in the Interbank Clearing Houses. 2 Source: Interbank Cards Center (www.bkm.com.tr).
CPSS – Payment systems in Turkey, 2007 41
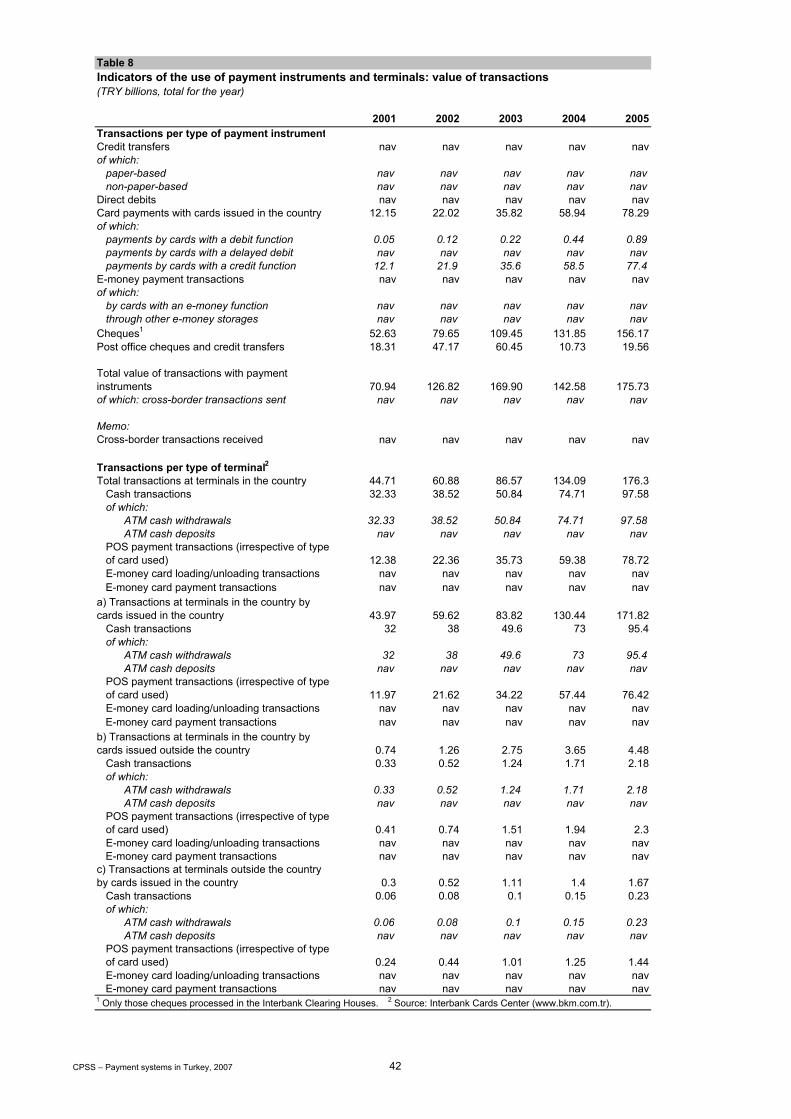
Table 8Indicators of the use of payment instruments and terminals: value of transactions(TRY billions, total for the year)
2001 2002 2003 2004 2005Transactions per type of payment instrumentCredit transfers nav nav nav nav navof which:
paper-based nav nav nav nav navnon-paper-based nav nav nav nav nav
Direct debits nav nav nav nav navCard payments with cards issued in the country 12.15 22.02 35.82 58.94 78.29of which:
payments by cards with a debit function 0.05 0.12 0.22 0.44 0.89payments by cards with a delayed debit nav nav nav nav navpayments by cards with a credit function 12.1 21.9 35.6 58.5 77.4
E-money payment transactions nav nav nav nav navof which:
by cards with an e-money function nav nav nav nav navthrough other e-money storages nav nav nav nav nav
Cheques1 52.63 79.65 109.45 131.85 156.17Post office cheques and credit transfers 18.31 47.17 60.45 10.73 19.56
Total value of transactions with payment instruments 70.94 126.82 169.90 142.58 175.73of which: cross-border transactions sent nav nav nav nav nav
Memo:Cross-border transactions received nav nav nav nav nav
Transactions per type of terminal2Total transactions at terminals in the country 44.71 60.88 86.57 134.09 176.3
Cash transactions 32.33 38.52 50.84 74.71 97.58of which:
ATM cash withdrawals 32.33 38.52 50.84 74.71 97.58ATM cash deposits nav nav nav nav nav
POS payment transactions (irrespective of type of card used) 12.38 22.36 35.73 59.38 78.72E-money card loading/unloading transactions nav nav nav nav nav
E-money card payment transactions nav nav nav nav nava) Transactions at terminals in the country by cards issued in the country 43.97 59.62 83.82 130.44 171.82
Cash transactions 32 38 49.6 73 95.4of which:
ATM cash withdrawals 32 38 49.6 73 95.4ATM cash deposits nav nav nav nav nav
POS payment transactions (irrespective of type of card used) 11.97 21.62 34.22 57.44 76.42E-money card loading/unloading transactions nav nav nav nav nav
E-money card payment transactions nav nav nav nav navb) Transactions at terminals in the country by cards issued outside the country 0.74 1.26 2.75 3.65 4.48
Cash transactions 0.33 0.52 1.24 1.71 2.18of which:
ATM cash withdrawals 0.33 0.52 1.24 1.71 2.18ATM cash deposits nav nav nav nav nav
POS payment transactions (irrespective of type of card used) 0.41 0.74 1.51 1.94 2.3E-money card loading/unloading transactions nav nav nav nav nav
E-money card payment transactions nav nav nav nav navc) Transactions at terminals outside the country by cards issued in the country 0.3 0.52 1.11 1.4 1.67
Cash transactions 0.06 0.08 0.1 0.15 0.23of which:
ATM cash withdrawals 0.06 0.08 0.1 0.15 0.23ATM cash deposits nav nav nav nav nav
POS payment transactions (irrespective of type of card used) 0.24 0.44 1.01 1.25 1.44E-money card loading/unloading transactions nav nav nav nav nav
E-money card payment transactions nav nav nav nav nav1 Only those cheques processed in the Interbank Clearing Houses. 2 Source: Interbank Cards Center (www.bkm.com.tr).
CPSS – Payment systems in Turkey, 2007 42

Table 9 Participation in selected interbank funds transfer systems(end of year)
2001 2002 2003 2004 2005Large-value payment systems
TIC-RTGSNumber of participants 68 59 55 51 50
Direct participants 68 59 55 51 50Credit institutions 67 58 54 50 49Central bank 1 1 1 1 1Other direct participants 0 0 0 0 0
Public administration 0 0 0 0 0Postal institution 0 0 0 0 0Clearing and settlement organisations 0 0 0 0 0Other financial institutions 0 0 0 0 0Other 0 0 0 0 0
Indirect participants nap nap nap nap nap
TCSNumber of participants nap 437 516 527 546
Direct participants nap 437 516 527 546Credit institutions nap 437 516 527 546Central bank 0 0 0 0 0Other direct participants 0 0 0 0 0
Public administration 0 0 0 0 0Postal institution 0 0 0 0 0Clearing and settlement organisations 0 0 0 0 0Other financial institutions 0 0 0 0 0Other 0 0 0 0 0
Indirect participants nap nap nap nap nap
Retail payment systems
ICHNumber of participants 52 50 49 44 42
Direct participants 52 50 49 44 42Credit institutions 51 49 48 43 41Central bank 1 1 1 1 1Other direct participants 0 0 0 0 0
Public administration 0 0 0 0 0Postal institution 0 0 0 0 0Clearing and settlement organisations 0 0 0 0 0Other financial institutions 0 0 0 0 0Other 0 0 0 0 0
Indirect participants nap nap nap nap nap
BKMNumber of participants 34 33 30 29 34
Direct participants 34 33 30 29 34Credit institutions 34 33 30 29 34Central bank 0 0 0 0 0Other direct participants 0 0 0 0 0
Public administration 0 0 0 0 0Postal institution 0 0 0 0 0Clearing and settlement organisations 0 0 0 0 0Other financial institutions 0 0 0 0 0Other 0 0 0 0 0
Indirect participants nap nap nap nap nap
CPSS – Payment systems in Turkey, 2007 43
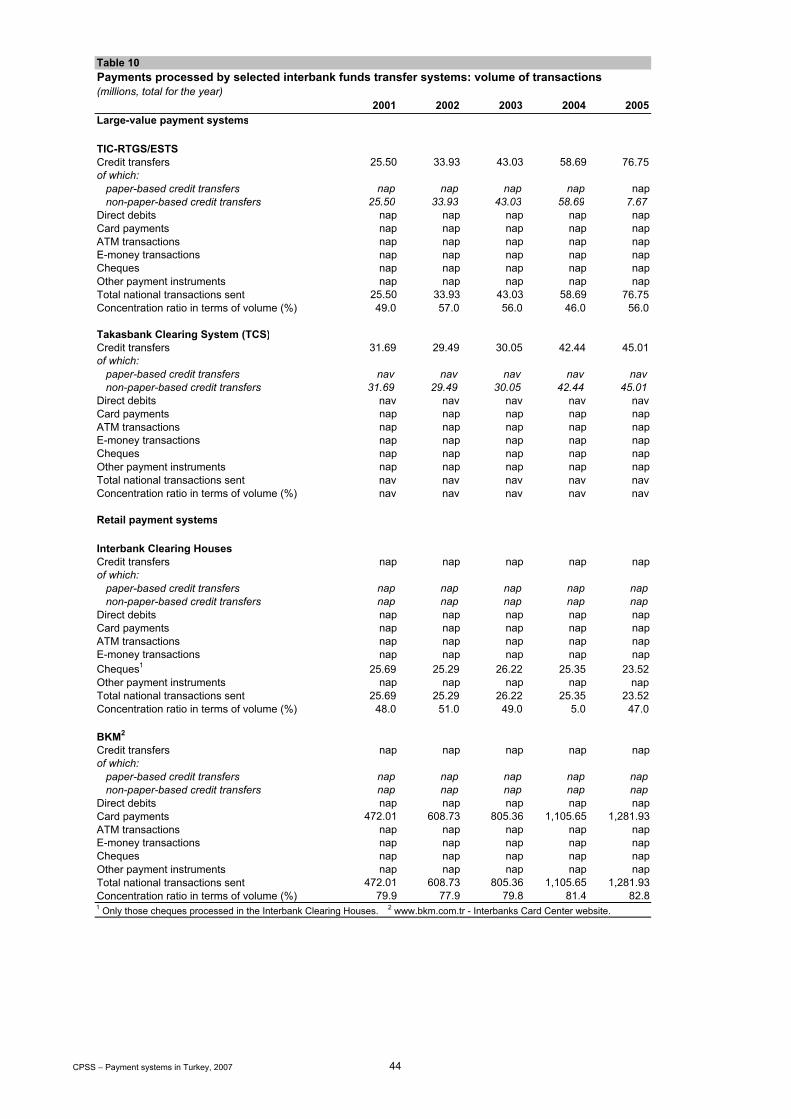
Table 10Payments processed by selected interbank funds transfer systems: volume of transactions(millions, total for the year)
2001 2002 2003 2004 2005Large-value payment systems
TIC-RTGS/ESTSCredit transfers 25.50 33.93 43.03 58.69 76.75of which:
paper-based credit transfers nap nap nap nap napnon-paper-based credit transfers 25.50 33.93 43.03 58.69 7.67
Direct debits nap nap nap nap napCard payments nap nap nap nap napATM transactions nap nap nap nap napE-money transactions nap nap nap nap napCheques nap nap nap nap napOther payment instruments nap nap nap nap napTotal national transactions sent 25.50 33.93 43.03 58.69 76.75Concentration ratio in terms of volume (%) 49.0 57.0 56.0 46.0 56.0
Takasbank Clearing System (TCS)Credit transfers 31.69 29.49 30.05 42.44 45.01of which:
paper-based credit transfers nav nav nav nav navnon-paper-based credit transfers 31.69 29.49 30.05 42.44 45.01
Direct debits nav nav nav nav navCard payments nap nap nap nap napATM transactions nap nap nap nap napE-money transactions nap nap nap nap napCheques nap nap nap nap napOther payment instruments nap nap nap nap napTotal national transactions sent nav nav nav nav navConcentration ratio in terms of volume (%) nav nav nav nav nav
Retail payment systems
Interbank Clearing HousesCredit transfers nap nap nap nap napof which:
paper-based credit transfers nap nap nap nap napnon-paper-based credit transfers nap nap nap nap nap
Direct debits nap nap nap nap napCard payments nap nap nap nap napATM transactions nap nap nap nap napE-money transactions nap nap nap nap napCheques1 25.69 25.29 26.22 25.35 23.52Other payment instruments nap nap nap nap napTotal national transactions sent 25.69 25.29 26.22 25.35 23.52Concentration ratio in terms of volume (%) 48.0 51.0 49.0 5.0 47.0
BKM2
Credit transfers nap nap nap nap napof which:
paper-based credit transfers nap nap nap nap napnon-paper-based credit transfers nap nap nap nap nap
Direct debits nap nap nap nap napCard payments 472.01 608.73 805.36 1,105.65 1,281.93ATM transactions nap nap nap nap napE-money transactions nap nap nap nap napCheques nap nap nap nap napOther payment instruments nap nap nap nap napTotal national transactions sent 472.01 608.73 805.36 1,105.65 1,281.93Concentration ratio in terms of volume (%) 79.9 77.9 79.8 81.4 82.81 Only those cheques processed in the Interbank Clearing Houses. 2 www.bkm.com.tr - Interbanks Card Center website.
CPSS – Payment systems in Turkey, 2007 44

Table 11Payments processed by selected interbank funds transfer systems: value of transactions(TRY billions, total for the year)
2001 2002 2003 2004 2005Large-value payment systems
TIC-RTGS/ESTSPayment transactions sent (credit transfers) 2,784.09 3,379.98 4,686.85 5,970.00 7,844.21Concentration ratio in terms of value (%) 62.0 66.0 71.0 66.0 60.0
Takasbank Clearing System (TCS)Payment transactions sent (credit transfers)1 98.07 119.15 171.30 229.43 324.00Concentration ratio in terms of value (%) nav nav nav nav nav
Retail payment systems
Interbank Clearing HousesPayment transactions sent (cheques)2 52.63 79.65 109.45 131.85 156.17Concentration ratio in terms of value (%) 30.0 35.0 34.0 33.0 36.0
BKM3
Payment transactions sent (card payments) 12.62 22.80 36.74 60.63 80.16Concentration ratio in terms of value (%) 79.9 77.9 80.0 81.0 83.0
Table 12a
(thousands, total for the year)2001 2002 2003 2004 2005
Trading platformsIMKB (stock contracts)1 31,188 28,956 29,320 41,508 43,940IMKB (DDN contracts)2 499 538 729 936 1,075
Clearing housesTCS (stock contracts cleared) 31,188 28,956 29,320 41,508 43,940TCS (DDN contracts cleared) 498 536 726 934 1,073
Securities settlement systemsTIC-ESTS3
Volume of settlement instructions 234 153 150 175 172
Takasbank Clearing System (TCS)TCS (stock settlement transactions) nap nap nap nap napTCS (DNN settlement transactions) 498 536 726 934 1,073
1 Total value for stock and DNN (Domestic Debt Note) DDN settlement. 2 Only those cheques processed in the InterbankClearing Houses. 3 Source: www.bkm.com.tr - Interbanks Card Center website.
Instructions handled by trading platforms, clearing houses and securities settlement systems: volume of transactions
1 Number of stock trading contracts between two participants. This number does not contain the number of stocks sold or bought.2 Number of DNN (Domestic Debt Note) trading contracts between two participants. 3 TIC-ESTS went live at end-October 2000.
CPSS – Payment systems in Turkey, 2007 45

Table 12b
(TRY billions, total for the year)2001 2002 2003 2004 2005
Trading platformsIMKB (stock transaction value) 92.11 107.15 146.22 210.45 268.54IMKB (DDN transaction value in TRY)1 735.99 838.23 1,252.77 1,923.50 2,340.41
Clearing housesTCS (stock transaction value) 91.90 107.04 146.33 210.38 270.00TCS (DDN transaction value) 736.00 838.00 1,253.00 1,916.00 2,339.00
Securities settlement systems
TIC-ESTS2,3
Value of settlement instructions 3,451.78 1,913.55 2,309.73 2,572.52 2,448.03
Takasbank Clearing System (TCS)TCS (Stock transfer transaction value) 28.00 33.00 40.00 64.00 91.00TCS ( DDN transfer transaction value) 367.00 366.00 433.00 655.00 1,069.00
Table 12c
(end of year)2001 2002 2003 2004 2005
Trading platformsIMKBBanks 58 48 44 43 41
investment 12 11 11 11 11commercial 46 37 33 32 30
Brokers/dealers 126 119 117 112 107domesticforeign
Others 0 0 0 0 0Total 184 167 161 155 148
Securities settlement systemsTIC-ESTSBanks 68 59 55 51 50
domestic 52 43 41 38 38foreign 16 16 14 13 12
Brokers/dealers 0 0 0 0 0domestic 0 0 0 0 0foreign 0 0 0 0 0
Others 0 0 0 0 0Total 68 59 55 51 50
TCS (members in ISE Stock Market Settlement System)Banks nav 26 18 17 15
domesticforeign
Brokers/dealers nav 115 112 101 100domesticforeign
Others Pension funds nav 0 72 81 96 Mutual funds & investment trust companies nav 277 292 307 313 Asset management companies nav 19 22 21 20 ISE mutual funds nav nav nav nav 2Total nav 437 516 527 546
Instructions handled by trading platforms, clearing houses and securities settlement systems: value of transactions
Number of participants in trading platforms, clearing houses and securities settlement systems
1 Trade value between two counterparties. 2 Nominal value of transactions. 3 TIC-ESTS went live in 2000.
CPSS – Payment systems in Turkey, 2007 46
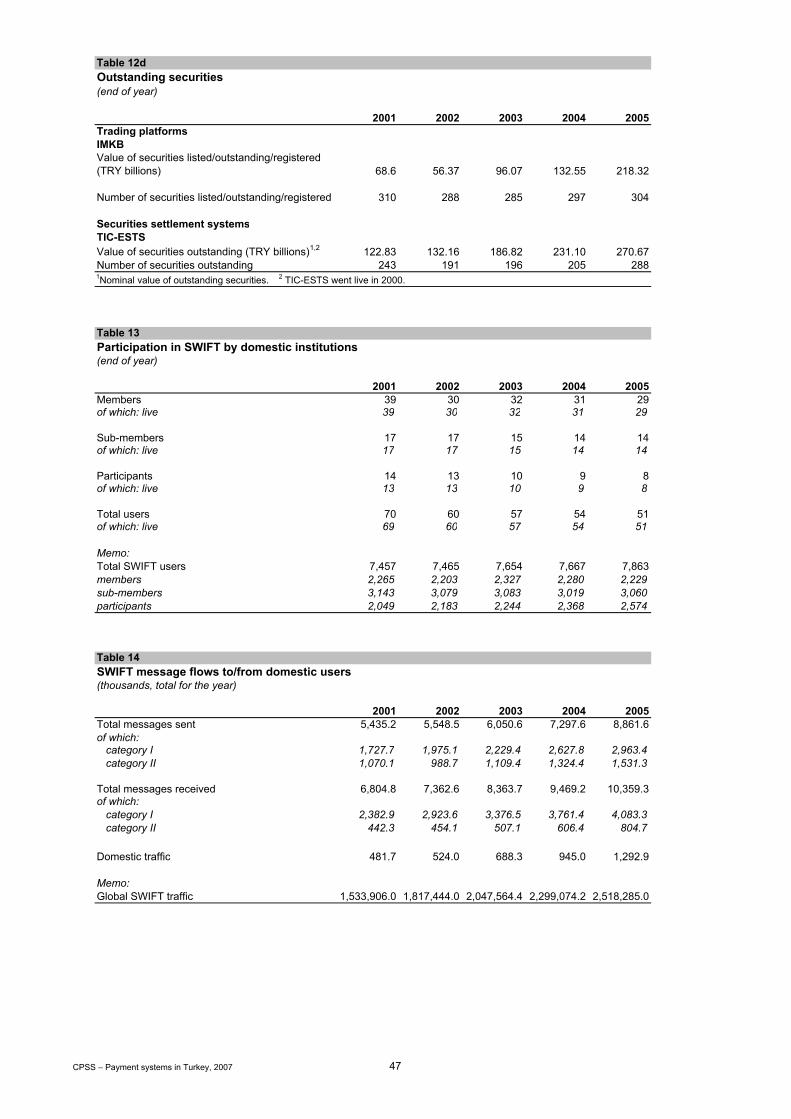
Table 12dOutstanding securities(end of year)
2001 2002 2003 2004 2005Trading platformsIMKBValue of securities listed/outstanding/registered (TRY billions) 68.6 56.37 96.07 132.55 218.32
Number of securities listed/outstanding/registered 310 288 285 297 304
Securities settlement systemsTIC-ESTSValue of securities outstanding (TRY billions)1,2 122.83 132.16 186.82 231.10 270.67Number of securities outstanding 243 191 196 205 288
Table 13Participation in SWIFT by domestic institutions(end of year)
2001 2002 2003 2004 2005Members 39 30 32 31 29of which: live 39 30 32 31 29
Sub-members 17 17 15 14 14of which: live 17 17 15 14 14
Participants 14 13 10 9 8of which: live 13 13 10 9 8
Total users 70 60 57 54 51of which: live 69 60 57 54 51
Memo:Total SWIFT users 7,457 7,465 7,654 7,667 7,863members 2,265 2,203 2,327 2,280 2,229sub-members 3,143 3,079 3,083 3,019 3,060participants 2,049 2,183 2,244 2,368 2,574
Table 14SWIFT message flows to/from domestic users(thousands, total for the year)
2001 2002 2003 2004 2005Total messages sent 5,435.2 5,548.5 6,050.6 7,297.6 8,861.6of which:
category I 1,727.7 1,975.1 2,229.4 2,627.8 2,963.4category II 1,070.1 988.7 1,109.4 1,324.4 1,531.3
Total messages received 6,804.8 7,362.6 8,363.7 9,469.2 10,359.3of which:
category I 2,382.9 2,923.6 3,376.5 3,761.4 4,083.3category II 442.3 454.1 507.1 606.4 804.7
Domestic traffic 481.7 524.0 688.3 945.0 1,292.9
Memo:Global SWIFT traffic 1,533,906.0 1,817,444.0 2,047,564.4 2,299,074.2 2,518,285.0
1Nominal value of outstanding securities. 2 TIC-ESTS went live in 2000.
CPSS – Payment systems in Turkey, 2007 47

CPSS – Payment systems in Turkey, 2007 49
Comparative tables


2001 2002 2003 2004 2005 2001 2002 2003 2004 2005Turkey 145 182 238 301 361 68.4 69.4 70.4 71.3 72.1Belgium 232 252 310 360 371 10.3 10.3 10.4 10.4 10.5Canada 715 735 869 992 1,133 31.0 31.4 31.7 32.0 32.3France 1,340 1,460 1,801 2,061 2,124 61.1 61.5 61.9 62.3 62.7Germany 1,891 2,020 2,440 2,742 2,783 82.3 82.5 82.5 82.5 82.5Hong Kong SAR 167 164 158 166 178 6.7 6.7 6.8 6.8 6.8Italy 1,117 1,221 1,508 1,728 1,768 57.3 57.5 57.5 57.6 58.1Japan 4,100 3,926 4,229 4,607 4,550 127.3 127.5 127.7 127.8 127.8Netherlands 401 438 538 609 628 16.0 16.1 16.2 16.3 16.3Singapore 86 88 92 107 117 4.1 4.2 4.2 4.2 4.3Sweden 221 244 304 349 357 8.9 8.9 9.0 9.0 9.0Switzerland 250 277 323 360 366 7.3 7.3 7.4 7.5 7.5United Kingdom 1,435 1,573 1,813 2,155 2,228 59.1 59.3 59.6 59.8 60.2United States 10,128 10,470 10,971 11,734 12,487 285.3 288.2 291.1 293.9 296.6CPSS1 22,083 22,869 25,357 27,970 29,089 757.0 761.5 765.8 770.0 774.7
2001 2002 2003 2004 2005 2001 2002 2003 2004 2005Turkey 2,120 2,624 3,381 4,223 5,014 68.5 29.7 18.4 9.3 7.7Belgium 22,533 24,422 29,890 34,527 35,406 2.4 1.6 1.5 1.9 2.5Canada 23,050 23,433 27,427 31,029 35,078 2.5 2.3 2.8 1.8 2.2France 21,920 23,722 29,072 33,073 33,874 1.8 1.9 2.2 2.3 1.9Germany 22,965 24,491 29,572 33,240 33,754 1.9 1.4 1.0 1.8 1.9Hong Kong SAR 24,744 24,340 23,427 24,394 26,000 -1.6 -3.0 -2.6 -0.4 0.9Italy 19,483 21,241 26,229 30,019 30,404 2.3 2.6 2.8 2.3 2.2Japan 32,200 30,798 33,122 36,058 35,616 -0.8 -0.9 -0.2 0.0 -0.3Netherlands 24,973 27,156 33,192 37,400 38,479 5.1 3.9 2.2 1.4 1.5Singapore 20,740 21,182 22,066 25,205 26,891 1.0 -0.4 0.5 1.7 0.5Sweden 24,870 27,340 33,963 38,827 39,548 2.7 1.9 2.3 1.0 0.8Switzerland 34,385 37,690 43,642 48,321 48,748 1.0 0.6 0.6 0.8 1.2United Kingdom 24,279 26,524 30,439 36,016 36,999 1.2 1.3 1.4 1.3 2.0United States 35,495 36,326 37,690 39,925 42,095 2.3 1.3 2.0 2.5 2.9CPSS1 29,172 30,030 33,110 36,323 37,548 1.6 1.1 1.6 1.8 2.0
2001 2002 2003 2004 2005 2001 2002 2003 2004 2005Turkey 1.2300 1.5244 1.5124 1.4292 1.3473 1.4465 1.6424 1.4026 1.3486 1.3495Belgium 1.1175 1.0609 0.8858 0.8049 0.8051 1.1347 0.9536 0.7918 0.7342 0.8477Canada 1.5489 1.5702 1.4004 1.3012 1.2112 1.5928 1.5776 1.2965 1.2020 1.1630France 1.1175 1.0609 0.8858 0.8049 0.8051 1.1347 0.9536 0.7918 0.7342 0.8477Germany 1.1175 1.0609 0.8858 0.8049 0.8051 1.1347 0.9536 0.7918 0.7342 0.8477Hong Kong SAR 7.7990 7.7990 7.7870 7.7880 7.7773 7.7970 7.7980 7.7630 7.7740 7.7525Italy 1.1175 1.0609 0.8858 0.8049 0.8051 1.1347 0.9536 0.7918 0.7342 0.8477Japan 121.41 125.14 115.93 108.16 110.18 130.86 118.61 106.93 102.53 117.74Netherlands 1.1175 1.0609 0.8858 0.8049 0.8051 1.1347 0.9536 0.7918 0.7342 0.8477Singapore 1.7917 1.7906 1.7422 1.6903 1.6646 1.8510 1.7365 1.7008 1.6338 1.6642Sweden 10.3432 9.7194 8.0838 7.3453 7.4780 10.5540 8.7278 7.1892 6.6226 7.9584Switzerland 1.6866 1.5556 1.3453 1.2419 1.2458 1.6782 1.4410 1.2664 1.1453 1.3047United Kingdom 0.6947 0.6665 0.6125 0.5460 0.5504 0.6905 0.6203 0.5580 0.5176 0.5809United States nap nap nap nap nap nap nap nap nap napCPSS nap nap nap nap nap nap nap nap nap nap
GDP per capita (USD) 1 CPI inflation (per cent, yearly average)
Exchange rate to the USD (yearly average) Exchange rate to the USD (end of year)
Table 1 (cont)
Table 1
Table 1 (cont)
GDP (USD billions) 1 Population (millions, yearly average)
Basic statistical data
Note: Please refer to the individual country tables for a detailed explanation.1 Converted at yearly average exchange rates. CPSS: 1 Sum or average excluding those countries for which data are not available.
CPSS – Payment systems in Turkey, 2007 51

(end of year)
2001 2002 2003 2004 2005 2001 2002 2003 2004 2005Turkey 3.7 4.7 7.7 10.1 14.9 53.9 67.7 109.4 141.4 207.4Belgium 8.5 nap nap nap nap 827.2 nap nap nap napCanada 26.8 28.7 35.8 40.4 43.5 863.8 914.3 1,129.2 1,263.0 1,346.2France 30.1 nap nap nap nap 493.1 nap nap nap napGermany 73.1 nap nap nap nap 887.3 nap nap nap napHong Kong SAR 14.6 16.0 18.1 19.7 20.2 2,162.7 2,376.0 2,680.7 2,902.4 2,947.7Italy 58.5 nap nap nap nap 1,019.5 nap nap nap napJapan 560.1 673.1 760.6 804.1 711.5 4,399.6 5,280.2 5,956.8 6,293.3 5,569.2Netherlands 10.0 nap nap nap nap 625.7 nap nap nap napSingapore 7.1 7.8 8.3 9.2 9.6 1,709.8 1,865.9 1,972.6 2,179.8 2,205.0Sweden 10.1 12.3 15.2 16.4 14.0 1,140.8 1,373.4 1,691.6 1,828.1 1,545.6Switzerland 25.1 29.1 33.9 36.8 33.6 3,449.3 3,963.6 4,577.6 4,936.0 4,478.5United Kingdom 50.2 59.1 68.9 79.5 73.0 848.7 996.8 1,157.3 1,327.9 1,212.9United States 643.3 687.5 724.2 754.9 794.0 2,254.6 2,385.5 2,487.8 2,568.3 2,676.6Euro area nap 412.1 569.0 704.6 687.4 nap 1,338.0 1,836.1 2,259.3 2,191.9CPSS excl euro area countries1 1,337.3 1,513.6 1,664.9 1,761.0 1,699.3 2,524.0 2,836.8 3,098.6 3,255.3 3,120.2CPSS incl euro area1 nap 1,925.7 2,233.9 2,465.6 2,386.6 nap 2,288.3 2,636.8 2,891.1 2,781.0
2001 2002 2003 2004 2005 2001 2002 2003 2004 2005Turkey 2.5 2.6 3.2 3.3 4.1 46.9 48.8 46.9 47.2 54.7Belgium 3.7 nap nap nap nap 14.0 nap nap nap napCanada 3.9 3.9 3.8 3.8 3.7 14.8 14.7 14.2 13.6 13.3France 2.3 nap nap nap nap 8.4 nap nap nap napGermany 3.9 nap nap nap nap 13.8 nap nap nap napHong Kong SAR 8.7 9.8 11.4 11.9 11.3 49.4 48.0 39.7 37.2 44.9Italy 5.3 nap nap nap nap 12.6 nap nap nap napJapan 14.7 16.3 16.6 16.5 16.7 26.0 22.9 22.4 21.8 21.0Netherlands 2.5 nap nap nap nap 7.1 nap nap nap napSingapore 8.5 8.5 8.7 8.4 8.2 36.3 37.8 36.3 34.2 34.6Sweden 4.7 4.5 4.4 4.2 4.2 13.0 12.5 12.1 11.5 10.2Switzerland 10.0 9.7 9.9 9.4 9.6 19.1 17.4 14.8 15.3 15.1United Kingdom 3.5 3.5 3.5 3.5 3.5 5.3 5.2 4.9 4.9 4.6United States 6.4 6.6 6.6 6.4 6.4 53.2 55.2 54.4 53.9 56.8Euro area nap 5.4 6.0 6.7 7.3 nap 15.7 16.5 17.5 16.7CPSS excl euro area countries1 7.8 8.7 8.9 8.6 7.9 28.2 26.0 24.5 23.5 23.8CPSS incl euro area1 nap 7.9 8.2 8.2 7.6 nap 22.8 21.8 21.4 21.2
Value per inhabitant (USD) 1
Value as a percentage of GDP Value as a percentage of narrow money
Total value (USD billions) 1
1 Converted at end-of-year exchange rates. CPSS excl euro area countries/incl euro area: 1 Sum or average excluding those countries for which data are not available.
Banknotes and coin in circulationTable 2
Note: Please refer to the individual country tables for a detailed explanation.
Table 2 (cont)
CPSS – Payment systems in Turkey, 2007 52
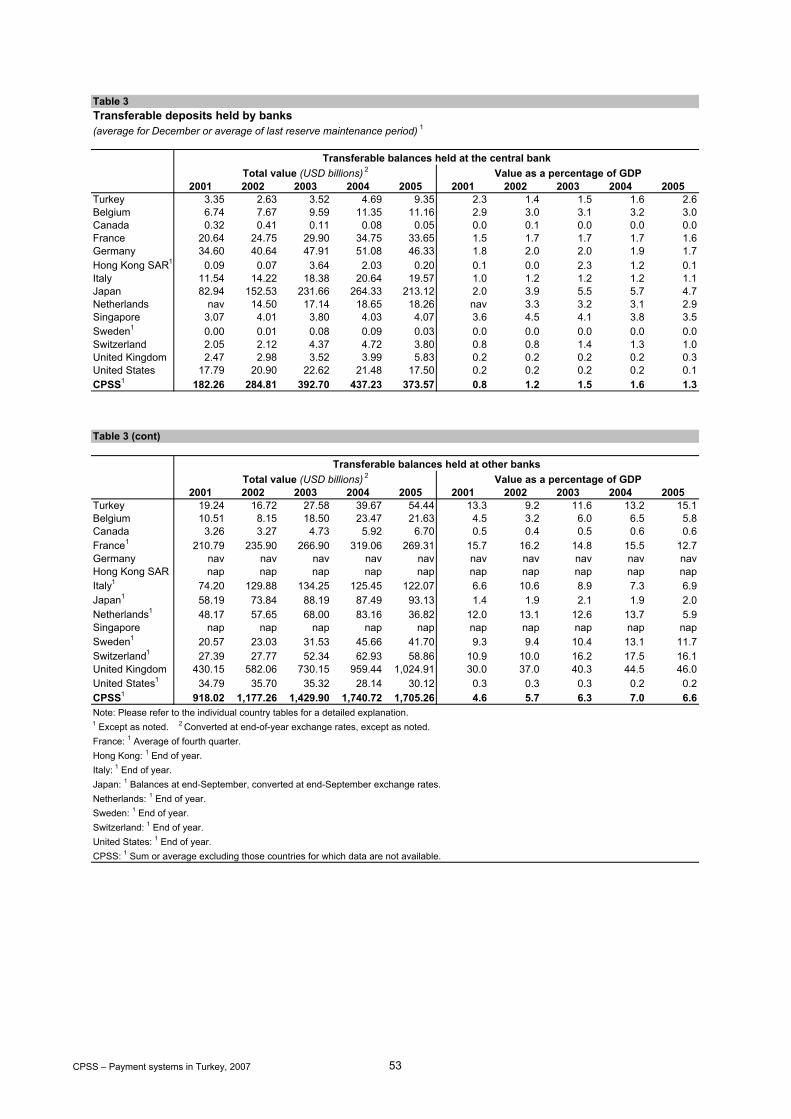
(average for December or average of last reserve maintenance period) 1
2001 2002 2003 2004 2005 2001 2002 2003 2004 2005Turkey 3.35 2.63 3.52 4.69 9.35 2.3 1.4 1.5 1.6 2.6Belgium 6.74 7.67 9.59 11.35 11.16 2.9 3.0 3.1 3.2 3.0Canada 0.32 0.41 0.11 0.08 0.05 0.0 0.1 0.0 0.0 0.0France 20.64 24.75 29.90 34.75 33.65 1.5 1.7 1.7 1.7 1.6Germany 34.60 40.64 47.91 51.08 46.33 1.8 2.0 2.0 1.9 1.7Hong Kong SAR1 0.09 0.07 3.64 2.03 0.20 0.1 0.0 2.3 1.2 0.1Italy 11.54 14.22 18.38 20.64 19.57 1.0 1.2 1.2 1.2 1.1Japan 82.94 152.53 231.66 264.33 213.12 2.0 3.9 5.5 5.7 4.7Netherlands nav 14.50 17.14 18.65 18.26 nav 3.3 3.2 3.1 2.9Singapore 3.07 4.01 3.80 4.03 4.07 3.6 4.5 4.1 3.8 3.5Sweden1 0.00 0.01 0.08 0.09 0.03 0.0 0.0 0.0 0.0 0.0Switzerland 2.05 2.12 4.37 4.72 3.80 0.8 0.8 1.4 1.3 1.0United Kingdom 2.47 2.98 3.52 3.99 5.83 0.2 0.2 0.2 0.2 0.3United States 17.79 20.90 22.62 21.48 17.50 0.2 0.2 0.2 0.2 0.1CPSS1 182.26 284.81 392.70 437.23 373.57 0.8 1.2 1.5 1.6 1.3
2001 2002 2003 2004 2005 2001 2002 2003 2004 2005Turkey 19.24 16.72 27.58 39.67 54.44 13.3 9.2 11.6 13.2 15.1Belgium 10.51 8.15 18.50 23.47 21.63 4.5 3.2 6.0 6.5 5.8Canada 3.26 3.27 4.73 5.92 6.70 0.5 0.4 0.5 0.6 0.6France1 210.79 235.90 266.90 319.06 269.31 15.7 16.2 14.8 15.5 12.7Germany nav nav nav nav nav nav nav nav nav navHong Kong SAR nap nap nap nap nap nap nap nap nap napItaly1 74.20 129.88 134.25 125.45 122.07 6.6 10.6 8.9 7.3 6.9Japan1 58.19 73.84 88.19 87.49 93.13 1.4 1.9 2.1 1.9 2.0Netherlands1 48.17 57.65 68.00 83.16 36.82 12.0 13.1 12.6 13.7 5.9Singapore nap nap nap nap nap nap nap nap nap napSweden1 20.57 23.03 31.53 45.66 41.70 9.3 9.4 10.4 13.1 11.7Switzerland1 27.39 27.77 52.34 62.93 58.86 10.9 10.0 16.2 17.5 16.1United Kingdom 430.15 582.06 730.15 959.44 1,024.91 30.0 37.0 40.3 44.5 46.0United States1 34.79 35.70 35.32 28.14 30.12 0.3 0.3 0.3 0.2 0.2CPSS1 918.02 1,177.26 1,429.90 1,740.72 1,705.26 4.6 5.7 6.3 7.0 6.6
Hong Kong: 1 End of year.
Switzerland: 1 End of year.
France: 1 Average of fourth quarter.
United States: 1 End of year.
Transferable balances held at the central bankTotal value (USD billions) 2 Value as a percentage of GDP
Table 3 (cont)
Italy: 1 End of year.
Netherlands: 1 End of year.Sweden: 1 End of year.
1 Except as noted. 2 Converted at end-of-year exchange rates, except as noted.
CPSS: 1 Sum or average excluding those countries for which data are not available.
Value as a percentage of GDPTotal value (USD billions) 2
Table 3Transferable deposits held by banks
Transferable balances held at other banks
Note: Please refer to the individual country tables for a detailed explanation.
Japan: 1 Balances at end-September, converted at end-September exchange rates.
CPSS – Payment systems in Turkey, 2007 53
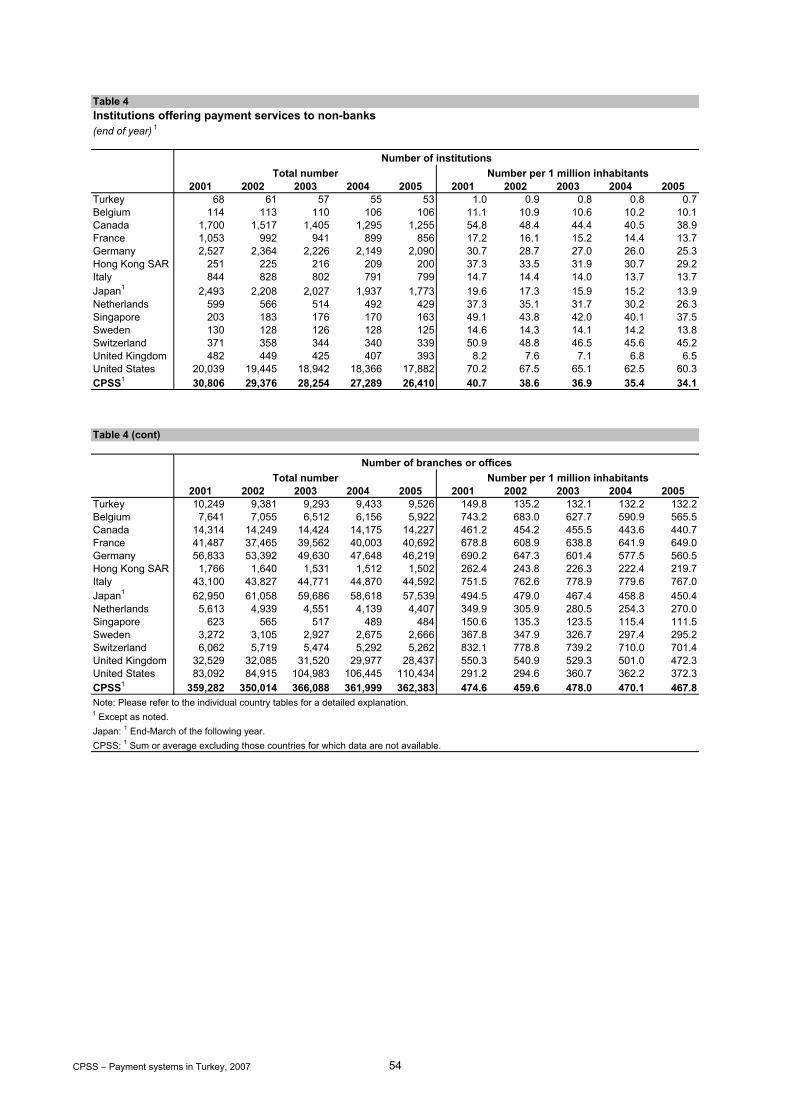
(end of year) 1
2001 2002 2003 2004 2005 2001 2002 2003 2004 2005Turkey 68 61 57 55 53 1.0 0.9 0.8 0.8 0.7Belgium 114 113 110 106 106 11.1 10.9 10.6 10.2 10.1Canada 1,700 1,517 1,405 1,295 1,255 54.8 48.4 44.4 40.5 38.9France 1,053 992 941 899 856 17.2 16.1 15.2 14.4 13.7Germany 2,527 2,364 2,226 2,149 2,090 30.7 28.7 27.0 26.0 25.3Hong Kong SAR 251 225 216 209 200 37.3 33.5 31.9 30.7 29.2Italy 844 828 802 791 799 14.7 14.4 14.0 13.7 13.7Japan1 2,493 2,208 2,027 1,937 1,773 19.6 17.3 15.9 15.2 13.9Netherlands 599 566 514 492 429 37.3 35.1 31.7 30.2 26.3Singapore 203 183 176 170 163 49.1 43.8 42.0 40.1 37.5Sweden 130 128 126 128 125 14.6 14.3 14.1 14.2 13.8Switzerland 371 358 344 340 339 50.9 48.8 46.5 45.6 45.2United Kingdom 482 449 425 407 393 8.2 7.6 7.1 6.8 6.5United States 20,039 19,445 18,942 18,366 17,882 70.2 67.5 65.1 62.5 60.3CPSS1 30,806 29,376 28,254 27,289 26,410 40.7 38.6 36.9 35.4 34.1
2001 2002 2003 2004 2005 2001 2002 2003 2004 2005Turkey 10,249 9,381 9,293 9,433 9,526 149.8 135.2 132.1 132.2 132.2Belgium 7,641 7,055 6,512 6,156 5,922 743.2 683.0 627.7 590.9 565.5Canada 14,314 14,249 14,424 14,175 14,227 461.2 454.2 455.5 443.6 440.7France 41,487 37,465 39,562 40,003 40,692 678.8 608.9 638.8 641.9 649.0Germany 56,833 53,392 49,630 47,648 46,219 690.2 647.3 601.4 577.5 560.5Hong Kong SAR 1,766 1,640 1,531 1,512 1,502 262.4 243.8 226.3 222.4 219.7Italy 43,100 43,827 44,771 44,870 44,592 751.5 762.6 778.9 779.6 767.0Japan1 62,950 61,058 59,686 58,618 57,539 494.5 479.0 467.4 458.8 450.4Netherlands 5,613 4,939 4,551 4,139 4,407 349.9 305.9 280.5 254.3 270.0Singapore 623 565 517 489 484 150.6 135.3 123.5 115.4 111.5Sweden 3,272 3,105 2,927 2,675 2,666 367.8 347.9 326.7 297.4 295.2Switzerland 6,062 5,719 5,474 5,292 5,262 832.1 778.8 739.2 710.0 701.4United Kingdom 32,529 32,085 31,520 29,977 28,437 550.3 540.9 529.3 501.0 472.3United States 83,092 84,915 104,983 106,445 110,434 291.2 294.6 360.7 362.2 372.3CPSS1 359,282 350,014 366,088 361,999 362,383 474.6 459.6 478.0 470.1 467.8
Table 4 (cont)
Number of branches or offices
Japan: 1 End-March of the following year.
Note: Please refer to the individual country tables for a detailed explanation.
Total number Number per 1 million inhabitants
Number of institutions
Table 4
Total number Number per 1 million inhabitants
Institutions offering payment services to non-banks
1 Except as noted.
CPSS: 1 Sum or average excluding those countries for which data are not available.
CPSS – Payment systems in Turkey, 2007 54

(end of year) 1
2001 2002 2003 2004 2005 2001 2002 2003 2004 2005Turkey 56,059 59,703 70,707 74,159 75,080 0.82 0.86 1.00 1.04 1.04Belgium 12,536 12,697 12,984 12,679 13,200 1.22 1.23 1.25 1.22 1.26Canada nav nav nav nav nav nav nav nav nav navFrance 68,156 68,360 68,820 69,749 70,816 1.12 1.11 1.11 1.12 1.13Germany 88,925 87,906 83,957 84,529 85,479 1.08 1.07 1.02 1.02 1.04Hong Kong SAR nav nav nav nav nav nav nav nav nav navItaly1 33,571 33,957 33,259 32,848 33,091 0.59 0.59 0.58 0.57 0.57Japan1 536,001 537,061 536,402 532,658 528,939 4.21 4.21 4.20 4.17 4.14Netherlands 22,600 20,800 22,800 22,900 21,622 1.41 1.29 1.41 1.41 1.32Singapore nav nav nav nav nav nav nav nav nav navSweden nav nav nav nav nav nav nav nav nav navSwitzerland nav nav nav nav nav nav nav nav nav navUnited Kingdom 157,488 157,579 141,902 142,216 134,054 2.66 2.66 2.38 2.38 2.23United States nav nav nav nav nav nav nav nav nav navCPSS1 919,278 918,360 900,125 897,579 887,201 2.20 2.19 2.14 2.13 2.10
2001 2002 2003 2004 2005 2001 2002 2003 2004 2005Turkey 35 42 53 56 64 513 606 754 792 892Belgium 68 81 110 128 129 6,598 7,844 10,587 12,294 12,355Canada 158 170 219 260 287 5,098 5,420 6,931 8,131 8,901France 334 398 488 557 540 5,463 6,463 7,882 8,935 8,604Germany 495 639 829 931 920 6,009 7,752 10,052 11,291 11,152Hong Kong SAR nav nav nav nav nav nav nav nav nav navItaly1 423 547 683 781 730 7,373 9,520 11,891 13,577 12,554Japan1 2,160 2,784 3,319 3,391 3,231 16,965 21,842 25,996 26,535 25,291Netherlands 134 169 207 232 227 8,331 10,464 12,760 14,251 13,938Singapore 104 109 117 130 138 25,222 26,201 28,058 30,596 31,842Sweden 112 143 180 209 194 12,646 15,985 20,115 23,217 21,516Switzerland 63 84 131 135 126 8,588 11,445 17,627 18,133 16,817United Kingdom 3,119 4,146 5,030 6,041 6,472 52,763 69,897 84,469 100,963 107,495United States 874 847 877 915 902 3,063 2,940 3,014 3,113 3,041CPSS1 8,044 10,119 12,193 13,710 13,897 10,721 13,406 16,063 17,963 18,099
Value per inhabitant (USD) 2
Table 5Transferable deposits held by non-banks
Table 5 (cont)
Number of deposit accountsTotal number of accounts (thousands) Number of accounts per inhabitant
Value of deposit accountsTotal value (USD billions) 2
CPSS – Payment systems in Turkey, 2007 55

2001 2002 2003 2004 2005Turkey 24.2 23.1 22.3 18.8 17.8Belgium 29.7 28.9 31.7 32.5 36.7Canada 22.7 23.2 23.4 24.2 24.4France 25.3 24.5 24.2 24.6 26.7Germany 26.6 28.5 30.4 31.0 34.8Hong Kong SAR nav nav nav nav navItaly1 38.4 40.3 40.5 41.3 43.5Japan1 57.5 67.2 70.3 72.7 75.8Netherlands 33.9 34.6 34.4 34.8 38.1Singapore 125.6 120.0 124.1 117.3 118.4Sweden 51.9 52.5 52.7 53.9 57.9Switzerland 24.9 28.1 38.0 34.6 36.1United Kingdom 216.0 245.2 252.8 265.8 306.7United States 8.6 8.1 8.0 7.8 7.2CPSS1 36.7 44.6 48.4 49.3 48.1
Japan: 1 March of the following year. Values are converted at March (followingyear) exchange rates.
Note: Please refer to the individual country tables for a detailed explanation.
CPSS: 1 Sum or average excluding those countries for which data are notavailable.
1 Except as noted. 2 Converted at end-of-year exchange rates, except as noted. Italy: 1 Only deposits held at banks.
Value of deposit accounts as a percentage of GDP
Table 5 (cont)
CPSS – Payment systems in Turkey, 2007 56
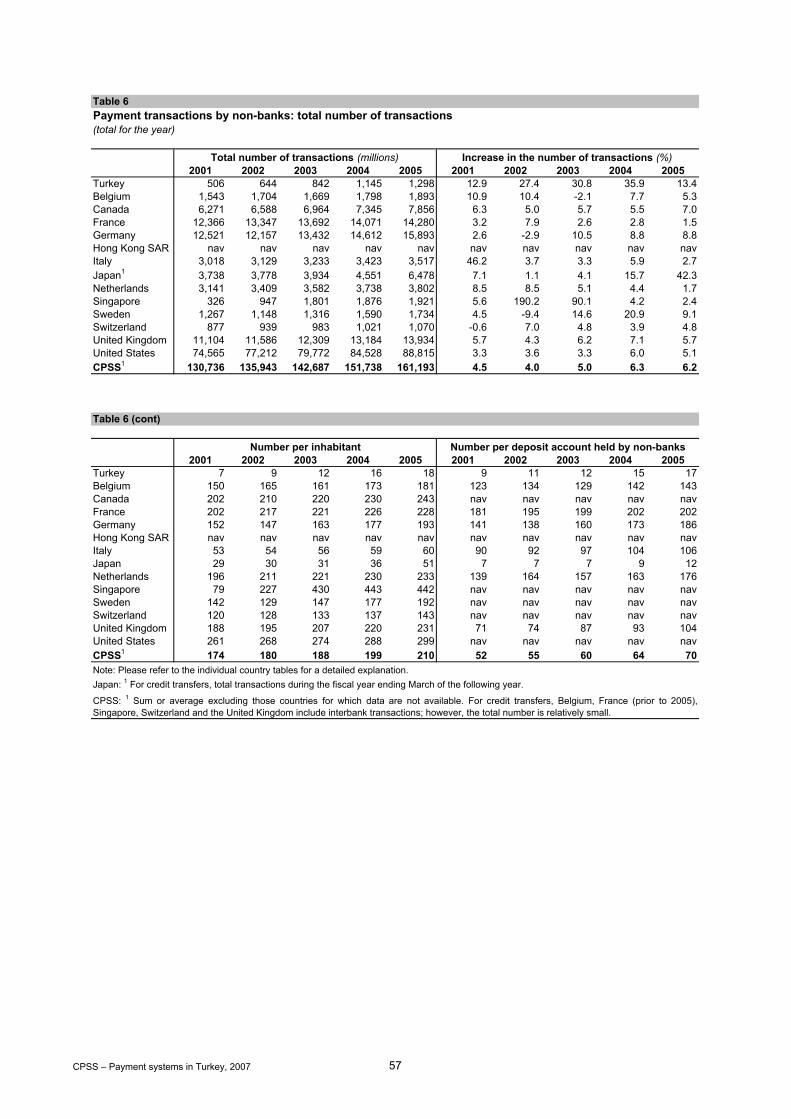
(total for the year)
2001 2002 2003 2004 2005 2001 2002 2003 2004 2005Turkey 506 644 842 1,145 1,298 12.9 27.4 30.8 35.9 13.4Belgium 1,543 1,704 1,669 1,798 1,893 10.9 10.4 -2.1 7.7 5.3Canada 6,271 6,588 6,964 7,345 7,856 6.3 5.0 5.7 5.5 7.0France 12,366 13,347 13,692 14,071 14,280 3.2 7.9 2.6 2.8 1.5Germany 12,521 12,157 13,432 14,612 15,893 2.6 -2.9 10.5 8.8 8.8Hong Kong SAR nav nav nav nav nav nav nav nav nav navItaly 3,018 3,129 3,233 3,423 3,517 46.2 3.7 3.3 5.9 2.7Japan1 3,738 3,778 3,934 4,551 6,478 7.1 1.1 4.1 15.7 42.3Netherlands 3,141 3,409 3,582 3,738 3,802 8.5 8.5 5.1 4.4 1.7Singapore 326 947 1,801 1,876 1,921 5.6 190.2 90.1 4.2 2.4Sweden 1,267 1,148 1,316 1,590 1,734 4.5 -9.4 14.6 20.9 9.1Switzerland 877 939 983 1,021 1,070 -0.6 7.0 4.8 3.9 4.8United Kingdom 11,104 11,586 12,309 13,184 13,934 5.7 4.3 6.2 7.1 5.7United States 74,565 77,212 79,772 84,528 88,815 3.3 3.6 3.3 6.0 5.1CPSS1 130,736 135,943 142,687 151,738 161,193 4.5 4.0 5.0 6.3 6.2
2001 2002 2003 2004 2005 2001 2002 2003 2004 2005Turkey 7 9 12 16 18 9 11 12 15 17Belgium 150 165 161 173 181 123 134 129 142 143Canada 202 210 220 230 243 nav nav nav nav navFrance 202 217 221 226 228 181 195 199 202 202Germany 152 147 163 177 193 141 138 160 173 186Hong Kong SAR nav nav nav nav nav nav nav nav nav navItaly 53 54 56 59 60 90 92 97 104 106Japan 29 30 31 36 51 7 7 7 9 12Netherlands 196 211 221 230 233 139 164 157 163 176Singapore 79 227 430 443 442 nav nav nav nav navSweden 142 129 147 177 192 nav nav nav nav navSwitzerland 120 128 133 137 143 nav nav nav nav navUnited Kingdom 188 195 207 220 231 71 74 87 93 104United States 261 268 274 288 299 nav nav nav nav navCPSS1 174 180 188 199 210 52 55 60 64 70
Number per deposit account held by non-banks
Note: Please refer to the individual country tables for a detailed explanation.
CPSS: 1 Sum or average excluding those countries for which data are not available. For credit transfers, Belgium, France (prior to 2005),Singapore, Switzerland and the United Kingdom include interbank transactions; however, the total number is relatively small.
Japan: 1 For credit transfers, total transactions during the fiscal year ending March of the following year.
Table 6Payment transactions by non-banks: total number of transactions
Total number of transactions (millions) Increase in the number of transactions (%)
Table 6 (cont)
Number per inhabitant
CPSS – Payment systems in Turkey, 2007 57

(millions, total for the year)
2001 2002 2003 2004 2005 2001 2002 2003 2004 2005Turkey nav nav nav nav nav nav nav nav nav navBelgium 742.9 808.1 731.2 788.6 817.7 176.9 168.8 192.4 211.4 219.0Canada 637.2 655.4 725.8 796.5 857.7 488.5 520.4 560.6 590.0 626.0France 2,175.5 2,564.2 2,587.5 2,599.2 2,408.4 2,063.5 2,183.8 2,353.2 2,542.7 2,512.8Germany 5,688.5 5,552.5 5,787.6 6,170.9 6,713.1 4,834.4 4,554.3 5,458.8 6,056.0 6,662.1Hong Kong SAR nav nav nav nav nav nav nav nav nav navItaly 1,046.5 989.1 1,018.4 1,048.8 1,048.3 361.9 401.5 414.4 453.2 463.2Japan1 1,262.4 1,285.3 1,302.8 1,330.5 1,354.1 nav nav nav nav navNetherlands 1,226.6 1,260.5 1,271.4 1,264.2 1,224.8 876.1 947.0 1,000.8 1,051.3 1,023.9Singapore 16.8 17.7 19.9 21.8 24.0 19.0 30.3 44.7 47.5 51.0Sweden 764.0 436.0 425.0 462.0 511.0 98.0 119.0 130.0 143.0 160.0Switzerland 503.2 537.7 564.2 585.9 613.2 47.6 50.0 51.2 51.5 52.2United Kingdom 1,934.9 2,013.1 2,215.8 2,606.4 2,997.7 2,152.1 2,288.6 2,429.9 2,589.9 2,722.2United States 4,232.0 4,458.5 4,746.7 5,096.2 5,513.1 2,929.9 3,462.2 4,208.6 5,796.2 7,282.8CPSS1 20,230.4 20,578.2 21,396.3 22,771.1 24,083.2 14,047.8 14,726.0 16,844.6 19,532.8 21,775.3
2001 2002 2003 2004 2005 2001 2002 2003 2004 2005Turkey 25.7 25.3 26.2 25.3 23.5 nav nav nav nav navBelgium 60.1 28.9 23.7 19.1 15.7 60.5 120.8 107.1 106.9 102.0Canada 1,589.0 1,515.0 1,449.8 1,377.6 1,353.5 nav nav nav nav navFrance 4,338.6 4,349.5 4,261.5 4,133.8 3,916.3 2.8 18.4 18.1 16.0 17.0Germany 319.8 149.7 131.8 110.9 107.5 29.4 35.9 37.4 38.3 37.8Hong Kong SAR nav nav nav nav nav nav nav nav nav navItaly 583.9 538.2 505.8 487.2 465.6 nav 1.0 2.7 9.3 20.4Japan 208.9 187.1 172.0 159.2 146.5 nav nav nav nav navNetherlands 5.3 0.1 nap nap nap 30.9 87.0 109.2 127.3 146.9Singapore 92.0 90.7 87.6 86.8 85.7 102.2 702.1 1,535.9 1,598.2 1,621.6Sweden 2.0 2.0 1.0 1.0 1.0 1.5 0.7 0.2 nap napSwitzerland 7.2 4.5 3.5 2.7 1.8 19.8 20.0 19.3 19.0 19.2United Kingdom 2,567.0 2,393.0 2,251.0 2,089.0 1,931.0 nav nav nav nav navUnited States 40,130.0 38,370.0 36,600.0 34,830.0 33,070.0 nap nap nap nap napCPSS1 49,903.8 47,628.6 45,487.6 43,297.2 41,094.5 247.0 985.9 1,829.8 1,915.0 1,964.9
Credit transfers Direct debits
Table 7 (cont)
Note: Please refer to the individual country tables for a detailed explanation.
Use of payment instruments by non-banks: number of transactions per payment instrumentTable 7
Cheques E-money payment transactions
CPSS: 1 Sum or average excluding those countries for which data are not available. For credit transfers, Belgium, France (prior to 2005),Singapore, Switzerland and the United Kingdom include interbank transactions; however, the total number is relatively small.
Japan: 1 For credit transfers, total transactions during the fiscal year ending March of the following year.
CPSS – Payment systems in Turkey, 2007 58

2001 2002 2003 2004 2005 2001 2002 2003 2004 2005Turkey 468.4 602.6 799.4 1,099.9 1,274.4 5.4 8.6 12.4 19.9 33.8Belgium 502.2 577.3 614.5 671.3 738.5 432.8 506.8 544.1 597.3 659.5Canada 3,556.6 3,897.0 4,228.0 4,581.0 5,019.3 2,236.6 2,404.0 2,590.0 2,819.2 3,071.3France1 3,670.7 4,095.6 4,341.5 4,650.0 5,243.8 nav nav nav nav navGermany 1,649.0 1,864.3 2,016.5 2,236.4 2,372.1 1,334.1 1,535.8 1,670.3 1,869.0 1,982.3Hong Kong SAR nav nav nav nav nav nav nav nav nav navItaly 747.8 910.4 984.7 1,105.6 1,196.3 433.4 552.0 610.7 672.0 732.8Japan 2,266.5 2,305.3 2,459.5 3,061.2 4,977.1 6.2 8.3 9.5 10.9 11.8Netherlands 1,001.9 1,114.1 1,201.2 1,295.6 1,406.4 954.4 1,068.6 1,157.1 1,247.1 1,333.6Singapore 96.5 106.3 112.7 121.5 138.8 96.5 106.3 112.7 121.5 138.8Sweden 401.0 590.0 759.3 984.0 1,062.0 326.0 509.0 670.3 808.0 878.0Switzerland 299.4 326.3 345.0 362.1 384.0 201.1 225.6 244.6 259.5 276.6United Kingdom 4,450.0 4,891.0 5,412.0 5,899.0 6,283.0 2,757.0 3,063.0 3,441.0 3,791.0 4,206.0United States 27,272.7 30,921.2 34,217.1 38,805.8 42,948.7 10,524.0 13,390.4 16,197.8 19,680.0 22,203.3CPSS1 45,914.3 51,598.9 56,691.9 63,773.5 71,770.1 19,302.1 23,369.8 27,248.0 31,875.5 35,493.8
2001 2002 2003 2004 2005 2001 2002 2003 2004 2005Turkey nav nav nav nav nav 463.0 594.0 787.0 1,080.0 1,241.0Belgium 69.4 70.5 70.4 74.0 79.1 nav nav nav nav navCanada1 nav nav nav nav nav 1,320.0 1,493.0 1,638.0 1,761.8 1,948.0France1 nav nav nav nav nav nav nav nav nav navGermany1 314.8 328.6 346.2 367.3 389.8 nav nav nav nav navHong Kong SAR nav nav nav nav nav nav nav nav nav navItaly1 nav nav nav nav nav 314.4 358.4 374.0 433.6 463.5Japan1 nav nav nav nav nav 2,260.3 2,297.1 2,450.0 3,050.2 4,965.4Netherlands1 47.5 45.6 44.1 48.5 72.8 nav nav nav nav navSingapore nav nav nav nav nav nav nav nav nav navSweden 52.0 51.0 64.3 65.0 54.0 23.0 30.0 24.7 111.0 130.0Switzerland1 nav nav nav nav nav 98.3 100.7 100.4 102.6 107.4United Kingdom 237.0 231.0 240.0 238.0 265.0 1,456.0 1,597.0 1,731.0 1,870.0 1,812.0United States nav nav nav nav nav 16,748.7 17,530.8 18,019.3 19,125.8 20,745.4CPSS1 720.8 726.6 765.0 792.9 860.7 22,220.7 23,406.9 24,337.4 26,455.1 30,171.8
Italy: 1 For cards with a credit function, includes cards with a delayed debit function.Japan: 1 For cards with a credit function, includes cards with a delayed debit function.
by cards with a delayed debit function by cards with a credit function
Table 7 (cont)
Note: Please refer to the individual country tables for a detailed explanation.
Switzerland: 1 For cards with a credit function, includes cards with a delayed debit function.
Table 7 (cont)
Card payments (except e-money) of which: by cards with a debit function
Canada: 1 For cards with a credit function, includes charge cards.France: 1 A breakdown by types of function is not available.Germany: 1 For cards with a delayed debit function, includes cards with a credit function.
Netherlands: 1 For cards with a delayed debit function, includes cards with a credit function.
CPSS: 1 Sum or average excluding those countries for which data are not available.
CPSS – Payment systems in Turkey, 2007 59
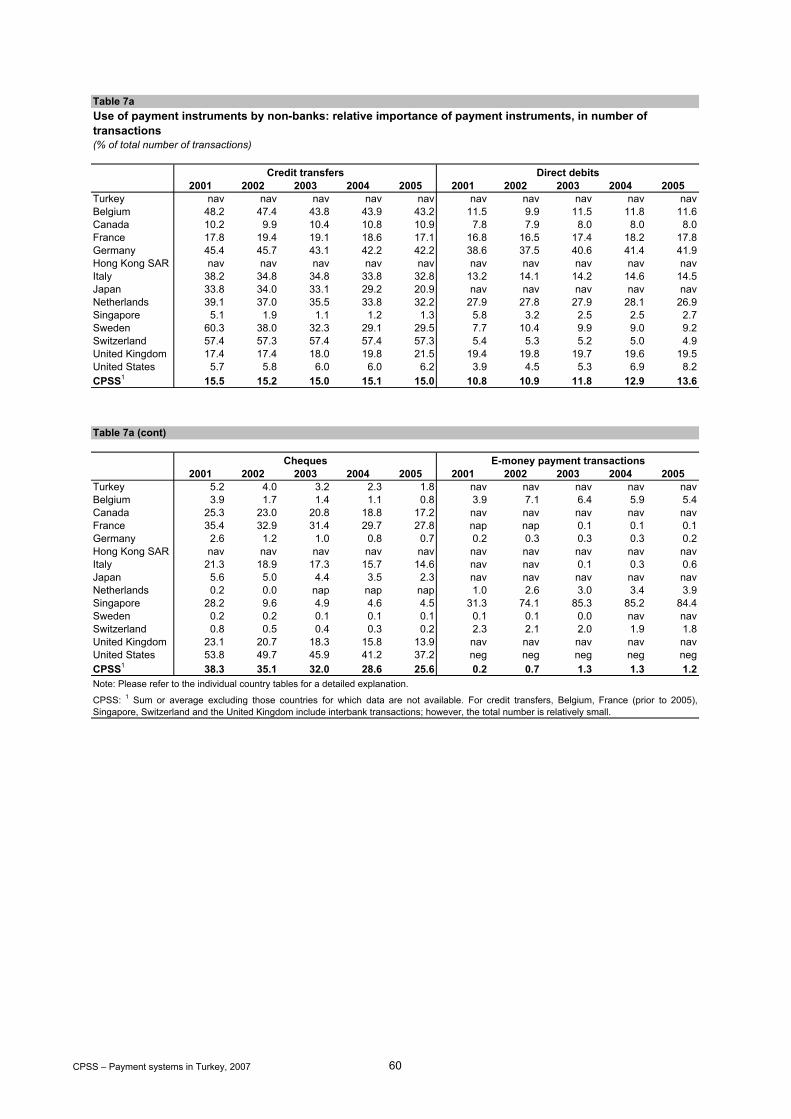
(% of total number of transactions)
2001 2002 2003 2004 2005 2001 2002 2003 2004 2005Turkey nav nav nav nav nav nav nav nav nav navBelgium 48.2 47.4 43.8 43.9 43.2 11.5 9.9 11.5 11.8 11.6Canada 10.2 9.9 10.4 10.8 10.9 7.8 7.9 8.0 8.0 8.0France 17.8 19.4 19.1 18.6 17.1 16.8 16.5 17.4 18.2 17.8Germany 45.4 45.7 43.1 42.2 42.2 38.6 37.5 40.6 41.4 41.9Hong Kong SAR nav nav nav nav nav nav nav nav nav navItaly 38.2 34.8 34.8 33.8 32.8 13.2 14.1 14.2 14.6 14.5Japan 33.8 34.0 33.1 29.2 20.9 nav nav nav nav navNetherlands 39.1 37.0 35.5 33.8 32.2 27.9 27.8 27.9 28.1 26.9Singapore 5.1 1.9 1.1 1.2 1.3 5.8 3.2 2.5 2.5 2.7Sweden 60.3 38.0 32.3 29.1 29.5 7.7 10.4 9.9 9.0 9.2Switzerland 57.4 57.3 57.4 57.4 57.3 5.4 5.3 5.2 5.0 4.9United Kingdom 17.4 17.4 18.0 19.8 21.5 19.4 19.8 19.7 19.6 19.5United States 5.7 5.8 6.0 6.0 6.2 3.9 4.5 5.3 6.9 8.2CPSS1 15.5 15.2 15.0 15.1 15.0 10.8 10.9 11.8 12.9 13.6
2001 2002 2003 2004 2005 2001 2002 2003 2004 2005Turkey 5.2 4.0 3.2 2.3 1.8 nav nav nav nav navBelgium 3.9 1.7 1.4 1.1 0.8 3.9 7.1 6.4 5.9 5.4Canada 25.3 23.0 20.8 18.8 17.2 nav nav nav nav navFrance 35.4 32.9 31.4 29.7 27.8 nap nap 0.1 0.1 0.1Germany 2.6 1.2 1.0 0.8 0.7 0.2 0.3 0.3 0.3 0.2Hong Kong SAR nav nav nav nav nav nav nav nav nav navItaly 21.3 18.9 17.3 15.7 14.6 nav nav 0.1 0.3 0.6Japan 5.6 5.0 4.4 3.5 2.3 nav nav nav nav navNetherlands 0.2 0.0 nap nap nap 1.0 2.6 3.0 3.4 3.9Singapore 28.2 9.6 4.9 4.6 4.5 31.3 74.1 85.3 85.2 84.4Sweden 0.2 0.2 0.1 0.1 0.1 0.1 0.1 0.0 nav navSwitzerland 0.8 0.5 0.4 0.3 0.2 2.3 2.1 2.0 1.9 1.8United Kingdom 23.1 20.7 18.3 15.8 13.9 nav nav nav nav navUnited States 53.8 49.7 45.9 41.2 37.2 neg neg neg neg negCPSS1 38.3 35.1 32.0 28.6 25.6 0.2 0.7 1.3 1.3 1.2
Cheques E-money payment transactions
Note: Please refer to the individual country tables for a detailed explanation.
CPSS: 1 Sum or average excluding those countries for which data are not available. For credit transfers, Belgium, France (prior to 2005),Singapore, Switzerland and the United Kingdom include interbank transactions; however, the total number is relatively small.
Use of payment instruments by non-banks: relative importance of payment instruments, in number of transactions
Credit transfers Direct debits
Table 7a (cont)
Table 7a
CPSS – Payment systems in Turkey, 2007 60

2001 2002 2003 2004 2005 2001 2002 2003 2004 2005Turkey 94.8 96.0 96.8 97.7 98.2 1.1 1.4 1.5 1.8 2.6Belgium 32.6 33.9 36.8 37.4 39.0 28.1 29.7 32.6 33.2 34.8Canada 56.7 59.2 60.7 62.4 63.9 35.7 36.5 37.2 38.4 39.1France 30.0 31.0 32.0 33.4 37.2 nav nav nav nav navGermany 13.2 15.3 15.0 15.3 14.9 10.7 12.6 12.4 12.8 12.5Hong Kong SAR nav nav nav nav nav nav nav nav nav navItaly 27.3 32.1 33.7 35.6 37.5 15.8 19.4 20.9 21.6 22.9Japan 60.6 61.0 62.5 67.3 76.8 0.2 0.2 0.2 0.2 0.2Netherlands 31.9 32.7 33.5 34.7 37.0 30.4 31.3 32.3 33.4 35.1Singapore 29.6 11.2 6.3 6.5 7.2 29.6 11.2 6.3 6.5 7.2Sweden 31.7 51.4 57.7 61.9 61.2 25.7 44.3 51.0 50.8 50.6Switzerland 34.1 34.8 35.1 35.5 35.9 22.9 24.0 24.9 25.4 25.8United Kingdom 40.1 42.2 44.0 44.7 45.1 24.8 26.4 28.0 28.8 30.2United States 36.6 40.0 42.9 45.9 48.4 14.1 17.3 20.3 23.3 25.0CPSS1 35.2 38.1 39.9 42.2 44.7 14.8 17.2 19.2 21.1 22.1
2001 2002 2003 2004 2005 2001 2002 2003 2004 2005Turkey nav nav nav nav nav 93.7 94.6 95.3 96.0 95.6Belgium 4.5 4.1 4.2 4.1 4.2 nav nav nav nav navCanada nav nav nav nav nav 21.0 22.7 23.5 24.0 24.8France nav nav nav nav nav nav nav nav nav navGermany 2.5 2.7 2.6 2.5 2.5 nav nav nav nav navHong Kong SAR nav nav nav nav nav nav nav nav nav navItaly nav nav nav nav nav 11.5 12.6 12.8 14.0 14.5Japan nav nav nav nav nav 60.5 60.8 62.3 67.0 76.7Netherlands 1.5 1.3 1.2 1.3 1.9 nav nav nav nav navSingapore nav nav nav nav nav nav nav nav nav navSweden 4.1 4.4 4.9 4.1 3.1 1.8 2.6 1.9 7.0 7.5Switzerland nav nav nav nav nav 11.2 10.7 10.2 10.0 10.0United Kingdom 2.1 2.0 1.9 1.8 1.9 13.1 13.8 14.1 14.2 13.0United States nav nav nav nav nav 22.5 22.7 22.6 22.6 23.4CPSS1 0.6 0.5 0.5 0.5 0.5 17.0 17.3 17.1 17.5 18.8
Table 7a (cont)
by cards with a delayed debit function by cards with a credit function
Note: Please refer to the individual country tables and the country footnotes to Comparative Table 7 for a detailed explanation.CPSS: 1 Sum or average excluding those countries for which data are not available.
Table 7a (cont)
Card payments (except e-money) of which: by cards with a debit function
CPSS – Payment systems in Turkey, 2007 61

(% change on previous year)
2001 2002 2003 2004 2005 2001 2002 2003 2004 2005Turkey nav nav nav nav nav nav nav nav nav navBelgium 13.1 8.8 -9.5 7.8 3.7 6.5 -4.6 14.0 9.9 3.6Canada 12.3 2.9 10.7 9.7 7.7 9.9 6.5 7.7 5.2 6.1France 3.9 17.9 0.9 0.5 -7.3 4.8 5.8 7.8 8.1 -1.2Germany 1.9 -2.4 4.2 6.6 8.8 1.4 -5.8 19.9 10.9 10.0Hong Kong SAR nav nav nav nav nav nav nav nav nav navItaly 227.4 -5.5 3.0 3.0 0.0 10.9 11.0 3.2 9.4 2.2Japan 3.7 1.8 1.4 2.1 1.8 nav nav nav nav navNetherlands 4.8 2.8 0.9 -0.6 -3.1 4.8 8.1 5.7 5.1 -2.6Singapore 14.8 5.7 12.1 10.0 10.1 9.6 59.9 47.4 6.4 7.3Sweden -3.6 -42.9 -2.5 8.7 10.6 7.7 21.4 9.2 10.0 11.9Switzerland -7.7 6.9 4.9 3.8 4.7 3.3 5.0 2.4 0.6 1.4United Kingdom 4.7 4.0 10.1 17.6 15.0 7.1 6.3 6.2 6.6 5.1United States 12.1 5.4 6.5 7.4 8.2 23.8 18.2 21.6 37.7 25.6CPSS1 8.9 1.7 4.0 6.4 5.8 7.7 4.8 14.4 16.0 11.5
2001 2002 2003 2004 2005 2001 2002 2003 2004 2005Turkey -13.0 -1.6 3.7 -3.3 -7.2 nav nav nav nav navBelgium -15.1 -51.9 -18.0 -19.3 -18.0 17.9 99.9 -11.4 -0.1 -4.6Canada -4.2 -4.7 -4.3 -5.0 -1.7 nav nav nav nav navFrance -3.5 0.3 -2.0 -3.0 -5.3 nap nap -1.6 -11.6 6.4Germany -18.7 -53.2 -12.0 -15.9 -3.1 10.4 22.1 4.2 2.5 -1.4Hong Kong SAR nav nav nav nav nav nav nav nav nav navItaly 3.3 -7.8 -6.0 -3.7 -4.4 nav nav nav nav navJapan -7.5 -10.4 -8.1 -7.4 -8.0 nav nav nav nav navNetherlands -62.3 -98.6 nap nap nap 22.0 181.6 25.5 16.6 15.4Singapore 0.4 -1.4 -3.5 -0.9 -1.2 2.1 587.0 118.8 4.1 1.5Sweden 0.0 0.0 -50.0 0.0 0.0 -48.3 -53.3 -71.4 nav navSwitzerland -35.7 -37.5 -22.2 -22.9 -33.3 10.0 1.0 -3.5 -1.6 1.1United Kingdom -5.0 -6.8 -5.9 -7.2 -7.6 nav nav nav nav navUnited States -4.2 -4.4 -4.6 -4.8 -5.1 nav nav nav nav navCPSS1 -4.3 -4.6 -4.5 -4.8 -5.1 10.2 299.1 85.6 4.7 2.6
Cheques E-money payment transactions
Note: Please refer to the individual country tables for a detailed explanation.
CPSS: 1 Sum or average excluding those countries for which data are not available. For credit transfers, Belgium, France (prior to 2005),Singapore, Switzerland and the United Kingdom include interbank transactions; however, the total number is relatively small.
Direct debits
Table 7b (cont)
Table 7bUse of payment instruments by non-banks: increase in the number of transactions
Credit transfers
CPSS – Payment systems in Turkey, 2007 62
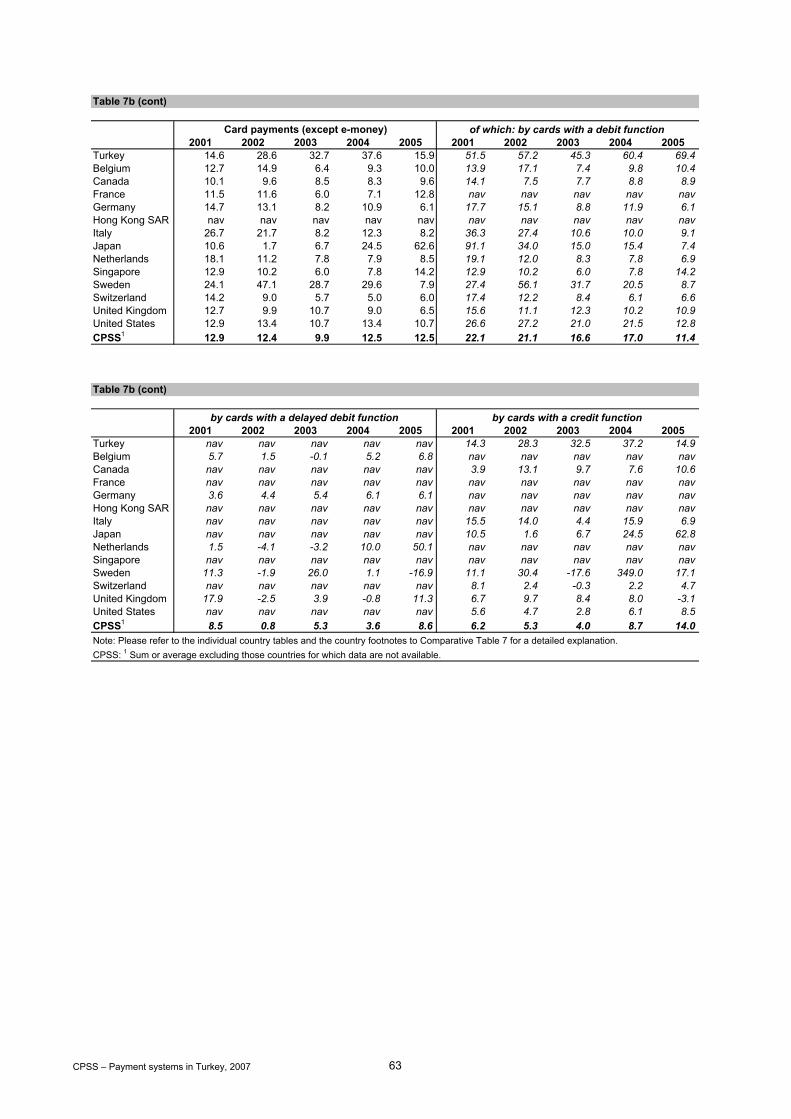
2001 2002 2003 2004 2005 2001 2002 2003 2004 2005Turkey 14.6 28.6 32.7 37.6 15.9 51.5 57.2 45.3 60.4 69.4Belgium 12.7 14.9 6.4 9.3 10.0 13.9 17.1 7.4 9.8 10.4Canada 10.1 9.6 8.5 8.3 9.6 14.1 7.5 7.7 8.8 8.9France 11.5 11.6 6.0 7.1 12.8 nav nav nav nav navGermany 14.7 13.1 8.2 10.9 6.1 17.7 15.1 8.8 11.9 6.1Hong Kong SAR nav nav nav nav nav nav nav nav nav navItaly 26.7 21.7 8.2 12.3 8.2 36.3 27.4 10.6 10.0 9.1Japan 10.6 1.7 6.7 24.5 62.6 91.1 34.0 15.0 15.4 7.4Netherlands 18.1 11.2 7.8 7.9 8.5 19.1 12.0 8.3 7.8 6.9Singapore 12.9 10.2 6.0 7.8 14.2 12.9 10.2 6.0 7.8 14.2Sweden 24.1 47.1 28.7 29.6 7.9 27.4 56.1 31.7 20.5 8.7Switzerland 14.2 9.0 5.7 5.0 6.0 17.4 12.2 8.4 6.1 6.6United Kingdom 12.7 9.9 10.7 9.0 6.5 15.6 11.1 12.3 10.2 10.9United States 12.9 13.4 10.7 13.4 10.7 26.6 27.2 21.0 21.5 12.8CPSS1 12.9 12.4 9.9 12.5 12.5 22.1 21.1 16.6 17.0 11.4
2001 2002 2003 2004 2005 2001 2002 2003 2004 2005Turkey nav nav nav nav nav 14.3 28.3 32.5 37.2 14.9Belgium 5.7 1.5 -0.1 5.2 6.8 nav nav nav nav navCanada nav nav nav nav nav 3.9 13.1 9.7 7.6 10.6France nav nav nav nav nav nav nav nav nav navGermany 3.6 4.4 5.4 6.1 6.1 nav nav nav nav navHong Kong SAR nav nav nav nav nav nav nav nav nav navItaly nav nav nav nav nav 15.5 14.0 4.4 15.9 6.9Japan nav nav nav nav nav 10.5 1.6 6.7 24.5 62.8Netherlands 1.5 -4.1 -3.2 10.0 50.1 nav nav nav nav navSingapore nav nav nav nav nav nav nav nav nav navSweden 11.3 -1.9 26.0 1.1 -16.9 11.1 30.4 -17.6 349.0 17.1Switzerland nav nav nav nav nav 8.1 2.4 -0.3 2.2 4.7United Kingdom 17.9 -2.5 3.9 -0.8 11.3 6.7 9.7 8.4 8.0 -3.1United States nav nav nav nav nav 5.6 4.7 2.8 6.1 8.5CPSS1 8.5 0.8 5.3 3.6 8.6 6.2 5.3 4.0 8.7 14.0
Table 7b (cont)
by cards with a delayed debit function by cards with a credit function
Note: Please refer to the individual country tables and the country footnotes to Comparative Table 7 for a detailed explanation.CPSS: 1 Sum or average excluding those countries for which data are not available.
Table 7b (cont)
Card payments (except e-money) of which: by cards with a debit function
CPSS – Payment systems in Turkey, 2007 63

(total for the year)
2001 2002 2003 2004 2005 2001 2002 2003 2004 2005Turkey nav nav nav nav nav nav nav nav nav navBelgium 72.3 78.2 70.5 75.7 78.1 17.2 16.3 18.5 20.3 20.9Canada 20.5 20.9 22.9 24.9 26.6 15.7 16.6 17.7 18.5 19.4France 35.6 41.7 41.8 41.7 38.4 33.8 35.5 38.0 40.8 40.1Germany 69.1 67.3 70.1 74.8 81.4 58.7 55.2 66.2 73.4 80.8Hong Kong SAR nav nav nav nav nav nav nav nav nav navItaly 18.2 17.2 17.7 18.2 18.0 6.3 7.0 7.2 7.9 8.0Japan1 9.9 10.1 10.2 10.4 10.6 nav nav nav nav navNetherlands 76.5 78.1 78.4 77.7 75.0 54.6 58.7 61.7 64.6 62.7Singapore 4.1 4.2 4.7 5.2 5.5 4.6 7.3 10.7 11.2 11.7Sweden 85.9 48.9 47.4 51.4 56.6 11.0 13.3 14.5 15.9 17.7Switzerland 69.1 73.2 76.2 78.6 81.7 6.5 6.8 6.9 6.9 7.0United Kingdom 32.7 33.9 37.2 43.6 49.8 36.4 38.6 40.8 43.3 45.2United States 14.8 15.5 16.3 17.3 18.6 10.3 12.0 14.5 19.7 24.6CPSS1 26.7 27.0 27.9 29.6 31.1 18.6 19.3 22.0 25.4 28.1
2001 2002 2003 2004 2005 2001 2002 2003 2004 2005Turkey 0.4 0.4 0.4 0.4 0.3 nav nav nav nav navBelgium 5.8 2.8 2.3 1.8 1.5 5.9 11.7 10.3 10.3 9.7Canada 51.2 48.3 45.8 43.1 41.9 nav nav nav nav navFrance 71.0 70.7 68.8 66.3 62.5 0.0 0.3 0.3 0.3 0.3Germany 3.9 1.8 1.6 1.3 1.3 0.4 0.4 0.5 0.5 0.5Hong Kong SAR nav nav nav nav nav nav nav nav nav navItaly 10.2 9.4 8.8 8.5 8.0 nav nav 0.0 0.2 0.4Japan 1.6 1.5 1.3 1.2 1.1 nav nav nav nav navNetherlands 0.3 0.0 nap nap nap 1.9 5.4 6.7 7.8 9.0Singapore 22.2 21.7 20.9 20.5 19.7 24.7 168.1 366.9 377.1 373.5Sweden 0.2 0.2 nav nav nav 0.2 0.1 0.0 nav navSwitzerland 1.0 0.6 0.5 0.4 0.2 2.7 2.7 2.6 2.5 2.6United Kingdom 43.4 40.3 37.8 34.9 32.1 nav nav nav nav navUnited States 140.6 133.1 125.7 118.5 111.5 nap nap nap nap napCPSS1 65.9 62.5 59.4 56.2 53.0 0.3 1.3 2.4 2.5 2.5
Cheques E-money payment transactions
Use of payment instruments by non-banks: number of transactions per inhabitant
Credit transfers
Note: Please refer to the individual country tables for a detailed explanation.
CPSS: 1 Sum or average excluding those countries for which data are not available. For credit transfers, Belgium, France (prior to 2005),Singapore, Switzerland and the United Kingdom include interbank transactions; however, the total number is relatively small.
Table 7c
Japan: 1 For credit transfers, total transactions during the fiscal year ending March of the following year.
Direct debits
Table 7c (cont)
CPSS – Payment systems in Turkey, 2007 64

2001 2002 2003 2004 2005 2001 2002 2003 2004 2005Turkey 6.8 8.7 11.4 15.4 17.7 0.1 0.1 0.2 0.3 0.5Belgium 48.8 55.9 59.2 64.4 70.5 42.1 49.1 52.4 57.3 63.0Canada 114.6 124.2 133.5 143.3 155.5 72.1 76.6 81.8 88.2 95.1France 60.1 66.6 70.1 74.6 83.6 nav nav nav nav navGermany 20.0 22.6 24.4 27.1 28.8 16.2 18.6 20.2 22.7 24.0Hong Kong SAR nav nav nav nav nav nav nav nav nav navItaly 13.0 15.8 17.1 19.2 20.6 7.6 9.6 10.6 11.7 12.6Japan 17.8 18.1 19.3 24.0 39.0 0.0 0.1 0.1 0.1 0.1Netherlands 62.5 69.0 74.0 79.6 86.2 59.5 66.2 71.3 76.6 81.7Singapore 23.3 25.5 26.9 28.7 32.0 23.3 25.5 26.9 28.7 32.0Sweden 45.1 66.1 84.8 109.4 117.6 36.6 57.0 74.8 89.8 97.2Switzerland 41.1 44.4 46.6 48.6 51.2 27.6 30.7 33.0 34.8 36.9United Kingdom 75.3 82.4 90.9 98.6 104.4 46.6 51.6 57.8 63.4 69.9United States 95.6 107.3 117.5 132.0 144.8 36.9 46.5 55.6 67.0 74.8CPSS1 60.7 67.8 74.0 82.8 92.6 25.5 30.7 35.6 41.4 45.8
2001 2002 2003 2004 2005 2001 2002 2003 2004 2005Turkey nav nav nav nav nav 6.8 8.6 11.2 15.1 17.2Belgium 6.8 6.8 6.8 7.1 7.5 nav nav nav nav navCanada nav nav nav nav nav 42.5 47.6 51.7 55.1 60.3France nav nav nav nav nav nav nav nav nav navGermany 3.8 4.0 4.2 4.5 4.7 nav nav nav nav navHong Kong SAR nav nav nav nav nav nav nav nav nav navItaly nav nav nav nav nav 5.5 6.2 6.5 7.5 8.0Japan nav nav nav nav nav 17.8 18.0 19.2 23.9 38.9Netherlands 3.0 2.8 2.7 3.0 4.5 nav nav nav nav navSingapore nav nav nav nav nav nav nav nav nav navSweden 5.8 5.7 7.2 7.2 6.0 2.6 3.4 2.8 12.3 14.4Switzerland nav nav nav nav nav 13.5 13.7 13.6 13.8 14.3United Kingdom 4.0 3.9 4.0 4.0 4.4 24.6 26.9 29.1 31.3 30.1United States nav nav nav nav nav 58.7 60.8 61.9 65.1 69.9CPSS1 1.0 1.0 1.0 1.0 1.1 29.4 30.7 31.8 34.4 38.9
Table 7c (cont)
by cards with a delayed debit function by cards with a credit function
Note: Please refer to the individual country tables and the country footnotes to Comparative Table 7 for a detailed explanation.CPSS: 1 Sum or average excluding those countries for which data are not available.
Table 7c (cont)
Card payments (except e-money) of which: by cards with a debit function
CPSS – Payment systems in Turkey, 2007 65
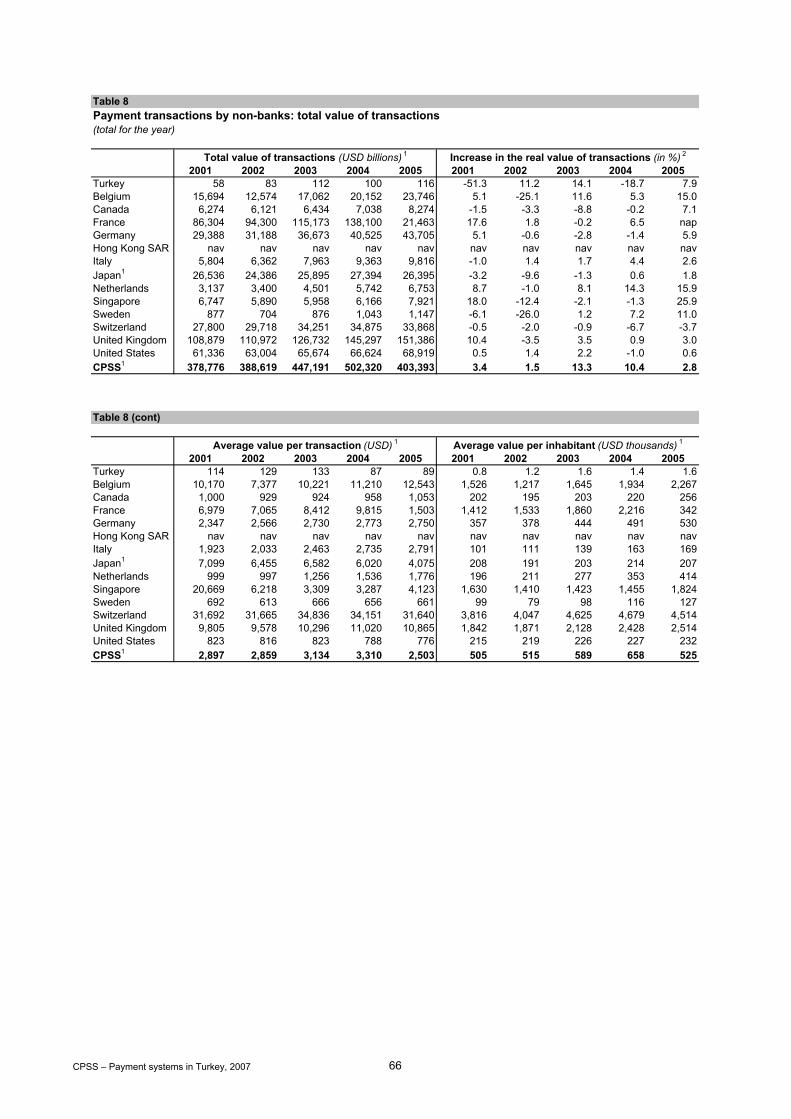
Payment transactions by non-banks: total value of transactions(total for the year)
2001 2002 2003 2004 2005 2001 2002 2003 2004 2005Turkey 58 83 112 100 116 -51.3 11.2 14.1 -18.7 7.9Belgium 15,694 12,574 17,062 20,152 23,746 5.1 -25.1 11.6 5.3 15.0Canada 6,274 6,121 6,434 7,038 8,274 -1.5 -3.3 -8.8 -0.2 7.1France 86,304 94,300 115,173 138,100 21,463 17.6 1.8 -0.2 6.5 napGermany 29,388 31,188 36,673 40,525 43,705 5.1 -0.6 -2.8 -1.4 5.9Hong Kong SAR nav nav nav nav nav nav nav nav nav navItaly 5,804 6,362 7,963 9,363 9,816 -1.0 1.4 1.7 4.4 2.6Japan1 26,536 24,386 25,895 27,394 26,395 -3.2 -9.6 -1.3 0.6 1.8Netherlands 3,137 3,400 4,501 5,742 6,753 8.7 -1.0 8.1 14.3 15.9Singapore 6,747 5,890 5,958 6,166 7,921 18.0 -12.4 -2.1 -1.3 25.9Sweden 877 704 876 1,043 1,147 -6.1 -26.0 1.2 7.2 11.0Switzerland 27,800 29,718 34,251 34,875 33,868 -0.5 -2.0 -0.9 -6.7 -3.7United Kingdom 108,879 110,972 126,732 145,297 151,386 10.4 -3.5 3.5 0.9 3.0United States 61,336 63,004 65,674 66,624 68,919 0.5 1.4 2.2 -1.0 0.6CPSS1 378,776 388,619 447,191 502,320 403,393 3.4 1.5 13.3 10.4 2.8
2001 2002 2003 2004 2005 2001 2002 2003 2004 2005Turkey 114 129 133 87 89 0.8 1.2 1.6 1.4 1.6Belgium 10,170 7,377 10,221 11,210 12,543 1,526 1,217 1,645 1,934 2,267Canada 1,000 929 924 958 1,053 202 195 203 220 256France 6,979 7,065 8,412 9,815 1,503 1,412 1,533 1,860 2,216 342Germany 2,347 2,566 2,730 2,773 2,750 357 378 444 491 530Hong Kong SAR nav nav nav nav nav nav nav nav nav navItaly 1,923 2,033 2,463 2,735 2,791 101 111 139 163 169Japan1 7,099 6,455 6,582 6,020 4,075 208 191 203 214 207Netherlands 999 997 1,256 1,536 1,776 196 211 277 353 414Singapore 20,669 6,218 3,309 3,287 4,123 1,630 1,410 1,423 1,455 1,824Sweden 692 613 666 656 661 99 79 98 116 127Switzerland 31,692 31,665 34,836 34,151 31,640 3,816 4,047 4,625 4,679 4,514United Kingdom 9,805 9,578 10,296 11,020 10,865 1,842 1,871 2,128 2,428 2,514United States 823 816 823 788 776 215 219 226 227 232CPSS1 2,897 2,859 3,134 3,310 2,503 505 515 589 658 525
Table 8
Total value of transactions (USD billions) 1 Increase in the real value of transactions (in %) 2
Table 8 (cont)
Average value per transaction (USD) 1 Average value per inhabitant (USD thousands) 1
CPSS – Payment systems in Turkey, 2007 66

2001 2002 2003 2004 2005 2001 2002 2003 2004 2005Turkey 39.8 45.7 47.2 33.1 32.1 1.6 2.0 2.1 1.8 1.8Belgium 67.7 49.8 55.0 56.0 64.0 231.4 155.2 155.4 157.3 183.5Canada 8.8 8.3 7.4 7.1 7.3 39.7 36.0 29.3 27.1 28.8France 64.4 64.6 64.0 67.0 10.1 258.5 237.1 235.9 248.0 39.8Germany 15.5 15.4 15.0 14.8 15.7 59.4 48.8 44.2 43.5 47.5Hong Kong SAR nav nav nav nav nav nav nav nav nav navItaly 5.2 5.2 5.3 5.4 5.6 13.7 11.6 11.7 12.0 13.5Japan 6.7 6.0 6.0 5.9 6.0 12.3 8.8 7.8 8.1 8.2Netherlands 7.8 7.8 8.4 9.4 10.8 23.5 20.1 21.7 24.8 29.7Singapore 78.6 66.6 64.5 57.7 67.8 64.6 53.8 50.7 47.6 57.3Sweden 4.0 2.9 2.9 3.0 3.2 7.8 4.9 4.9 5.0 5.9Switzerland 111.0 107.4 106.0 96.8 92.6 444.3 353.6 262.4 258.0 268.5United Kingdom 75.9 70.5 69.9 67.4 68.0 34.9 26.8 25.2 24.1 23.4United States 6.1 6.0 6.0 5.7 5.5 70.2 74.3 74.8 72.8 76.4CPSS1 17.3 17.1 17.7 18.1 14.0 47.1 38.4 36.7 36.6 29.0
Japan: 1 For the most part, data refer to total transactions during the fiscal year ending March of the following year (see Japan, Table 8). As aconsequence, they are converted at average fiscal year exchange rates.
Table 8 (cont)
Value as a ratio to GDP Value as a ratio to deposits held by non-banks3
Note: Please refer to the individual country tables for a detailed explanation.1 Converted at yearly average exchange rates, except as noted. 2 Total value of transactions in domestic currency deflated by yearly averageCPI inflation. For the CPSS area, in US dollar terms. 3 For Italy, as a ratio to deposits held only at banks.
CPSS: 1 Sum or average excluding those countries for which data are not available. For Belgium, France (prior to 2005), Singapore, Switzerlandand the United Kingdom, includes interbank transactions in credit transfers. Since the value of these transactions is relatively large, cross-country comparison and the CPSS figures should be treated with caution.
CPSS – Payment systems in Turkey, 2007 67

(USD billions, total for the year) 1
2001 2002 2003 2004 2005 2001 2002 2003 2004 2005Turkey nav nav nav nav nav nav nav nav nav navBelgium 15,526 12,402 16,865 19,941 23,541 48 44 55 60 63Canada 2,644 2,691 3,335 3,815 4,588 168 196 251 298 354France 83,138 90,656 110,748 133,632 16,721 630 708 853 972 1,126Germany 24,909 26,647 32,010 35,405 38,679 3,563 3,687 3,748 4,239 4,187Hong Kong SAR nav nav nav nav nav nav nav nav nav navItaly 3,988 4,404 5,573 6,604 7,024 182 202 265 341 359Japan1 19,331 18,392 20,055 21,503 21,431 nav nav nav nav navNetherlands 2,935 3,170 4,195 5,392 6,389 157 177 239 272 280Singapore 6,480 5,640 5,702 5,881 7,621 12 15 19 22 24Sweden 825 638 791 940 1,043 25 26 34 41 46Switzerland 27,715 29,626 34,144 34,759 33,747 43 47 56 63 65United Kingdom 104,975 106,862 122,214 140,127 146,309 800 926 1,081 1,374 1,448United States 9,962 11,156 12,532 13,977 15,628 10,006 10,622 12,110 11,893 12,917CPSS1 nap nap nap nap nap 15,636 16,649 18,711 19,576 20,868
2001 2002 2003 2004 2005 2001 2002 2003 2004 2005Turkey 43 52 72 92 116 nav nav nav nav nav Belgium 89 94 98 101 85 0.242 0.632 0.621 0.659 0.609Canada 3,321 3,070 2,648 2,690 3,046 nav nav nav nav navFrance 1,979 2,239 2,748 2,590 2,702 0.009 0.066 0.079 0.066 0.053Germany 807 729 755 696 641 0.000 0.000 0.000 0.000 0.000Hong Kong SAR nav nav nav nav nav nav nav nav nav navItaly 1,074 1,127 1,332 1,475 1,442 nav 0.057 0.207 0.718 2.012Japan 7,226 5,636 5,460 5,579 4,802 nav nav nav nav navNetherlands 0 0 nap nap nap 0.076 0.223 0.336 0.435 0.494Singapore 244 223 225 248 269 0.117 0.369 0.712 0.787 0.852Sweden 2 2 6 8 4 nav nav nav nav navSwitzerland 11 8 7 6 3 0.042 0.045 0.052 0.056 0.056United Kingdom 2,812 2,844 3,010 3,260 3,056 nav nav nav nav navUnited States 39,689 39,406 38,979 38,417 37,729 nap nap nap nap napCPSS1 57,254 55,379 55,267 55,070 53,780 0.485 1.391 2.007 2.720 4.077
Japan: 1 For credit transfers, total transactions during the fiscal year ending March of the following year, converted at average fiscal yearexchange rates.
E-money payment transactions
1 Converted at yearly average exchange rates, except as noted.
Table 9
Table 9 (cont)
Cheques
CPSS: 1 Sum or average excluding those countries for which data are not available. For credit transfers, Belgium, France (prior to 2005),Singapore, Switzerland and the United Kingdom include interbank transactions. Since the value of these transactions is relatively large, cross-country comparison should be treated with caution; consequently, CPSS figures related to credit transfers have not been calculated.
Use of payment instruments by non-banks: value of transactions per payment instrument
Credit transfers Direct debits
Note: Please refer to the individual country tables for a detailed explanation.
CPSS – Payment systems in Turkey, 2007 68

2001 2002 2003 2004 2005 2001 2002 2003 2004 2005Turkey 9.9 14.4 23.7 41.2 58.1 0.0 0.1 0.1 0.3 0.7Belgium 25.7 30.6 39.0 45.6 51.5 19.4 23.7 30.7 37.1 41.0Canada 139.8 164.2 200.7 235.0 286.5 61.3 66.8 82.8 95.6 113.5France 152.1 179.1 230.3 272.8 323.2 nav nav nav nav navGermany 108.3 125.4 158.1 186.4 196.2 83.2 97.1 123.1 144.1 150.3Hong Kong SAR nav nav nav nav nav nav nav nav nav navItaly 55.4 74.1 97.0 124.3 136.8 29.0 42.2 57.4 72.1 78.9Japan 194.2 200.7 233.9 276.2 299.2 2.5 3.5 4.6 6.6 7.3Netherlands 44.3 52.6 66.4 77.0 83.7 39.6 47.7 60.8 70.5 73.9Singapore 10.3 11.0 11.8 13.8 16.6 4.2 4.4 4.7 5.5 7.0Sweden 25.2 37.6 45.0 nav nav 18.0 30.6 35.5 nav navSwitzerland 31.4 36.9 43.8 46.0 52.8 20.2 24.5 29.7 30.0 35.9United Kingdom 291.6 340.4 427.6 536.0 572.6 142.5 169.1 222.8 288.2 325.1United States 1,679.4 1,820.3 2,053.2 2,335.8 2,645.5 386.3 480.0 588.1 728.9 868.3CPSS1 2,757.6 3,072.8 3,606.8 4,148.8 4,664.7 806.1 989.4 1,240.1 1,478.6 1,701.2
2001 2002 2003 2004 2005 2001 2002 2003 2004 2005Turkey nav nav nav nav nav 9.8 14.4 23.5 40.9 57.4Belgium 6.2 6.9 8.3 8.4 10.4 nav nav nav nav navCanada1 nap nap nap nap nap 78.5 97.4 117.8 139.4 173.0France1 nap nap nap nap nap nav nav nav nav navGermany1 26.0 28.3 35.0 42.2 46.0 nav nav nav nav navHong Kong SAR nav nav nav nav nav nav nav nav nav navItaly1 nav nav nav nav nav 26.4 31.9 39.6 52.2 57.9Japan1 nap nap nap nap nap 191.7 197.2 229.3 269.6 292.0Netherlands1 4.7 5.0 5.6 6.5 9.8 nap nap nap nap napSingapore1 nav nav nav nav nav 6.2 6.6 7.1 8.3 9.7Sweden 5.0 5.1 6.7 7.9 7.3 2.2 1.9 2.9 3.5 3.4Switzerland1 nav nav nav nav nav 11.2 12.4 14.1 15.9 16.9United Kingdom 34.5 35.9 39.4 46.4 48.0 114.5 135.4 165.4 201.4 199.5United States nav nav nav nav nav 1,293.1 1,340.4 1,465.2 1,606.9 1,777.2CPSS1 76.4 81.1 94.9 111.5 121.5 1,723.9 1,823.2 2,041.4 2,297.3 2,529.6
Netherlands: 1 For cards with a delayed debit function, includes cards with a credit function.
Switzerland: 1 For cards with a credit function, includes cards with a delayed debit function.Singapore: 1 For cards with a credit function, includes charge cards.
Canada: 1 For cards with a credit function, includes charge cards.France: 1 A breakdown by types of function is not available.Germany: 1 For cards with a delayed debit function, includes cards with a credit function.Italy: 1 For cards with a credit function, includes cards with a delayed debit function.Japan: 1 For cards with a credit function, includes cards with a delayed debit function.
Table 9 (cont)
Card payments (except e-money) of which: by cards with a debit function
CPSS: 1 Sum or average excluding those countries for which data are not available.
Table 9 (cont)
by cards with a delayed debit function by cards with a credit function
Note: Please refer to the individual country tables for a detailed explanation.1 Converted at yearly average exchange rates.
CPSS – Payment systems in Turkey, 2007 69

(% of total value of transactions)
2001 2002 2003 2004 2005 2001 2002 2003 2004 2005Turkey nav nav nav nav nav nav nav nav nav navBelgium 99.0 98.7 98.9 99.0 99.2 0.3 0.3 0.3 0.3 0.3Canada 42.1 44.0 51.8 54.2 55.4 2.7 3.2 3.9 4.2 4.3France 96.8 96.7 96.7 97.2 80.1 0.7 0.8 0.7 0.7 5.4Germany 84.8 85.4 87.3 87.4 88.5 12.1 11.8 10.2 10.5 9.6Hong Kong SAR nav nav nav nav nav nav nav nav nav navItaly 75.2 75.8 76.7 77.3 78.4 3.4 3.5 3.6 4.0 4.0Japan 72.3 75.9 77.9 78.6 80.8 nav nav nav nav navNetherlands 93.6 93.2 93.2 93.9 94.6 5.0 5.2 5.3 4.7 4.1Singapore 96.1 95.8 95.7 95.4 96.1 0.2 0.3 0.3 0.4 0.3Sweden 94.1 90.7 90.3 95.0 95.4 2.9 3.7 3.9 4.2 4.2Switzerland 99.7 99.7 99.7 99.7 99.6 0.2 0.2 0.2 0.2 0.2United Kingdom 96.4 96.3 96.4 96.4 96.6 0.7 0.8 0.9 0.9 1.0United States 16.2 17.7 19.1 21.0 22.7 16.3 16.9 18.4 17.9 18.7CPSS1 nap nap nap nap nap 20.7 22.2 24.1 24.8 26.3
2001 2002 2003 2004 2005 2001 2002 2003 2004 2005Turkey 81.2 78.3 75.3 69.1 66.6 nav nav nav nav navBelgium 0.6 0.7 0.6 0.5 0.4 0.0 0.0 0.0 0.0 0.0Canada 52.9 50.2 41.2 38.2 36.8 nav nav nav nav navFrance 2.3 2.4 2.4 1.9 12.9 0.0 0.0 0.0 0.0 0.0Germany 2.7 2.3 2.1 1.7 1.5 0.0 0.0 0.0 0.0 0.0Hong Kong SAR nav nav nav nav nav nav nav nav nav navItaly 20.3 19.4 18.3 17.3 16.1 nav 0.0 0.0 0.0 0.0Japan 27.0 23.3 21.2 20.4 18.1 nav nav nav nav navNetherlands 0.0 0.0 nap nap nap 0.0 0.0 0.0 0.0 0.0Singapore 3.6 3.8 3.8 4.0 3.4 0.0 0.0 0.0 0.0 0.0Sweden 0.2 0.3 0.6 nav nav nav nav nav nav navSwitzerland 0.0 0.0 0.0 0.0 0.0 0.0 0.0 0.0 0.0 0.0United Kingdom 2.6 2.6 2.4 2.2 2.0 nav nav nav nav navUnited States 64.7 62.5 59.4 57.7 54.7 nap nap nap nap napCPSS1 75.7 73.7 71.2 69.9 67.8 0.0 0.0 0.0 0.0 0.0
Table 9a
Note: Please refer to the individual country tables for a detailed explanation.
CPSS: 1 Sum or average excluding those countries for which data are not available. For credit transfers, Belgium, France (prior to 2005),Singapore, Switzerland and the United Kingdom include interbank transactions. Since the value of these transactions is relatively large, cross-country comparison should be treated with caution; consequently, CPSS figures related to credit transfers have not been calculated.
Cheques E-money payment transactions
Use of payment instruments by non-banks: relative importance of payment instruments, in value of transactions
Credit transfers Direct debits
Table 9a (cont)
CPSS – Payment systems in Turkey, 2007 70

2001 2002 2003 2004 2005 2001 2002 2003 2004 2005Turkey 18.8 21.7 24.7 30.9 33.4 0.1 0.1 0.2 0.2 0.4Belgium 0.2 0.2 0.2 0.2 0.2 0.1 0.2 0.2 0.2 0.2Canada 2.2 2.7 3.1 3.3 3.5 1.0 1.1 1.3 1.4 1.4France 0.2 0.2 0.2 0.2 1.5 nav nav nav nav navGermany 0.4 0.4 0.4 0.5 0.4 0.3 0.3 0.3 0.4 0.3Hong Kong SAR nav nav nav nav nav nav nav nav nav navItaly 1.0 1.3 1.3 1.5 1.5 0.5 0.7 0.8 0.8 0.9Japan 0.7 0.8 0.9 1.0 1.1 0.0 0.0 0.0 0.0 0.0Netherlands 1.4 1.5 1.5 1.3 1.2 1.3 1.4 1.4 1.2 1.1Singapore 0.2 0.2 0.2 0.2 0.2 0.1 0.1 0.1 0.1 0.1Sweden 2.9 5.3 5.1 nav nav 2.0 4.3 4.1 nav navSwitzerland 0.1 0.1 0.1 0.1 0.2 0.1 0.1 0.1 0.1 0.1United Kingdom 0.3 0.3 0.3 0.4 0.4 0.1 0.2 0.2 0.2 0.2United States 2.7 2.9 3.1 3.5 3.8 0.6 0.8 0.9 1.1 1.3CPSS1 3.6 4.1 4.6 5.3 5.9 1.1 1.3 1.6 1.9 2.1
2001 2002 2003 2004 2005 2001 2002 2003 2004 2005Turkey nav nav nav nav nav 18.7 21.5 24.5 30.7 33.0Belgium 0.0 0.1 0.0 0.0 0.0 nav nav nav nav navCanada nap nap nap nap nap 1.3 1.6 1.8 2.0 2.1France nap nap nap nap nap nav nav nav nav navGermany 0.1 0.1 0.1 0.1 0.1 nav nav nav nav navHong Kong SAR nav nav nav nav nav nav nav nav nav navItaly nav nav nav nav nav 0.5 0.5 0.5 0.6 0.6Japan nap nap nap nap nap 0.7 0.8 0.9 1.0 1.1Netherlands 0.2 0.1 0.1 0.1 0.1 nap nap nap nap napSingapore nav nav nav nav nav 0.1 0.1 0.1 0.1 0.1Sweden 0.6 0.7 0.8 0.8 0.7 0.3 0.3 0.3 0.4 0.3Switzerland nav nav nav nav nav 0.0 0.0 0.0 0.0 0.1United Kingdom 0.0 0.0 0.0 0.0 0.0 0.1 0.1 0.1 0.1 0.1United States nav nav nav nav nav 2.1 2.1 2.2 2.4 2.6CPSS1 0.1 0.1 0.1 0.1 0.2 2.3 2.4 2.6 2.9 3.2
Table 9a (cont)
Card payments (except e-money) of which: by cards with a debit function
Table 9a (cont)
by cards with a delayed debit function by cards with a credit function
Note: Please refer to the individual country tables and the country footnotes to Comparative Table 9 for a detailed explanation.CPSS: 1 Sum or average excluding those countries for which data are not available.
CPSS – Payment systems in Turkey, 2007 71

Use of payment instruments by non-banks: increase in the real value of transactions(% change on previous year, adjusted by CPI inflation) 1
2001 2002 2003 2004 2005 2001 2002 2003 2004 2005Turkey nav nav nav nav nav nav nav nav nav navBelgium 5.1 -25.4 11.9 5.4 15.2 3.8 -16.1 3.9 -3.1 3.4Canada 6.8 0.8 7.5 4.4 9.5 22.7 15.4 11.1 8.2 8.1France 18.7 1.6 -0.2 7.2 nap 5.1 4.8 -1.6 1.2 13.7Germany 4.0 0.2 -0.7 -1.3 7.2 18.2 -3.1 -16.0 1.0 -3.0Hong Kong SAR nav nav nav nav nav nav nav nav nav navItaly -3.4 2.2 2.8 5.3 4.1 5.7 2.3 6.7 14.3 3.1Japan 2.3 -6.4 1.3 2.0 5.3 nav nav nav nav navNetherlands 9.0 -1.3 8.1 15.2 16.8 3.0 3.0 10.3 2.2 1.3Singapore 19.3 -12.7 -2.1 -1.6 27.0 10.8 32.3 16.9 11.0 7.8Sweden -6.8 -28.7 0.8 6.8 12.1 -1.1 -6.0 7.1 9.1 13.0Switzerland -0.5 -2.0 -0.9 -6.8 -3.8 1.2 0.0 3.4 3.3 0.9United Kingdom 10.8 -3.6 3.6 0.9 3.2 6.2 9.6 5.9 11.9 4.1United States 9.5 10.6 10.1 8.8 8.7 4.3 4.8 11.7 -4.2 5.6CPSS1 nap nap nap nap nap 6.8 5.4 10.7 2.8 4.5
2001 2002 2003 2004 2005 2001 2002 2003 2004 2005Turkey -18.6 16.6 16.1 10.2 10.0 nav nav nav nav navBelgium 11.5 -1.3 -14.3 -7.9 -17.2 31.8 144.2 -19.1 -5.4 -9.8Canada -8.3 -8.4 -25.2 -7.3 3.1 nav nav nav nav navFrance -4.6 5.4 0.2 -16.3 2.4 nap 586.9 -2.2 -26.1 -20.5Germany -10.3 -15.5 -14.3 -17.8 -9.6 nav nav nav nav navHong Kong SAR nav nav nav nav nav nav nav nav nav navItaly 2.3 -2.9 -4.0 -1.7 -4.3 nav nav 192.2 208.1 174.4Japan -16.0 -18.9 -10.1 -4.7 -12.1 nav nav nav nav navNetherlands -62.3 -98.3 nap nap nap 11.1 168.2 23.5 15.8 12.0Singapore -8.7 -8.2 -2.4 5.2 6.0 22.3 215.5 86.9 5.5 6.1Sweden -29.2 27.1 114.9 29.0 -50.0 nav nav nav nav navSwitzerland -33.9 -29.6 -24.1 -21.6 -51.2 nap -0.6 -0.6 -0.8 -1.2United Kingdom -2.2 -4.2 -4.1 -4.7 -7.3 nav nav nav nav navUnited States -2.6 -1.9 -3.1 -3.9 -4.5 nap nap nap nap napCPSS1 -7.2 -4.3 -1.7 -2.1 -4.2 22.1 183.8 42.1 33.1 47.0
Credit transfers
Table 9b
Note: Please refer to the individual country tables for a detailed explanation.1 Value of transactions in domestic currency deflated by yearly average CPI inflation. For the CPSS area, in US dollar terms.
CPSS: 1 Sum or average excluding those countries for which data are not available. For credit transfers, Belgium, France (prior to 2005),Singapore, Switzerland and the United Kingdom include interbank transactions. Since the value of these transactions is relatively large, cross-country comparison should be treated with caution; consequently, CPSS figures related to credit transfers have not been calculated.
Direct debits
Table 9b (cont)
Cheques E-money payment transactions
CPSS – Payment systems in Turkey, 2007 72

2001 2002 2003 2004 2005 2001 2002 2003 2004 2005Turkey -5.5 39.7 37.4 50.5 23.3 -1.1 85.0 54.9 83.0 87.8Belgium 8.5 11.2 4.9 4.3 10.2 10.0 13.8 6.6 7.9 7.8Canada 0.2 16.4 6.0 6.9 11.1 8.7 8.0 7.6 5.3 8.1France 9.1 9.7 5.1 5.2 16.3 nav nav nav nav navGermany 7.9 8.4 4.2 5.2 3.4 10.0 9.2 4.8 4.5 2.4Hong Kong SAR nav nav nav nav nav nav nav nav nav navItaly 24.9 23.6 6.4 13.8 7.7 37.1 34.6 10.5 11.5 7.1Japan 8.3 7.5 8.2 10.2 10.7 109.2 43.9 22.3 33.5 13.3Netherlands 11.0 8.6 3.0 3.9 7.1 12.8 10.1 4.2 3.9 3.4Singapore 5.6 7.0 4.2 11.1 18.3 8.5 5.1 4.7 10.8 25.0Sweden 20.5 37.7 -2.8 nav nav 26.5 57.1 -5.7 nav navSwitzerland nav 7.9 2.0 -3.8 13.9 nav 11.4 4.1 -7.3 18.4United Kingdom 15.7 10.6 13.9 10.3 5.6 23.6 12.4 19.4 13.8 11.5United States 5.9 7.0 10.5 11.0 10.1 21.8 22.7 20.1 20.9 15.8CPSS1 5.8 10.3 15.6 13.0 10.3 17.9 21.4 23.4 17.1 12.8
2001 2002 2003 2004 2005 2001 2002 2003 2004 2005Turkey nav nav nav nav nav -5.5 39.5 37.3 50.3 22.8Belgium 3.9 3.1 -0.9 -9.1 20.5 nav nav nav nav navCanada nap nap nap nap nap -5.6 23.0 4.9 8.0 13.1France nap nap nap nap nap nav nav nav nav navGermany 5.4 2.0 2.3 7.7 6.8 nav nav nav nav navHong Kong SAR nav nav nav nav nav nav nav nav nav navItaly nav nav nav nav nav 13.8 11.5 0.9 17.2 8.5Japan nap nap nap nap nap 7.7 7.0 7.9 9.7 10.7Netherlands -2.5 -3.9 -8.3 4.8 47.4 nap nap nap nap napSingapore nav nav nav nav nav 3.7 8.2 3.9 11.2 13.8Sweden -1.0 -6.4 6.2 6.4 -6.9 34.4 -19.7 20.3 11.6 -1.8Switzerland nav nav nav nav nav nav 1.5 -2.1 3.4 5.3United Kingdom 16.2 -1.5 -0.5 3.7 2.3 7.2 12.0 10.7 7.1 -2.1United States nav nav nav nav nav 1.9 2.4 7.1 7.0 7.5CPSS1 4.5 5.0 15.3 15.4 6.8 1.0 4.6 10.3 10.6 8.0
by cards with a delayed debit function by cards with a credit function
Table 9b (cont)
Card payments (except e-money) of which: by cards with a debit function
Table 9b (cont)
Note: Please refer to the individual country tables and the country footnotes to Comparative Table 9 for a detailed explanation.1 Value of transactions in domestic currency deflated by yearly average CPI inflation. For the CPSS area, in US dollar terms. CPSS: 1 Sum or average excluding those countries for which data are not available.
CPSS – Payment systems in Turkey, 2007 73

Use of payment instruments by non-banks: average value per transaction(USD, total for the year) 1
2001 2002 2003 2004 2005 2001 2002 2003 2004 2005Turkey nav nav nav nav nav nav nav nav nav navBelgium 20,900 15,347 23,064 25,288 28,792 274 258 286 283 289Canada 4,150 4,105 4,594 4,790 5,349 345 377 448 505 565France 38,216 35,354 42,801 51,412 6,943 305 324 362 382 448Germany 4,379 4,799 5,531 5,737 5,762 737 810 687 700 628Hong Kong SAR nav nav nav nav nav nav nav nav nav navItaly 3,811 4,453 5,472 6,297 6,701 504 502 639 752 775Japan1 15,313 14,309 15,394 16,161 15,827 nav nav nav nav navNetherlands 2,393 2,515 3,300 4,265 5,216 179 187 239 259 273Singapore 386,658 318,462 287,233 269,289 316,904 616 508 416 455 467Sweden 1,080 1,464 1,862 2,034 2,041 257 216 261 288 288Switzerland 55,077 55,097 60,517 59,327 55,034 902 936 1,099 1,232 1,238United Kingdom 54,254 53,084 55,155 53,763 48,807 372 404 445 531 532United States 2,354 2,502 2,640 2,743 2,835 3,415 3,068 2,877 2,052 1,774CPSS1 nap nap nap nap nap 1,113 1,131 1,111 1,002 958
2001 2002 2003 2004 2005 2001 2002 2003 2004 2005Turkey 1,665 2,066 2,760 3,640 4,928 nav nav nav nav navBelgium 1,476 3,238 4,112 5,266 5,449 4.0 5.2 5.8 6.2 6.0Canada 2,090 2,026 1,826 1,953 2,251 nav nav nav nav navFrance 456 515 645 626 690 nap 3.6 4.4 4.1 3.1Germany 2,524 4,867 5,731 6,275 5,963 0.0 0.0 0.0 0.0 0.0Hong Kong SAR nav nav nav nav nav nav nav nav nav navItaly 1,840 2,094 2,634 3,027 3,097 nav nav 75.6 76.9 98.7Japan 34,591 30,125 31,747 35,051 32,788 nav nav nav nav navNetherlands 76 103 nap nap nap 2.5 2.6 3.1 3.4 3.4Singapore 2,654 2,462 2,571 2,863 3,133 1.1 0.5 0.5 0.5 0.5Sweden 773 1,066 5,638 nav nav nav nav nav nav navSwitzerland 1,523 1,871 2,124 2,356 1,739 2.1 2.2 2.7 3.0 2.9United Kingdom 1,096 1,189 1,337 1,560 1,583 nav nav nav nav navUnited States 989 1,027 1,065 1,103 1,141 nap nap nap nap napCPSS1 1,147 1,163 1,215 1,272 1,309 2.0 1.4 1.1 1.4 2.1
Japan: 1 For credit transfers, total for the fiscal year ending March of the following year, converted at average fiscal year exchange rates.
Table 9c
Credit transfers Direct debits
Table 9c (cont)
Cheques E-money payment transactions
Note: Please refer to the individual country tables for a detailed explanation.1 Converted at yearly average exchange rates, except as noted.
CPSS: 1 Sum or average excluding those countries for which data are not available. For credit transfers, Belgium, France (prior to 2005),Singapore, Switzerland and the United Kingdom include interbank transactions. Since the value of these transactions is relatively large, cross-country comparison should be treated with caution; consequently, CPSS figures related to credit transfers have not been calculated.
CPSS – Payment systems in Turkey, 2007 74
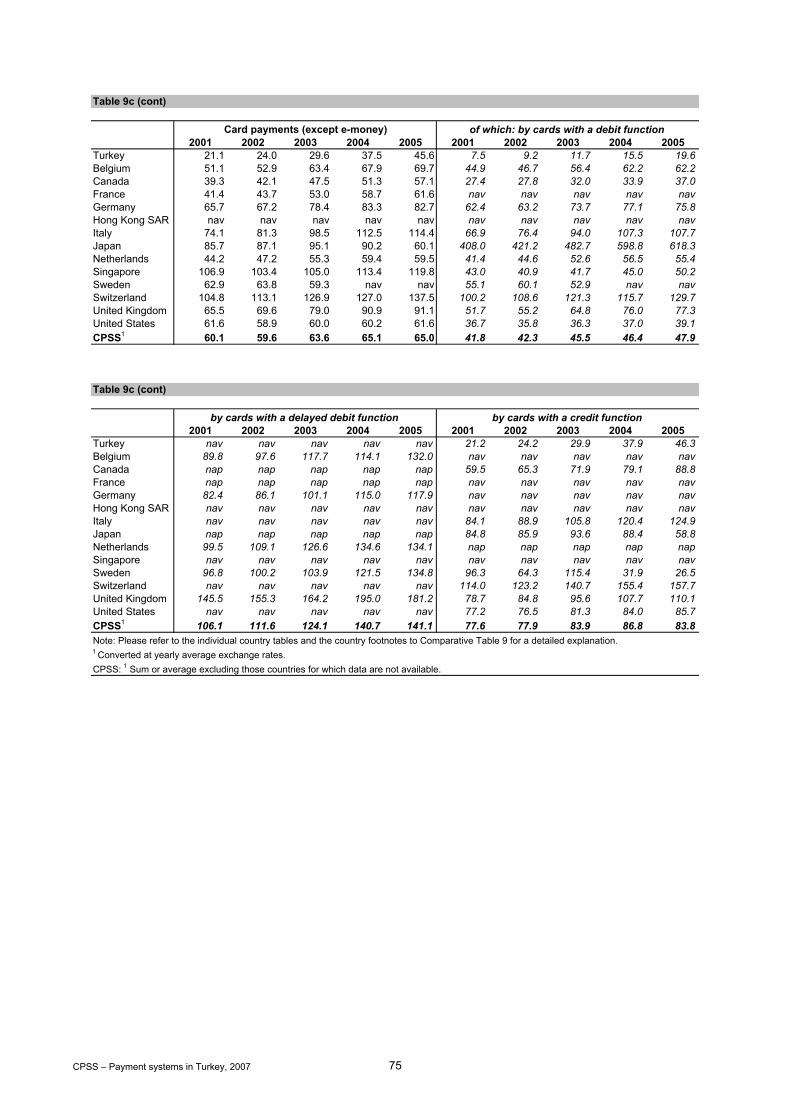
2001 2002 2003 2004 2005 2001 2002 2003 2004 2005Turkey 21.1 24.0 29.6 37.5 45.6 7.5 9.2 11.7 15.5 19.6Belgium 51.1 52.9 63.4 67.9 69.7 44.9 46.7 56.4 62.2 62.2Canada 39.3 42.1 47.5 51.3 57.1 27.4 27.8 32.0 33.9 37.0France 41.4 43.7 53.0 58.7 61.6 nav nav nav nav navGermany 65.7 67.2 78.4 83.3 82.7 62.4 63.2 73.7 77.1 75.8Hong Kong SAR nav nav nav nav nav nav nav nav nav navItaly 74.1 81.3 98.5 112.5 114.4 66.9 76.4 94.0 107.3 107.7Japan 85.7 87.1 95.1 90.2 60.1 408.0 421.2 482.7 598.8 618.3Netherlands 44.2 47.2 55.3 59.4 59.5 41.4 44.6 52.6 56.5 55.4Singapore 106.9 103.4 105.0 113.4 119.8 43.0 40.9 41.7 45.0 50.2Sweden 62.9 63.8 59.3 nav nav 55.1 60.1 52.9 nav navSwitzerland 104.8 113.1 126.9 127.0 137.5 100.2 108.6 121.3 115.7 129.7United Kingdom 65.5 69.6 79.0 90.9 91.1 51.7 55.2 64.8 76.0 77.3United States 61.6 58.9 60.0 60.2 61.6 36.7 35.8 36.3 37.0 39.1CPSS1 60.1 59.6 63.6 65.1 65.0 41.8 42.3 45.5 46.4 47.9
2001 2002 2003 2004 2005 2001 2002 2003 2004 2005Turkey nav nav nav nav nav 21.2 24.2 29.9 37.9 46.3Belgium 89.8 97.6 117.7 114.1 132.0 nav nav nav nav navCanada nap nap nap nap nap 59.5 65.3 71.9 79.1 88.8France nap nap nap nap nap nav nav nav nav navGermany 82.4 86.1 101.1 115.0 117.9 nav nav nav nav navHong Kong SAR nav nav nav nav nav nav nav nav nav navItaly nav nav nav nav nav 84.1 88.9 105.8 120.4 124.9Japan nap nap nap nap nap 84.8 85.9 93.6 88.4 58.8Netherlands 99.5 109.1 126.6 134.6 134.1 nap nap nap nap napSingapore nav nav nav nav nav nav nav nav nav navSweden 96.8 100.2 103.9 121.5 134.8 96.3 64.3 115.4 31.9 26.5Switzerland nav nav nav nav nav 114.0 123.2 140.7 155.4 157.7United Kingdom 145.5 155.3 164.2 195.0 181.2 78.7 84.8 95.6 107.7 110.1United States nav nav nav nav nav 77.2 76.5 81.3 84.0 85.7CPSS1 106.1 111.6 124.1 140.7 141.1 77.6 77.9 83.9 86.8 83.8
Table 9c (cont)
Note: Please refer to the individual country tables and the country footnotes to Comparative Table 9 for a detailed explanation.
Card payments (except e-money) of which: by cards with a debit function
Table 9c (cont)
by cards with a delayed debit function by cards with a credit function
1 Converted at yearly average exchange rates. CPSS: 1 Sum or average excluding those countries for which data are not available.
CPSS – Payment systems in Turkey, 2007 75

Use of payment instruments by non-banks: value of transactions per inhabitant(USD, total for the year) 1
2001 2002 2003 2004 2005 2001 2002 2003 2004 2005Turkey nav nav nav nav nav nav nav nav nav navBelgium 1,510,187 1,200,543 1,625,689 1,914,106 2,247,825 4,713 4,213 5,299 5,734 6,041Canada 85,208 85,763 105,302 119,374 142,092 5,428 6,253 7,935 9,321 10,950France 1,360,236 1,473,363 1,788,217 2,144,146 266,675 10,302 11,510 13,773 15,599 17,960Germany 302,512 323,065 387,905 429,147 469,043 43,275 44,704 45,422 51,384 50,774Hong Kong SAR nav nav nav nav nav nav nav nav nav navItaly 69,539 76,627 96,954 114,750 120,830 3,182 3,509 4,608 5,921 6,176Japan1 151,842 144,274 157,060 168,287 167,752 nav nav nav nav navNetherlands 182,957 196,350 258,594 331,366 391,415 9,778 10,950 14,716 16,737 17,144Singapore 1,566,069 1,350,566 1,362,059 1,387,749 1,755,161 2,820 3,684 4,440 5,104 5,481Sweden 92,715 71,496 88,338 104,491 115,485 2,837 2,882 3,784 4,571 5,094Switzerland 3,804,334 4,034,564 4,610,886 4,663,188 4,498,388 5,892 6,373 7,599 8,512 8,613United Kingdom 1,775,835 1,801,384 2,052,147 2,341,924 2,430,012 13,537 15,602 18,154 22,971 24,053United States 34,913 38,706 43,052 47,557 52,684 35,069 36,853 41,604 40,466 43,544CPSS1 nap nap nap nap nap 20,655 21,862 24,433 25,422 26,937
2001 2002 2003 2004 2005 2001 2002 2003 2004 2005Turkey 625 753 1,028 1,293 1,609 nav nav nav nav navBelgium 8,623 9,061 9,403 9,676 8,163 23.5 61.1 59.9 63.2 58.1Canada 107,025 97,853 83,615 84,184 94,359 nav nav nav nav navFrance 32,377 36,389 44,363 41,550 43,098 0.1 1.1 1.3 1.1 0.8Germany 9,803 8,833 9,153 8,434 7,772 0.0 0.0 0.0 0.0 0.0Hong Kong SAR nav nav nav nav nav nav nav nav nav navItaly 18,734 19,610 23,179 25,621 24,800 nav nav 3.6 12.5 34.6Japan 56,757 44,211 42,761 43,665 37,589 nav nav nav nav navNetherlands 25 0 nap nap nap 4.7 13.8 20.7 26.7 30.3Singapore 58,997 53,488 53,777 58,594 61,840 28.3 88.3 170.0 185.7 196.2Sweden 174 239 629 nav nav nav nav nav nav navSwitzerland 1,506 1,147 1,004 853 417 5.7 6.1 7.0 7.6 7.5United Kingdom 47,575 47,948 50,534 54,479 50,763 nav nav nav nav navUnited States 139,095 136,724 133,907 130,713 127,189 nap nap nap nap napCPSS1 75,636 72,721 72,166 71,517 69,421 0.6 1.8 2.6 3.5 5.3
1 Converted at yearly average exchange rates, except as noted.
CPSS: 1 Sum or average excluding those countries for which data are not available. For credit transfers, Belgium, France (prior to 2005),Singapore, Switzerland and the United Kingdom include interbank transactions. Since the value of these transactions is relatively large, cross-country comparison should be treated with caution; consequently, CPSS figures related to credit transfers have not been calculated.
Japan: 1 For credit transfers, total for the fiscal year ending March of the following year, converted at average fiscal year exchange rates.
Table 9d (cont)
Note: Please refer to the individual country tables for a detailed explanation.
Cheques E-money payment transactions
Table 9d
Credit transfers Direct debits
CPSS – Payment systems in Turkey, 2007 76

2001 2002 2003 2004 2005 2001 2002 2003 2004 2005Turkey 144 208 337 578 806 1 1 2 4 9Belgium 2,497 2,958 3,758 4,376 4,913 1,890 2,292 2,959 3,565 3,917Canada 4,504 5,235 6,336 7,352 8,874 1,974 2,129 2,616 2,992 3,516France 2,489 2,911 3,719 4,378 5,155 nav nav nav nav navGermany 1,315 1,520 1,915 2,259 2,380 1,011 1,177 1,491 1,747 1,822Hong Kong SAR nav nav nav nav nav nav nav nav nav navItaly 967 1,288 1,688 2,160 2,354 506 734 999 1,253 1,358Japan 1,525 1,574 1,832 2,161 2,342 20 27 36 51 57Netherlands 2,760 3,260 4,093 4,732 5,128 2,465 2,952 3,749 4,331 4,530Singapore 2,493 2,633 2,827 3,250 3,829 1,003 1,042 1,124 1,289 1,605Sweden 2,834 4,217 5,025 nav nav 2,019 3,429 3,961 nav navSwitzerland 4,305 5,025 5,912 6,168 7,040 2,767 3,335 4,005 4,029 4,783United Kingdom 4,932 5,737 7,181 8,958 9,510 2,411 2,850 3,741 4,817 5,399United States 5,886 6,316 7,054 7,947 8,918 1,354 1,665 2,020 2,480 2,927CPSS1 3,643 4,035 4,710 5,388 6,021 1,065 1,299 1,619 1,920 2,196
2001 2002 2003 2004 2005 2001 2002 2003 2004 2005Turkey nav nav nav nav nav 144 207 335 574 797Belgium 607 666 799 811 996 nav nav nav nav navCanada nap nap nap nap nap 2,530 3,106 3,721 4,361 5,358France nap nap nap nap nap nav nav nav nav navGermany 315 343 424 512 557 nav nav nav nav navHong Kong SAR nav nav nav nav nav nav nav nav nav navItaly nav nav nav nav nav 461 554 689 907 996Japan nap nap nap nap nap 1,506 1,547 1,796 2,110 2,285Netherlands 295 308 344 401 598 nap nap nap nap napSingapore nav nav nav nav nav 1,489 1,591 1,703 1,961 2,224Sweden 566 573 745 878 806 249 216 319 394 381Switzerland nav nav nav nav nav 1,538 1,690 1,907 2,139 2,258United Kingdom 584 605 662 776 798 1,937 2,283 2,778 3,366 3,313United States nav nav nav nav nav 4,532 4,651 5,033 5,467 5,991CPSS1 101 107 124 145 157 2,277 2,394 2,666 2,983 3,265
Table 9d (cont)
Card payments (except e-money) of which: by cards with a debit function
Table 9d (cont)
by cards with a delayed debit function by cards with a credit function
Note: Please refer to the individual country tables and the country footnotes to Comparative Table 9 for a detailed explanation.1 Converted at yearly average exchange rates. CPSS: 1 Sum or average excluding those countries for which data are not available.
CPSS – Payment systems in Turkey, 2007 77

Use of payment instruments by non-banks: value of transactions as a ratio to GDP(in %, total for the year)
2001 2002 2003 2004 2005 2001 2002 2003 2004 2005Turkey nav nav nav nav nav nav nav nav nav navBelgium 6,702 4,916 5,439 5,544 6,349 20.9 17.3 17.7 16.6 17.1Canada 370 366 384 385 405 23.6 26.7 28.9 30.0 31.2France 6,206 6,211 6,151 6,483 787 47.0 48.5 47.4 47.2 53.0Germany 1,317 1,319 1,312 1,291 1,390 188.4 182.5 153.6 154.6 150.4Hong Kong SAR nav nav nav nav nav nav nav nav nav navItaly 357 361 370 382 397 16.3 16.5 17.6 19.7 20.3Japan 472 468 474 467 471 nav nav nav nav navNetherlands 733 723 779 886 1,017 39.2 40.3 44.3 44.8 44.6Singapore 7,551 6,376 6,173 5,506 6,527 13.6 17.4 20.1 20.2 20.4Sweden 373 262 260 269 292 11.4 10.5 11.1 11.8 12.9Switzerland 11,064 10,705 10,565 9,651 9,228 17.1 16.9 17.4 17.6 17.7United Kingdom 7,314 6,792 6,742 6,502 6,568 55.8 58.8 59.6 63.8 65.0United States 98 107 114 119 125 98.8 101.5 110.4 101.4 103.4CPSS1 nap nap nap nap nap 70.8 72.8 73.8 70.0 71.7
2001 2002 2003 2004 2005 2001 2002 2003 2004 2005Turkey 29.5 28.7 30.4 30.6 32.1 nav nav nav nav navBelgium 38.3 37.1 31.5 28.0 23.1 0.10 0.25 0.20 0.18 0.16Canada 464.3 417.6 304.9 271.3 269.0 nav nav nav nav navFrance 147.7 153.4 152.6 125.6 127.2 0.00 0.00 0.00 0.00 0.00Germany 42.7 36.1 31.0 25.4 23.0 0.00 0.00 0.00 0.00 0.00Hong Kong SAR nav nav nav nav nav nav nav nav nav navItaly 96.2 92.3 88.4 85.3 81.6 nav nav 0.01 0.04 0.11Japan 176.3 143.5 129.1 121.1 105.5 nav nav nav nav navNetherlands 0.1 0.0 nap nap nap 0.02 0.05 0.06 0.07 0.08Singapore 284.5 252.5 243.7 232.5 230.0 0.14 0.42 0.77 0.74 0.73Sweden 0.7 0.9 1.9 2.3 nav nav nav nav nav navSwitzerland 4.4 3.0 2.3 1.8 0.9 0.02 0.02 0.02 0.02 0.02United Kingdom 196.0 180.8 166.0 151.3 137.2 nav nav nav nav navUnited States 391.9 376.4 355.3 327.4 302.1 neg neg neg neg negCPSS1 259.3 242.2 218.0 196.9 184.9 0.00 0.01 0.01 0.01 0.01
Table 9e
Credit transfers Direct debits
Table 9e (cont)
Cheques E-money payment transactions
Note: Please refer to the individual country tables for a detailed explanation.
CPSS: 1 Sum or average excluding those countries for which data are not available. For credit transfers, Belgium, France (prior to 2005),Singapore, Switzerland and the United Kingdom include interbank transactions. Since the value of these transactions is relatively large, cross-country comparison should be treated with caution; consequently, CPSS figures related to credit transfers have not been calculated.
CPSS – Payment systems in Turkey, 2007 78

2001 2002 2003 2004 2005 2001 2002 2003 2004 2005Turkey 6.8 7.9 10.0 13.7 16.1 0.0 0.0 0.1 0.1 0.2Belgium 11.1 12.1 12.6 12.7 13.9 8.4 9.4 9.9 10.3 11.1Canada 19.5 22.3 23.1 23.7 25.3 8.6 9.1 9.5 9.6 10.0France 11.4 12.3 12.8 13.2 15.2 nav nav nav nav navGermany 5.7 6.2 6.5 6.8 7.1 4.4 4.8 5.0 5.3 5.4Hong Kong SAR nav nav nav nav nav nav nav nav nav navItaly 5.0 6.1 6.4 7.2 7.7 2.6 3.5 3.8 4.2 4.5Japan 4.7 5.1 5.5 6.0 6.6 0.1 0.1 0.1 0.1 0.2Netherlands 11.1 12.0 12.3 12.7 13.3 9.9 10.9 11.3 11.6 11.8Singapore 12.0 12.4 12.8 12.9 14.2 4.8 4.9 5.1 5.1 6.0Sweden 11.4 15.4 14.8 nav nav 8.1 12.5 11.7 nav navSwitzerland 12.5 13.3 13.5 12.8 14.4 8.0 8.8 9.2 8.3 9.8United Kingdom 20.3 21.6 23.6 24.9 25.7 9.9 10.7 12.3 13.4 14.6United States 16.6 17.4 18.7 19.9 21.2 3.8 4.6 5.4 6.2 7.0CPSS1 12.5 13.4 14.2 14.8 16.0 3.7 4.3 4.9 5.3 5.8
2001 2002 2003 2004 2005 2001 2002 2003 2004 2005Turkey nav nav nav nav nav 6.8 7.9 9.9 13.6 15.9Belgium 2.7 2.7 2.7 2.3 2.8 nav nav nav nav navCanada nap nap nap nap nap 11.0 13.3 13.6 14.1 15.3France nap nap nap nap nap nav nav nav nav navGermany 1.4 1.4 1.4 1.5 1.7 nav nav nav nav navHong Kong SAR nav nav nav nav nav nav nav nav nav navItaly nav nav nav nav nav 2.4 2.6 2.6 3.0 3.3Japan nap nap nap nap nap 4.7 5.0 5.4 5.9 navNetherlands 1.2 1.1 1.0 1.1 1.6 nap nap nap nap napSingapore nav nav nav nav nav 7.2 7.5 7.7 7.8 8.3Sweden 2.3 2.1 2.2 2.3 2.0 1.0 0.8 0.9 1.0 1.0Switzerland nav nav nav nav nav 4.5 4.5 4.4 4.4 4.6United Kingdom 2.4 2.3 2.2 2.2 2.2 8.0 8.6 9.1 9.3 9.0United States nav nav nav nav nav 12.8 12.8 13.4 13.7 14.2CPSS1 0.3 0.4 0.4 0.4 0.4 7.8 8.0 8.1 8.2 8.7
of which: by cards with a debit function
Table 9e (cont)
CPSS: 1 Sum or average excluding those countries for which data are not available.Note: Please refer to the individual country tables and the country footnotes to Comparative Table 9 for a detailed explanation.
by cards with a delayed debit function by cards with a credit function
Table 9e (cont)
Card payments (except e-money)
CPSS – Payment systems in Turkey, 2007 79
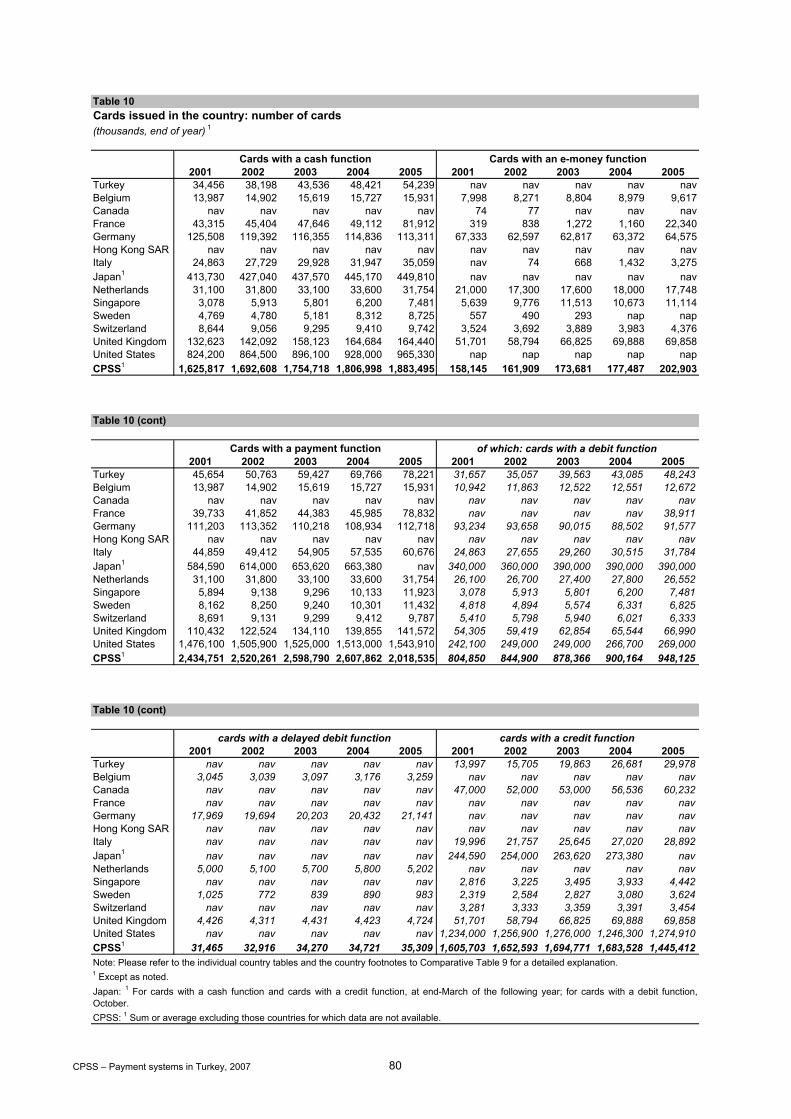
(thousands, end of year) 1
2001 2002 2003 2004 2005 2001 2002 2003 2004 2005Turkey 34,456 38,198 43,536 48,421 54,239 nav nav nav nav navBelgium 13,987 14,902 15,619 15,727 15,931 7,998 8,271 8,804 8,979 9,617Canada nav nav nav nav nav 74 77 nav nav navFrance 43,315 45,404 47,646 49,112 81,912 319 838 1,272 1,160 22,340Germany 125,508 119,392 116,355 114,836 113,311 67,333 62,597 62,817 63,372 64,575Hong Kong SAR nav nav nav nav nav nav nav nav nav navItaly 24,863 27,729 29,928 31,947 35,059 nav 74 668 1,432 3,275Japan1 413,730 427,040 437,570 445,170 449,810 nav nav nav nav navNetherlands 31,100 31,800 33,100 33,600 31,754 21,000 17,300 17,600 18,000 17,748Singapore 3,078 5,913 5,801 6,200 7,481 5,639 9,776 11,513 10,673 11,114Sweden 4,769 4,780 5,181 8,312 8,725 557 490 293 nap napSwitzerland 8,644 9,056 9,295 9,410 9,742 3,524 3,692 3,889 3,983 4,376United Kingdom 132,623 142,092 158,123 164,684 164,440 51,701 58,794 66,825 69,888 69,858United States 824,200 864,500 896,100 928,000 965,330 nap nap nap nap napCPSS1 1,625,817 1,692,608 1,754,718 1,806,998 1,883,495 158,145 161,909 173,681 177,487 202,903
2001 2002 2003 2004 2005 2001 2002 2003 2004 2005Turkey 45,654 50,763 59,427 69,766 78,221 31,657 35,057 39,563 43,085 48,243Belgium 13,987 14,902 15,619 15,727 15,931 10,942 11,863 12,522 12,551 12,672Canada nav nav nav nav nav nav nav nav nav navFrance 39,733 41,852 44,383 45,985 78,832 nav nav nav nav 38,911Germany 111,203 113,352 110,218 108,934 112,718 93,234 93,658 90,015 88,502 91,577Hong Kong SAR nav nav nav nav nav nav nav nav nav navItaly 44,859 49,412 54,905 57,535 60,676 24,863 27,655 29,260 30,515 31,784Japan1 584,590 614,000 653,620 663,380 nav 340,000 360,000 390,000 390,000 390,000Netherlands 31,100 31,800 33,100 33,600 31,754 26,100 26,700 27,400 27,800 26,552Singapore 5,894 9,138 9,296 10,133 11,923 3,078 5,913 5,801 6,200 7,481Sweden 8,162 8,250 9,240 10,301 11,432 4,818 4,894 5,574 6,331 6,825Switzerland 8,691 9,131 9,299 9,412 9,787 5,410 5,798 5,940 6,021 6,333United Kingdom 110,432 122,524 134,110 139,855 141,572 54,305 59,419 62,854 65,544 66,990United States 1,476,100 1,505,900 1,525,000 1,513,000 1,543,910 242,100 249,000 249,000 266,700 269,000CPSS1 2,434,751 2,520,261 2,598,790 2,607,862 2,018,535 804,850 844,900 878,366 900,164 948,125
2001 2002 2003 2004 2005 2001 2002 2003 2004 2005Turkey nav nav nav nav nav 13,997 15,705 19,863 26,681 29,978Belgium 3,045 3,039 3,097 3,176 3,259 nav nav nav nav navCanada nav nav nav nav nav 47,000 52,000 53,000 56,536 60,232France nav nav nav nav nav nav nav nav nav navGermany 17,969 19,694 20,203 20,432 21,141 nav nav nav nav navHong Kong SAR nav nav nav nav nav nav nav nav nav navItaly nav nav nav nav nav 19,996 21,757 25,645 27,020 28,892Japan1 nav nav nav nav nav 244,590 254,000 263,620 273,380 navNetherlands 5,000 5,100 5,700 5,800 5,202 nav nav nav nav navSingapore nav nav nav nav nav 2,816 3,225 3,495 3,933 4,442Sweden 1,025 772 839 890 983 2,319 2,584 2,827 3,080 3,624Switzerland nav nav nav nav nav 3,281 3,333 3,359 3,391 3,454United Kingdom 4,426 4,311 4,431 4,423 4,724 51,701 58,794 66,825 69,888 69,858United States nav nav nav nav nav 1,234,000 1,256,900 1,276,000 1,246,300 1,274,910CPSS1 31,465 32,916 34,270 34,721 35,309 1,605,703 1,652,593 1,694,771 1,683,528 1,445,412
Table 10Cards issued in the country: number of cards
Cards with a cash function Cards with an e-money function
Table 10 (cont)
Cards with a payment function of which: cards with a debit function
Table 10 (cont)
cards with a delayed debit function cards with a credit function
Note: Please refer to the individual country tables and the country footnotes to Comparative Table 9 for a detailed explanation.
CPSS: 1 Sum or average excluding those countries for which data are not available.
1 Except as noted.Japan: 1 For cards with a cash function and cards with a credit function, at end-March of the following year; for cards with a debit function,October.
CPSS – Payment systems in Turkey, 2007 80

(% change on previous year)
2001 2002 2003 2004 2005 2001 2002 2003 2004 2005Turkey 6.9 10.9 14.0 11.2 12.0 nav nav nav nav navBelgium 0.4 6.5 4.8 0.7 1.3 0.8 3.4 6.4 2.0 7.1Canada nav nav nav nav nav -14.9 4.1 nav nav navFrance 5.8 4.8 4.9 3.1 66.8 nav 162.7 51.8 -8.8 1,826Germany 14.7 -4.9 -2.5 -1.3 -1.3 10.9 -7.0 0.4 0.9 1.9Hong Kong SAR nav nav nav nav nav nav nav nav nav navItaly 17.4 11.5 7.9 6.7 9.7 nav nav 802.7 114.4 128.7Japan 2.8 3.2 2.5 1.7 1.0 nav nav nav nav navNetherlands 0.3 2.3 4.1 1.5 -5.5 0.5 -17.6 1.7 2.3 -1.4Singapore 3.2 92.1 -1.9 6.9 20.7 20.1 73.4 17.8 -7.3 4.1Sweden -2.5 0.2 8.4 60.4 5.0 -6.1 -12.0 -40.2 nav navSwitzerland 4.4 4.8 2.6 1.2 3.5 5.0 4.8 5.3 2.4 9.9United Kingdom 9.9 7.1 11.3 4.1 -0.1 9.8 13.7 13.7 4.6 0.0United States 8.5 4.9 3.7 3.6 4.0 nav nav nav nav navCPSS1 2.9 4.1 3.7 3.0 4.2 8.8 2.4 7.3 2.2 14.3
2001 2002 2003 2004 2005 2001 2002 2003 2004 2005Turkey 6.2 11.2 17.1 17.4 12.1 7.1 10.7 12.9 8.9 12.0Belgium 0.4 6.5 4.8 0.7 1.3 -0.2 8.4 5.6 0.2 1.0Canada nav nav nav nav nav nav nav nav nav navFrance 7.7 5.3 6.0 3.6 71.4 nav nav nav nav navGermany 1.6 1.9 -2.8 -1.2 3.5 -17.3 0.5 -3.9 -1.7 3.5Hong Kong SAR nav nav nav nav nav nav nav nav nav navItaly 17.6 10.1 11.1 4.8 5.5 17.4 11.2 5.8 4.3 4.2Japan 6.0 5.0 6.5 1.5 nav 6.3 5.9 8.3 0.0 0.0Netherlands 0.3 2.3 4.1 1.5 -5.5 0.4 2.3 2.6 1.5 -4.5Singapore 8.3 55.0 1.7 9.0 17.7 3.2 92.1 -1.9 6.9 20.7Sweden -2.6 1.1 12.0 11.5 11.0 5.4 1.6 13.9 13.6 7.8Switzerland 4.0 5.1 1.8 1.2 4.0 3.5 7.2 2.4 1.4 5.2United Kingdom 9.8 10.9 9.5 4.3 1.2 9.2 9.4 5.8 4.3 2.2United States 0.2 2.0 1.3 -0.8 2.0 8.5 2.9 0.0 7.1 0.9CPSS1 2.4 3.5 3.1 0.3 3.8 1.5 5.0 4.0 2.5 5.3
2001 2002 2003 2004 2005 2001 2002 2003 2004 2005Turkey nav nav nav nav nav 4.4 12.2 26.5 34.3 12.4Belgium 2.5 -0.2 1.9 2.6 2.6 nav nav nav nav navCanada nav nav nav nav nav 11.9 10.6 1.9 6.7 6.5France nav nav nav nav nav nav nav nav nav navGermany 8.0 9.6 2.6 1.1 3.5 nav nav nav nav navHong Kong SAR nav nav nav nav nav nav nav nav nav navItaly nav nav nav nav nav 17.8 8.8 17.9 5.4 6.9Japan nav nav nav nav nav 5.6 3.8 3.8 3.7 navNetherlands 0.0 2.0 11.8 1.8 -10.3 nav nav nav nav navSingapore nav nav nav nav nav 14.4 14.5 8.4 12.5 12.9Sweden 1.6 -24.7 8.7 6.1 10.4 -17.2 11.4 9.4 8.9 17.7Switzerland nav nav nav nav nav 4.8 1.6 0.8 1.0 1.9United Kingdom 17.3 -2.6 2.8 -0.2 6.8 9.8 13.7 13.7 4.6 0.0United States nav nav nav nav nav -1.3 1.9 1.5 -2.3 2.3CPSS1 7.1 4.6 4.1 1.3 1.7 0.6 2.9 2.6 -0.7 2.5Note: Please refer to the individual country tables and the country footnotes to Comparative Table 9 for a detailed explanation.CPSS: 1 Sum or average excluding those countries for which data are not available.
Table 10aCards issued in the country: increase in the number of cards
Cards with a cash function Cards with an e-money function
Table 10a (cont)
Cards with a payment function of which: cards with a debit function
Table 10a (cont)
cards with a delayed debit function cards with a credit function
CPSS – Payment systems in Turkey, 2007 81

(end of year) 1
2001 2002 2003 2004 2005 2001 2002 2003 2004 2005Turkey 0.50 0.55 0.62 0.68 0.75 nav nav nav nav navBelgium 1.36 1.44 1.51 1.51 1.52 0.78 0.80 0.85 0.86 0.92Canada nav nav nav nav nav 0.00 0.00 nav nav navFrance 0.71 0.74 0.77 0.79 1.31 0.01 0.01 0.02 0.02 0.36Germany 1.52 1.45 1.41 1.39 1.37 0.82 0.76 0.76 0.77 0.78Hong Kong SAR nav nav nav nav nav nav nav nav nav navItaly 0.43 0.48 0.52 0.56 0.60 nav nav 0.01 0.02 0.06Japan1 3.25 3.35 3.43 3.48 3.52 nav nav nav nav navNetherlands 1.94 1.97 2.04 2.06 1.95 1.31 1.07 1.08 1.11 1.09Singapore 0.74 1.42 1.39 1.46 1.72 1.36 2.34 2.75 2.52 2.56Sweden 0.54 0.54 0.58 0.92 0.97 0.06 0.05 0.03 nav navSwitzerland 1.19 1.23 1.26 1.26 1.30 0.48 0.50 0.53 0.53 0.58United Kingdom 2.24 2.40 2.66 2.75 2.73 0.87 0.99 1.12 1.17 1.16United States 2.89 3.00 3.08 3.16 3.25 nap nap nap nap napCPSS1 2.26 2.34 2.41 2.47 2.56 0.56 0.57 0.56 0.59 0.67
2001 2002 2003 2004 2005 2001 2002 2003 2004 2005Turkey 0.67 0.73 0.84 0.98 1.09 0.46 0.51 0.56 0.60 0.67Belgium 1.36 1.44 1.51 1.51 1.52 1.06 1.15 1.21 1.20 1.21Canada nav nav nav nav nav nav nav nav nav navFrance 0.65 0.68 0.72 0.74 1.26 nav nav nav nav navGermany 1.35 1.37 1.34 1.32 1.37 1.13 1.14 1.09 1.07 1.11Hong Kong SAR nav nav nav nav nav nav nav nav nav navItaly 0.78 0.86 0.96 1.00 1.04 0.43 0.48 0.51 0.53 0.55Japan1 4.59 4.82 5.12 5.19 nav 2.67 2.82 3.05 3.05 3.05Netherlands 1.94 1.97 2.04 2.06 1.95 1.63 1.65 1.69 1.71 1.63Singapore 1.42 2.19 2.22 2.39 2.75 0.74 1.42 1.39 1.46 1.72Sweden 0.92 0.92 1.03 1.15 1.27 0.54 0.55 0.62 0.70 0.76Switzerland 1.19 1.24 1.26 1.26 1.30 0.74 0.79 0.80 0.81 0.84United Kingdom 1.87 2.07 2.25 2.34 2.35 0.92 1.00 1.06 1.10 1.11United States 5.17 5.22 5.24 5.15 5.20 0.85 0.86 0.86 0.91 0.91CPSS1 3.39 3.48 3.57 3.57 3.32 1.22 1.28 1.32 1.35 1.41
2001 2002 2003 2004 2005 2001 2002 2003 2004 2005Turkey nav nav nav nav nav 0.20 0.23 0.28 0.37 0.42Belgium 0.30 0.29 0.30 0.30 0.31 nav nav nav nav navCanada nav nav nav nav nav 1.51 1.66 1.67 1.77 1.87France nav nav nav nav nav nav nav nav nav navGermany 0.22 0.24 0.24 0.25 0.26 nav nav nav nav navHong Kong SAR nav nav nav nav nav nav nav nav nav navItaly nav nav nav nav nav 0.35 0.38 0.45 0.47 0.50Japan1 nav nav nav nav nav 1.92 1.99 2.06 2.14 navNetherlands 0.31 0.32 0.35 0.36 0.32 nav nav nav nav navSingapore nav nav nav nav nav 0.68 0.77 0.83 0.93 1.02Sweden 0.12 0.09 0.09 0.10 0.11 0.26 0.29 0.32 0.34 0.40Switzerland nav nav nav nav nav 0.45 0.45 0.45 0.45 0.46United Kingdom 0.07 0.07 0.07 0.07 0.08 0.87 0.99 1.12 1.17 1.16United States nav nav nav nav nav 4.32 4.36 4.38 4.24 4.30CPSS1 0.18 0.19 0.19 0.20 0.20 2.77 2.83 2.88 2.85 3.09
Table 10b (cont)
Cards with a payment function
1 Except as noted.Japan: 1 For cards with a cash function and cards with a credit function, at end-March of the following year; for cards with a debit function,October.
of which: cards with a debit function
Table 10b (cont)
cards with a delayed debit function cards with a credit function
Table 10bCards issued in the country: number of cards per inhabitant
Cards with a cash function Cards with an e-money function
Note: Please refer to the individual country tables and the country footnotes to Comparative Table 9 for a detailed explanation.
CPSS: 1 Sum or average excluding those countries for which data are not available.
CPSS – Payment systems in Turkey, 2007 82
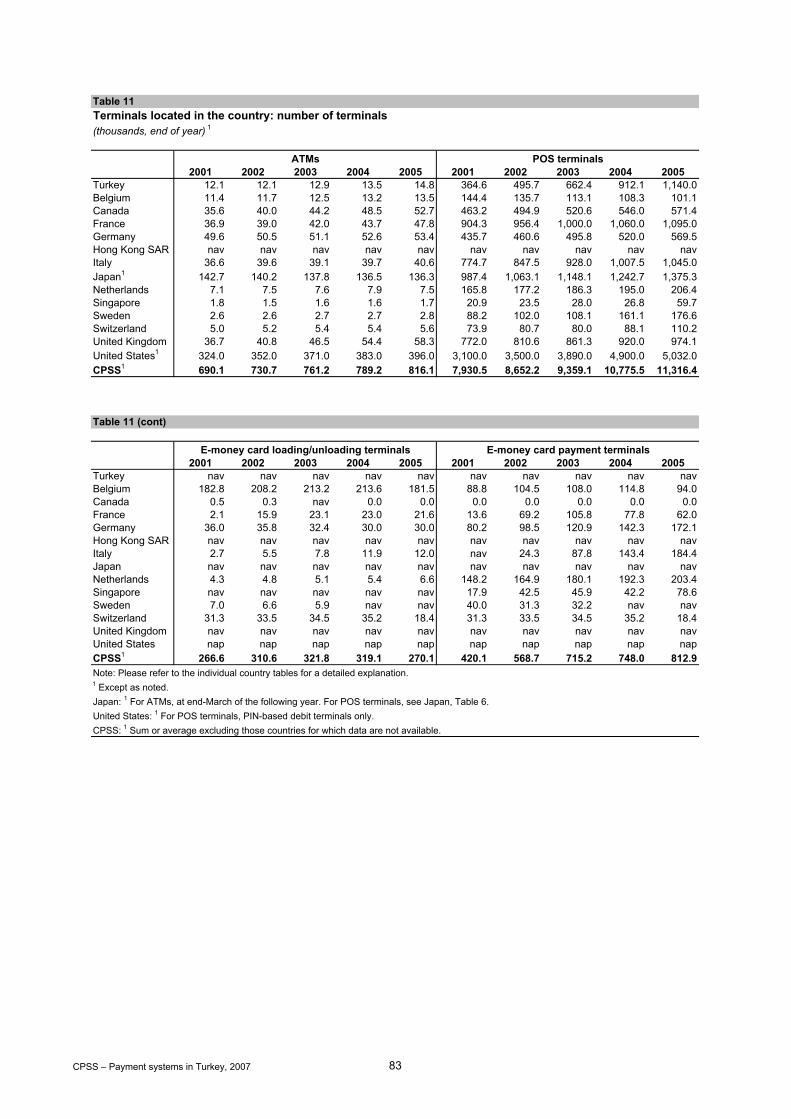
(thousands, end of year) 1
2001 2002 2003 2004 2005 2001 2002 2003 2004 2005Turkey 12.1 12.1 12.9 13.5 14.8 364.6 495.7 662.4 912.1 1,140.0Belgium 11.4 11.7 12.5 13.2 13.5 144.4 135.7 113.1 108.3 101.1Canada 35.6 40.0 44.2 48.5 52.7 463.2 494.9 520.6 546.0 571.4France 36.9 39.0 42.0 43.7 47.8 904.3 956.4 1,000.0 1,060.0 1,095.0Germany 49.6 50.5 51.1 52.6 53.4 435.7 460.6 495.8 520.0 569.5Hong Kong SAR nav nav nav nav nav nav nav nav nav navItaly 36.6 39.6 39.1 39.7 40.6 774.7 847.5 928.0 1,007.5 1,045.0Japan1 142.7 140.2 137.8 136.5 136.3 987.4 1,063.1 1,148.1 1,242.7 1,375.3Netherlands 7.1 7.5 7.6 7.9 7.5 165.8 177.2 186.3 195.0 206.4Singapore 1.8 1.5 1.6 1.6 1.7 20.9 23.5 28.0 26.8 59.7Sweden 2.6 2.6 2.7 2.7 2.8 88.2 102.0 108.1 161.1 176.6Switzerland 5.0 5.2 5.4 5.4 5.6 73.9 80.7 80.0 88.1 110.2United Kingdom 36.7 40.8 46.5 54.4 58.3 772.0 810.6 861.3 920.0 974.1United States1 324.0 352.0 371.0 383.0 396.0 3,100.0 3,500.0 3,890.0 4,900.0 5,032.0CPSS1 690.1 730.7 761.2 789.2 816.1 7,930.5 8,652.2 9,359.1 10,775.5 11,316.4
2001 2002 2003 2004 2005 2001 2002 2003 2004 2005Turkey nav nav nav nav nav nav nav nav nav navBelgium 182.8 208.2 213.2 213.6 181.5 88.8 104.5 108.0 114.8 94.0Canada 0.5 0.3 nav 0.0 0.0 0.0 0.0 0.0 0.0 0.0France 2.1 15.9 23.1 23.0 21.6 13.6 69.2 105.8 77.8 62.0Germany 36.0 35.8 32.4 30.0 30.0 80.2 98.5 120.9 142.3 172.1Hong Kong SAR nav nav nav nav nav nav nav nav nav navItaly 2.7 5.5 7.8 11.9 12.0 nav 24.3 87.8 143.4 184.4Japan nav nav nav nav nav nav nav nav nav navNetherlands 4.3 4.8 5.1 5.4 6.6 148.2 164.9 180.1 192.3 203.4Singapore nav nav nav nav nav 17.9 42.5 45.9 42.2 78.6Sweden 7.0 6.6 5.9 nav nav 40.0 31.3 32.2 nav navSwitzerland 31.3 33.5 34.5 35.2 18.4 31.3 33.5 34.5 35.2 18.4United Kingdom nav nav nav nav nav nav nav nav nav navUnited States nap nap nap nap nap nap nap nap nap napCPSS1 266.6 310.6 321.8 319.1 270.1 420.1 568.7 715.2 748.0 812.9
E-money card payment terminals
Table 11 (cont)
E-money card loading/unloading terminals
Table 11Terminals located in the country: number of terminals
ATMs POS terminals
Note: Please refer to the individual country tables for a detailed explanation.
CPSS: 1 Sum or average excluding those countries for which data are not available.
1 Except as noted.Japan: 1 For ATMs, at end-March of the following year. For POS terminals, see Japan, Table 6.United States: 1 For POS terminals, PIN-based debit terminals only.
CPSS – Payment systems in Turkey, 2007 83

(% change on previous year)
2001 2002 2003 2004 2005 2001 2002 2003 2004 2005Turkey 1.1 -0.5 6.5 5.3 9.4 21.7 35.9 33.6 37.7 25.0Belgium 4.6 2.5 7.0 5.6 2.3 24.0 -6.0 -16.7 -4.2 -6.6Canada 11.6 12.2 10.5 9.7 8.6 5.7 6.8 5.2 4.9 4.6France 5.0 5.6 7.7 4.1 9.4 7.8 5.8 4.6 6.0 3.3Germany 4.1 1.7 1.3 2.9 1.5 -26.3 5.7 7.6 4.9 9.5Hong Kong SAR nav nav nav nav nav nav nav nav nav navItaly 15.5 8.3 -1.5 1.7 2.2 29.4 9.4 9.5 8.6 3.7Japan 0.1 -1.8 -1.7 -0.9 -0.2 7.3 7.7 8.0 8.2 10.7Netherlands 3.2 5.4 0.3 4.4 -4.7 6.5 6.9 5.1 4.7 5.9Singapore 0.2 -13.9 0.4 3.6 5.5 7.4 12.1 19.1 -4.1 122.9Sweden -1.9 3.1 1.1 0.9 3.7 1.3 15.6 5.9 49.1 9.6Switzerland 3.6 2.9 3.1 0.6 3.2 9.4 9.2 -0.8 10.1 25.2United Kingdom 11.1 11.3 13.8 17.1 7.1 5.0 5.0 6.3 6.8 5.9United States 18.7 8.6 5.4 3.2 3.4 10.7 12.9 11.1 26.0 2.7CPSS1 10.9 5.9 4.2 3.7 3.4 7.6 9.1 8.2 15.1 5.0
2001 2002 2003 2004 2005 2001 2002 2003 2004 2005Turkey nav nav nav nav nav nav nav nav nav navBelgium 48.7 13.9 2.4 0.2 -15.0 31.0 17.7 3.3 6.3 -18.1Canada nap -32.0 nav nav nav nav nav nav nav navFrance nav nav 45.0 -0.2 -5.9 nav nav 53.0 -26.5 -20.3Germany 47.1 -0.7 -9.5 -7.4 0.0 19.8 22.8 22.8 17.7 20.9Hong Kong SAR nav nav nav nav nav nav nav nav nav navItaly nav nav 41.5 53.4 0.7 nav nav nav 63.3 28.6Japan nav nav nav nav nav nav nav nav nav navNetherlands -41.3 13.3 4.9 6.7 22.9 11.0 11.2 9.2 6.7 5.8Singapore nav nav nav nav nav 10.3 136.8 8.0 -7.9 86.2Sweden 1.2 -6.2 -10.7 nav nav 10.9 -21.6 2.9 nav navSwitzerland 15.0 7.1 2.9 2.2 -47.9 15.0 7.1 2.9 2.2 -47.9United Kingdom nav nav nav nav nav nav nav nav nav navUnited States nav nav nav nav nav nav nav nav nav navCPSS1 41.2 8.5 3.6 1.0 -15.4 20.8 18.9 10.3 -11.5 8.7Note: Please refer to the individual country tables for a detailed explanation.CPSS: 1 Sum or average excluding those countries for which data are not available.
Terminals located in the country: increase in the number of terminals
ATMs POS terminals
Table 11a (cont)
E-money card loading/unloading terminals E-money card payment terminals
Table 11a
CPSS – Payment systems in Turkey, 2007 84

(end of year) 1
2001 2002 2003 2004 2005 2001 2002 2003 2004 2005Turkey 177 174 183 190 206 5,330 7,144 9,414 12,787 15,819Belgium 1,108 1,130 1,204 1,267 1,289 14,047 13,141 10,900 10,394 9,653Canada 1,148 1,275 1,395 1,517 1,631 14,927 15,775 16,439 17,086 17,697France 604 633 678 701 763 14,795 15,544 16,147 17,008 17,464Germany 603 612 620 638 647 5,291 5,584 6,008 6,303 6,906Hong Kong SAR nav nav nav nav nav nav nav nav nav navItaly 639 690 680 690 698 13,509 14,746 16,145 17,506 17,976Japan1 1,121 1,099 1,079 1,068 1,067 7,755 8,339 8,991 9,725 10,765Netherlands 445 466 466 485 461 10,333 10,972 11,482 11,981 12,645Singapore 434 370 371 380 391 5,058 5,618 6,677 6,324 13,757Sweden 289 297 299 300 310 9,917 11,431 12,062 17,912 19,561Switzerland 692 706 722 722 740 10,139 10,984 10,803 11,813 14,692United Kingdom 620 688 780 909 968 13,060 13,664 14,463 15,376 16,178United States 1,136 1,221 1,275 1,303 1,335 10,864 12,144 13,364 16,672 16,963CPSS1 920 968 1,003 1,034 1,063 10,570 11,463 12,330 14,118 14,738
2001 2002 2003 2004 2005 2001 2002 2003 2004 2005Turkey nav nav nav nav nav nav nav nav nav navBelgium 17,777 20,150 20,556 20,504 17,332 8,642 10,120 10,410 11,016 8,974Canada 16 11 nav 0 0 0 0 0 0 0France nav 258 372 369 345 nav 1,124 1,708 1,248 989Germany 438 434 393 364 364 974 1,194 1,465 1,725 2,087Hong Kong SAR nav nav nav nav nav nav nav nav nav navItaly nav 95 135 207 206 nav nav 1,528 2,492 3,172Japan nav nav nav nav nav nav nav nav nav navNetherlands 265 299 312 332 407 9,238 10,210 11,102 11,814 12,462Singapore nav nav nav nav nav 4,336 10,174 10,958 9,966 18,110Sweden 787 735 654 nav nav 4,496 3,512 3,600 nav navSwitzerland 4,295 4,563 4,655 4,724 2,447 4,295 4,563 4,655 4,724 2,447United Kingdom nav nav nav nav nav nav nav nav nav navUnited States nap nap nap nap nap nap nap nap nap napCPSS1 1,710 1,127 1,164 1,189 1,001 2,625 2,558 2,547 2,743 2,964
Table 11bTerminals located in the country: number of terminals per 1 million inhabitants
ATMs POS terminals
Table 11b (cont)
E-money card loading/unloading terminals E-money card payment terminals
1 Except as noted.Japan: 1 For ATMs, at end-March of the following year. For POS terminals, see Japan, Table 6.
Note: Please refer to the individual country tables for a detailed explanation.
CPSS: 1 Sum or average excluding those countries for which data are not available.
CPSS – Payment systems in Turkey, 2007 85

(millions, total for the year) 1
2001 2002 2003 2004 2005 2001 2002 2003 2004 2005Turkey 6.63 5.79 5.97 7.40 8.80 288.00 326.00 381.00 463.00 539.00Belgium 4.02 3.77 6.92 6.78 6.80 217.05 239.89 256.89 244.38 250.50Canada nav nav nav nav nav 1,232.70 1,219.50 1,145.10 1,114.90 1,076.90France nav nav nav nav 26.68 1,165.04 1,212.99 1,244.88 1,260.00 1,431.95Germany nav nav nav nav nav 1,648.40 1,668.31 2,036.37 2,398.67 2,445.07Hong Kong SAR nav nav nav nav nav nav nav nav nav navItaly nap nap nap nap nap 452.46 460.60 434.55 453.79 456.41Japan1 nav nav nav nav nav 438.88 414.58 406.46 411.78 429.76Netherlands nav nav nav nav 7.18 490.00 493.00 494.00 484.00 463.45Singapore nav nav nav nav nav 8.77 9.13 6.86 6.53 6.36Sweden nav nav nav nav nav 335.00 321.00 328.00 320.00 316.00Switzerland 5.20 5.30 5.20 5.60 5.60 104.60 110.40 113.20 110.60 103.60United Kingdom nav nav nav nav nav nav nav nav nav navUnited States nav nav nav nav nav nav nav nav nav navCPSS1 nap nap nap nap nap 6,092.90 6,149.40 6,466.30 6,804.65 6,980.00
2001 2002 2003 2004 2005 2001 2002 2003 2004 2005Turkey 0.61 0.53 0.53 0.76 1.28 nav nav nav nav navBelgium 7.43 7.73 8.38 8.69 9.60 10.78 18.15 16.71 16.99 16.82Canada nav nav nav nav nav nav nav nav nav navFrance nav nav nav nav 30.58 0.60 2.60 2.79 2.00 2.10Germany nav nav nav nav nav 3.71 4.42 4.16 4.17 4.47Hong Kong SAR nav nav nav nav nav nav nav nav nav navItaly nap nap nap nap nap nav 3.34 3.32 8.98 19.28Japan nav nav nav nav nav nav nav nav nav navNetherlands 14.30 14.10 15.20 16.30 18.89 2.93 11.93 15.02 17.98 36.11Singapore nav nav nav nav nav nav nav nav nav navSweden nav nav nav nav nav 0.30 0.10 0.00 nap napSwitzerland 8.20 8.40 8.60 8.60 9.30 nav nav nav nav 1.00United Kingdom nav nav nav nav nav nav nav nav nav navUnited States nav nav nav nav nav nav nav nav nav navCPSS nap nap nap nap nap nap nap nap nap nap
Table 12Transactions at terminals: number of cash withdrawals and loading transactions
Cash withdrawals at ATMs located in the countrywith cards issued outside the country with cards issued in the country
Table 12 (cont)
Cash withdrawals at ATMs located outside the country
E-money loading/unloading transactions at terminals in the country
with cards issued in the country
Note: Please refer to the individual country tables for a detailed explanation.
CPSS: 1 Sum or average excluding those countries for which data are not available. Excludes data for the United States, for which only 2003 isavailable.
1 Except as noted.Japan: 1 For cash withdrawals at ATMs located in the country with cards issued in the country, total for the fiscal year ending March of thefollowing year.
CPSS – Payment systems in Turkey, 2007 86

(% change on previous year)
2001 2002 2003 2004 2005 2001 2002 2003 2004 2005Turkey -19.9 -12.7 3.1 24.0 18.9 9.9 13.2 16.9 21.5 16.4Belgium 5.2 -6.2 83.6 -2.0 0.3 9.3 10.5 7.1 -4.9 2.5Canada nav nav nav nav nav 0.0 -1.1 -6.1 -2.6 -3.4France nav nav nav nav nav 7.6 4.1 2.6 1.2 13.6Germany nav nav nav nav nav -4.4 1.2 22.1 17.8 1.9Hong Kong SAR nav nav nav nav nav nav nav nav nav navItaly nav nav nav nav nav 5.2 1.8 -5.7 4.4 0.6Japan nav nav nav nav nav 1.0 -5.5 -2.0 1.3 4.4Netherlands nav nav nav nav nav 4.3 0.6 0.2 -2.0 -4.2Singapore nav nav nav nav nav 2.7 4.1 -24.9 -4.8 -2.6Sweden nav nav nav nav nav 4.4 -4.2 2.2 -2.4 -1.3Switzerland nav 1.9 -1.9 7.7 0.0 10.8 5.5 2.5 -2.3 -6.3United Kingdom nav nav nav nav nav nav nav nav nav navUnited States nav nav nav nav nav nav nav nav nav navCPSS1 nap nap nap nap nap 1.6 0.9 5.2 5.2 2.6
2001 2002 2003 2004 2005 2001 2002 2003 2004 2005Turkey -21.8 -13.1 0.0 43.4 68.4 nav nav nav nav navBelgium 24.9 4.0 8.4 3.7 10.5 38.9 68.4 -7.9 1.7 -1.0Canada nav nav nav nav nav nav nav nav nav navFrance nav nav nav nav nav 0.0 nap 7.3 -28.3 4.9Germany nav nav nav nav nav 0.3 19.0 -5.8 0.3 7.1Hong Kong SAR nav nav nav nav nav nav nav nav nav navItaly nav nav nav nav nav nav nav -0.6 170.5 114.7Japan nav nav nav nav nav nav nav nav nav navNetherlands 12.6 -1.4 7.8 7.2 15.9 22.4 306.8 25.9 19.7 100.9Singapore nav nav nav nav nav nav nav nav nav navSweden nav nav nav nav nav -50.0 -66.7 -100.0 nav navSwitzerland nav 2.4 2.4 0.0 8.1 nav nav nav nav navUnited Kingdom nav nav nav nav nav nav nav nav nav navUnited States nav nav nav nav nav nav nav nav nav navCPSS nap nap nap nap nap nap nap nap nap napNote: Please refer to the individual country tables for a detailed explanation.CPSS: 1 Sum or average excluding those countries for which data are not available.
Table 12aTransactions at terminals: increase in the number of cash withdrawals and loading transactions
Cash withdrawals at ATMs located in the countrywith cards issued outside the country with cards issued in the country
Table 12a (cont)
Cash withdrawals at ATMs located outside the country
E-money loading/unloading transactions at terminals in the country
with cards issued in the country
CPSS – Payment systems in Turkey, 2007 87

(USD billions, total for the year) 1
2001 2002 2003 2004 2005 2001 2002 2003 2004 2005Turkey 0.27 0.34 0.82 1.20 1.62 26.02 24.93 32.79 51.08 70.81Belgium 0.45 0.55 1.15 1.17 1.34 20.07 23.44 30.63 34.18 34.26Canada nav nav nav nav nav 66.99 68.92 75.45 82.15 88.42France nav nav nav nav 5.34 63.53 71.63 91.45 105.86 127.30Germany nav nav nav nav nav 233.55 249.78 343.21 422.44 474.47Hong Kong SAR nav nav nav nav nav nav nav nav nav navItaly nav nav nav nav nav 65.55 88.88 80.93 95.63 98.21Japan1 nav nav nav nav nav 208.02 190.85 201.75 218.57 218.09Netherlands nav nav nav nav nav 39.90 49.92 57.47 63.38 67.31Singapore nav nav nav nav nav 1.09 0.90 0.67 0.64 0.64Sweden nav nav nav nav nav 27.26 27.68 34.88 37.30 36.77Switzerland 0.76 0.76 0.87 1.13 1.07 16.02 17.56 17.60 21.50 18.95United Kingdom nav nav nav nav nav 183.44 204.58 235.31 295.39 312.56United States nav nav nav nav nav nav nav nav nav navCPSS1 nap nap nap nap nap 925.44 994.14 1,169.35 1,377.04 1,476.97
2001 2002 2003 2004 2005 2001 2002 2003 2004 2005Turkey 0.05 0.05 0.07 0.10 0.17 nav nav nav nav navBelgium 0.82 1.00 1.29 1.44 1.61 0.30 0.63 0.63 0.67 0.62Canada nav nav nav nav nav nav nav nav nav navFrance nav nav nav nav 4.36 0.02 0.08 0.09 0.00 0.07Germany nav nav nav nav nav nav nav nav nav navHong Kong SAR nav nav nav nav nav nav nav nav nav navItaly nav nav nav nav nav nav 0.40 1.40 2.57 4.32Japan nav nav nav nav nav nav nav nav nav navNetherlands nav nav nav nav 3.78 nav nav nav nav navSingapore nav nav nav nav nav nav nav nav nav navSweden nav nav nav nav nav 0.01 0.00 0.00 nap napSwitzerland 1.33 1.64 1.98 2.13 2.37 nav nav nav nav 0.06United Kingdom 0.14 0.16 0.47 0.59 0.62 nav nav nav nav navUnited States nav nav nav nav nav nav nav nav nav navCPSS nap nap nap nap nap nap nap nap nap napNote: Please refer to the individual country tables for a detailed explanation.1 Converted at yearly average exchange rates, except as noted.
CPSS: 1 Sum or average excluding those countries for which data are not available. Excludes data for the United States, for which only 2003 isavailable.
Table 13Transactions at terminals: value of cash withdrawals and loading transactions
Cash withdrawals at ATMs located in the countrywith cards issued outside the country with cards issued in the country
Table 13 (cont)
Cash withdrawals at ATMs located outside the country
E-money loading/unloading transactions at terminals in the country
with cards issued in the country
Japan: 1 For cash withdrawals at ATMs located in the country with cards issued in the country, total for the fiscal year ending March of thefollowing year, converted at average exchange rates for the fiscal year ending March.
CPSS – Payment systems in Turkey, 2007 88

(% change on previous year, adjusted by CPI inflation) 1
2001 2002 2003 2004 2005 2001 2002 2003 2004 2005Turkey -36.8 21.4 101.5 26.2 18.4 -51.6 -8.5 10.3 34.7 21.3Belgium 3.9 14.2 73.3 -9.6 12.1 4.6 9.1 7.5 -0.5 -2.2Canada nav nav nav nav nav 1.5 2.0 -5.0 -0.6 -2.0France nav nav nav nav nav 5.7 5.0 4.3 2.8 18.0Germany nav nav nav nav nav 0.8 0.1 13.6 9.9 10.3Hong Kong SAR nav nav nav nav nav nav nav nav nav navItaly nav nav nav nav nav 0.8 25.5 -26.0 5.0 0.5Japan nav nav nav nav nav 2.3 -4.6 -1.9 1.1 navNetherlands nav nav nav nav nav 4.2 14.3 -5.9 -1.2 4.7Singapore nav nav nav nav nav -4.9 -17.0 -28.8 -8.5 -2.1Sweden nav nav nav nav nav 1.3 -6.4 2.5 -3.8 -0.4Switzerland 13.7 -7.5 -1.4 18.3 -6.3 4.8 0.5 -13.8 11.9 -12.6United Kingdom nav nav nav nav nav nav nav nav nav navUnited States nav nav nav nav nav nav nav nav nav navCPSS1 nap nap nap nap nap -2.2 6.3 15.8 15.7 5.2
2001 2002 2003 2004 2005 2001 2002 2003 2004 2005Turkey -55.5 2.8 5.6 37.2 42.4 nav nav nav nav navBelgium 21.4 13.4 6.0 -0.1 9.3 53.5 99.8 -17.7 -5.4 -9.7Canada nav nav nav nav nav nav nav nav nav navFrance nav nav nav nav nav 0.0 0.0 -2.2 nap napGermany nav nav nav nav nav nav nav nav nav navHong Kong SAR nav nav nav nav nav nav nav nav nav navItaly nav nav nav nav nav nav nav 187.2 63.2 64.4Japan nav nav nav nav nav nav nav nav nav navNetherlands nav nav nav nav nav nav nav nav nav navSingapore nav nav nav nav nav nav nav nav nav navSweden nav nav nav nav nav nav nav nav nav navSwitzerland 9.7 13.4 3.7 -1.4 10.2 nav nav nav nav navUnited Kingdom -47.4 8.8 160.2 11.2 4.8 nav nav nav nav navUnited States nav nav nav nav nav nav nav nav nav navCPSS nap nap nap nap nap nap nap nap nap nap
1 Value of cash withdrawals and loading transactions in domestic currency deflated by yearly average CPI inflation. For the CPSS area, in USdollar terms.
Note: Please refer to the individual country tables for a detailed explanation.
CPSS: 1 Sum or average excluding those countries for which data are not available.
Table 13aTransactions at terminals: increase in the real value of cash withdrawals and loading transactions
Cash withdrawals at ATMs located in the countrywith cards issued outside the country with cards issued in the country
Table 13a (cont)
Cash withdrawals at ATMs located outside the country
E-money loading/unloading transactions at terminals in the country
with cards issued in the country
CPSS – Payment systems in Turkey, 2007 89
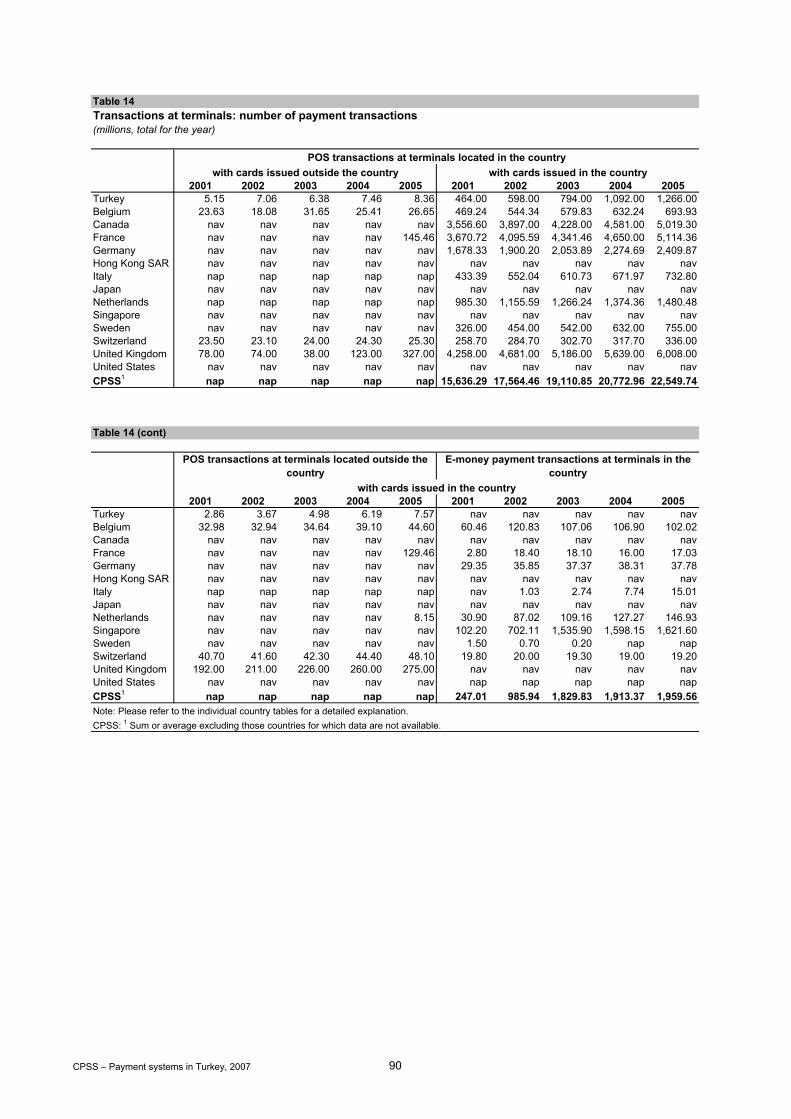
(millions, total for the year)
2001 2002 2003 2004 2005 2001 2002 2003 2004 2005Turkey 5.15 7.06 6.38 7.46 8.36 464.00 598.00 794.00 1,092.00 1,266.00Belgium 23.63 18.08 31.65 25.41 26.65 469.24 544.34 579.83 632.24 693.93Canada nav nav nav nav nav 3,556.60 3,897.00 4,228.00 4,581.00 5,019.30France nav nav nav nav 145.46 3,670.72 4,095.59 4,341.46 4,650.00 5,114.36Germany nav nav nav nav nav 1,678.33 1,900.20 2,053.89 2,274.69 2,409.87Hong Kong SAR nav nav nav nav nav nav nav nav nav navItaly nap nap nap nap nap 433.39 552.04 610.73 671.97 732.80Japan nav nav nav nav nav nav nav nav nav navNetherlands nap nap nap nap nap 985.30 1,155.59 1,266.24 1,374.36 1,480.48Singapore nav nav nav nav nav nav nav nav nav navSweden nav nav nav nav nav 326.00 454.00 542.00 632.00 755.00Switzerland 23.50 23.10 24.00 24.30 25.30 258.70 284.70 302.70 317.70 336.00United Kingdom 78.00 74.00 38.00 123.00 327.00 4,258.00 4,681.00 5,186.00 5,639.00 6,008.00United States nav nav nav nav nav nav nav nav nav navCPSS1 nap nap nap nap nap 15,636.29 17,564.46 19,110.85 20,772.96 22,549.74
2001 2002 2003 2004 2005 2001 2002 2003 2004 2005Turkey 2.86 3.67 4.98 6.19 7.57 nav nav nav nav navBelgium 32.98 32.94 34.64 39.10 44.60 60.46 120.83 107.06 106.90 102.02Canada nav nav nav nav nav nav nav nav nav navFrance nav nav nav nav 129.46 2.80 18.40 18.10 16.00 17.03Germany nav nav nav nav nav 29.35 35.85 37.37 38.31 37.78Hong Kong SAR nav nav nav nav nav nav nav nav nav navItaly nap nap nap nap nap nav 1.03 2.74 7.74 15.01Japan nav nav nav nav nav nav nav nav nav navNetherlands nav nav nav nav 8.15 30.90 87.02 109.16 127.27 146.93Singapore nav nav nav nav nav 102.20 702.11 1,535.90 1,598.15 1,621.60Sweden nav nav nav nav nav 1.50 0.70 0.20 nap napSwitzerland 40.70 41.60 42.30 44.40 48.10 19.80 20.00 19.30 19.00 19.20United Kingdom 192.00 211.00 226.00 260.00 275.00 nav nav nav nav navUnited States nav nav nav nav nav nap nap nap nap napCPSS1 nap nap nap nap nap 247.01 985.94 1,829.83 1,913.37 1,959.56Note: Please refer to the individual country tables for a detailed explanation.CPSS: 1 Sum or average excluding those countries for which data are not available.
POS transactions at terminals located outside the country
E-money payment transactions at terminals in the country
with cards issued in the country
Table 14Transactions at terminals: number of payment transactions
POS transactions at terminals located in the countrywith cards issued outside the country with cards issued in the country
Table 14 (cont)
CPSS – Payment systems in Turkey, 2007 90

(% change on previous year)
2001 2002 2003 2004 2005 2001 2002 2003 2004 2005Turkey 32.1 37.1 -9.6 16.9 12.1 15.1 28.9 32.8 37.5 15.9Belgium 36.4 -23.5 75.1 -19.7 4.9 12.7 16.0 6.5 9.0 9.8Canada nav nav nav nav nav 10.1 9.6 8.5 8.3 9.6France nav nav nav nav nav 11.5 11.6 6.0 7.1 10.0Germany nav nav nav nav nav 14.6 13.2 8.1 10.8 5.9Hong Kong SAR nav nav nav nav nav nav nav nav nav navItaly nav nav nav nav nav 36.3 27.4 10.6 10.0 9.1Japan nav nav nav nav nav nav nav nav nav navNetherlands nav nav nav nav nav 19.2 17.3 9.6 8.5 7.7Singapore nav nav nav nav nav nav nav nav nav navSweden nav nav nav nav nav 27.3 39.3 19.4 16.6 19.5Switzerland nav -1.7 3.9 1.3 4.1 nav 10.1 6.3 5.0 5.8United Kingdom -60.0 -5.1 -48.6 223.7 165.9 12.4 9.9 10.8 8.7 6.5United States nav nav nav nav nav nav nav nav nav navCPSS1 nap nap nap nap nap 13.2 12.3 8.8 8.7 8.6
2001 2002 2003 2004 2005 2001 2002 2003 2004 2005Turkey 14.4 28.3 35.7 24.3 22.3 nav nav nav nav navBelgium 12.1 -0.1 5.2 12.9 14.1 17.9 99.9 -11.4 -0.1 -4.6Canada nav nav nav nav nav nav nav nav nav navFrance nav nav nav nav nav 0.0 nap -1.6 -11.6 6.4Germany nav nav nav nav nav 10.4 22.1 4.2 2.5 -1.4Hong Kong SAR nav nav nav nav nav nav nav nav nav navItaly nav nav nav nav nav nav nav nav nav navJapan nav nav nav nav nav nav nav nav nav navNetherlands nav nav nav nav nav 22.0 181.6 25.5 16.6 15.4Singapore nav nav nav nav nav 2.1 587.0 118.8 4.1 1.5Sweden nav nav nav nav nav -48.3 -53.3 -71.4 nav navSwitzerland nav 2.2 1.7 5.0 8.3 10.0 1.0 -3.5 -1.6 1.1United Kingdom nav nav nav nav nav nav nav nav nav navUnited States nav nav nav nav nav nav nav nav nav navCPSS1 nap nap nap nap nap 10.2 299.1 85.6 4.6 2.4Note: Please refer to the individual country tables for a detailed explanation.CPSS: 1 Sum or average excluding those countries for which data are not available.
POS transactions at terminals located outside the country
E-money payment transactions at terminals in the country
with cards issued in the country
Table 14a (cont)
Table 14aTransactions at terminals: increase in the number of payment transactions
POS transactions at terminals located in the countrywith cards issued outside the country with cards issued in the country
CPSS – Payment systems in Turkey, 2007 91
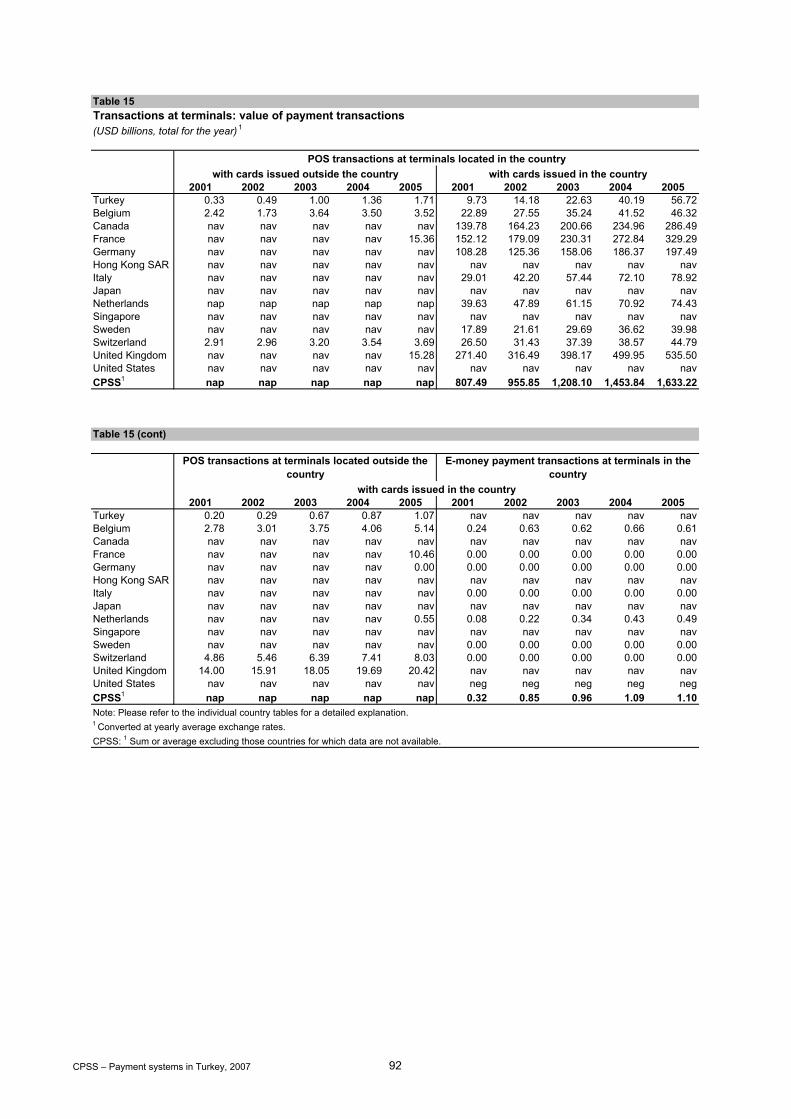
(USD billions, total for the year) 1
2001 2002 2003 2004 2005 2001 2002 2003 2004 2005Turkey 0.33 0.49 1.00 1.36 1.71 9.73 14.18 22.63 40.19 56.72Belgium 2.42 1.73 3.64 3.50 3.52 22.89 27.55 35.24 41.52 46.32Canada nav nav nav nav nav 139.78 164.23 200.66 234.96 286.49France nav nav nav nav 15.36 152.12 179.09 230.31 272.84 329.29Germany nav nav nav nav nav 108.28 125.36 158.06 186.37 197.49Hong Kong SAR nav nav nav nav nav nav nav nav nav navItaly nav nav nav nav nav 29.01 42.20 57.44 72.10 78.92Japan nav nav nav nav nav nav nav nav nav navNetherlands nap nap nap nap nap 39.63 47.89 61.15 70.92 74.43Singapore nav nav nav nav nav nav nav nav nav navSweden nav nav nav nav nav 17.89 21.61 29.69 36.62 39.98Switzerland 2.91 2.96 3.20 3.54 3.69 26.50 31.43 37.39 38.57 44.79United Kingdom nav nav nav nav 15.28 271.40 316.49 398.17 499.95 535.50United States nav nav nav nav nav nav nav nav nav navCPSS1 nap nap nap nap nap 807.49 955.85 1,208.10 1,453.84 1,633.22
2001 2002 2003 2004 2005 2001 2002 2003 2004 2005Turkey 0.20 0.29 0.67 0.87 1.07 nav nav nav nav navBelgium 2.78 3.01 3.75 4.06 5.14 0.24 0.63 0.62 0.66 0.61Canada nav nav nav nav nav nav nav nav nav navFrance nav nav nav nav 10.46 0.00 0.00 0.00 0.00 0.00Germany nav nav nav nav 0.00 0.00 0.00 0.00 0.00 0.00Hong Kong SAR nav nav nav nav nav nav nav nav nav navItaly nav nav nav nav nav 0.00 0.00 0.00 0.00 0.00Japan nav nav nav nav nav nav nav nav nav navNetherlands nav nav nav nav 0.55 0.08 0.22 0.34 0.43 0.49Singapore nav nav nav nav nav nav nav nav nav navSweden nav nav nav nav nav 0.00 0.00 0.00 0.00 0.00Switzerland 4.86 5.46 6.39 7.41 8.03 0.00 0.00 0.00 0.00 0.00United Kingdom 14.00 15.91 18.05 19.69 20.42 nav nav nav nav navUnited States nav nav nav nav nav neg neg neg neg negCPSS1 nap nap nap nap nap 0.32 0.85 0.96 1.09 1.10Note: Please refer to the individual country tables for a detailed explanation.1 Converted at yearly average exchange rates. CPSS: 1 Sum or average excluding those countries for which data are not available.
POS transactions at terminals located outside the country
E-money payment transactions at terminals in the country
Table 15Transactions at terminals: value of payment transactions
POS transactions at terminals located in the countrywith cards issued outside the country with cards issued in the country
with cards issued in the country
Table 15 (cont)
CPSS – Payment systems in Turkey, 2007 92

(% change on previous year, adjusted by CPI inflation) 1
2001 2002 2003 2004 2005 2001 2002 2003 2004 2005Turkey -2.7 39.1 72.4 17.5 10.1 -5.3 39.2 33.7 53.6 23.5Belgium 42.5 -32.9 72.4 -14.1 -2.1 8.8 12.5 5.2 5.1 8.9Canada nav nav nav nav nav 0.2 16.4 6.0 6.9 11.1France nav nav nav nav nav 9.1 9.7 5.1 5.2 18.5Germany nav nav nav nav nav 7.9 8.4 4.2 5.2 4.0Hong Kong SAR nav nav nav nav nav nav nav nav nav navItaly nav nav nav nav nav 37.1 34.6 10.5 11.5 7.1Japan nav nav nav nav nav nav nav nav nav navNetherlands nav nav nav nav nav 12.8 10.4 4.3 3.9 3.4Singapore nav nav nav nav nav nav nav nav nav navSweden nav nav nav nav nav 26.0 11.4 11.7 11.0 10.3Switzerland nav -6.7 -7.1 1.5 3.3 nav 8.7 2.2 -5.5 15.1United Kingdom nav nav nav nav nav 15.8 10.5 14.0 10.5 5.9United States nav nav nav nav nav nav nav nav nav navCPSS1 nap nap nap nap nap nav 17.1 24.5 18.2 10.2
2001 2002 2003 2004 2005 2001 2002 2003 2004 2005Turkey -5.1 41.3 93.9 13.2 7.0 nav nav nav nav navBelgium 5.5 1.0 2.5 -3.3 23.5 31.8 144.2 -19.1 -5.4 -9.8Canada nav nav nav nav nav nav nav nav nav navFrance nav nav nav nav nav 0.0 nap nav nav navGermany nav nav nav nav nav nav nav nav nav navHong Kong SAR nav nav nav nav nav nav nav nav nav navItaly nav nav nav nav nav nav nav nav nav navJapan nav nav nav nav nav nav nav nav nav navNetherlands nav nav nav nav nav 11.1 168.2 23.5 15.8 12.0Singapore nav nav nav nav nav nav nav nav nav navSweden nav nav nav nav nav nav nav nav nav navSwitzerland nav 3.0 0.6 6.1 7.4 nav nav nav nav navUnited Kingdom nav nav nav nav nav nav nav nav nav navUnited States nav nav nav nav nav nav nav nav nav navCPSS1 nap nap nap nap nap 28.1 166.2 10.4 12.2 -1.1
CPSS: 1 Sum or average excluding those countries for which data are not available.
Note: Please refer to the individual country tables for a detailed explanation.1 Value of payment transactions in domestic currency deflated by yearly average CPI inflation. For the CPSS area, in US dollar terms.
with cards issued in the country
Table 15aTransactions at terminals: increase in the real value of payment transactions
POS transactions at terminals located in the countrywith cards issued outside the country with cards issued in the country
POS transactions at terminals located outside the country
E-money payment transactions at terminals in the country
Table 15a (cont)
CPSS – Payment systems in Turkey, 2007 93
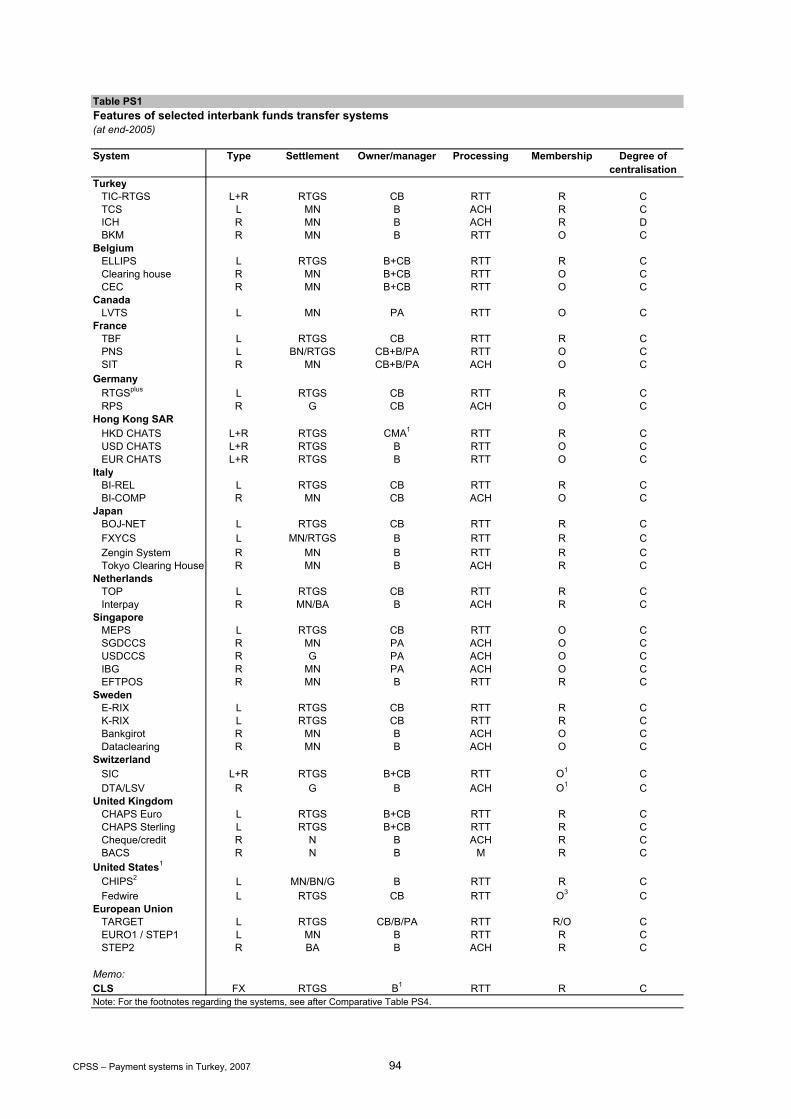
(at end-2005)
System Type Settlement Owner/manager Processing Membership Degree of centralisation
TurkeyTIC-RTGS L+R RTGS CB RTT R CTCS L MN B ACH R CICH R MN B ACH R DBKM R MN B RTT O C
BelgiumELLIPS L RTGS B+CB RTT R CClearing house R MN B+CB RTT O CCEC R MN B+CB RTT O C
CanadaLVTS L MN PA RTT O C
FranceTBF L RTGS CB RTT R CPNS L BN/RTGS CB+B/PA RTT O CSIT R MN CB+B/PA ACH O C
GermanyRTGSplus L RTGS CB RTT R CRPS R G CB ACH O C
Hong Kong SARHKD CHATS L+R RTGS CMA1 RTT R CUSD CHATS L+R RTGS B RTT O CEUR CHATS L+R RTGS B RTT O C
ItalyBI-REL L RTGS CB RTT R CBI-COMP R MN CB ACH O C
JapanBOJ-NET L RTGS CB RTT R CFXYCS L MN/RTGS B RTT R CZengin System R MN B RTT R CTokyo Clearing House R MN B ACH R C
NetherlandsTOP L RTGS CB RTT R CInterpay R MN/BA B ACH R C
SingaporeMEPS L RTGS CB RTT O CSGDCCS R MN PA ACH O CUSDCCS R G PA ACH O CIBG R MN PA ACH O CEFTPOS R MN B RTT R C
SwedenE-RIX L RTGS CB RTT R CK-RIX L RTGS CB RTT R CBankgirot R MN B ACH O CDataclearing R MN B ACH O C
SwitzerlandSIC L+R RTGS B+CB RTT O1 CDTA/LSV R G B ACH O1 C
United KingdomCHAPS Euro L RTGS B+CB RTT R CCHAPS Sterling L RTGS B+CB RTT R CCheque/credit R N B ACH R CBACS R N B M R C
United States1
CHIPS2 L MN/BN/G B RTT R CFedwire L RTGS CB RTT O3 C
European UnionTARGET L RTGS CB/B/PA RTT R/O CEURO1 / STEP1 L MN B RTT R CSTEP2 R BA B ACH R C
Memo:CLS FX RTGS B1 RTT R C
Table PS1Features of selected interbank funds transfer systems
Note: For the footnotes regarding the systems, see after Comparative Table PS4.
CPSS – Payment systems in Turkey, 2007 94

System Pricing Closing time for same day
Settlement finality
Cutoff third-party orders
transactions opening closingTurkey
TIC-RTGS F 17:30 real-time nap 8:30 17:30TCS 0 14:00 T+0, T+2 nap nap napICH F nap T+1 nap nap napBKM F nap intraday nap nap nap
BelgiumELLIPS F 18:00 real-time 17:00 07:00 18:00Clearing house F 15:15 nav nav nap napCEC F 15:00 nav nav nap nap
CanadaLVTS F 18:30 intraday1 18:00 nap2 nap
FranceTBF F 18:00 real-time 17:00 07:00 18:00PNS F 16:00 real-time 16:00 nap napSIT F 13:30 15:15 nav nap nap
GermanyRTGSplus F 18:00 real-time 17:00 07:00 18:00
RPS F20:00/21:00 7:00/09:001 intraday1 nap nap nap
Hong Kong SARHKD CHATS F 17:30 real-time 17:00 09:00 17:30USD CHATS F 17:30 real-time 17:00 09:00 17:30EUR CHATS F 17:30 real-time 17:00 09:00 17:30
ItalyBI-REL F 18:00 real-time 17:00 07:00 18:00BI-COMP F 12:00 1 12:00 nap nap
JapanBOJ-NET V1 17:002 real-time 14:004 08:30 17:005
FXYCS F 13:45/17:002 14:30/real-time 13:45/17:002 08:30 17:005
Zengin System F 15:30 16:15 15:30 08:30 17:005
Tokyo Clearing House F 08:003 12:30 08:003 08:30 17:005
NetherlandsTOP F 18:00 real-time 17:00 07:00 18:00Interpay F 17:00 every 30 mins1 15:30 nap nap
Singapore1
MEPS V 18:30 (14:45) real-time (14:45) 18:30 (14:45)2 09:00 18:30SGDCCS F 17:00 (13:30) T+1: 15:45 (14:30) 17:00 nap napUSDCCS F 15:30 (nap) T+1: 17:00 15:30 nap napIBG F 12:00 (10:00) T+1: 18:15 (14:30) 12:00 nap napEFTPOS F 22:00 T+1: 20:003 nap nap nap
SwedenE-RIX F 18:00 real-time 17:00 09:00 16:15K-RIX F 17:00 real-time 17:00 09:00 16:15Bankgirot F nap1 intraday2 16:203 nap napDataclearing F nap1 intraday2 15:204 nap nap
SwitzerlandSIC F 16:152 real-time 15:00 09:00 16:00DTA/LSV F 10:00 13:00 – 16:15 10:00 nap nap
United KingdomCHAPS Euro F 17:00 real-time 16:00 07:00 16:00CHAPS Sterling F 17:00 real-time 16:00 07:00 16:00Cheque/credit F nap 1 nav nap napBACS F nap 1 nav nap nap
United States1
CHIPS2 F 17:00 intraday4 17:00 08:305 18:30Fedwire F 18:30 real-time 18:00 08:305 18:30
European Union1
TARGET F 18:00 real-time 17:00 07:00 18:00EURO1 / STEP1 F 16:00 about 16:30 16:00 07:00 18:00STEP2 F nap about 07:302 22:00 on T-1 07:00 18:00
Memo:CLS F 06:302 real-time nap nap napNote: For the footnotes regarding the systems, see after Comparative Table PS4.
Standard money market hours
Table PS1 (cont)
CPSS – Payment systems in Turkey, 2007 95

(total for the year)
2001 2002 2003 2004 2005 2001 2002 2003 2004 2005Turkey
TIC-RTGS 25.5 33.9 43.0 58.7 76.7 19.9 33.1 26.8 36.4 30.8TCS 31.7 29.5 30.0 42.4 45.0 2.1 -6.9 1.9 41.3 6.1ICH 25.7 25.3 26.2 25.3 23.5 -13.0 -1.6 3.7 -3.3 -7.2BKM 472.0 608.7 805.5 1,105.8 1,281.9 15.3 29.0 32.3 37.3 15.9
BelgiumELLIPS 1.8 1.7 1.8 1.8 1.8 3.5 -5.9 1.4 1.5 -0.7Clearing house 3.5 1.7 1.6 1.3 0.6 -16.0 -50.9 -9.2 -16.6 -56.5CEC 917.7 985.4 1,019.0 1,009.6 952.2 3.9 7.4 3.4 -0.9 -5.7
CanadaLVTS 3.7 3.9 4.1 4.4 4.6 5.7 5.4 5.1 7.3 4.5
FranceTBF 3.8 3.8 3.9 4.0 4.3 26.8 0.2 1.3 3.6 8.0PNS 8.0 7.6 7.4 7.0 6.8 45.5 -5.2 -3.0 -4.7 -2.4SIT 7,131.1 11,043.5 11,298.2 11,614.9 11,868.2 10.0 54.9 2.3 2.8 2.2CH Paris 677.8 93.3 nap nap nap -0.7 -86.2 nap nap napCH Province 2,469.1 53.6 nap nap nap -10.9 -97.8 nap nap napCREIC 270.2 4.3 nap nap nap -12.2 -98.4 nap nap nap
Germany2
RTGSplus (former ELS) 23.9 31.9 32.8 34.1 35.8 10.8 33.7 2.8 4.0 5.0EAF (former EAF2) 11.0 nap nap nap nap -15.3 nap nap nap napRPS (former DTA) 2,197.5 2,156.8 2,188.3 2,230.3 2,174.7 -1.3 -1.9 1.5 1.9 -2.5
Hong Kong SARHKD CHATS 3.5 3.4 3.5 3.8 4.1 1.8 -1.5 2.6 7.6 7.8USD CHATS 0.7 0.8 1.0 1.3 1.5 nap 17.8 22.7 27.4 16.7EUR CHATS nap nap nav nav 0.0 nap nap nap nap nap
ItalyBI-REL 10.2 9.6 9.4 9.1 10.4 -1.5 -6.2 -2.0 -3.6 14.3BI-COMP 1,375.2 1,733.2 1,808.7 1,867.6 1,895.4 23.5 26.0 4.4 3.3 1.5
JapanBOJ-NET 5.0 4.8 4.9 5.2 5.3 7.0 -5.1 2.9 5.1 2.4FXYCS 9.6 9.2 8.0 7.4 6.9 2.9 -3.4 -13.2 -7.5 -7.4Zengin System 1,220.0 1,244.5 1,260.8 1,286.9 1,314.8 4.5 2.0 1.3 2.1 2.2Tokyo Clearing House 71.6 63.0 57.5 53.2 48.9 -8.3 -12.0 -8.7 -7.6 -8.1
NetherlandsTOP 4.1 4.8 4.9 5.0 4.7 8.6 15.4 3.4 1.2 -5.6Interpay 2,558.3 2,812.4 2,964.9 3,123.5 3,272.1 9.9 9.9 5.4 5.3 4.8
SingaporeMEPS 2.1 2.0 2.1 2.2 2.5 8.4 -1.4 4.4 5.2 12.5SGDCCS 91.6 90.3 87.0 86.1 84.9 0.4 -1.4 -3.6 -1.1 -1.3USDCCS 0.4 0.4 0.6 0.7 0.8 2.6 10.0 25.0 27.3 11.4IBG 33.6 46.0 62.4 67.1 72.5 12.2 36.7 35.7 7.6 8.0EFTPOS 87.7 97.2 105.8 114.8 125.5 14.0 10.8 8.9 8.5 9.3
SwedenE-RIX 0.1 0.1 0.1 0.1 0.1 16.7 14.3 25.0 0.0 10.0K-RIX 0.7 1.1 1.3 1.3 1.5 29.4 66.7 18.2 0.0 15.4Bankgirot 345.0 363.4 381.5 430.0 484.0 -1.7 5.3 5.0 12.7 12.6Dataclearing 67.0 73.0 102.0 105.0 83.0 -14.3 9.0 39.7 2.9 -21.0
SwitzerlandSIC 161.1 177.0 192.7 209.1 256.4 7.8 9.9 8.9 8.5 22.6DTA/LSV 103.7 103.3 100.1 94.0 66.8 -2.1 -0.4 -3.1 -6.1 -28.9
United KingdomCHAPS Euro 2.4 3.4 4.2 4.7 5.1 20.4 42.3 23.9 10.4 7.9CHAPS Sterling 22.1 24.1 27.2 28.3 29.6 1.9 8.8 13.1 4.1 4.5Cheque/credit 160.9 153.8 143.9 135.9 126.0 -2.3 -4.4 -6.4 -5.6 -7.3BACS 1,375.3 1,446.1 1,630.4 2,012.6 2,411.9 5.3 5.2 12.7 23.4 19.8
United StatesCHIPS 60.4 63.3 64.5 68.5 71.5 1.0 4.8 1.9 6.2 4.3Fedwire 112.5 115.0 123.3 125.1 132.4 3.8 2.2 7.2 1.5 5.9
European UnionTARGET 53.7 64.5 66.8 69.4 76.3 12.0 19.9 3.6 3.9 10.0EURO1 / STEP1 29.7 37.1 43.1 44.3 46.4 19.9 25.0 16.2 2.9 4.7STEP23 nap nap 3.9 26.2 45.6 nap nap nap 567.7 73.6
Memo:CLS3 nap 1.7 19.3 32.6 47.9 nap nap 1,040.5 69.0 46.9
Table PS2Payments processed by selected interbank funds transfer systems: number of transactions
Increase in the number of transactions (% change on previous year)
Number of transactions (millions)System
Note: For the footnotes regarding the systems, see after Comparative Table PS4.
CPSS – Payment systems in Turkey, 2007 96

(total for the year)
2001 2002 2003 2004 2005 2001 2002 2003 2004 2005Turkey
TIC-RTGS 2,263 2,217 3,099 4,177 5,822 0.1 0.1 0.1 0.1 0.1TCS 80 78 113 161 240 3.1 3.1 4.3 6.3 10.2ICH 43 52 72 92 116 1.7 2.1 2.8 3.6 4.9BKM 10 15 24 42 59 0.0 0.0 0.0 0.0 0.0
BelgiumELLIPS 12,808 12,573 15,307 18,233 21,448 6,957.0 7,254.8 8,711.8 10,226.0 12,117.6Clearing house 79 71 74 73 60 22.6 40.9 46.8 56.0 105.9CEC 455 500 623 727 786 0.5 0.5 0.6 0.7 0.8
CanadaLVTS 18,395 18,444 22,518 25,378 30,321 4,971.7 4,729.2 5,492.1 5,767.8 6,591.5
FranceTBF 78,364 86,003 108,750 134,697 151,425 20,594.9 22,561.1 28,151.8 33,657.3 35,019.6PNS 19,976 18,847 20,299 21,719 19,432 2,497.1 2,486.0 2,760.7 3,099.6 2,842.5SIT 2,187 4,187 5,274 5,675 5,906 0.3 0.4 0.5 0.5 0.5CH Paris 683 173 nap nap nap 1.0 1.9 nap nap napCH Province 883 22 nap nap nap 0.4 0.4 nap nap napCREIC 21 0 nap nap nap 0.1 0.1 nap nap nap
Germany2
RTGSplus (former ELS) 61,501 117,616 145,123 157,005 172,023 2,577.6 3,687.0 4,424.5 4,604.2 4,805.1EAF (former EAF2) 31,343 nap nap nap nap 2,849.3 nap nap nap napRPS (former DTA) 1,971 1,990 2,372 2,637 2,610 0.9 0.9 1.1 1.2 1.2
Hong Kong SARHKD CHATS 11,134 10,536 11,174 13,146 14,936 3,208.8 3,082.5 3,185.3 3,482.4 3,668.9USD CHATS 931 1,274 1,232 1,356 1,588 1,346.8 1,565.3 1,233.2 1,065.0 1,069.3EUR CHATS nap nap 135 230 422 nap nap nap nap 42,238.3
ItalyBI-REL 24,288 23,705 27,954 34,883 40,840 2,370.0 2,466.2 2,966.6 3,841.3 3,934.1BI-COMP 2,191 2,448 3,207 3,742 3,948 1.6 1.4 1.8 2.0 2.1
JapanBOJ-NET 156,796 144,186 161,916 188,837 196,452 31,074.1 30,112.7 32,877.3 36,465.8 37,052.6FXYCS 56,643 48,954 41,568 39,782 36,514 5,922.5 5,299.4 5,185.5 5,366.7 5,318.6Zengin System 20,133 17,834 18,909 20,828 21,235 16.5 14.3 15.0 16.2 16.2Tokyo Clearing House 5,252 3,997 3,832 3,949 3,301 73.4 63.5 66.6 74.3 67.6
NetherlandsTOP 21,665 23,519 29,669 36,878 38,126 5,252.1 4,941.0 6,025.4 7,400.7 8,104.9Interpay 1,409 1,577 2,008 2,281 2,413 0.6 0.6 0.7 0.7 0.7
SingaporeMEPS 6,447 5,604 5,658 5,831 7,564 3,114.5 2,747.1 2,656.5 2,603.1 3,001.7SGDCCS 233 212 212 229 244 2.5 2.4 2.4 2.7 2.9USDCCS 11 11 14 20 24 27.3 25.0 24.7 28.1 31.2IBG 45 51 62 72 80 1.3 1.1 1.0 1.1 1.1EFTPOS 3 3 4 5 6 0.0 0.0 0.0 0.0 0.0
SwedenE-RIX 1,377 1,383 2,141 2,220 2,591 19,672.5 17,291.2 21,412.2 22,199.0 23,555.2K-RIX 10,962 11,731 13,932 14,633 14,867 16,609.0 10,664.4 10,716.9 11,256.1 9,911.2Bankgirot 376 416 523 625 690 1.1 1.1 1.4 1.5 1.4Dataclearing 107 124 208 252 230 1.6 1.7 2.0 2.4 2.8
SwitzerlandSIC 26,905 28,767 33,202 33,762 32,956 167.0 162.5 172.3 161.5 128.5DTA/LSV 202 229 253 244 155 2.0 2.2 2.5 2.6 2.3
United KingdomCHAPS Euro 24,117 23,919 33,954 39,798 45,704 10,019.7 6,981.7 7,996.7 8,489.2 9,034.3CHAPS Sterling 70,937 71,880 83,255 94,864 94,299 3,206.9 2,987.0 3,059.5 3,350.0 3,187.2Cheque/credit 2,073 2,102 2,210 2,410 2,270 12.9 13.7 15.4 17.7 18.0BACS 3,118 3,571 4,200 5,278 5,719 2.3 2.5 2.6 2.6 2.4
United StatesCHIPS 311,707 315,709 326,561 345,793 349,871 5,162.6 4,987.7 5,061.9 5,045.0 4,894.5Fedwire 423,606 405,762 447,342 478,947 518,547 3,766.9 3,529.0 3,628.6 3,828.4 3,915.4
European UnionTARGET 294,315 373,434 478,474 558,091 613,614 5,476.6 5,794.2 7,168.2 8,045.1 8,042.1EURO1 / STEP1 46,572 45,274 50,578 54,880 53,333 1,570.6 1,221.6 1,174.2 1,238.2 1,149.2STEP23 nap nap 11 75 130 nap nap 2.9 2.9 2.8
Memo:CLS3 nap 23,790 220,574 379,506 545,838 nap 14,074.6 11,442.5 11,649.8 11,406.8Note: For the footnotes regarding the systems, see after Comparative Table PS4.
Payments processed by selected interbank funds transfer systems: value of transactions
System Value of transactions (USD billions) 1 Average value per transaction (USD thousands) 1
Table PS3
1 Converted at yearly average exchange rates.
CPSS – Payment systems in Turkey, 2007 97
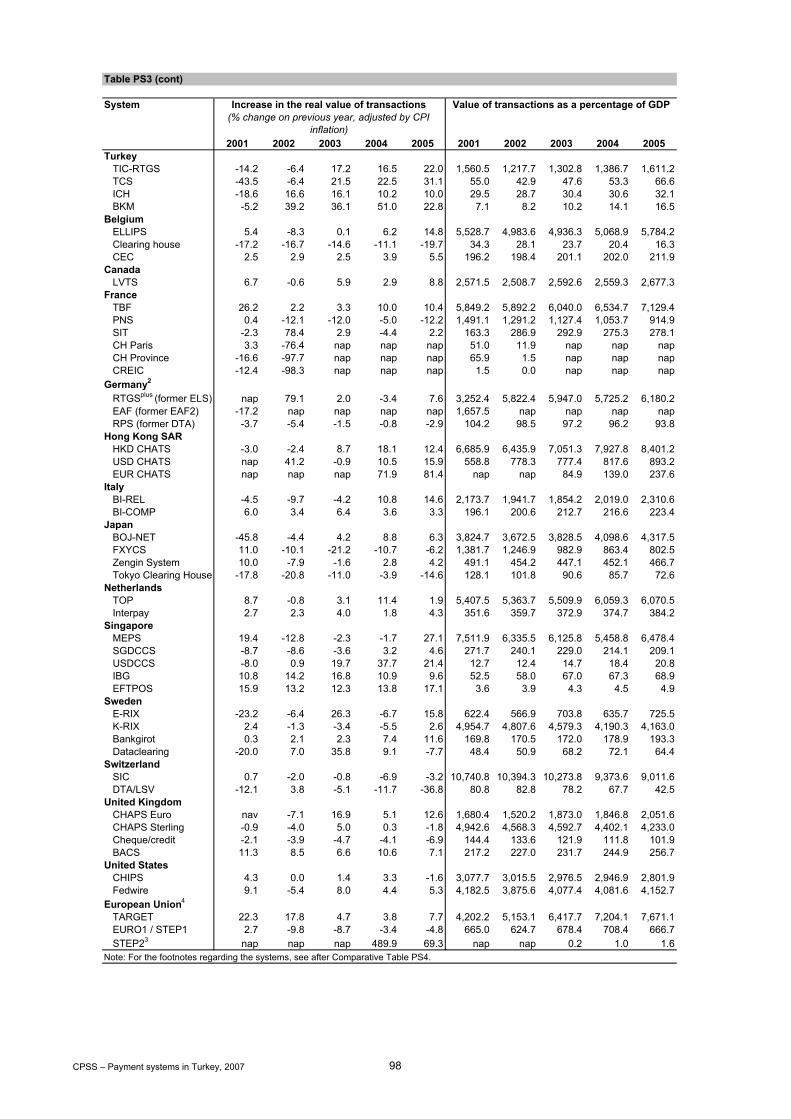
2001 2002 2003 2004 2005 2001 2002 2003 2004 2005Turkey
TIC-RTGS -14.2 -6.4 17.2 16.5 22.0 1,560.5 1,217.7 1,302.8 1,386.7 1,611.2TCS -43.5 -6.4 21.5 22.5 31.1 55.0 42.9 47.6 53.3 66.6ICH -18.6 16.6 16.1 10.2 10.0 29.5 28.7 30.4 30.6 32.1BKM -5.2 39.2 36.1 51.0 22.8 7.1 8.2 10.2 14.1 16.5
BelgiumELLIPS 5.4 -8.3 0.1 6.2 14.8 5,528.7 4,983.6 4,936.3 5,068.9 5,784.2Clearing house -17.2 -16.7 -14.6 -11.1 -19.7 34.3 28.1 23.7 20.4 16.3CEC 2.5 2.9 2.5 3.9 5.5 196.2 198.4 201.1 202.0 211.9
CanadaLVTS 6.7 -0.6 5.9 2.9 8.8 2,571.5 2,508.7 2,592.6 2,559.3 2,677.3
FranceTBF 26.2 2.2 3.3 10.0 10.4 5,849.2 5,892.2 6,040.0 6,534.7 7,129.4PNS 0.4 -12.1 -12.0 -5.0 -12.2 1,491.1 1,291.2 1,127.4 1,053.7 914.9SIT -2.3 78.4 2.9 -4.4 2.2 163.3 286.9 292.9 275.3 278.1CH Paris 3.3 -76.4 nap nap nap 51.0 11.9 nap nap napCH Province -16.6 -97.7 nap nap nap 65.9 1.5 nap nap napCREIC -12.4 -98.3 nap nap nap 1.5 0.0 nap nap nap
Germany2
RTGSplus (former ELS) nap 79.1 2.0 -3.4 7.6 3,252.4 5,822.4 5,947.0 5,725.2 6,180.2EAF (former EAF2) -17.2 nap nap nap nap 1,657.5 nap nap nap napRPS (former DTA) -3.7 -5.4 -1.5 -0.8 -2.9 104.2 98.5 97.2 96.2 93.8
Hong Kong SARHKD CHATS -3.0 -2.4 8.7 18.1 12.4 6,685.9 6,435.9 7,051.3 7,927.8 8,401.2USD CHATS nap 41.2 -0.9 10.5 15.9 558.8 778.3 777.4 817.6 893.2EUR CHATS nap nap nap 71.9 81.4 nap nap 84.9 139.0 237.6
ItalyBI-REL -4.5 -9.7 -4.2 10.8 14.6 2,173.7 1,941.7 1,854.2 2,019.0 2,310.6BI-COMP 6.0 3.4 6.4 3.6 3.3 196.1 200.6 212.7 216.6 223.4
JapanBOJ-NET -45.8 -4.4 4.2 8.8 6.3 3,824.7 3,672.5 3,828.5 4,098.6 4,317.5FXYCS 11.0 -10.1 -21.2 -10.7 -6.2 1,381.7 1,246.9 982.9 863.4 802.5Zengin System 10.0 -7.9 -1.6 2.8 4.2 491.1 454.2 447.1 452.1 466.7Tokyo Clearing House -17.8 -20.8 -11.0 -3.9 -14.6 128.1 101.8 90.6 85.7 72.6
NetherlandsTOP 8.7 -0.8 3.1 11.4 1.9 5,407.5 5,363.7 5,509.9 6,059.3 6,070.5Interpay 2.7 2.3 4.0 1.8 4.3 351.6 359.7 372.9 374.7 384.2
SingaporeMEPS 19.4 -12.8 -2.3 -1.7 27.1 7,511.9 6,335.5 6,125.8 5,458.8 6,478.4SGDCCS -8.7 -8.6 -3.6 3.2 4.6 271.7 240.1 229.0 214.1 209.1USDCCS -8.0 0.9 19.7 37.7 21.4 12.7 12.4 14.7 18.4 20.8IBG 10.8 14.2 16.8 10.9 9.6 52.5 58.0 67.0 67.3 68.9EFTPOS 15.9 13.2 12.3 13.8 17.1 3.6 3.9 4.3 4.5 4.9
SwedenE-RIX -23.2 -6.4 26.3 -6.7 15.8 622.4 566.9 703.8 635.7 725.5K-RIX 2.4 -1.3 -3.4 -5.5 2.6 4,954.7 4,807.6 4,579.3 4,190.3 4,163.0Bankgirot 0.3 2.1 2.3 7.4 11.6 169.8 170.5 172.0 178.9 193.3Dataclearing -20.0 7.0 35.8 9.1 -7.7 48.4 50.9 68.2 72.1 64.4
SwitzerlandSIC 0.7 -2.0 -0.8 -6.9 -3.2 10,740.8 10,394.3 10,273.8 9,373.6 9,011.6DTA/LSV -12.1 3.8 -5.1 -11.7 -36.8 80.8 82.8 78.2 67.7 42.5
United KingdomCHAPS Euro nav -7.1 16.9 5.1 12.6 1,680.4 1,520.2 1,873.0 1,846.8 2,051.6CHAPS Sterling -0.9 -4.0 5.0 0.3 -1.8 4,942.6 4,568.3 4,592.7 4,402.1 4,233.0Cheque/credit -2.1 -3.9 -4.7 -4.1 -6.9 144.4 133.6 121.9 111.8 101.9BACS 11.3 8.5 6.6 10.6 7.1 217.2 227.0 231.7 244.9 256.7
United StatesCHIPS 4.3 0.0 1.4 3.3 -1.6 3,077.7 3,015.5 2,976.5 2,946.9 2,801.9Fedwire 9.1 -5.4 8.0 4.4 5.3 4,182.5 3,875.6 4,077.4 4,081.6 4,152.7
European Union4
TARGET 22.3 17.8 4.7 3.8 7.7 4,202.2 5,153.1 6,417.7 7,204.1 7,671.1EURO1 / STEP1 2.7 -9.8 -8.7 -3.4 -4.8 665.0 624.7 678.4 708.4 666.7STEP23 nap nap nap 489.9 69.3 nap nap 0.2 1.0 1.6
System Increase in the real value of transactions (% change on previous year, adjusted by CPI
inflation)
Value of transactions as a percentage of GDP
Table PS3 (cont)
Note: For the footnotes regarding the systems, see after Comparative Table PS4.
CPSS – Payment systems in Turkey, 2007 98
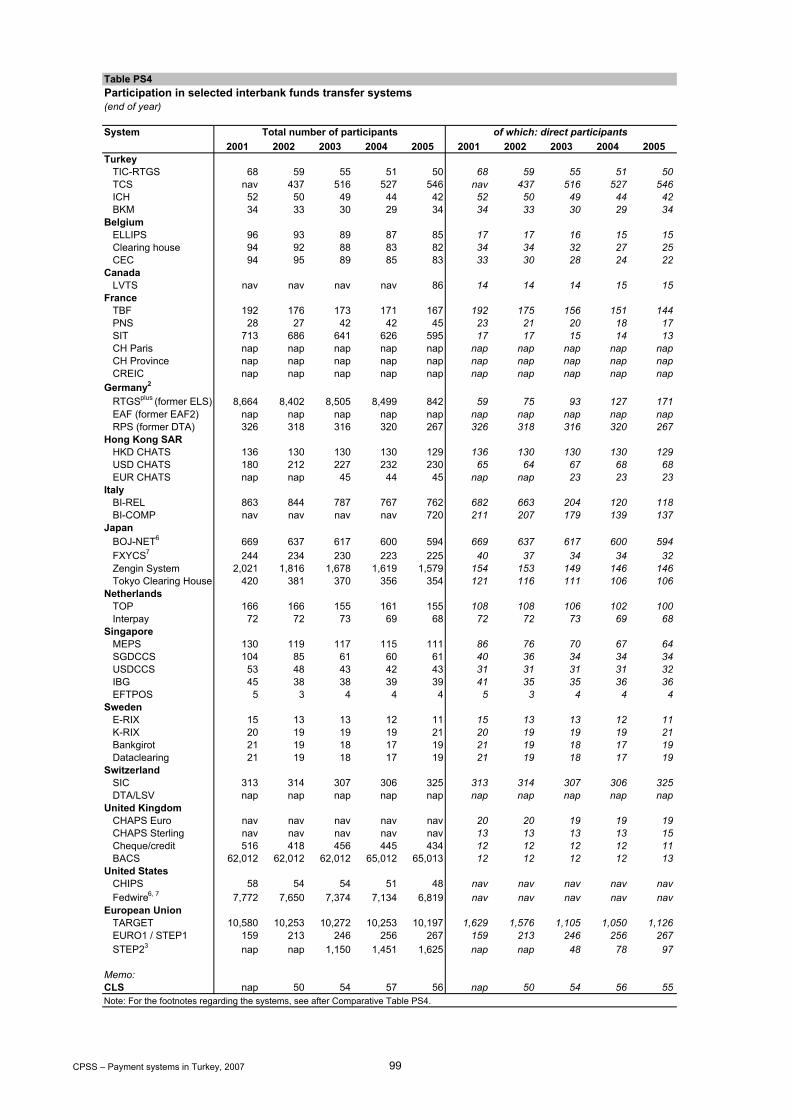
(end of year)
2001 2002 2003 2004 2005 2001 2002 2003 2004 2005Turkey
TIC-RTGS 68 59 55 51 50 68 59 55 51 50TCS nav 437 516 527 546 nav 437 516 527 546ICH 52 50 49 44 42 52 50 49 44 42BKM 34 33 30 29 34 34 33 30 29 34
BelgiumELLIPS 96 93 89 87 85 17 17 16 15 15Clearing house 94 92 88 83 82 34 34 32 27 25CEC 94 95 89 85 83 33 30 28 24 22
CanadaLVTS nav nav nav nav 86 14 14 14 15 15
FranceTBF 192 176 173 171 167 192 175 156 151 144PNS 28 27 42 42 45 23 21 20 18 17SIT 713 686 641 626 595 17 17 15 14 13CH Paris nap nap nap nap nap nap nap nap nap napCH Province nap nap nap nap nap nap nap nap nap napCREIC nap nap nap nap nap nap nap nap nap nap
Germany2
RTGSplus (former ELS) 8,664 8,402 8,505 8,499 842 59 75 93 127 171EAF (former EAF2) nap nap nap nap nap nap nap nap nap napRPS (former DTA) 326 318 316 320 267 326 318 316 320 267
Hong Kong SARHKD CHATS 136 130 130 130 129 136 130 130 130 129USD CHATS 180 212 227 232 230 65 64 67 68 68EUR CHATS nap nap 45 44 45 nap nap 23 23 23
ItalyBI-REL 863 844 787 767 762 682 663 204 120 118BI-COMP nav nav nav nav 720 211 207 179 139 137
JapanBOJ-NET6 669 637 617 600 594 669 637 617 600 594FXYCS7 244 234 230 223 225 40 37 34 34 32Zengin System 2,021 1,816 1,678 1,619 1,579 154 153 149 146 146Tokyo Clearing House 420 381 370 356 354 121 116 111 106 106
NetherlandsTOP 166 166 155 161 155 108 108 106 102 100Interpay 72 72 73 69 68 72 72 73 69 68
SingaporeMEPS 130 119 117 115 111 86 76 70 67 64SGDCCS 104 85 61 60 61 40 36 34 34 34USDCCS 53 48 43 42 43 31 31 31 31 32IBG 45 38 38 39 39 41 35 35 36 36EFTPOS 5 3 4 4 4 5 3 4 4 4
SwedenE-RIX 15 13 13 12 11 15 13 13 12 11K-RIX 20 19 19 19 21 20 19 19 19 21Bankgirot 21 19 18 17 19 21 19 18 17 19Dataclearing 21 19 18 17 19 21 19 18 17 19
SwitzerlandSIC 313 314 307 306 325 313 314 307 306 325DTA/LSV nap nap nap nap nap nap nap nap nap nap
United KingdomCHAPS Euro nav nav nav nav nav 20 20 19 19 19CHAPS Sterling nav nav nav nav nav 13 13 13 13 15Cheque/credit 516 418 456 445 434 12 12 12 12 11BACS 62,012 62,012 62,012 65,012 65,013 12 12 12 12 13
United StatesCHIPS 58 54 54 51 48 nav nav nav nav navFedwire6, 7 7,772 7,650 7,374 7,134 6,819 nav nav nav nav nav
European UnionTARGET 10,580 10,253 10,272 10,253 10,197 1,629 1,576 1,105 1,050 1,126EURO1 / STEP1 159 213 246 256 267 159 213 246 256 267STEP23 nap nap 1,150 1,451 1,625 nap nap 48 78 97
Memo:CLS nap 50 54 57 56 nap 50 54 56 55
of which: direct participants
Table PS4
Note: For the footnotes regarding the systems, see after Comparative Table PS4.
Participation in selected interbank funds transfer systems
System Total number of participants
CPSS – Payment systems in Turkey, 2007 99
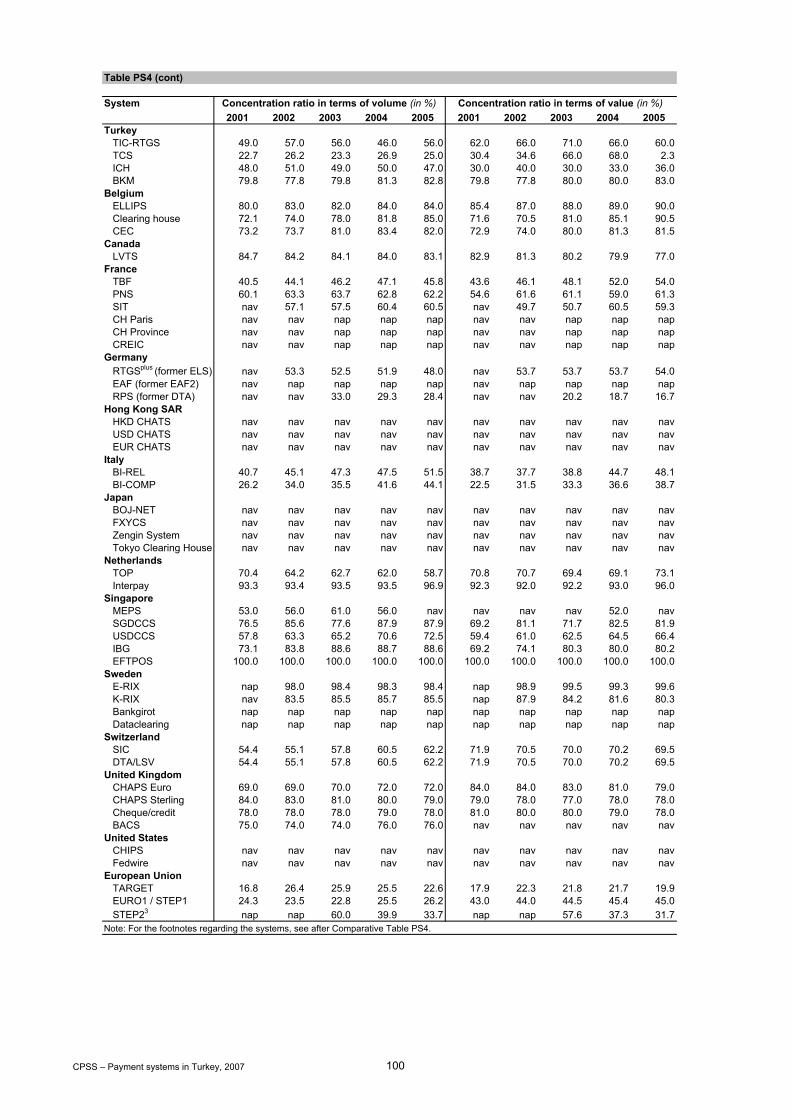
2001 2002 2003 2004 2005 2001 2002 2003 2004 2005Turkey
TIC-RTGS 49.0 57.0 56.0 46.0 56.0 62.0 66.0 71.0 66.0 60.0TCS 22.7 26.2 23.3 26.9 25.0 30.4 34.6 66.0 68.0 2.3ICH 48.0 51.0 49.0 50.0 47.0 30.0 40.0 30.0 33.0 36.0BKM 79.8 77.8 79.8 81.3 82.8 79.8 77.8 80.0 80.0 83.0
BelgiumELLIPS 80.0 83.0 82.0 84.0 84.0 85.4 87.0 88.0 89.0 90.0Clearing house 72.1 74.0 78.0 81.8 85.0 71.6 70.5 81.0 85.1 90.5CEC 73.2 73.7 81.0 83.4 82.0 72.9 74.0 80.0 81.3 81.5
CanadaLVTS 84.7 84.2 84.1 84.0 83.1 82.9 81.3 80.2 79.9 77.0
FranceTBF 40.5 44.1 46.2 47.1 45.8 43.6 46.1 48.1 52.0 54.0PNS 60.1 63.3 63.7 62.8 62.2 54.6 61.6 61.1 59.0 61.3SIT nav 57.1 57.5 60.4 60.5 nav 49.7 50.7 60.5 59.3CH Paris nav nav nap nap nap nav nav nap nap napCH Province nav nav nap nap nap nav nav nap nap napCREIC nav nav nap nap nap nav nav nap nap nap
GermanyRTGSplus (former ELS) nav 53.3 52.5 51.9 48.0 nav 53.7 53.7 53.7 54.0EAF (former EAF2) nav nap nap nap nap nav nap nap nap napRPS (former DTA) nav nav 33.0 29.3 28.4 nav nav 20.2 18.7 16.7
Hong Kong SARHKD CHATS nav nav nav nav nav nav nav nav nav navUSD CHATS nav nav nav nav nav nav nav nav nav navEUR CHATS nav nav nav nav nav nav nav nav nav nav
ItalyBI-REL 40.7 45.1 47.3 47.5 51.5 38.7 37.7 38.8 44.7 48.1BI-COMP 26.2 34.0 35.5 41.6 44.1 22.5 31.5 33.3 36.6 38.7
JapanBOJ-NET nav nav nav nav nav nav nav nav nav navFXYCS nav nav nav nav nav nav nav nav nav navZengin System nav nav nav nav nav nav nav nav nav navTokyo Clearing House nav nav nav nav nav nav nav nav nav nav
NetherlandsTOP 70.4 64.2 62.7 62.0 58.7 70.8 70.7 69.4 69.1 73.1Interpay 93.3 93.4 93.5 93.5 96.9 92.3 92.0 92.2 93.0 96.0
SingaporeMEPS 53.0 56.0 61.0 56.0 nav nav nav nav 52.0 navSGDCCS 76.5 85.6 77.6 87.9 87.9 69.2 81.1 71.7 82.5 81.9USDCCS 57.8 63.3 65.2 70.6 72.5 59.4 61.0 62.5 64.5 66.4IBG 73.1 83.8 88.6 88.7 88.6 69.2 74.1 80.3 80.0 80.2EFTPOS 100.0 100.0 100.0 100.0 100.0 100.0 100.0 100.0 100.0 100.0
SwedenE-RIX nap 98.0 98.4 98.3 98.4 nap 98.9 99.5 99.3 99.6K-RIX nav 83.5 85.5 85.7 85.5 nap 87.9 84.2 81.6 80.3Bankgirot nap nap nap nap nap nap nap nap nap napDataclearing nap nap nap nap nap nap nap nap nap nap
SwitzerlandSIC 54.4 55.1 57.8 60.5 62.2 71.9 70.5 70.0 70.2 69.5DTA/LSV 54.4 55.1 57.8 60.5 62.2 71.9 70.5 70.0 70.2 69.5
United KingdomCHAPS Euro 69.0 69.0 70.0 72.0 72.0 84.0 84.0 83.0 81.0 79.0CHAPS Sterling 84.0 83.0 81.0 80.0 79.0 79.0 78.0 77.0 78.0 78.0Cheque/credit 78.0 78.0 78.0 79.0 78.0 81.0 80.0 80.0 79.0 78.0BACS 75.0 74.0 74.0 76.0 76.0 nav nav nav nav nav
United StatesCHIPS nav nav nav nav nav nav nav nav nav navFedwire nav nav nav nav nav nav nav nav nav nav
European UnionTARGET 16.8 26.4 25.9 25.5 22.6 17.9 22.3 21.8 21.7 19.9EURO1 / STEP1 24.3 23.5 22.8 25.5 26.2 43.0 44.0 44.5 45.4 45.0STEP23 nap nap 60.0 39.9 33.7 nap nap 57.6 37.3 31.7
Note: For the footnotes regarding the systems, see after Comparative Table PS4.
System Concentration ratio in terms of volume (in %) Concentration ratio in terms of value (in %)
Table PS4 (cont)
CPSS – Payment systems in Turkey, 2007 100

CLS: 1 Includes some non-bank financial institutions. 2 Central European Time (CET). 3 Each side of the transaction is counted separately.Spot and forward transactions have two sides, while swaps have four.
Sweden: 1 No same day transaction. 2 Payments become final on completion of settlement, which occurs throughout the day. 3 Thesettlement points for the different flows are spread out between 07:15 and 16:20. 4 The settlement points for the different flows are spreadout between 07:15 and 15:20.
Canada: 1 Final settlement occurs at 18:30. However, due to the risk controls in place, the LVTS provides intraday settlement finality. 2 Nostandard hours.
Germany: 1 Payments are processed in several windows. Payment orders which are submitted between 07:00 and 20:00 (domestic credittransfers as well as STEP2 credit transfers) and between 09:00 and 21:00 (direct debits and payments arising from the paperless chequecollection procedure) are processed in the evening processing. The equivalent values of credit transfers are blocked in the submitter’sBundesbank account on the submission day from 19:00 and transformed into account debit entries on the next business day. The value ofcheques and direct debits is credited on the business day following submission (“subject to collection”). Payment orders which are submittedexclusively by data telecommunication between 20:00 and 07:00 (credit transfers) and 21:00 and 09:00 (direct debits and payments arisingfrom the paperless cheque collection procedure) are processed in the morning processing. The payments are booked and delivered directly onthe morning of the processing day. During the morning processing, delivery and booking of cross-border transfers received from EBA/STEP2and the data delivery and booking of GSE items and BSE cheques (only paper-based submission by public authorities) submitted
Italy: 1 Transfer orders are legally enforceable and binding on third parties when the system completes the gathering of the transfer orders orthe bilateral balances stemming from the two BI-COMP subsystems (“Local Clearing” and “Retail”).
European Union: 1 All times are Central European Time (CET). 2 STEP2 payments are settled in EURO1 at 07.30 CET. 3 STEP2commenced settlement transactions on 29 April 2003. 4 Using euro area consumer price (HICP) inflation and GDP respectively.
Japan: 1 Processing costs of transfer orders are recovered from the participants, but development and maintenance costs are covered by theBank of Japan. 2 Cutoff time is extended to 19:00 only for the participants who are approved by the Bank of Japan. 3 Cutoff time for billsand cheques sorted by banks. Bills and cheques for sorting at TCH must be submitted by 21:00 of the day before the value date. 4 With theconsent of the receiving bank, the third-party orders may be entered for same day settlement until the cutoff time of the system. 5 19:00 formarket participants with access to the extended operating hours of BOJ-NET.Netherlands: 1 In principle; sometimes less.
Singapore: 1 Where they differ, times for Saturdays are shown in brackets. 2 MEPS does not impose a cutoff time for third-party/internationalcorrespondents' payments, but the Association of Banks in Singapore (ABS) bye-laws on MEPS require all such payments to be made by17:30 on Mondays-Fridays and 12:30 on Saturdays. 3 On weekend transaction submissions, settlement occurs on the following Monday.
United Kingdom: 1 In net settlement, the payment becomes final and irrevocable when the payment has had an effect on the bilateral netposition.
United States: 1 Local times are Eastern time. 2 CHIPS, the Clearing House Interbank Payments System, is operated by CHIPCo, which isowned by the Clearing House (formerly known as the New York Clearing House Association). 3 Any depository institution, including a USbranch or agency of a foreign bank, may maintain an account with a Federal Reserve Bank. To obtain an account, an institution must executean account agreement pursuant to Operating Circular 1 (Account Relationships), which outlines the terms and conditions for a master account.An institution with an account at a Federal Reserve Bank may access Fedwire subject to the conditions detailed in Federal Reserve Operating Circular 6 and the Federal Reserve Board’s Policy Statement on Payment System Risk. 4 Payments over CHIPS become final on completionof settlement, which occurs throughout the day. 5 Trading occurs among dealers for funds on deposit at Federal Reserve Banks (ie federalfunds) as early as 06:30. 6 Number of depository institutions that used the Fedwire Funds Transfer Service in 2004. Other Fedwire FundsTransfer participants not included here are: the US Treasury and any entity specifically authorised by federal statute to use the Reserve Banksas fiscal agents or depositories; entities designated by the Secretary of the Treasury; foreign central banks, foreign monetary authorities,foreign governments and certain international organisations. 7 Data prior to 2003 are revised to correspond to the 2004 figure.
Footnotes for Tables PS1–4
Hong Kong SAR: 1 Central Monetary Authority.
Switzerland: 1 R for remote members. 2 The system is open for input 24 hours a day. Settlement services are limited by the indicatedopening and closing times. A value day starts at 17:00 local time on the previous business day and ends at 16:15 on the value day. Third-partypayments may be entered for same day settlement until 15:00. Between 15:00 (cutoff 1) and 16:00 (cutoff 2) only cover (bank-to-bank)payments are accepted for same day settlement. From 16:00 to 16:15, transactions are restricted to the processing of lombard credits(collateralised loans from the Swiss National Bank at a penalty rate).
on the previous day also take place. 2 Introduction of RTGSplus on 5 November 2001 and closedown of ELS and EAF. ELS serves, along withSWIFT, as a means of communication to RTGSplus only.
CPSS – Payment systems in Turkey, 2007 101

Table SSS1
(at end-2005)
System Type of securities Owner/ manager Delivery lag (T+n)
Settlement of cash leg
Securities settlement (delivery)
TurkeyTIC-ESTS G CB nap G G, RTGSTCS G, E SE T+0 , T+2 N N
BelgiumNBB SSS B, C, G, O CB T+2 , T+3 G GCIK (FMS) E, O SE1, O T+3 N GCIK (EMSS) B, E, O SE1, O T+3 G GEuroclear Bank B, C, G, E, O O, B T–T+n G, RTGS G, RTGS
CanadaCDSX B, G, E, O B, SE, O T, T+1, T+3 N G
FranceRGV2
Irrevocable channel B, C, G, E, O Euroclear France T–T+100 RTGS RTGS
Revocable channel B, C, G, E, O Euroclear France T–T+30 N G
GermanyClearstream Banking Frankfurt1 B, G, E, O SE T–T+40 N, RTGS G, RTGS
Hong Kong SARCCASS E, O SE T+2 , T+3 N, RTGS G, RTGSCMU G, O CMA T G, N G, N
ItalyLDT B, G, E, O CB T+3 (B, G), T+5
(E, O)N N
Monte Titoli B, G, E, O Monte Titoli T nap RTGSEXPRESS II B, G, E, O Monte Titoli T–T+n N, RTGS N, RTGS
JapanBOJ-NET JGB Services G CB T–T+3 RTGS RTGSJASDEC O1 JASDEC T–T+3 RTGS RTGS
E2 JASDEC T–T+3 N RTGSE3 JASDEC T+2, T+3 N N
NetherlandsEuroclear Netherlands B, G, E Euroclear
NetherlandsT+3 RTGS RTGS
SingaporeDCSS B SE T+n1 G GCDP E, O SE T+3 N GMEPS G CB T+1, T+2, T+3 RTGS G
Sweden Stockholmsbörsen O O T+3 N NVPC G, E, O B, O T+2, T+3 G, N G
SwitzerlandSECOM B, G, E, O B, O T+3 G G
United KingdomCREST B, C, G, E, O B, O T–T+3 RTGS RTGS
United StatesNBES1 G, O CB T, T+1 RTGS RTGSDTC B, C, E, O B, O T, T+3 N G
Features of selected securities settlement systems
Note: For the footnotes regarding the systems, see after Comparative Table SSS4.
CPSS – Payment systems in Turkey, 2007 102
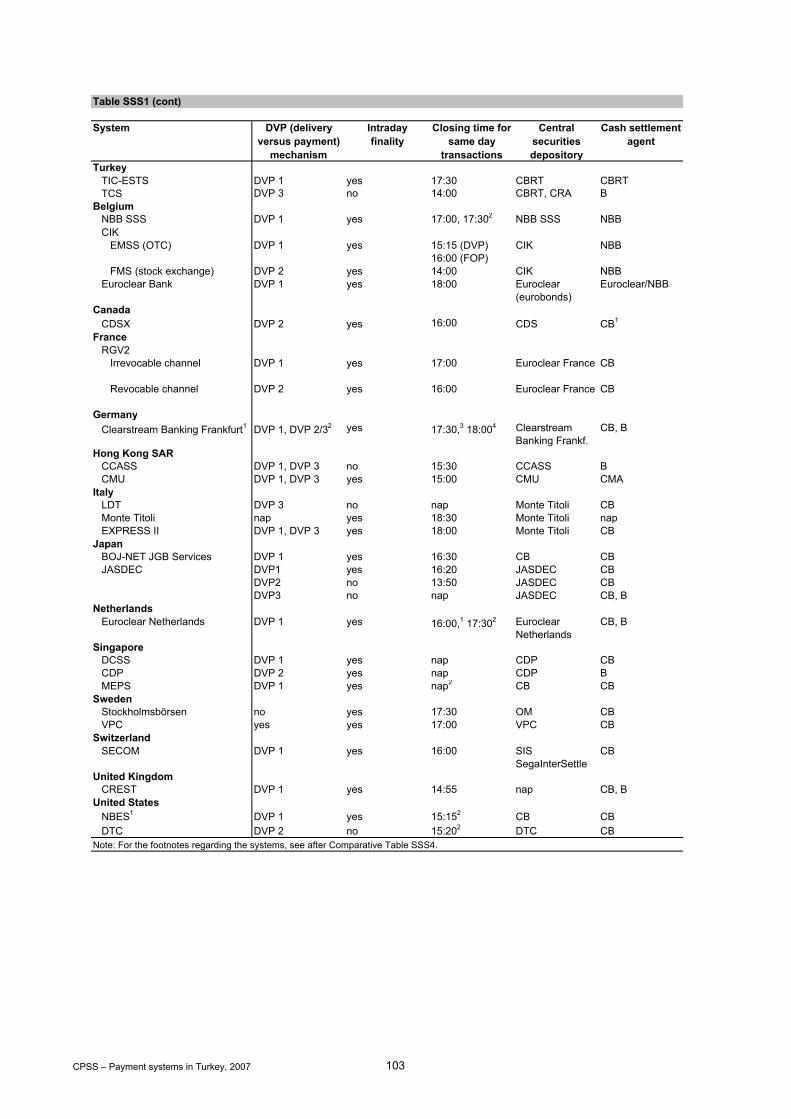
Table SSS1 (cont)
System DVP (delivery versus payment)
mechanism
Intraday finality
Closing time for same day
transactions
Central securities depository
Cash settlement agent
TurkeyTIC-ESTS DVP 1 yes 17:30 CBRT CBRTTCS DVP 3 no 14:00 CBRT, CRA B
BelgiumNBB SSS DVP 1 yes 17:00, 17:302 NBB SSS NBBCIK
EMSS (OTC) DVP 1 yes 15:15 (DVP) 16:00 (FOP)
CIK NBB
FMS (stock exchange) DVP 2 yes 14:00 CIK NBBEuroclear Bank DVP 1 yes 18:00 Euroclear
(eurobonds)Euroclear/NBB
CanadaCDSX DVP 2 yes 16:00 CDS CB1
FranceRGV2
Irrevocable channel DVP 1 yes 17:00 Euroclear France CB
Revocable channel DVP 2 yes 16:00 Euroclear France CB
GermanyClearstream Banking Frankfurt1 DVP 1, DVP 2/32 yes 17:30,3 18:004 Clearstream
Banking Frankf.CB, B
Hong Kong SARCCASS DVP 1, DVP 3 no 15:30 CCASS BCMU DVP 1, DVP 3 yes 15:00 CMU CMA
ItalyLDT DVP 3 no nap Monte Titoli CBMonte Titoli nap yes 18:30 Monte Titoli napEXPRESS II DVP 1, DVP 3 yes 18:00 Monte Titoli CB
JapanBOJ-NET JGB Services DVP 1 yes 16:30 CB CBJASDEC DVP1 yes 16:20 JASDEC CB
DVP2 no 13:50 JASDEC CBDVP3 no nap JASDEC CB, B
NetherlandsEuroclear Netherlands DVP 1 yes 16:00,1 17:302 Euroclear
NetherlandsCB, B
SingaporeDCSS DVP 1 yes nap CDP CBCDP DVP 2 yes nap CDP BMEPS DVP 1 yes nap2 CB CB
SwedenStockholmsbörsen no yes 17:30 OM CBVPC yes yes 17:00 VPC CB
SwitzerlandSECOM DVP 1 yes 16:00 SIS
SegaInterSettleCB
United KingdomCREST DVP 1 yes 14:55 nap CB, B
United StatesNBES1 DVP 1 yes 15:152 CB CBDTC DVP 2 no 15:202 DTC CB
Note: For the footnotes regarding the systems, see after Comparative Table SSS4.
CPSS – Payment systems in Turkey, 2007 103
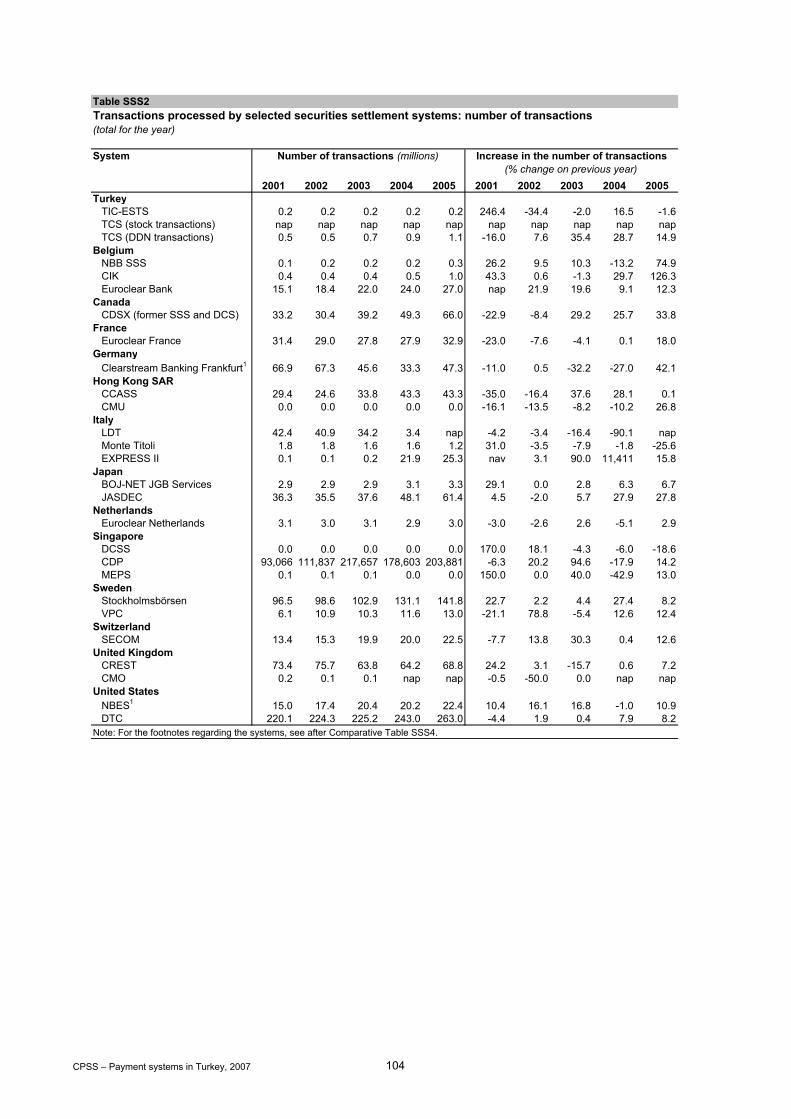
Table SSS2Transactions processed by selected securities settlement systems: number of transactions (total for the year)
2001 2002 2003 2004 2005 2001 2002 2003 2004 2005Turkey
TIC-ESTS 0.2 0.2 0.2 0.2 0.2 246.4 -34.4 -2.0 16.5 -1.6TCS (stock transactions) nap nap nap nap nap nap nap nap nap napTCS (DDN transactions) 0.5 0.5 0.7 0.9 1.1 -16.0 7.6 35.4 28.7 14.9
BelgiumNBB SSS 0.1 0.2 0.2 0.2 0.3 26.2 9.5 10.3 -13.2 74.9CIK 0.4 0.4 0.4 0.5 1.0 43.3 0.6 -1.3 29.7 126.3Euroclear Bank 15.1 18.4 22.0 24.0 27.0 nap 21.9 19.6 9.1 12.3
CanadaCDSX (former SSS and DCS) 33.2 30.4 39.2 49.3 66.0 -22.9 -8.4 29.2 25.7 33.8
FranceEuroclear France 31.4 29.0 27.8 27.9 32.9 -23.0 -7.6 -4.1 0.1 18.0
GermanyClearstream Banking Frankfurt1 66.9 67.3 45.6 33.3 47.3 -11.0 0.5 -32.2 -27.0 42.1
Hong Kong SARCCASS 29.4 24.6 33.8 43.3 43.3 -35.0 -16.4 37.6 28.1 0.1CMU 0.0 0.0 0.0 0.0 0.0 -16.1 -13.5 -8.2 -10.2 26.8
ItalyLDT 42.4 40.9 34.2 3.4 nap -4.2 -3.4 -16.4 -90.1 napMonte Titoli 1.8 1.8 1.6 1.6 1.2 31.0 -3.5 -7.9 -1.8 -25.6EXPRESS II 0.1 0.1 0.2 21.9 25.3 nav 3.1 90.0 11,411 15.8
JapanBOJ-NET JGB Services 2.9 2.9 2.9 3.1 3.3 29.1 0.0 2.8 6.3 6.7JASDEC 36.3 35.5 37.6 48.1 61.4 4.5 -2.0 5.7 27.9 27.8
NetherlandsEuroclear Netherlands 3.1 3.0 3.1 2.9 3.0 -3.0 -2.6 2.6 -5.1 2.9
SingaporeDCSS 0.0 0.0 0.0 0.0 0.0 170.0 18.1 -4.3 -6.0 -18.6CDP 93,066 111,837 217,657 178,603 203,881 -6.3 20.2 94.6 -17.9 14.2MEPS 0.1 0.1 0.1 0.0 0.0 150.0 0.0 40.0 -42.9 13.0
SwedenStockholmsbörsen 96.5 98.6 102.9 131.1 141.8 22.7 2.2 4.4 27.4 8.2VPC 6.1 10.9 10.3 11.6 13.0 -21.1 78.8 -5.4 12.6 12.4
SwitzerlandSECOM 13.4 15.3 19.9 20.0 22.5 -7.7 13.8 30.3 0.4 12.6
United KingdomCREST 73.4 75.7 63.8 64.2 68.8 24.2 3.1 -15.7 0.6 7.2CMO 0.2 0.1 0.1 nap nap -0.5 -50.0 0.0 nap nap
United StatesNBES1 15.0 17.4 20.4 20.2 22.4 10.4 16.1 16.8 -1.0 10.9DTC 220.1 224.3 225.2 243.0 263.0 -4.4 1.9 0.4 7.9 8.2
Note: For the footnotes regarding the systems, see after Comparative Table SSS4.
System Number of transactions (millions) Increase in the number of transactions (% change on previous year)
CPSS – Payment systems in Turkey, 2007 104
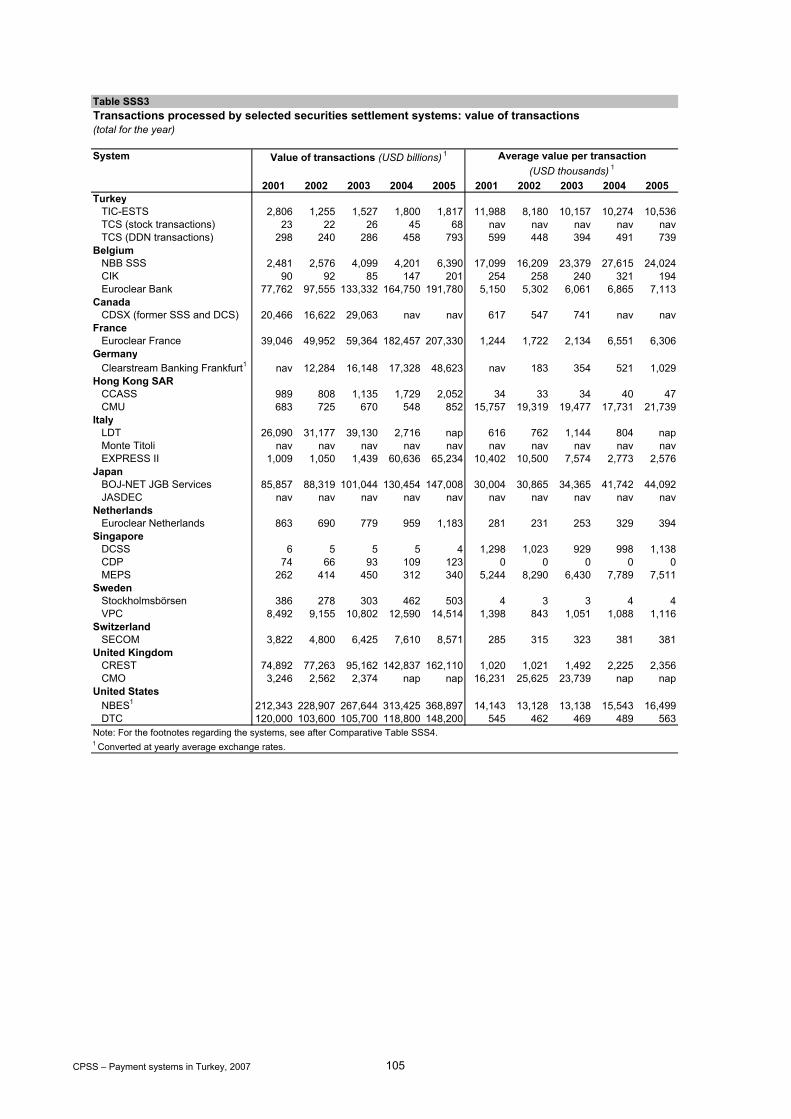
Table SSS3Transactions processed by selected securities settlement systems: value of transactions (total for the year)
2001 2002 2003 2004 2005 2001 2002 2003 2004 2005Turkey
TIC-ESTS 2,806 1,255 1,527 1,800 1,817 11,988 8,180 10,157 10,274 10,536TCS (stock transactions) 23 22 26 45 68 nav nav nav nav navTCS (DDN transactions) 298 240 286 458 793 599 448 394 491 739
BelgiumNBB SSS 2,481 2,576 4,099 4,201 6,390 17,099 16,209 23,379 27,615 24,024CIK 90 92 85 147 201 254 258 240 321 194Euroclear Bank 77,762 97,555 133,332 164,750 191,780 5,150 5,302 6,061 6,865 7,113
CanadaCDSX (former SSS and DCS) 20,466 16,622 29,063 nav nav 617 547 741 nav nav
FranceEuroclear France 39,046 49,952 59,364 182,457 207,330 1,244 1,722 2,134 6,551 6,306
GermanyClearstream Banking Frankfurt1 nav 12,284 16,148 17,328 48,623 nav 183 354 521 1,029
Hong Kong SARCCASS 989 808 1,135 1,729 2,052 34 33 34 40 47CMU 683 725 670 548 852 15,757 19,319 19,477 17,731 21,739
ItalyLDT 26,090 31,177 39,130 2,716 nap 616 762 1,144 804 napMonte Titoli nav nav nav nav nav nav nav nav nav navEXPRESS II 1,009 1,050 1,439 60,636 65,234 10,402 10,500 7,574 2,773 2,576
JapanBOJ-NET JGB Services 85,857 88,319 101,044 130,454 147,008 30,004 30,865 34,365 41,742 44,092JASDEC nav nav nav nav nav nav nav nav nav nav
NetherlandsEuroclear Netherlands 863 690 779 959 1,183 281 231 253 329 394
SingaporeDCSS 6 5 5 5 4 1,298 1,023 929 998 1,138CDP 74 66 93 109 123 0 0 0 0 0MEPS 262 414 450 312 340 5,244 8,290 6,430 7,789 7,511
SwedenStockholmsbörsen 386 278 303 462 503 4 3 3 4 4VPC 8,492 9,155 10,802 12,590 14,514 1,398 843 1,051 1,088 1,116
SwitzerlandSECOM 3,822 4,800 6,425 7,610 8,571 285 315 323 381 381
United KingdomCREST 74,892 77,263 95,162 142,837 162,110 1,020 1,021 1,492 2,225 2,356CMO 3,246 2,562 2,374 nap nap 16,231 25,625 23,739 nap nap
United StatesNBES1 212,343 228,907 267,644 313,425 368,897 14,143 13,128 13,138 15,543 16,499DTC 120,000 103,600 105,700 118,800 148,200 545 462 469 489 563
Note: For the footnotes regarding the systems, see after Comparative Table SSS4.1 Converted at yearly average exchange rates.
System Value of transactions (USD billions) 1 Average value per transaction (USD thousands) 1
CPSS – Payment systems in Turkey, 2007 105

Table SSS3 (cont)
2001 2002 2003 2004 2005 2001 2002 2003 2004 2005Turkey
TIC-ESTS 156.3 -57.3 2.0 1.9 -11.6 1,935 689 642 598 503TCS (stock transactions) -52.5 -9.2 2.4 46.4 32.0 16 12 11 15 19TCS (DDN transactions) 37.0 -23.1 0.0 38.4 51.5 206 132 120 152 220
BelgiumNBB SSS 14.2 -3.0 30.9 -8.6 48.5 1,071 1,021 1,322 1,168 1,723CIK 29.8 -4.5 -24.6 54.4 33.9 39 37 27 41 54Euroclear Bank nav 17.2 12.4 10.2 13.6 33,567 38,670 42,999 45,802 51,720
CanadaCDSX (former SSS and DCS) 28.9 -19.5 51.7 nav nav 2,861 2,261 3,346 nav nav
FranceEuroclear France 16.4 19.2 -2.9 173.0 11.5 2,914 3,422 3,297 8,852 9,762
GermanyClearstream Banking Frankfurt1 nav nav 8.7 -4.2 175.5 nav 608 662 632 1,747
Hong Kong SARCCASS -27.8 -15.7 44.0 52.9 17.4 594 494 717 1,043 1,154CMU -8.7 9.4 -5.2 -17.9 53.9 410 443 423 331 479
ItalyLDT 7.2 10.6 1.9 -93.8 nap 2,335 2,554 2,596 157 napMonte Titoli nav nav nav nav nap nav nav nav nav navEXPRESS II 1,868.8 -3.7 11.3 3,642.9 5.3 90 86 95 3,510 3,691
JapanBOJ-NET JGB Services -3.1 7.0 6.2 20.5 15.1 2,094 2,250 2,389 2,831 3,231JASDEC nav nav nav nav nav nav nav nav nav nav
NetherlandsEuroclear Netherlands -7.0 -26.9 -7.9 10.3 21.6 215 157 145 157 188
SingaporeDCSS 117.7 -6.6 -15.9 -3.6 -9.1 7 6 5 4 4CDP -24.2 -9.5 35.8 11.4 11.3 86 75 101 102 106MEPS 168.1 58.6 5.1 -34.0 6.8 306 469 487 292 291
SwedenStockholmsbörsen -12.7 -33.6 -11.2 36.8 10.1 175 114 100 132 141VPC 12.9 -0.6 -4.1 4.8 16.4 3,838 3,752 3,551 3,605 4,064
SwitzerlandSECOM 10.8 15.1 15.1 8.5 11.6 1,526 1,734 1,988 2,113 2,344
United KingdomCREST 5.6 -2.3 11.6 32.1 12.2 5,218 4,910 5,250 6,628 7,277CMO nav -25.2 -16.0 nap nap 226 163 131 nap nap
United StatesNBES1 10.4 6.5 14.6 14.2 14.4 2,097 2,186 2,440 2,671 2,954DTC 0.8 -14.7 0.0 9.6 21.3 1,185 990 963 1,012 1,187
Note: For the footnotes regarding the systems, see after Comparative Table SSS4.1 Converted at yearly average exchange rates.
System Increase in the real value of transactions (% change on previous year, adjusted by CPI
inflation)
Value of transactions as a percentage of GDP
CPSS – Payment systems in Turkey, 2007 106

Table SSS4Participation in selected securities settlement systems
2001 2002 2003 2004 2005Turkey
TIC-ESTS 68 59 55 51 50TCS nav 437 516 527 546
BelgiumNBB SSS 134 123 109 107 94CIK 104 97 93 87 81Euroclear Bank 1,778 1,634 1,538 1,491 1,497
CanadaCDSX (former SSS and DCS) 189 185 0 77 76
FranceEuroclear France 145 193 241 190 184
GermanyClearstream Banking Frankfurt1 422 437 411 405 369
Hong Kong SARCCASS 527 529 493 487 480CMU 354 333 330 324 307
ItalyLDT 281 266 212 nap nap CAT nap nap nap nap nap Monte Titoli 1,867 1,916 1,869 1,967 2,174EXPRESS II 107 125 153 131 129
JapanBOJ-NET JGB Services (book-entry system) 360 348 341 340 335BOJ-NET JGB Services (registration system) 398 379 370 357 351JASDEC (equities) 290 272 275 272 277JASDEC (CP) nap nap 47 57 65
NetherlandsEuroclear Netherlands 56 82 80 79 57
SingaporeDCSS 50 52 51 44 44CDP 1,196 1,208 1,220 1,324 1,278MEPS 133 120 117 115 111
SwedenStockholmsbörsen 84 83 79 79 100VPC 47 45 44 44 42
SwitzerlandSECOM 433 489 462 448 437
United KingdomCREST 41,227 52,881 38,054 41,882 43,051CMO 64 58 nap nap nap
United StatesNBES1 1,888 1,793 1,667 1,547 1,319DTC 475 474 436 362 334
System Total number of participants
Footnotes for Tables SSS1–4
Germany: 1 Introduction of a central counterparty (Eurex Clearing (Equities)) in April 2003. 2 Mixture of DVP2 and DVP3 (securitiesdisposition on a gross basis without finality until final settlement of net cash position). 3 For DVP (delivery versus payment) transactions.4 For FOP (free of payment) transactions.
Note: For the footnotes regarding the systems, see below.
Belgium: 1 Since January 2006, SSS CIK has been part of the Euroclear Group and been referred to as “Euroclear Belgium”. (The ICSD thatis part of the Euroclear Group is referred to as “Euroclear Bank”.) 2 ESCB monetary policy and credit operations (FOP).Canada: 1 The Bank of Canada acts as the cash settlement agent for CAD transactions that settle in CDSX. For domestic USD transactionsthat settle in CDSX, a commercial bank acts as the cash settlement agent. The value and volume of domestic USD transactions are relativelyinsignificant when compared to overall CDSX figures.
Netherlands: 1 For DVP (delivery versus payment) transactions. 2 For FOP (free of payment) transactions.Singapore: 1 By mutual agreement between counterparties. 2 Intraday repo trading is possible but rare; in such cases, transactions mustbe completed by 16:30. United States: 1 NBES is the Federal Reserve’s National Book-Entry System. 2 Eastern time.
Japan: 1 Since January 2006, in addition to commercial paper, corporate and other debt securities have been eligible for JASDEC. 2 Forequities traded outside the exchanges and cleared via the JASDEC DVP Clearing Corporation. 3 For exchange-traded equities cleared viathe Japan Securities Clearing Corporation.
CPSS – Payment systems in Turkey, 2007 107