common core workbook iwb common corewm01_27_15.pdf · education time courseware inc. copyright 2014...
TRANSCRIPT

Copyright © 2014
Education Time Courseware, Inc.
John R. Mazzarella
Richard G. Schiller
COMMON CORE
Workbook

Education Time Courseware Inc. Copyright 2014 Page 2
AUTHORS: v2.1
John Mazzarella Adjunct Professor Mathematics, Molloy College
Mathematics Teacher (Retired)
Richard Schiller Adjunct Professor Mathematics, Molloy College
Mathematics Teacher, St. John the Baptist DHS
COPYRIGHT 2014
Education Time Courseware, Inc.
83 Twin Lane North
Wantagh, NY 11793
PHONE: (516) 784-7925
ISBN: 0-943749-86-8
COMMON CORE WORKBOOK

Education Time Courseware Inc. Copyright 2014 Page 3
Table of contents:
Study Guide ................................................................................................................................................. 7
Unit 1 – Analyzing Graphs of Functions .................................................................................................. 10
Homework 1: Foundations - Domain and Range (A-REI.10,F-IF.1,F-IF.2) ................................. 10
Homework 2: Piecewise Linear Functions (F-IF.4, F-IF.7.b, N-Q.2) ............................................. 12
Homework 3: Foundations: Graphs of Quadratic Functions (A-CED2)...................................... 15
Homework 4: Analyzing Graphs of Quadratics/Rate of Change (A-CED2, F-IF.7.a) ................. 16
Homework 5: Foundations: Graphs of Exponential Functions (A-CED.2) .................................. 20
Homework 6: Analyzing Exponential Graphs (F-IF.2) ................................................................... 21
Homework 7: Two Graphing Stories (F-IF.2,.6,.7) .......................................................................... 23
Homework 8: Unit 1 Review .............................................................................................................. 25
Unit 2 - Algebraic Expressions ................................................................................................................. 30
Homework 1: Foundations - Signed Numbers (A.SEE.1B, A-SSE.2, A-APR.1) ........................... 30
Homework 2: Foundations: Algebraic Expressions /Order of Operation (A-SSE.1B,A-SEE.2) ... 32
Homework 3: –Distributive, Commutative & Associative Properties (A-SEE.1B, A-SEE.2) .... 34
Homework 4: Expressions (A-SSE.1A, A-SSE.1B, A-SSE-2) ......................................................... 37
Homework 5: Unit 2 Review .............................................................................................................. 40
Homework 6: Cumulative Review Questions (Unit 2) ..................................................................... 42
Unit 3 –Polynomials .................................................................................................................................. 44
Homework 1: Addition and Subtraction of Polynomials (A-SSE.2, A-APR.1) ............................ 44
Homework 2: Multiplication and Division of Polynomials (A-SSE.2, A-APR.1) .......................... 46
Homework 3: Exponents – Review of basic properties (N-RN.1) ................................................... 48
Homework 4: Zero, Negative and Fractional Exponents (N-RN.1) ............................................... 49
Homework 5: Removing Parentheses (A-APR.1, A-SSE.2) ............................................................ 50
Homework 6: Modeling (A-SSE.2, A-APR.1)................................................................................... 51
Homework 7: Geometric Applications (A-SSE.2, A-APR.1) .......................................................... 54
Homework 8: Unit 3 Review .............................................................................................................. 55
Homework 9: Cumulative Review Questions (Unit 3) ..................................................................... 58
Unit 4 –Foundations - Radicals ................................................................................................................. 61
Homework 1: Add/Subtract Radicals (A-REL.4A, N-RN.2) .......................................................... 61
Homework 2: Multiplication / Division of Radicals (A-REL.4A, N-RN.3) .................................... 63
Unit 5 – Solving Equations and Inequalities ............................................................................................. 66
Homework 1: Solving Linear Equations (A-CED.1, A-REI.3) ....................................................... 66
Homework 2: Foundations: Fractional, Decimal and Literal Equations (A-CED.1, A-REI.1,.3) .. 67
Homework 3: True and False Equations (A-CED.1, A-REI.1,.3) .................................................. 69
Homework 4: Applications /Fractional Equations (A-CED.1, A-REI.1,2,.3) ................................ 70
Homework 5: Foundation: Inequality Expressions (A-CED.1, A-REI.1,.3) ................................. 73

Education Time Courseware Inc. Copyright 2014 Page 4
Homework 6: Foundations: Inequality Word Problems (A-CED.1, A-REI.1,.3) ......................... 74
Homework 7: Solving Inequalities (A-CED.1, A-REI.1, A-REI.3) ................................................ 75
Homework 8: Inequalities Joined by “AND” or “OR” (A-CED.1, A-REI.1,.3) ........................... 76
Homework 9: Unit 5 Review .............................................................................................................. 77
Homework 10: Cumulative Review Questions (Unit 5) .................................................................. 79
Unit 6 – Solution Sets to Equations with Two Variables ..........................................................................81
Homework 1: Foundations: Verbal Problems (A-CED.1, A-CED.2, A.REI.3) ............................ 81
Homework 2: Foundations: Graphing Linear Functions (F-IF.2) ................................................. 84
Homework 3: Graphs of Linear Equations (A-CED.1, A-CED.2, A.REI.3) ................................. 85
Homework 4: Foundations–Graphs of Simultaneous Equations (A-REI.6, A-REI.10, F-IF.1) .. 87
Homework 5: Simultaneous Equations Algebraically (A-REI.6,12) .............................................. 89
Homework 6: System of Inequalities (A-REI.6, A-REI.12) ............................................................ 92
Homework 7: Applications of Systems (N-Q.1, A-SSE.1A,A-CED1,2,3) ...................................... 94
Homework 8 - Rates and Algebra Solutions (N-Q.1, A-SSE.1A, A-CED.1, .2, .3) ........................ 97
Homework 9 - Unit 6 Review ............................................................................................................. 98
Homework 10: Cumulative Review Questions (Unit 6) .................................................................. 99
Unit 7 – Statistics .....................................................................................................................................102
Homework 1: Foundations: Relationships (S.ID.2,S-IC.1) .......................................................... 102
Homework 2: Foundations: Histograms, Box & Whisker, Stem & Leaf (S-ID.1, S-ID.2) ........ 103
Homework 3: Distributions and Their Shapes (S-ID.1, S-ID.2, S-ID.3) ...................................... 105
Homework 4: Describing the Center of a Distribution (S-ID.2) ................................................... 108
Homework 5: Interpreting the Mean as a Balance Point (S-ID.1,2,3) ......................................... 111
Homework 6: Summarizing Deviations from the Mean (S-ID.2) ................................................. 114
Homework 7: Measuring Variability for Symmetrical Distributions (S-ID.2) ........................... 115
Homework 8: Interpreting the Standard Deviation (S-ID.2, S-ID.5, S-ID.9) ............................. 117
Homework 9: Skewed Distributions (Interquartile Range) (S-ID.1, S-ID.2, S-ID.3, S-ID.4) .... 119
Homework 10: Comparing Distributions (S-ID.1, S-ID.2, S-ID.3) .............................................. 121
Homework 11: Bivariate Categorical Data & Relative Frequencies (S-ID.5, S-ID.9) ................ 123
Homework 12: Relationships between Two Numerical Variables (S-ID.5, S-ID.6) ................... 125
Homework 13: Modeling Relationships with a Line (S-ID.6, S-ID.7, S-ID.8, S-ID.9) ................ 129
Homework 14: Interpreting Residuals from a Line (S-ID.6, S-ID.7, S-ID.8, S-ID.9)................ 131
Homework 15: Analyzing Residuals & Correlations (S-ID.6, S-ID.7, S-ID.8, S-ID.9) ............... 135
Homework 16: Unit 7 Review .......................................................................................................... 139
Homework 17: Cumulative Review Unit 7 ..................................................................................... 144
Unit 8 – Sequences...................................................................................................................................148
Homework 1: Integer Sequences ( F-IF.2,F-IF.3,F-BF.1A,F-BF.2,F-LE.2) ................................ 148

Education Time Courseware Inc. Copyright 2014 Page 5
Homework 2: Recursive Formulas for Sequences (F-IF.3) ........................................................... 151
Homework 3: Arithmetic Sequences (F-IF3, F-BF.1, F-BF.2) ...................................................... 153
Homework 4: Geometric Sequences (A-SSE.4, F-BF.1, F-LE.2) ................................................. 155
Homework 5: Investment Applications (F-LE.5) ........................................................................... 156
Homework 6: Exponential Growth & Exponential Decay (F-LE.1C, F-LE.2, F-LE.5, F-BF.1) ..... 158
Homework 7: Review for Unit 8 Test .............................................................................................. 160
Unit 9 – Functions and Interval Notation ................................................................................................ 162
Homework 1: Patterns in Linear Equations (F-IF.2, F-IF.4, F-IF.7)........................................... 162
Homework 2: Modeling Linear Equations (F-IF.2, F-IF.4, F-IF.7) ............................................. 163
Homework 3: Evaluating Functions (F-IF.1, F-IF.2) .................................................................... 166
Homework 4: Foundations - Functions (F-IF.1, F-IF.2) ............................................................... 171
Homework 5: Unit 9 Review Questions .......................................................................................... 174
Homework 6: Cumulative Review Questions (Unit 9) ................................................................... 176
Unit 10 – The Graph of Functions .......................................................................................................... 179
Homework 1: Interpreting the Graph of a Function (F-IF.1, F-IF.2, F-IF.4, F-IF.6) ............... 179
Homework 2 –Graphing Functions/ Programming Code ( F-IF.1,F-IF.2, F-IF.7,F-LE.2) ........ 181
Homework 3 – Piecewise Functions (F-IF.6, F-IF.7, F-BF.3) ....................................................... 185
Homework 4 – Transformations of Functions with Parent Graphs (F-IF.4, F-BF.3) ................ 187
Homework 5: Transformations of Functions – Sketching Graphs (F-IF.4, F-BF.3, F-LE.2, F-IF.7) 190
Homework 6 - Concept Connectors (F-IF.4, F-BF.3, F-LE.2) ...................................................... 193
Homework 7: Foundations – Slopes of Linear Equations (F-IF.4, F-IF.6).................................. 194
Homework 8: Unit 10 Review .......................................................................................................... 196
Homework 9: Cumulative Review Questions (Unit 10) ................................................................. 198
Unit 11 – Foundations – Rational Expressions ....................................................................................... 200
Homework 1: Rational Expressions ( & ) (A-APR.1, A-APR.2, A-APR.6, A-APR.7) ........ 200
Homework 2: Rational Expressions (Addition & Subtraction) (A-APR.1, A-APR.7) ............... 202
Homework 3: Solving Fractional Equations (A-ARP.1, A-ARP.7, A-REI.2).............................. 204
Unit 12 – Quadratic Functions ................................................................................................................ 206
Homework 1: Factoring Polynomial Expressions (A.SSE.2) ........................................................ 206
Homework 2: Geometric Applications using Polynomials (A-APR.1, A-APR.7, F-BF.1A, F-IF.8A) .. 208
Homework 3: Factoring Strategies (A-APR.1, A-APR.7, F-BF.1A, F-IF.8A, A-SEE.3) ............ 210
Homework 4: Solving Quadratic Equations (A-SSE.3, A-APR.3, A-REI.4B, F-IF.8) ............... 212
Homework 5: Solving Quadratic Equations (A-SSE.3, A-APR.3, A-REI.4B, F-IF.8) ............... 213
Homework 6: Creating Quadratic Equations (A-APR.3, A-REI.4B, F-IF.8, F-BF.1, F-LE.3) ........ 214
Homework 7: Graphs of Quadratic Functions (A-APR.3, A-REI.4B, F-IF.8A, F-IF.7C) ......... 215
Homework 8: Graphing Functions from Factored Form (A-APR.3, A-REI.4B, F-IF.8A, F-IF.7C) .... 217
Education Time Courseware Inc. Copyright 2014 Page 6
Homework 9: Interpreting Quadratic Functions (F-LE.3 A-REI.4B, F-IF.8A, F-IF.7C) ........ 220
Homework 10: Completing the Square (A-SSE.3B, A-REI.4a, b, F-IF8) ................................... 222
Homework 11: Solving by Completing the Square (A-SSE.3B, A-REI.4a, b, F-IF8)................ 223
Homework 12: Solving Equations by Formula (A-REI.4B, A-SSE.3, A-APR.3, F-IF.8) ........... 224
Homework 13: Applying the Discriminant (A-REI.4B, A-SSE.3, A-APR.3, F-IF.8) ................. 225
Homework 14: Vertex Form /Standard Form (F-IF.8a, A-REI.4B, A-SSE.3) ........................... 227
Homework 15: Graphing Root Functions ((F-IF.4, F-BF.3, F-LE.2, F-IF.7)) ........................... 229
Homework 16: Translating Functions (F-IF.4, F-BF.3, F-LE.2, F-IF.7) .................................... 231
Homework 16: Review for Unit 12 Test ......................................................................................... 235
Homework 17: Cumulative Review Questions (Unit 12) .............................................................. 238
Full Year Practice Test 1 .......................................................................................................................243
Full Year Practice Test 2..........................................................................................................................250 Practice Test 3 ..........................................................................................................................................257
Practice Test 4 ..........................................................................................................................................264

Education Time Courseware Inc. Copyright 2014 Page 7
Study Guide
Properties of Real Numbers
Addition Multiplication
Commutative: a + b = b + a a•b = b•a
Associative: a + (b + c) = (a + b) + c a(bc)=(ab)c
Distributive: a(b + c) = ab + ac
Identity: a + 0 = a a•1 = a
Inverse: a + (-a) = 0 a•1
a= 1
Zero Property: a•0 = 0
Scientific Notation:
9.4 ×103 = 9400 9.4× 10
-3 = .0094
Absolute Value
| 3 | = 3 | - 3 | = 3
TO SOLVE EQUATIONS :
Remove parentheses( DISTRIBUTE)
Remove decimals or fractions
Combine LIKETERMS on the same sideof the= sign
Movethe required variable to the same sideof the=
ISOLATE thevariableby additionor subtraction
Then DIVIDE by thecoefficient of thevariabletoend
LITERAL EQUATIONS:
ISOLATE the REQUIRED VARIABLE:
Example: Solve for a:
ab + c = d
- c = - c
ab = d - c
ab d c
b b
d ca
b
INEQUALITIES
ISOLATE the REQUIRED VARIABLE
Same process as equations
NOTE: ONE MAJOR INEQUALITY FACT
WHEN MULTIPLY or DIVIDE both sides by
A NEGATIVE NUMBER
MUST CHANGE the DIRECTION of the
INEQUALITY
Example. -3x ≤ 15
Divide both sides by -3
x ≥ - 5
3 15
3 3
x
INTERVAL NOTATION
( 2 , 5 ) represents 2 < x < 5
[ 2, 5 ] represents 2 ≤ x ≤ 5
[ 2, 5 ) represents 2 ≤ x < 5
MULTIPLICATION ( FOIL or DISTRIBUTE)
( x + 4) ( x – 2) = x2 – 2x + 4x – 8
= x2 + 2x + 8
( a + b)2 = (a + b)( a + b)= a
2 + 2ab + b
2
( a – b)2 = ( a – b)( a – b) = a
2 – 2ab + b
2
( a – b)( a + b) = a2 – ab + ab + b
2 = a
2 – b
2
EXPONENTS
xa •x
b= x
a+b x
0 = 1
aa-b
b
x= x
x x
-2 =
2
1
x
(xa)b = x
ab
(xy)a = x
a•x
b (-5)
2 ≠ -5
2

Education Time Courseware Inc. Copyright 2014 Page 8
EQUATIONS OF LINES m = slope
y = mx + b slope – intercept form
y – y1 = m(x – x1) point – slope form
SLOPE:
2 1
2 1
y yvertical change risem
hoeizontal change run x x
PARALLEL LINES have EQUAL SLOPES
PERPENDICULAR LINES slopes are NEGATIVE
RECIPROCALS
SYSTEMS of EQUATIONS:
y – 3x = 3 SUBSTITUTE one variable into the second equation.
y + 3x = 9 ADD or SUBTRACT to eliminate a variable.
INEQUALITY SYSTEMS – graph EQUALITY , DOTTED(< or >),
or SOLID (≤ or ≥)lines and SHADE the SOLUTION side.
LINEAR QUADRATIC SYSTEM:
SUBSTITUTE linear into the quadratic and solve.
FACTORING
1) Look for GCF First (greatest
common factor number or variable)
2) Difference of TWO perfect squares
A2 – B
2
3) Trinomial x2 + Ax + M
( 2 #’s add to A and multiply to M)
( x # ) ( x # )
QUADRATIC EQUATIONS
Set = 0 x2 – 2x – 8 = 0
Factor ( x – 4) ( x + 2) = 0
T chart x – 4 = 0 | x + 2 = 0
Solve for x x = 4 x = - 2
These are the ROOTS of the equation.
PARABOLAS
y = ax2 + bx + c
Axis of Symmetry x = b
a
Roots are the x intercepts, where the
parabola crosses the X AXIS
FRACTIONS
UNDEFINED: N
Dwhen D = 0
2
5x is undefined when x = 5 (D = 0)
ADDITION/ SUBTRACTION
Need COMMON DENOMINATOR
3 4
2 3
3 3 2 4
3 2 2 3
9 8 17
6 6 6
x x
x x
x x x
MULTIPLICATION
“MULTIPLY ACROSS” 2 5 10
3 7 21
DIVISION
“INVERT and MULTIPLY”
2 5 2 7 14
3 7 3 5 15
ALWAYS FACTOR FIRST!
FUNCTIONS
Every x value is assigned ONE and ONLY ONE y value.
{ (2,3), (4,5), (6,8) } YES { (2,3) , (4,5), ( 2, 8)} NO
f(x) = 2x+1 find f(3) = 2(3) + 1 = 7
A GRAPH that passes the VERTICAL LINE TEST is a function.
DIRECT VARIATION
Occurs if one variable increases then the other increases also or if
one variable decreases, the other variable decreases also.
Expressed as y = kx or k =y
x where k is called the CONSTANT of
VARIATION.
EXPONENTIAL GROWTH and DECAY
GROWTH: y = a(base)x where a is positive and the base is
greater than 1. ( Growth RATE is greater than 100%)
DECAY: y = a(base)x where a is positive and the base is also
positive but less than . (Decay RATE is less than 100%)
PYTHAGOREAN THEORM
SIDES OF A RIGHT TRIANGLE
a2+b
2 = c
2
c is the HYPOTENUSE, a and b legs
TRIPLETS: 3,4,5 AND 5,12,13

Education Time Courseware Inc. Copyright 2014 Page 9
STATISTICS
MODE = most frequent score
MEDIAN = middle number of an
ORDERED list
MEAN = average = Sum divided by
number of items
RANGE = high score – low score
OUTLIERS = values far away from rest of
data
NUMBER SUMMARY:
Min, Quart 1, Median, Quart #3, Max
QUARTILES divide data into 4 (25%)
equal parts.
PERCENTILES: Percentage of scores at or
below this percent=
#100
#
of scores below
total of scores
BOX AND WHISKER
Min and Max at ends of “WHISKERS”
Quartile 1, Median, Quartile 3 form the box
1 2
1 2
( ) ( )AverageRateof change
Linear Functions: averagerateof changeisa constant.
QuadraticFunctions: averagerateof changeisnot constant
GRAPHS
f x f x
x x

Education Time Courseware Inc. Copyright 2014 Page 10
Unit 1 – Analyzing Graphs of Functions
Homework 1: Foundations - Domain and Range (A-REI.10,F-IF.1,F-IF.2)
1) Name the domain and the range of each relation and state whether it is a function and justify your
answer:
a) (3,5),(4,6),(5,7),(6,6){ } b) ( ,2),( ,4),( ,6){ }A B C c) (1,4),(1,5),(1,9){ }
Domain: Domain: Domain:
Range: Range: Range:
Function: Function: Function:
2) State the domain and range for each graph below and state whether it is a function and justify your
answer. Use interval notation.
a) b)
c) d)

Education Time Courseware Inc. Copyright 2014 Page 11
3) State the domain and range for each graph below and state whether it is a function and justify your
answer.
a) b)
c) d)
e) f)

Education Time Courseware Inc. Copyright 2014 Page 12
Unit 1 – Analyzing Graphs of Functions
Homework 2: Piecewise Linear Functions (F-IF.4, F-IF.7.b, N-Q.2)
Review
1) State the domain and range for each of the following. State if they are a function.
a) {(1,2) (2,2) (3,2)} b) c)
2) The elevation versus time graph below represents a bike ride by Marie. Use the graph to answer the
following questions.
a) How many feet did Marie travel in 2 minutes ?
b) For how many minutes was Marie resting?
c) How long did it take Marie to return to her starting position?
d) State the intervals where Marie’s elevation is increasing.
e) State the interval where Marie’s elevation is decreasing.
f) State the interval where Marie’s elevation is constant.

Education Time Courseware Inc. Copyright 2014 Page 13
Hw 2 continued
3) Create a story to match each graph below.
a) Story:
b) Story
c) Story
d) Draw up an elevation-versus-time graphing story of your own and then make up a story for it.
Story
Education Time Courseware Inc. Copyright 2014 Page 14
Hw 2 continued
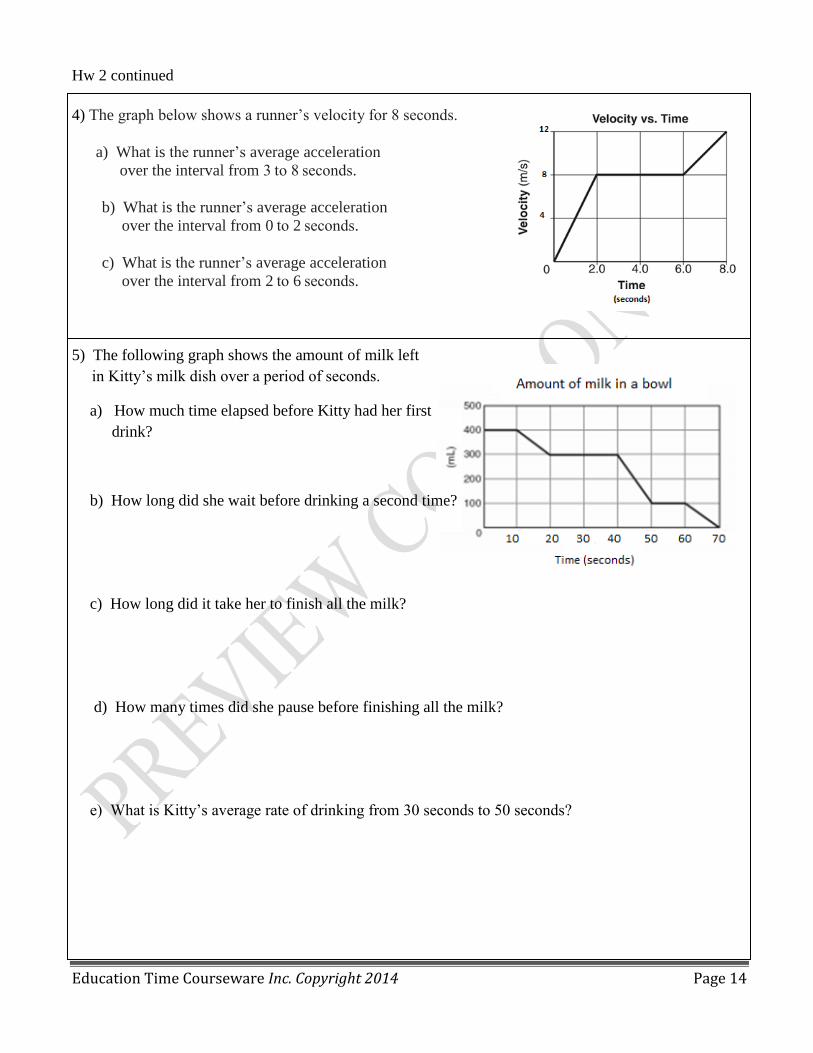
4) The graph below shows a runner’s velocity for 8 seconds.
a) What is the runner’s average acceleration
over the interval from 3 to 8 seconds.
b) What is the runner’s average acceleration
over the interval from 0 to 2 seconds.
c) What is the runner’s average acceleration
over the interval from 2 to 6 seconds.
5) The following graph shows the amount of milk left
in Kitty’s milk dish over a period of seconds.
a) How much time elapsed before Kitty had her first
drink?
b) How long did she wait before drinking a second time?
c) How long did it take her to finish all the milk?
d) How many times did she pause before finishing all the milk?
e) What is Kitty’s average rate of drinking from 30 seconds to 50 seconds?

Education Time Courseware Inc. Copyright 2014 Page 15
Unit 1 – Analyzing Graphs of Functions
Homework 3: Foundations: Graphs of Quadratic Functions (A-CED2)
1) Sketch the graph of each function.
a) 23y x b) 21
2y x
c) 2 8 18y x x d) 2 8 18y x x
e) Why are these graphs called a quadratic function and not a linear function?

Education Time Courseware Inc. Copyright 2014 Page 16
Unit 1 – Analyzing Graphs of Functions
Homework 4: Analyzing Graphs of Quadratics/Rate of Change (A-CED2, F-IF.7.a)
Review
1) State whether or not each graph represents a function. Justify your answer.
(a) (b)
2) Is the set of points, { ( 2, 3), ( 4, 5), ( 2, 6), ( 7, 0) } a function? Explain your answer.
3) Write in interval notation, the set of all numbers greater than 2 and less than or equal to 9.
4) a) Sketch a graph of 2( 2) 1y x
b) Is this a quadratic function or linear? Explain your answer.

Education Time Courseware Inc. Copyright 2014 Page 17
Hw 4 continued
5) Use the table below to answer the following questions.
x 0 1 2 3 4 5 6
y 0 52
6 212
16 30
a) Plot the points (x,y) in this table on a graph (except when x = 5).
b) Find the y – value when x = 5
c) Find the average rate of change from x = 2 to x = 4
d) What kind of graph is this function?

Education Time Courseware Inc. Copyright 2014 Page 18
Hw 4 continued
6) Use the table below to answer the following questions.
x 0 1 2 3 4 5 6
y 0 -0.5 -1 -1.5 -2 -3
a) Plot the points (x,y) in this table on a graph (except when x = 5).
b) Find the y – value when x = 5
c) Find the average rate of change from x = 1 to x = 3
d) Find the average rate of change from x = 2 to x = 4
e) Is the average rate of change a constant for this function? Justify your answer.
Education Time Courseware Inc. Copyright 2014 Page 19
Hw 4 continued
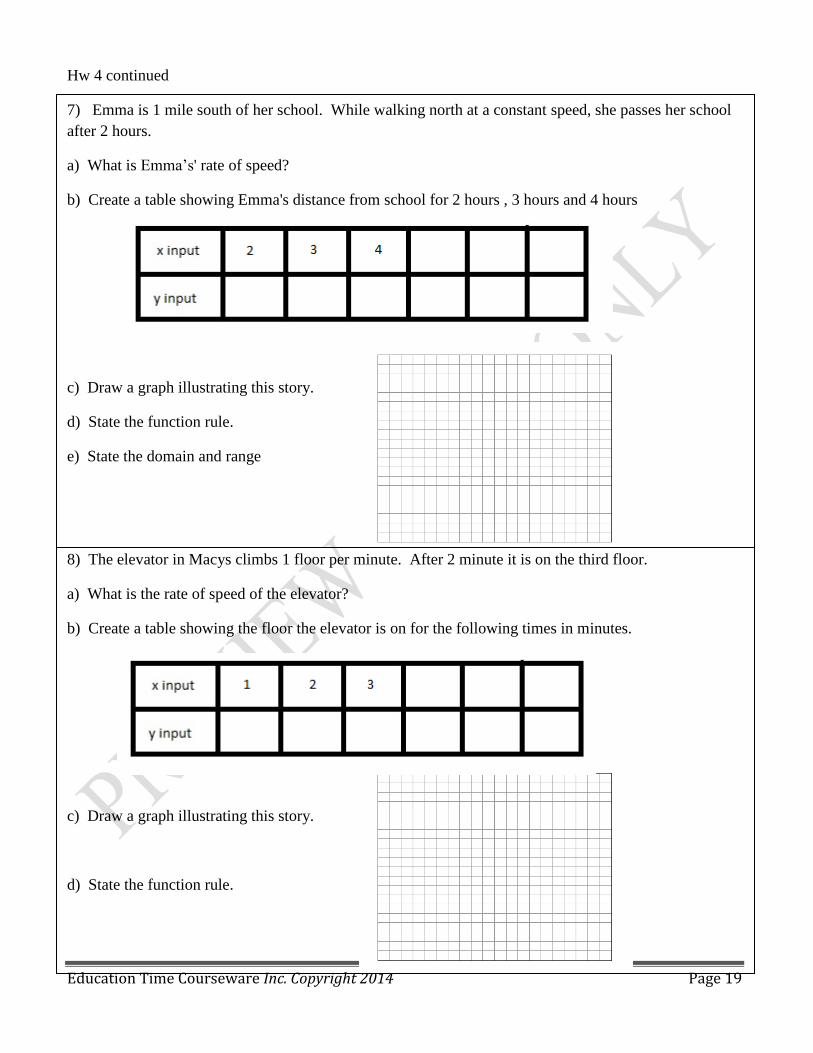
7) Emma is 1 mile south of her school. While walking north at a constant speed, she passes her school
after 2 hours.
a) What is Emma’s' rate of speed?
b) Create a table showing Emma's distance from school for 2 hours , 3 hours and 4 hours
c) Draw a graph illustrating this story.
d) State the function rule.
e) State the domain and range
8) The elevator in Macys climbs 1 floor per minute. After 2 minute it is on the third floor.
a) What is the rate of speed of the elevator?
b) Create a table showing the floor the elevator is on for the following times in minutes.
c) Draw a graph illustrating this story.
d) State the function rule.

Education Time Courseware Inc. Copyright 2014 Page 20
Unit 1 – Analyzing Graphs of Functions
Homework 5: Foundations: Graphs of Exponential Functions (A-CED.2)
1) Graph each of the following exponential functions. State the domain and range for each function.
) 2xa y 1
)2
( )b y x
) 4 2xc y 1
) 42
( )d y x

Education Time Courseware Inc. Copyright 2014 Page 21
Unit 1 – Analyzing Graphs of Functions
Homework 6: Analyzing Exponential Graphs (F-IF.2)
Review
1) A ramp is made in the shape of a right triangle using the dimensions described in the picture below.
The ramp length is 12 feet from the top of the ramp to the bottom, and the horizontal width of the
ramp is 11.5 feet.
A ball is released at the top of the ramp and takes 1.8 seconds to roll from the top of the ramp to the
bottom. Find each answer below to the nearest 0.1 feet/sec.
a. Find the average speed of the ball over the 1.8 seconds.
b. Find the average rate of horizontal change of the ball over the 1.8 seconds.
c. Find the average rate of vertical change of the ball over the 1.8 seconds.

Education Time Courseware Inc. Copyright 2014 Page 22
Hw 6 continued
2) For the new school year, Your High School requires every student to own an iPad. The school hopes
to reduce paper usage by 20% each year. Last year, Your High School used 12,000 pounds of paper.
a) Complete the table and construct a graph to show how paper usage is expected to decrease over the
next 4 years. Be sure to label and mark your axes.
b) Write an equation that shows paper usage ( ) as a function of time in years ( ).
c) In how many years does Your High School expect paper usage to fall below 1000 pounds?

Education Time Courseware Inc. Copyright 2014 Page 23
Unit 1 – Analyzing Graphs of Functions
Homework 7: Two Graphing Stories (F-IF.2,.6,.7)
REVIEW
1) Antwan leaves a cup of hot chocolate on the counter in his kitchen. Which graph is the best
representation of the change in temperature of his hot chocolate over time?
(1) (2) (3) (4)
2) A project’s projected profit is represented by the equation y = - 3x2 + 18x where y is the profit in
millions of dollars and x is the number of months of operation. When will the project show the
maximum profit? When will the project start losing money?
3) Laura and Frank live at opposite ends of the hallway in their apartment
building. Their doors are 60 feet apart. They each start at their door
and walk at a steady pace towards each other and stop when they meet.
Suppose that:
Laura walks at a constant rate of 2 feet every second.
Frank walks at a constant rate of 3 feet every second.
a. Graph both people’s distance from Laura’s door versus time
in seconds.
b. According to your graphs, approximately how far will they
be from Laura’s door when they meet?

Education Time Courseware Inc. Copyright 2014 Page 24
Hw 7 continued
4) Consider the story:
Kay, Jane, and Julie were running at the track. Kay started first and ran at a steady pace of 1 mile every
12 minutes. Jane started 4 minutes later than Kay and ran at a steady pace of 1 mile every 10 minutes.
Julie started 2 minutes after Jane and ran at a steady pace, running the first lap (quarter mile) in 1.75
minutes. She maintained this steady pace for 3 more laps and then slowed down to 1 lap every 3
minutes.
a. Sketch Kay, Jane, and Julie’s distance versus time graphs on a coordinate plane.
b. Create linear equations that represent each girl’s mileage in terms of time in minutes. You will need
two equations for Julie since her pace changes after 4 laps (1 mile).
c) Who is the first person to run 3 miles?
d. Did Jane and Julie pass Kay on the track if they did, when and at what mileage?
e. Did Julie pass Jane on the track if she did when and at what mileage?

Education Time Courseware Inc. Copyright 2014 Page 25
Unit 1 – Analyzing Graphs of Functions
Homework 8: Unit 1 Review
1) Which graph below represents a quadratic function?
2) Which graph does not represent a function?
3) What are the domain and the range of the function shown in the graph below?
1) 2) 3) 4)

Education Time Courseware Inc. Copyright 2014 Page 26
Hw 8 continued
4) On January 1, a share of a certain stock cost $180. Each month thereafter, the cost of a share of this
stock decreased by one-third. If x represents the time, in months, and y represents the cost of the
stock, in dollars, which graph best represents the cost of a share over the following 5 months?
5) a) State the domain and range of the graph.
b) Does the graph represent a function? Explain.
6) Write the inequality 1 2x in integer notation.

Education Time Courseware Inc. Copyright 2014 Page 27
Hw 8 continued
7) Create a graph to represent the following story
A car travelling at 26 mph accelerates to 42 mph in 5 seconds. It maintains that speed for
the next 5 seconds, and then slows to a stop during the next 5 seconds.
8) Which equation is represented by the graph below?
9) Given the relation { ( 8 , 2 ), ( 3 , 6 ), ( 7 , 5 ) and ( k , 4 )}, which value of k will result in the
relation NOT being a function?
1) 1 2) 2 3) 3 4) 4
1)
2)
3)
4)

Education Time Courseware Inc. Copyright 2014 Page 28
Hw 8 continued
10) Which graph represents a relation that is not a function?
1) 2)
3) 4)
11) The Smith family kept a log of the distance they traveled during a trip, as represented by the graph
below.
During which interval was their average speed the greatest?
(1) the first hour to the second hour (2) the second hour to the fourth hour
(3) the sixth hour to the eight hour (4) the eighth hour to the tenth hour

Education Time Courseware Inc. Copyright 2014 Page 29
Hw 8 continued
12) These graphs represent walking trips taken by two friends who leave for the trip at the same time.
The starting distance is how far they are from home. At distance = 0 is the location of their home.
a) Which friend is walking slower in
i) Graph A
ii) Graph B
iii) Graph C
b) In Graph B, what does the intersection point represent?
c) In Graph C, create a story to describe the two trips.
d) In graph D , describe their journey.

Education Time Courseware Inc. Copyright 2014 Page 30
Unit 2 - Algebraic Expressions
Homework 1: Foundations - Signed Numbers (A.SEE.1B, A-SSE.2, A-APR.1)
1) Perform the following operations with signed numbers. (No calculator is suggested)
A) ( +7) + ( +3) B) ( +15) + ( - 12) C) ( - 25) + ( + 18) D) ( - 30) + ( - 12)
E) ( +7) – ( +3) F) ( +15) – ( - 12) G) ( - 25) – ( + 18) H) ( - 30) – ( - 12)
I) +8 + 6 J) 10 + 5 K) 14 – 8 L) - 15 + 8
M) - 20 – 5 N) - 30 – ( - 5) O) - 15 – ( +15) P) -12 + 12
2) Perform the following operations with signed numbers. (No calculator is suggested)
A) ( + 3) ( + 7) B) ( + 12 ) ( - 5) C) ( - 20 ) ( + 6 ) D) ( - 8 ) ( - 9 )
E) 5 12 F) 8 ( - 11) G) - 6 6 H) -12 ( - 10)
I) 72 J) ( - 9 )
2 K) ( + 2 )
3 L) ( - 3 )
3
M) 15
3
N)
28
7
O)
49
7
P)
36
3
Q) 72
12 R)
56
8 S)
39
3
T)
100
25

Education Time Courseware Inc. Copyright 2014 Page 31
HW 1 continued
3) One morning, the temperature was 8° below zero. By noon, the temperature rose 18° Fahrenheit (F)
and then dropped 6° F by evening. What was the evening temperature?
4) Which number line below best represents the addition problem -10 + (-20) =?
1) 2)
3) 4)
5) Jason started his own lawn service. The table below shows the profit or loss each month for four
months. Jason represented profit as positive numbers and loss as negative numbers. How much profit
or loss did Jason have after being in business for four months?
Month June July August September
Profit/Loss - 380 600 - 800 330
1) loss of $250 2) profit of $250 3) loss of $2110 4) profit of $2110
6) Kim states that 6 + (- 4) is the same as 6 - 4.
Do you agree with Kim? Justify your answer.
7) James was observing the number of students entering and leaving the library at school. He observed
12 student leave the library and 9 students entered . Later he observed 4 more students enter the
library and 14 people left. What was the net increase or decrease in the number of students in the
library?

Education Time Courseware Inc. Copyright 2014 Page 32
Unit 2 - Algebraic Expressions
Homework 2: Foundations: Algebraic Expressions /Order of Operation (A-SSE.1B,A-SEE.2)
Review
1) One morning, the temperature was 6°(F) below zero. By noon, the temperature rose 14°
Fahrenheit (F) and then dropped 4° F by evening. What was the evening temperature?
2) Evaluate each of the following
(a) (-6) – (-8) (b) (-4) x (3) (c) 12
2
(d) (-3) + (-5)
3) Find the value of each.
a) 3+2 5 b) 20 30 5 5 c) (12 3)
12 2 2(2 1)
d) 224 6 2(9 6) 6 2 e) 26 3 4 5 f) 2(2 6) 4
8 2(5 3)
g) 212 (2 4) 3 h) 2 24 3 5 i) 3[14 (1 7)]
j) 2 2 2 2(8 6 )(1 5 ) k) 3[6 (5 3)] l) (17 13) (10 25)
m) 6 + 3 5 n) 32 – 4 6 - 3 o) 5 ( 7 – 3 )2 p) 18 3 2 + 4
q) 15 3
4 2
r) 20 – 8 + 5 3 s) 10 3 6 – 1 t) 4( 6 – 2)
2 – 34
v) 7 + 2 5 – 32 + 4 w) ( 10 – 15 )
2 + 18 3
2 – 30 x)
2
2
3(13 9) 2
(3 2)

Education Time Courseware Inc. Copyright 2014 Page 33
HW 2 continued
4) Find the value of the following algebraic expressions if a = 6 , b = 2 and x = -4:
a) a+b+x b) 2a+3b-x c) 3a+5b+2x-1 d) 4ab+5b-x
e) a b
a b
f)
2 7
13
a b g) 3a+5ab-b+x h) 10a-2ab-3b
i) 2 22a ab b j) 1 (2 )2
abx ax x k) 2(a+b) – 3( a-x) l) 22 5 3
2 3
x x
x
5) If 4y , find the value of :
2 2) 2 ) (2 )a y b y
Are the two expressions the same?
Explain your reasoning.
6) If x = 3, find the value of :
2 2) ) ( )a x b x
Are the two expressions the same?
Explain your reasoning.
7) Find the value of 2 29 16x y when
1 1
3 4x and y

Education Time Courseware Inc. Copyright 2014 Page 34
Unit 2 - Algebraic Expressions
Homework 3: –Distributive, Commutative & Associative Properties (A-SEE.1B, A-SEE.2)
Review
1) Find the value of 4xy – y when x = 2 and y = -5
2) Evaluate 24 12 ( 3) 4
3) Match each property to an appropriate expression:
A) Commutative property of addition a) 7 + (-7) = 0
B) Commutative property of multiplication b) 3(2 + 5) = 3 * 2 + 3 * 5
C) Associative property of addition c) 4 * 1 = 4
D) Associative property of multiplication d) Add any 2 elements of the set,
the answer must be in the set.
E) Distributive property of multiplication e) 1
1aa
F) Additive Inverse f) a + b = b + a
G) Multiplicative Inverse g) 3*(2 * 5) = (3 * 2) * 5
H) Additive Identity h) a * 0 = 0
I) Multiplicative Identity i) b + 0 = b
J) Closure Property for Addition j) 3 * (-2) = (-2) * 3
K) Multiplication Property of zero k) (a + d) + x = a + (d + x)
4) Below is a flow diagram to show that (xy)z=(zy)x
State the property that was used for each arrow
#1) ______________________
#2 _______________________
#3 _______________________

Education Time Courseware Inc. Copyright 2014 Page 35
3( 5) (5 4) 5 30
3 15 (5 4) 5 30 ) _________________
3 15 5 (4 5) 30 ) _________________
3 15 5 9 30
3 5 15 9 30 ) _________________
2 24 30
2 6
3
x x
x x a
x x b
x x
x x c
x
x
x
Hw 3 continued
In questions 5 - 10
a) Fill in the box with a value that makes the statement true.
b) Name the property illustrated in the new sentence.
5) 4+3 = 3+
6) 8 x 3 = 3 x
7) (2 x 3) x 4 = 2 x (3 x )
8) 4( a + 3) = 4a +3( )
9) 6 + 0 =
10) 4 x = 1
11) Henry solved the following equation below. Identify the property used to obtain each of the
following steps below.
12) When solving the equation 2 23(2 5) 7 5 4x x , James wrote 2 26 15 7 5 4x x as his first
step. Which property justifies James's first step?
a) addition property of equality b) commutative property of addition
c) multiplication property of equality d) distributive property of multiplication over addition

Education Time Courseware Inc. Copyright 2014 Page 36
Hw 3 continued
13) Fill in each circle of the following flow diagram with one of the letters: C for Commutative
Property (for either addition or multiplication), A for Associative Property (for either addition or
multiplication), or D for Distributive Property
a)
b)

Education Time Courseware Inc. Copyright 2014 Page 37
Unit 2 - Algebraic Expressions
Homework 4: Expressions (A-SSE.1A, A-SSE.1B, A-SSE-2)
Review
1) Explain how 4x + 5x = 9x is an example of the distributive property
2) Below is a flow diagram to show that (a + b) + c = (c +b) + a
State the property that was used for each arrow
#1) ______________________
#2 _______________________
#3 ______________________
3) Identify whether or not each of the following are mathematical expressions. (YES or NO)
A) 4xy + 7 B) 3x2y
5 – 3x C) -6abc
2 + 7a - 3 D) 4x
2 + 5 = 9
E) 3x + 1 > 4 F) 3
5 2
x
y G) 6
12
x H) x
4) Write what the numerical coefficient is and what the variable(s) is(are) in each expression.
A) 5x B) -3y2 C) st
3 D) -xy
5) Write what the base is and what the exponent is in each expression.
A) 73 B) x
4 C) 3y
2 D) (st)
3
E) -42 F) (2y)
4 G) ( -8)
2 H) -5t
5
6) Write how many factors are in the expression and what the factors are in each expression.
A) 7x B) 3rst C) 1
3ab D) 5

Education Time Courseware Inc. Copyright 2014 Page 38
4 6
8 3
6
7
x y
x y
. 3 4 3
. 5
. 7 10
I x y z
II x
III x
Hw 4 continued
7) How many terms are found in each of the following expressions?
A) 5abc B) 5 + x C) 3a – 4b + 5c D) 7x3y
2 + 4
8) Determine the degree and the leading coefficient of each.
A) 3x2 – 4 B) 2x + 1 C) 4x
3 – 5x
2 +2x + 9
D) 9 – 4y2 E) 4 F) 7x
5 + 3y
2 – 2xy + 12
9) is best described as a(n)
1) variable 2) coefficient 3) expression 4) constant
10) What is the coefficient of the squared term? 28 5 3x x
1) 2 2) 3 3) 8 4) 16
11) What is the degree of the following expression? 3 24 5 7 3x x x
1) 1 2) 2 3) 3 4) 6
12) How many terms are in the expression 6 4 25 3 4 7a a a
1) 1 term 2) 2 terms 3) 3 terms 4) 4 terms
13 )Which of the following is an example of a mathematical expression?
1) I only 2) II only 3) III only 4) I and III
Education Time Courseware Inc. Copyright 2014 Page 39
Hw 4 continued
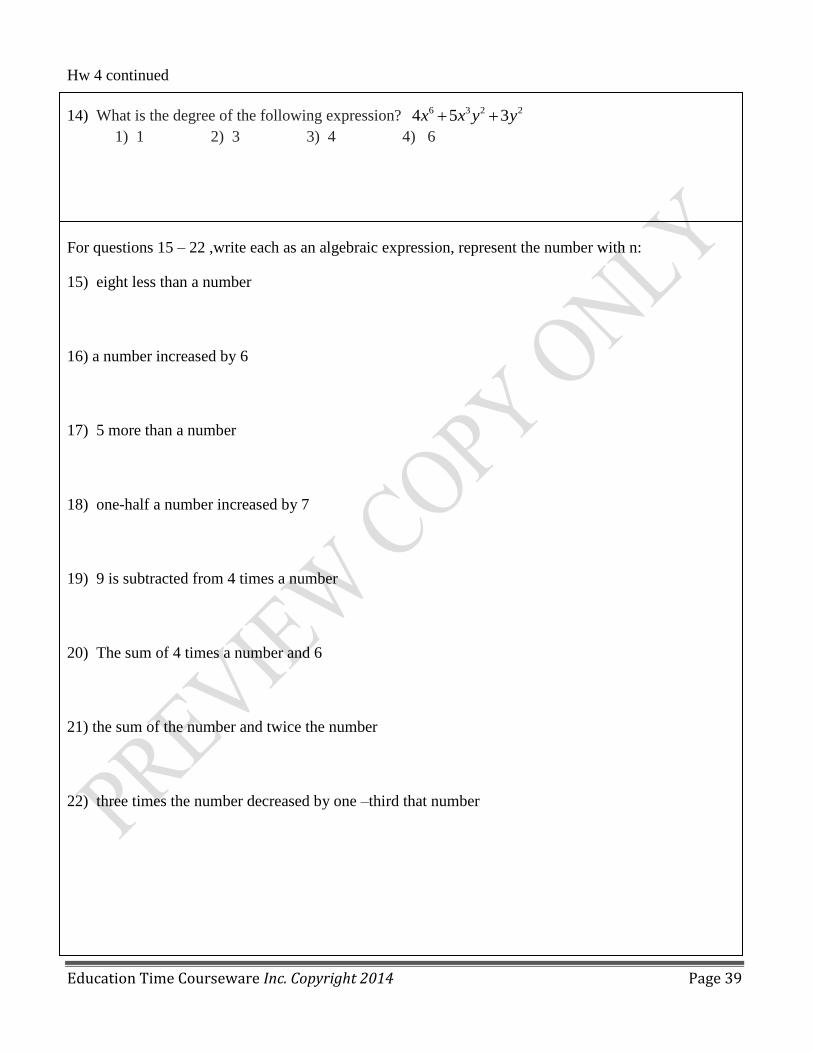
14) What is the degree of the following expression? 6 3 2 24 5 3x x y y
1) 1 2) 3 3) 4 4) 6
For questions 15 – 22 ,write each as an algebraic expression, represent the number with n:
15) eight less than a number
16) a number increased by 6
17) 5 more than a number
18) one-half a number increased by 7
19) 9 is subtracted from 4 times a number
20) The sum of 4 times a number and 6
21) the sum of the number and twice the number
22) three times the number decreased by one –third that number

Education Time Courseware Inc. Copyright 2014 Page 40
3 3 5 2 5 21) 6 2) 90 3) 90 4) 6x y x y x y x y
Unit 2 –Foundations - Algebraic Expressions
Homework 5: Unit 2 Review
1) Write each as an algebraic expression, represent the number with n:
A) Three times a number increased by 2
.
B) Twelve divided by x decreased by 2.
C) Six times the sum of 3 and a number.
D) The product of 5 and n squared.
E) The difference of 6 and the square root of n
2) Find the value of each of the following.
A) If x = - 3 and y = 3, find the value of x2y
3
B) If a = 3 and b = 4 and c = - 5, find the value of 3a – b2 + 2c
2
C) Find the value of 3( )x y
z
, if x = 2, y = 5 and z = -9.
D) Find the value of a + b( a – b)2 – a b, if a = 15 and b = 5.
3) What is the GCF of ?
3 2 518 30x y and x y

Education Time Courseware Inc. Copyright 2014 Page 41
Hw 5 continued
4) If a + b = a, what is the numerical value of b? Justify your answer.
5) If xy = y, what is the numerical value of x? Justify your answer.
6) If ab=0 and a 0 , what is the numerical value of b? Justify your answer
7) Place parentheses to make each statement true.
a) ) 4 3 2 4 5a b) 4 4 4 4 4 4
) 2 2 2 2 2 0c d) 5 5 5 5 5 1
8) Using the digits 1,2,3 and 4, create an expression that evaluates to the following numbers . Only
addition and multiplication are used and each number appears only once. You may use grouping
symbols.
a) 18 b) 20 c) 25
9) Which of the following are examples of the distributive property?
a) 4( 2 + 3) = 4(2) + 4(3) b) 3(x+5) = 3x + 15 c) (a+b)+c=a+(b+c)
d) 5x+10=5(x+2) e) x + y = y + x f) ab +ac = a(b+c)

Education Time Courseware Inc. Copyright 2014 Page 42
Unit 2 –Foundations - Algebraic Expressions
Homework 6: Cumulative Review Questions (Unit 2)
1) Which property is illustrated by the equation ?
(1) associative (3) distributive
(2) commutative (4) identity
2) Which verbal expression represents ?
(1) two times n minus six (3) two times the quantity n less than six
(2) two times six minus n (4) two times the quantity six less than n
3) The statement is an example of the use of which property of real numbers?
(1) associative (3) additive inverse
(2) additive identity (4) distributive
4) What is the additive inverse of the expression x – 3?
(1) x + 3 (2) - x + 3 (3) - x - 3 (4) - ( - x + 3)
5) Which of the following IS a mathematical expression?
(1) 3x – 2 = 9 (2) 2x + 4 > 7 (3) x2 – 3 = y (4) 2x – y + 2
6) In the expression 3xt + 4 (A) what does the t represent? (B)How many terms are in the
expression? (C)What does the x represent? (D) What is the 3 called?
A: B: C: D:
7) Write as a mathematical expression “ Six less than eight plus x”
(1) 6 – ( 8 + x) (2) ( 6 – 8 ) + x (3) ( 8 + x ) – 6 (4) 6 – 8 - x
8) Write the equation from the following word problem. “ Twenty minus a number, then divided by 2
equals seven”
(1) 7 - 2
y= 20 (2)
207
2
y (3) 20 -
2
y= 7 (4)
207
2
y

Education Time Courseware Inc. Copyright 2014 Page 43
9) When solving the equation 2 25(2 5) 7 12 3,x x Jane wrote 2 25(2 5) 12 10x x
as her first step. Which property justifies Jane’s first step?
(1) addition property of equality (2) commutative property of addition
(3) multiplication property of equality (4) distributive property of multiplication over addition
10) An appliance repairman charges $65 per hour for the labor and a $45 service charge just to come
to the site. If c represents the total charges in dollars and h represents the number of hours worked,
which formula can be used to calculate the total charges for the repairman?
(1) c = 65 + 25h (2) c = 65h + 20 (3) c = 45 + 65h (4) c = ( 45 + 65)h
11) Jim found three times the amount of items on a scavenger list as Mary, who found 1
2as many as
Bob found. The three put all of the items together and evenly divided them into two piles. Which
expression shows the number of items (T) in one of these piles?
(1) 3T + T + 1
2T 2 (2) (3T + T +
1
2T) 2
(3)
1 13( )
2 2
2
T T T (4)
1 1
2 3
2
T T T
12) Solve the following expression using x = 2 and y = 7. 3x2 – 2y – 5
(1) 7 (2) – 7 (3) – 27 (4) 17
13) The function f has a domain of {3, 5, 7,9} and a range of {4, 6,8}.
Could f be represented by { (3,4), (5,6), (9,4)}?
Justify your answer.
14) Which statement is not always true?
1) The product of two irrational numbers is irrational.
2) The product of two rational numbers is rational.
3) The sum of two rational numbers is rational.
4) The sum of a rational number and an irrational number is irrational.
15) What is true about the sum of two negative integers? The sum is always
1) zero 2) positive 3) negative 4) zero, positive or negative

Education Time Courseware Inc. Copyright 2014 Page 44
Unit 3 –Polynomials
Homework 1: Addition and Subtraction of Polynomials (A-SSE.2, A-APR.1)
1) Circle the like terms in each expression ( if there are none, write NONE.)
A) x + y + 3 + 4y B) -3a2 + 4b + 3a
2 C) 2 – 3t + x – 4 D) 5x
2 – 3x + 1 – 4x
E) 5abc – 2ab+ 3 abc2 – 5ab
2c F) 3x
2y
2 – 4x
2y + 6xy
2 + 9x
2y + x – 3x
2y
2) Combine like terms in each expression. (NO calculator is suggested)
A) 3x - 7 + 2x - 8 B) 4x2 – 3x + 2 – 6x
2 – 5 C) x
2 + x
3 + x + x
2
D) 5 + 8xy – 3 + 2y E) 3abc – abc + 5ab + 7abc F) x5 + x
5 + x
5 – x
15 + x
15
G) 6a+ 3a -5a H) – 8x – 5x + 12x I) p + 14p – 23p
J) 9x2 + 12x
2 – 7x
2 K) 12xy - 7xy + 15xy L) 32abc
2 – abc
2 -18abc
2
M) 6i – 15i + 3i N) 4 7 + 8 7 - 2 7 O) 8 5 - 5 5 - 10 5
P) 4
5 +
3
5 -
4
5 Q)
6
11 +
4
11
2
11 R)
15
17 -
2
17 -
7
17
Education Time Courseware Inc. Copyright 2014 Page 45
HW 1 continued
3) Simplify the following expressions by combining like terms.
A) Add 3x2 + 4x
2 + 10x
2
B) Add 25a2 + 21a +15 and 30a
2 – 10a -12
C) What is the sum of 8m + 6n, -12m – 3p and 4n – 5p?
D) Combine 8x2 – 5 – 3x – 2x
2 + 8 - 4x – 3 - 5x + x
2
E) From (5x2 – 6x + 13) subtract ( 2x
2 - 8x – 15)
F) Subtract ( 3a2 -5a + 12) from (7a
2 – 6a + 8)
G) Combine ( 7a + 5b – 2c2) – ( 9a - 3b – 5c
2)
4) If 25 7 5A x x and 24 8 5,B x x then find the value of each of the following:
i) A – B ii) B – A iii) A + B iv) B + A
v) Is A + B the same as B + A ? Give a mathematical reason for your answer.
vi) Is A – B the same as B – A ? Give a mathematical reason for your answer.
Education Time Courseware Inc. Copyright 2014 Page 46
Unit 3 –Polynomials Homework 2: Multiplication and Division of Polynomials (A-SSE.2, A-APR.1)
Review
1) Find the sum or difference by simplifying and combining like terms.
5 5 2 2 2 2 2) (4 6 ) 3( 2) ) (4 3 5 ) 2(4 3 ) ) (4 3 ) 4( 1) (4 5)a x x x b a a a a c y y y
d) How much greater than 2 23x xy y is 2 24 9 3x xy y
2) Find the product of each.
A) 4( x + 5) B) 3x( x2 – 2x + 5) C) 2a
2b
3( 5ab
2 – 7a)
D) ( x + 2)( x + 3) E) ( 2x – 5) ( x – 2) F) ( x+ 3) ( x - 3)
G) (3x – 2)( x2 + 4x – 5) H) ( 4x
2 + 3x -1) ( 2x
2 – 4x + 5)
3) State the difference in each question and answer both versions. Are the answers the same?
(i) ( 3x)2 and ( 3 + x)
2 (ii) 2 3(5 )x and ( 5x
3)2 (iii) ( x + 3)
3 and ( 3x)
3
4) If A = 2y + 3 and B = 2y – 5 ,
a) Find A B b) Find B A
c) Why does A B = B A ?

Education Time Courseware Inc. Copyright 2014 Page 47
Hw 2 continued
5) Find the quotient of each.
A) 215 10 5
5
x x B)
5 4 3
3
12 8 4
4
x x x
x
C)
3 2 2 2 221 15 6
3
a b c a b c abc
abc
D) 3( 7)
( 7)
x
x
E)
6( 2)
( 2)
x
x
F)
8( 2)
4( 2)
y
y
6) If the cost of a notebook is represented by 3x-1, express the cost of four notebooks.
7) A plane travels at a rate represented by (x + 70) kilometers per hour. Represent the distance it can
travel in (3x + 1) hours.
8) The cost of a pizza is 30 cents less than 8 times the cost of a soda. If x represents the cost of the soda
in terms of cents,
a) Express the cost of the pizza in terms of x
b) Express in simplest form the cost of 3 pizzas and 5 sodas.

Education Time Courseware Inc. Copyright 2014 Page 48
Unit 3 –Polynomials
Homework 3: Exponents – Review of basic properties (N-RN.1)
Review
1) Use the distributive property to write each as the sum of monomials in simplest form.
2 2) 5 ( 3) ) (3 5) 3 ) ( 3)( 4) ) ( 4) ) ( 2)( 4 5)a x x b x x c x x d a e x x x
2) Simplify each:
a) x5 x2
b) y4 y y3
c) 35 37
d) (2x) 3 (2x)
2
e) 6
2
x
x f)
16
4
y
y g)
9
3
4
4 h)
( )
( )
8
2
3x
3x
i) (3x) 2 j) (2x
2y
3) 3 k)
2
3 42x y
5
l) (-2x5) 3
m) (3x4
y3) (-4x
5 y
3) n)
( )
( )
10 5 7
5 5 9
24a b c
6a b c
o) 2
a 2b p)
x
y
3
3
q)
23x
2
r)
324x y
3a
s) x
y
3a
3a

Education Time Courseware Inc. Copyright 2014 Page 49
Unit 3 –Polynomials
Homework 4: Zero, Negative and Fractional Exponents (N-RN.1)
REVIEW 1) Simplify: 2 4 4
3 2
2x y 6 x z
3z 4 y 2) Simplify
33
2
2x
3y
3) Simplify each: Express all answers with positive exponents where applicable:
a) 30 b) (2x)
0 c) 4x
0 d) 4
-2 e) –2
-3
f) 2x-2
g)
2327 h)
3281 i)
1327
j)
238
k) (3x-2
y3) (5x
5y
-5) l) (4a
3b
-2c
-3)2 m)
5 -2 3
3 4 -2
12r s t
18r s t n)
( ) ( )
( )
2 1 2 3
3 2
5x y 3x
15x y
o) Write 0.0000567 in scientific notation. q) Write 38,200,000 in scientific notation.
4) Rewrite each without negative or fractional exponents. (Simplify if necessary)
A) 1
2x B)
2
3y C) x0 D)
2y E) 1x F)
1
2x
5) Write each as an exponent.
3 5 ?3) ) ) ) 1 ?A x B y C a D if x then

Education Time Courseware Inc. Copyright 2014 Page 50
22 52 3 2 2 3 2 3
2 7
12 1)(4 )(3 ) ) ) (5 ) ( ) d) 27
4 5
a ba x y xy b c x x
a b
Unit 3 –Polynomials
Homework 5: Removing Parentheses (A-APR.1, A-SSE.2)
Review
1) Simplify each using the laws of exponents.
In questions 2 – 12, remove parentheses and if possible combine like terms.
2) 6x+(4x-3) 3) 5a+(-8a-4b)
4) 9c-5g+(3g-4c) 5) (x+6y)+(5x-4y)
6) 28 (2 7 3)x x 7) 4 (3 5) 4 (3 8)a a x
8) 2[4 (3 5) 4]x x 9) 2 2 23 [ 5 (3 4) 5] 6x x x x x
10) 3x-4y+[3x-(3y-4x)]-(5x-8y) 11) 2 3 2 ( 5) 4 ( 3) 5x x x x x x x
12) ( 5)( 4) (x 6)(x 3)x x

Education Time Courseware Inc. Copyright 2014 Page 51
Unit 3 –Polynomials
Homework 6: Modeling (A-SSE.2, A-APR.1)
Review
1) Remove parentheses and if possible combine like terms.
4 4 2) (4 5) 6( 3) ( 4) ) (12 8 ) 3(4 2) ) (3 2)( 5)a x x x b x x x c x x
2) What algebraic expression is represented by this set of algebraic tiles?
3) What algebraic expression is represented by this set of algebraic tiles?
4) What algebraic expression is represented by this set of algebraic tiles?

Education Time Courseware Inc. Copyright 2014 Page 52
2( 3 2 )x y z
HW 6 continued
5) Write the sum represented by the algebraic tiles
6) Simplify 4 3[5 2(3 ) 6 ]x x x x
7) Expand and simplify:
8) Use the geometric picture to represent (x + y)2
Evaluate (x + y)2
9) Consider the expression: ( 1) ( 2)x y x
a. Draw a geometric picture to represent the expression.
b) Write an equivalent expression by applying the Distributive Property

Education Time Courseware Inc. Copyright 2014 Page 53
25 4 2x x 23 2?x x
HW 6 continued
10) Consider the expression : ( 2) ( 1)x y y
a. Draw a geometric picture to represent the expression.
b) Write an equivalent expression by applying the Distributive Property
11) What must be added to in order to get

Education Time Courseware Inc. Copyright 2014 Page 54
Unit 3 –Polynomials
Homework 7: Geometric Applications (A-SSE.2, A-APR.1)
1) Represent the perimeter of a square each of whose sides is represented by
a) 5x + 3 b) 3x – 5
c) 2 3 2x x d) 2 22x xy y
2) The length of a rectangle is 5 more than its width. If x represents the width of the rectangle represent
the perimeter of the rectangle in terms of x
3) The length of a rectangle is represented by 5x – 3 and the width by 4x, represent the area of the
rectangle as a polynomial in simplest form.
4) The measure of the base of a triangle is represented by 4x+3 and the height is 6x, represent the area of
the triangle as a polynomial in simplest form.
5) a) Express the area of the outer rectangle in terms of x.
b) Express the area of the inner rectangle in terms of x.
c) Express the area of the shaded region as a polynomial in simplest form.

Education Time Courseware Inc. Copyright 2014 Page 55
Unit 3 –Polynomials
Homework 8: Unit 3 Review
1) Simplify: 2 2(4 5 8) (2 6)x x x
2) Simplify:
3) Simplify:
4) What must be added to in order to get 27 2 15x x ?
5) From the sum of 2 2 24 7 5 5 8, 4 7 9x x and x x subtract x x .
6)
7) Simplify: 2 22 ( 3w 5 1)w w
8) Simplify: (2 3)(4 1)x x
9) Multiply:
10) If 3 2 4 3 2(2 3 4)( 3) 2 9 14 19 12x x Ax x x x x x , then what is the value of A?
22 6 12x x
( 1)( 3)2 2
x x
3 2( 6 4) (2 5 1)x x x x
[ ( 3)]x x x
4 3Multiply: 3a (2 3 1)a a

Education Time Courseware Inc. Copyright 2014 Page 56

Education Time Courseware Inc. Copyright 2014 Page 57
Hw 8 continued
11) The simplest form of (3 7)(2 1) (5 1)( 3)x x x x is a trinomial with positive coefficients. Find
the trinomial and the sum of the coefficients of the trinomial.
12) If 5 224x y is divided by 2 23 ,x y what is the quotient?
13) Which monomial is equivalent to 3 2(4 ) ?x
14) The expression 6 3
4 5
12
3
x y
x y is equivalent to
15) Consider the expression : ( 1) ( 2)x y y
a. Draw a geometric picture to represent the expression.
b) Write an equivalent expression by applying the Distributive Property
16) a) Express the area of the outer rectangle in terms of x.
b) Express the area of the inner rectangle in terms of x.
c) Express the area of the shaded region as a polynomial in simplest form.
2 22 2 10 8
2 2
4 4) 4 ) ) 4 )
x ya x y b c x y d
y x
5 6 5 6) 8 ) 8 ) 16 ) 16a x b x c x d x

Education Time Courseware Inc. Copyright 2014 Page 58
Unit 3 –Polynomials
Homework 9: Cumulative Review Questions (Unit 3)
1) Simplify -10y7 – 4y
7 (1) 14y
7 (2) -14y
7 (3) 6 (4) -14
2 ) When 3g2 – 4g + 2 is subtracted from 7g
2 + 5g - 1 , the difference is
(1) -4g2- 9g +3 (2) 4g
2 + g + 1
(3) 4g2 + 9g – 3 (4) 10g
2 + g + 10
3) From the sum of 7x2 – 4x + 5 and 2x
2 – 8x - 7 subtract 5x
2 + 2x + 5.
(1) 4x2 - 10x – 7 (2) 4x
2 - 14x + 3
(3) 4x2 - 14x – 7 (4) 14x
2 - 10x + 3
4) Simplify 3p2( p +4) + 5(p
3 – 2p
2 + 3)
(1) 10p5 + 15 (2) 8p
3 + 2p
2 +15
(3) 25p5 (4) 8p
3 – 10p
2 + 27
5) Find the product of (3x – 1)( x + 2)
(1) 3x2 – 2 (2) 4x + 1
(3) 3x2 – 5x – 2 (4) 3x
2 + 5x – 2
6) The length of a rectangle is one more than twice the width. If w represents the width of the rectangle,
which expressions represent the perimeter and the area of the rectangle?
(1) P = 6w +2, A = 2w2 + w (2) P = 4w + 1, A = 2w
2
(3) P = 6w + 2, A = 2w2 (4) P = 4w + 1, A = 2w
2 + w
7) Simplify ( 4x + 5)2
(1) 16x2 + 25 (2) 81x
2
(3) 16x2 + 40x + 10 (4) 16x
2 + 40x + 25

Education Time Courseware Inc. Copyright 2014 Page 59
Hw 9 continued
8) Simplify : 32 +4 18 9
(1) 4 (2) 14
(3) 17 (4) 26
9) Simplify: 4 9
2 3
16
4
x y
x y
(1) 4 x2 y
3 (2) 12 x
2 y
3
(3) 4x2 y
6 (4) 12 x
2 y
6
10) Simplify: 3x5 y
-2 z
-3
(1) 5
2 3
3x
y z (2)
2 3
5
3y z
x
(3) 3(xyz)10
(4) (3xyz)30
11) If 2 25 3 7 and B=-3x +7x+5, then findA x x B A
12) Find the quotient ( x + 2)2 7 10x x
(1) x + 8 (2) x + 5
(3) x2 + 8 (4) x
2 + 5
13) Simplify:
3 2
7 7(5) (5)
(1)
6
7(5) (2)
6
7(25)
(3)
5
7(5) (4)
5
7(25)
14) Simplify: 6 3 3
3
24 18 9
3
x x x
x
(1) 8x3 – 6 +
6
3
x (2) 8x
2 – 6x + 3 (3) 8x
3 – 6 + 3x
6 (4) 8x
3 – 6 + 3x

Education Time Courseware Inc. Copyright 2014 Page 60
2
2
2
2
) 2 5 3 1 64
) 2 5 3 1 70
) 2 5 3 1 48
) 2 5 3 1 52
a
b
c
d
Hw 9 continued
15) Combine the following expression
16) ) Consider the expression : ( 1) ( 1)a b a
a. Draw a geometric picture to represent the expression.
b) Write an equivalent expression by applying the Distributive Property
17) Insert parentheses to make each statement true.
18) Fill in the blanks of this proof showing that ( 3)( 2)x x is equivalent to 2 5 6x x .
Write either “Commutative Property,” “Associative Property,” or “Distributive Property” in each blank.
(x+3)(x+2) = (x+3)x+ (x+3) × 2
= x(x+3)+ (x+3) × 2
= x(x+3)+2(x+3)
= x2 +x×3+2(x+3)
= x2 +3x+2(x+3)
= x2 +3x+2x+6
= x2 + (3x+2x) +6
= x2+5x+6

Education Time Courseware Inc. Copyright 2014 Page 61
Unit 4 –Foundations - Radicals
Homework 1: Add/Subtract Radicals (A-REL.4A, N-RN.2)
1) Identify the rational and irrational numbers.
A) 3.14 B) 25 C) D) 1.37 E) 26 F)3
7 G)
2
3
2) Find the value of each.
A) 81 B) - 121 C) 3 27 D) 3 8 E)9
25 F) 3
125
8
3) Simplify each.
A) 18 B) 75 C) 128 D) 5 28
E) 1
202
F) 4 90 G) 5 24 H) 8 9x
I) 28x J) 2 350x y K) 5 6 927x y L) 3 53 54x y
4) Combine like terms:
A) 6 2 2 5 3 2 5 B) 7 3 9 7 3 3 C) 3 32 9 5 9
D) 4 11 3 11 2 11 5 11x y E) 3 6 7 3 2 6xy xy xy

Education Time Courseware Inc. Copyright 2014 Page 62
6 5
Hw 1 continued
5) Perform the indicated operation and express the result in simplest radical form.
A) 3 8 2 B) C) 3 50 5 18
D) 7 2 18 2 50 E) 24 3 6 4 54 F) 5 12 3 75 147
G)2 23 12a a H) 3 3 12x x I)
12 50 98 72
2
J) 12 3 4 2 25x x x K) 3 350 2 32x x L)
3 3 3 35 16 250x x
6) Express the perimeter of the triangle in simplest radical form.
7) Express the perimeter of the rectangle in simplest radical form.
27 75
8 5
10 5
32
8

Education Time Courseware Inc. Copyright 2014 Page 63
Unit 4 – Foundations - Radicals
Homework 2: Multiplication / Division of Radicals (A-REL.4A, N-RN.3)
Review
1) Perform the indicated operation and express the result in simplest form.
2 1) 4 5 20 ) 18 8 ) 4 27 3 48
3 2a b c x x
2) Perform the indicated operation and express the result in simplest form.
A) (5 3 )(7 2 ) B) (5 8)(3 5) C) (6 12 )(2 6 )x x
D) ( 2 + 3)(5 2) E) (2 5 6)(3 5 4 6) F) ( 12 7)( 12 7)
3) Perform the indicated operation and express the result in simplest form.
A) 2(5 3) B) ( 23 5) C) 50
2 D)
3 48
2
E) 15 56
3 7 F)
12 20 32 45
4 5
G)
30 60 18 15
6 3
4) Find the area of a square whose side is 5 3 .

Education Time Courseware Inc. Copyright 2014 Page 64
Unit 4 – Foundations - Radicals Homework 3: Cumulative Review Questions (Unit 4)
1) What is the quotient of 8.05 × 10⁶ and 3.5 × 10
2 ?
(1) 2.3 × 10³ (2) 2.3 × 10
4 (3) 2.3 × 10
8 (4) 2.3 × 10
12
2) Write a mathematical proof using the associative and commutative properties of the algebraic
equivalency of 2 2 2( )xy x y
3) What is 32
4 expressed in simplest radical form?
(1) 2 (2) 2 2 (3) 8 (4) 8
2
4) Tamara has a cell phone plan that charges $0.07 per minute plus a monthly fee of $19.00. She
budgets $29.50 per month for total cell phone expenses without taxes. What is the maximum number of
minutes Tamara could use her phone each month in order to stay within her budget?
(1) 150 (2) 271 (3) 421 (4) 692
5) Which expression is equivalent to (5x)3
1) 5 2) 4 5 3) 4 5 4) 5 5 5x x x x x x x x x x
6) Which expression is equivalent to (3x2)3 ?
(1) 9x5 (2) 9x
6 (3) 27x
5 (4) 27x
6
7) What must be added to in order to get ?
(1) (2)
(3) (4)
8) Simplify: 5 8
3 2
27
(4 )(9 )
k m
k m
Education Time Courseware Inc. Copyright 2014 Page 65
Hw 3 continued
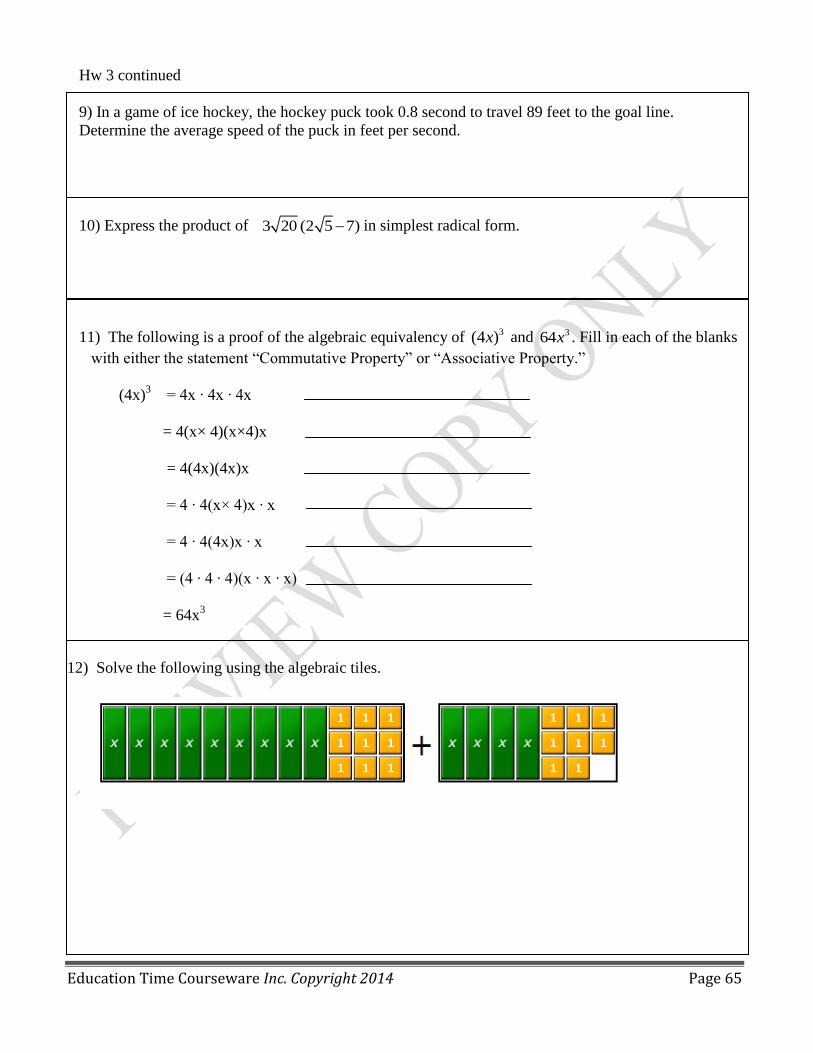
9) In a game of ice hockey, the hockey puck took 0.8 second to travel 89 feet to the goal line.
Determine the average speed of the puck in feet per second.
10) Express the product of 3 20 (2 5 7) in simplest radical form.
11) The following is a proof of the algebraic equivalency of 3(4 )x and 364x . Fill in each of the blanks
with either the statement “Commutative Property” or “Associative Property.”
(4x)3
= 4x ∙ 4x ∙ 4x
= 4(x× 4)(x×4)x
= 4(4x)(4x)x
= 4 ∙ 4(x× 4)x ∙ x
= 4 ∙ 4(4x)x ∙ x
= (4 ∙ 4 ∙ 4)(x ∙ x ∙ x)
= 64x3
12) Solve the following using the algebraic tiles.

Education Time Courseware Inc. Copyright 2014 Page 66
Unit 5 – Solving Equations and Inequalities
Homework 1: Solving Linear Equations (A-CED.1, A-REI.3)
1) Solve and check each equation. State the answer in set notation and graphically.
a) 6b – 20 = 2b b) 5x + 3 = 15 + 2x c) 6x – 4 = 20 – 2x
d) 3x + x – 2 = 7 – 2x e) 18 – x = 4x + 3 f) 4 + 4a = 11a – 6
g) 4( 2x + 6) = 40 h) 3x + 2( 50 – x ) = 110 i) 8 – 4( x – 1 ) = 2 + 3(4 – x)
j) 1
(4 2) 152
x k) 2 (3 1) 3 (2 1) 2x x x x l) ( 2)( 4) ( 10)x x x x
2) One number is 4 times a second number. The sum of the two numbers is 35. Find the smaller
number.
3) The first number is 8 more than a second number. Three times the second number plus twice the first
number is equal to 36. Find the first number.

Education Time Courseware Inc. Copyright 2014 Page 67
Unit 5 – Solving Equations and Inequalities
Homework 2: Foundations: Fractional, Decimal and Literal Equations (A-CED.1, A-REI.1,.3)
Review
1) Solve each and check:
a) 4x – 3 = 17 b) -12 = 5a + 8 c) 3(x + 2) = 15 d) 5y + 2y – 8 = 20
e) 7x – 5 = 5x + 21 f) 5( 2x – 5) = 6x +7 g) 6(x + 2) + 3(2x – 3) = 51
2) Solve each and check.
a) 5 23
x b)
3 25
2 3
x x c)
2 3
5 4 2
x x
d) 1 42
25 10
x e) 3 3
5 2
x f)
4
2 5
x
x
(x ≠ 2)
g) 2 4 5
8 5
x x h)
5 15
3 27x (x ≠ 0) i)
214
3 5
x x
3) Solve each and check.
a) 0.4x+ 12 = 16 b) 0.5a – 3.5 = 5.5 c) 0.06y + 3 = 4.8 d) 0.25x – 2 = 5
Education Time Courseware Inc. Copyright 2014 Page 68
Hw 2 continued
4) Solve for x:
a) 3xyz = 6yz b) 3x + b =13b c) bx = ab + bc
d) ax + bx = c e) 3(x-2a) = 24a f) 3(x – a ) = 4(x – 2a)
5) Solve for a in terms of b: 2a – 3b = 5b
6) Solve for x in terms of a,b and c: ax – c = b
7) Solve for h in terms of V, l and w: V = lwh
8) Solve for h in terms of A and b: 2
bhA

Education Time Courseware Inc. Copyright 2014 Page 69
Unit 5 – Solving Equations and Inequalities
Homework 3: True and False Equations (A-CED.1, A-REI.1,.3)
Review
1) Solve for x :
a) 5x – 9 + 4x = 5 – 3x – 12 b) ( 4)( 5) ( 2)( 4)x x x x
2) Find the value of C if F = 12, using the formula 5
( 32)9
C F
3) Given the equation 3 3x x , where x represents a real number .
a) Is this statement a number sentence ?
b) If it is a sentence , is it true or false?
c) For what value(s) of x is the equation true?
4) Given the equation 5 5x x , where x represents a real number .
a) Is this statement a number sentence ?
b) If it is a sentence , is it true or false?
c) For what value(s) of x is the equation true?
5) Given the equation 25 5x x , where x represents a real number .
a) Is this statement a number sentence ?
b) If it is a sentence , is it true or false?
c) For what value(s) of x is the equation true?

Education Time Courseware Inc. Copyright 2014 Page 70
2( 5) 3 12x x
Unit 5 – Solving Equations and Inequalities
Homework 4: Applications /Fractional Equations (A-CED.1, A-REI.1,2,.3)
1) Determine which of the following equations have the same solution set by recognizing properties,
rather than solving.
9) 3 2 9 4 ) 9 6 12 27 ) 9x 6 ) .5 0.75 2.25
4a x x b x x c x d x x
2) Solve the equation for 𝑥. For each step, describe the operation and/or properties used to convert the
equation.
3) Consider the equation 6 3 4x x
a. Show that adding 𝑥 + 3 to both sides of the equation does not change the solution set.
b. Show that multiplying both sides of the equation by 𝑥 + 3 adds a second solution of 𝑥 = −3 to the
solution set.

Education Time Courseware Inc. Copyright 2014 Page 71
Hw #4 continued
4) Find the value(s) of x that make each of the following expressions undefined.
5) Rewrite each equation into a system of equations excluding the value(s) of 𝑥 that lead to a
denominator of zero; then, solve the equation for 𝑥.
6) Given the formula d
rt
,
a) find the value of d when r=36 and t =9
b) rearrange the formula to solve for d
1 3 1) ) )
4 2
2 1 1) ) )
5 2 1 ( 3)
xa b c
x x x
xd e f
x x x x
5 1) 4 ) 2
1 3
2 4 6 3) 3 )
2 3 1 4
x xa b
x x
xc d
x x

Education Time Courseware Inc. Copyright 2014 Page 72
Hw #4 continued
7) The area of a rectangle is 36 in2. The formula for area of a rectangle is A =lw
a) If the width w is 8 inches, what is the length?
b) If the width w is 12 inches, what is the length?
c) Rearrange the area formula to solve for l
8) If
9) If the formula for the perimeter of a rectangle is 2 2P l w then w can be expressed as
10) If ,a ar b r the value of a in terms of b and r can be expressed as
11) If ,ey
k tn what is y in terms of e,n,k, and t
3 , then x equals
(1) 3 (2) 3
(3) (4)3 3
ax b c
c b a c b a
c b b c
a a
2 2(1) (2)
2 2
2(3) (4)
2 2
l P P lw w
P l P ww w
l
1(1) 1 (2)
1(3) (4)
1
b b
r r
b r b
r r b
(1) (2)
( ) ( )(3) (4)
tn k tn k
e e
n t k n t k
e e

Education Time Courseware Inc. Copyright 2014 Page 73
) 150 ) 150 ) 85 50 150 ) 85 50 150a e c b e c c e c d e c
Unit 5 – Solving Equations and Inequalities
Homework 5: Foundation: Inequality Expressions (A-CED.1, A-REI.1,.3)
1) Frank’s mother said the cost of his lunch of a hamburger, h, French fries, f, and a soda, s, together
must be less than $7. Write an inequality to represent this relationship.
) 7 ) 7 ) 7 ) 7a h s b h f s c h s f d h f s
2) A certain rectangle has a perimeter of at least 60. Given l represents the length of the rectangle
and w represents the width, select the inequality which represents this situation.
) 2 2 60 ) 2 2 60 ) 60 ) 60a l w b l w c l w d l w
3) A company manufactures two types of shoes, one expensive and one cheap. The company decides
that to make a profit they must manufacture at least 150 pairs of shoes. The expensive shoes cost $85 a
pair and the cheap ones cost $50. If e represents the number of expensive shoes produced
and c represents the number of cheap shoes produced, then which inequality represents this situation?
4) If a + b is less than c + d, and d + e is less than a+ b, then e is
a) less than d b) less than c c) greater than d d) equal to c
5) Six more than twice a number y is at least four times the number. Which of the following inequalities
best represents this information?
) 6 2 4 ) 6 2 4 ) 2 6 4 ) 2( 6) 4a y b y y c y d y y
6) If a, b, c and d are real numbers, c d , e > b, b > a and e c , then which of the following has the
greatest value.
a) a b) b c) c d) d

Education Time Courseware Inc. Copyright 2014 Page 74
Unit 5 – Solving Equations and Inequalities
Homework 6: Foundations: Inequality Word Problems (A-CED.1, A-REI.1,.3)
1) Students in a school measured their heights, h, in centimeters. The height of the shortest student was
145 cm and the height of the tallest was 175 cm. Which inequality represents the range of the heights?
(1) 145 ≤ h ≤ 175 (2) 145 < h < 175 (3) h > 145 or h < 175 (4) h ≥145 or h ≤ 175
2) Which inequality is a correct translation of “ Ten less than four times a number is greater than 19”.
(1) 10 – 4n > 19 (2) 10 – 4n < 19 (3) 4n – 10 > 19 (4) 4n – 10 < 19
3) Which ordered pair is in the solution set of the following system of inequalities?
y ≥ -2x + 4 (1) (0,0) (2) (1,1) (3) (2,2) (4) (-1,-1)
x – y < 1
4) The set { 5,6,7,8} is equivalent to
(1) {x | 5 < x < 8, where x is a whole number}
(2) {x | 4 < x < 8, where x is a whole number}
(3) {x | 4 < x ≤ 8, where x is a whole number}
(4) {x | 5 < x ≤ 8, where x is a whole number}
5) Which value of x is in the solution set of 3
6 182
x ?
(1) 6 (2) 8 (3) 10 (4) 12
6) Which quadrant would be completely shaded in the graph of y ≥ 2x?
(1) Quadrant I (2) Quadrant II (3) Quadrant III (4) Quadrant IV
7) Which interval notation represents the set of all numbers greater than or equal to 2 and less than 10?
(1) ( 2, 10) (2) ( 2, 10] (3) [2, 10) (4) [2,10]
8) Find the solution set for the following inequality. -2( x – 3) < 8

Education Time Courseware Inc. Copyright 2014 Page 75
Unit 5 – Solving Equations and Inequalities
Homework 7: Solving Inequalities (A-CED.1, A-REI.1, A-REI.3)
Review:
1) Determine which of the following equations have the same solution set by recognizing properties,
rather than solving.
a) 3x + 5 = 12 – 7x b) 15 + 9x = -21x + 36
c) 7
4(3 5) 34
xx d) 0.6 1.0 2.4 1.4x x
2) Find the solution set of each. Express the solution in set notation and graphically on a number line.
a) 3x – 5 < 16 b) 4x – 3 > x + 21 c) 5( y – 2) ≤ 3y – 4
d) 5 – 3x ≥ 2x – 30 e) -3(x – 2) < 2(x -2) f) -4x + 1 > 9
g) If y is an integer, what is the solution set of -3 ≤ y < 1?
(1) { -3, -2, -1, 0, 1} (2) { -3, -2, -1, 0}
(3) { -2, -1, 0, 1} (4) { -2, -1, 0 ,1 }
3) Six more than 4 times a whole number is less than 60. Find the maximum value of the number.
4) Jane weighs 3 times as much as Barbara. The sum of their weights is less than 160 pounds. Find the
greatest possible weight for each girl if their weights are whole numbers.
5) Three times a number increases by 8 is at most 40 more than the number. Find the greatest value of
the number.

Education Time Courseware Inc. Copyright 2014 Page 76
Unit 5 – Solving Equations and Inequalities
Homework 8: Inequalities Joined by “AND” or “OR” (A-CED.1, A-REI.1,.3)
Review:
1) Find the solution set of each. Express the solution in set notation and graphically on a number line.
a) 2 5 7x b) 4 2(5 3)x x c) 10 20 10(3 4)x x
2) Solve each compound inequality for 𝑥 and graph the solution on a number line.
b) 2 1 11 4 3 5 2x or x x
) 3 4 7d x
3) State whether the following statements is sometimes, always or never true and justify your answer.
a) If x < y, then x + a < y + a
b) If x < y, then x – a > y – a
c) if x < y then ax < ay
d) If x<y, thenx y
a a
) 4 2 12 8 4 16a x or x
) 3 2 5 11e x
) 4 2 4c x
1) 3 5
2
xf

Education Time Courseware Inc. Copyright 2014 Page 77
Unit 5 – Solving Equations and Inequalities
Homework 9: Unit 5 Review
1) Olivia solved the linear equation as follows:
She made an error between lines
a) 1 and 2 b) 2 and 3 c) 3 and 4 d) 4 and 5
2) Solve for x:
3) Solve for g:
4) Solve algebraically for x:
5) Which value of x is the solution of the equation ?
1) 1
2) 2
3) 6
4) 0
6) What is the value of x in the equation ?
1) 2) 2
3)
4)
4( 3) 2 15x [Line1] 4( 3) 2 15
[Line2] 4(x 3) 17
[Line3] 4 3 17
[Line4] 4 14
14 1[Line5] 3
4 2
x
x
x
x or

Education Time Courseware Inc. Copyright 2014 Page 78
Hw # 9 continued
7) Which inequality is represented in the graph below?
1) 2) 3) 4)
8) Solve each compound inequality for 𝑥 and graph the solution on a number line.
9) A formula used for calculating velocity is 21.
2v at What is a expressed in terms of v and t?
10) Rewrite each equation into a system of equations excluding the value(s) of 𝑥 that lead to a
denominator of zero; then, solve the equation for 𝑥.
) 6 4 14 6 4 14a x or x ) 2 5 9b x
2
2
2 2(1) (2)
(3) (4)2
v va a
t t
v va a
t t
1 10) 5 ) 5
3
xa b
x x

Education Time Courseware Inc. Copyright 2014 Page 79
Unit 5 – Solving Equations and Inequalities
Homework 10: Cumulative Review Questions (Unit 5)
1) If p = 2(l + w), which of the following is the solution for l in terms of p and w?
(1) 2
2
p wl
(2)
2
p wl
(3) l = p – w (4) l = 2p – w
2) Solve for x: 1 2 7
3 3x x (1) 1 (2) 2 (3) 3 (4) 4.5
3) Which value of x is in the solution set of the inequality -2x + 5 > 17?
(1) -8 (2) -6 (3) -4 (4) 12
4) Mark currently has collected 65 rare coins. If he buys c coins for w weeks, which expression
represents the total number of coins that he will have?
(1) 65cw (2) 65 + cw (3) 65c + w (4) 65 + c + w
5) What is the solution of 4 9
2 3
k k ?
(1) 1 (2) 5 (3) 6 (4) 14
6) If 3ax + b = c, then x equals
(1) c – b + 3a (2) c + b - 3a (3) 3
c b
a
(4)
3
b c
a
7) Solve for g: 3 + 4g = 5g – 9

Education Time Courseware Inc. Copyright 2014 Page 80
22 3 9 1 1 2
3 3 6
4(5 8) 4 5 8
Hw 10 continued
8) Simplify: (25t2v + 20tv – 7t) – (14t
2v – 11t)
9) Write the algebraic equation or inequality that represents the following situations.
a) The distance d of an object is one half the product of the gravitational constant g and the square
of the time t.
b) The sum of a number n and its reciprocal is less than 16.
10) Solve for c in the following equation: ( )
2
a b cS
11) Identify which of the following are algebraic expressions. Are they also number sentences?
a) 4x-5=12 b) 2x2+5x c) d)
12) Determine whether the following number sentences are true or false.
40
) 12 8 )2
a b 2 2 23 4 5 c) 2
.6673 d)
13) In the following equations, let x = -4 and y = 34
. Determine whether the following equations
are true, false or neither true nor false.
a) xy = -3 b) x - 4y = -7 c) 8y = -2x d) x + z = 6
14) The function f has a domain of {2,4,6,8} and a range of {1,3,5}.
Could f be represented by {(2,1), (4,3), (6,5), (8,3)}?
Justify your answer.

Education Time Courseware Inc. Copyright 2014 Page 81
Unit 6 – Solution Sets to Equations with Two Variables
Homework 1: Foundations: Verbal Problems (A-CED.1, A-CED.2, A.REI.3)
1) The ratio of 3 numbers is 2:3:5 and the sum of all three numbers are 180. Find the three numbers.
2) The larger of two integers is 4 times the smaller. If the sum of the two integers is 70, find both
integers.
3) The sum of three consecutive integers is 30. Find the largest integer.
4) One more than three times x is less than 22. Find the greatest integer for x.
5) Carlos has a total of 84 coins consisting of just nickels and dimes. The total value of the coins is
$7.15. How many dimes does he have?
6) Jack has $1.55 in nickels and dimes. He has 7 more nickels than dimes. Find the number of dimes.
7) Joy has 16 coins, some quarters and the rest nickels. The value of all her coins is $1.40. Find the
number of each kind of coin.
8) Karen and Mark left from the same place at the same time and drove in opposite directions along a
straight road. Mark traveled 15 miles per hour faster than Karen. After 3 hours they were 315 miles
apart. Find the rate at which each traveled.

Education Time Courseware Inc. Copyright 2014 Page 82
Hw 1 continued
9) Two trains leave a station, one traveling north at a rate of 50 m.p.h. and the other south at the rate of
55 m.p.h.. In how many hours will they be 735 miles apart?
10) How fast did a car go to overtake a truck in 5 hours if the truck travels at 30 M.P.H. and left 3 hours
before the car?
11) Josh earns $8.00 an hour when he works on Monday. If he works any other day, he earns $12.00 an
hour. During the last week, Josh worked a total of 46 hours and made $528. How many hours did he
work on Monday?
12) There were 580 admission tickets sold. There were 3 times as many 50 cent tickets sold as 25 cent
tickets. Find the number of each.
13) Mr. George is 3 times as old as his son. In 12 years he will be twice as old. Find Mr. George’s age
now.
14) Ashley is 6 years older than Amy. In 2 years Ashley will be twice as old as Amy. Find their ages
now.
15) How many pounds of coffee worth $1.54 a pound should be blended with coffee worth $1.70 a
pound to make 40 pounds of blended coffee worth $1.60 a pound?

Education Time Courseware Inc. Copyright 2014 Page 83
Hw 1 continued
16) Peter has a cell phone plan that charges a monthly fee of $15.00 per month for on-line usage plus a
$.05 per minute charge for any minutes over 300 minutes. What is the maximum number of minutes
Peter can use to stay within his budget of $24.00 for on-line usage?
17) The length of a rectangular room is 9 less than four times the width, w, of the room.
a) Represent the length of the room in terms of w.
b) Represent the area of the room in terms of w.
c) Represent the perimeter of the room in terms of w.
18) The ages of 3 sisters are consecutive odd integers. Four times the age of the youngest sister exceeds
the oldest sister by 23 years. What is the age of the youngest sister?
19) Marie ran a distance of 450 meters in 1
42
minutes. What was her speed in meters per hour?
20) Tom has 7 more books than John. Gary has twice as many books as Tom. If n represents the
number of books that John has, write an expression in terms of n, for the number of books that Gary
has.
21) Juan and Debbie each earn $9 per hour at their jobs. Debbie worked five hours more than Juan
during the week. If Juan and Debbie earned a total of $765 for the week, how many hours did
Debbie work?

Education Time Courseware Inc. Copyright 2014 Page 84
Unit 6 – Solution Sets to Equations with Two Variables
Homework 2: Foundations: Graphing Linear Functions (F-IF.2)
1) Graph each of the following using the table method. Show at least 4 sets of points for each.
a) 3
42
y x b) 2 3 6x y
x y
c) 3( 1)y x d) 8.5 2y x
e) 2 4x y f) 2y

Education Time Courseware Inc. Copyright 2014 Page 85
Unit 6 – Solution Sets to Equations with Two Variables
Homework 3: Graphs of Linear Equations (A-CED.1, A-CED.2, A.REI.3)
Review:
1) Graph 2 3 1y x 2) Graph 2 3 6x y
3) a) Find five members of the solution set of the sentence 3x + y = 8.
b) Create a graph that represents a solution set to the equation.
4) The difference of two numbers is 5. What are the possible numbers?
a) Create an equation using two variables to represent this situation. Be sure to explain the meaning of
each variable.
b) List at least 6 solutions to the equation you created in part (a).
c) Create a graph that represents the solution set to the equation.

Education Time Courseware Inc. Copyright 2014 Page 86
Hw 3 continued
5) John has 25 coins, some are nickels and the rest are dimes. What are the possible number of nickels
and dimes.
a) Create an equation using two variables to represent this situation. Be sure to explain the meaning of
each variable.
b) List at least 6 solutions to the equation you created in part (a).
c) Create a graph that represents the solution set to the equation.
6) The Math Club sells hot dogs at a school fundraiser. The club earns $120 and has a combination of
five-dollar and one-dollar bills in its cash box. Possible combinations of bills are listed in the table
below.
Number of five-dollar bills Number of one-dollar bills Total = $120
12 60 5(12) + 1(60) = 120
16 40
13 55
2 110
a. Find one more combination of ones and fives that
totals $120.
b. The equation 5𝑥 + 1𝑦 = 120 represents this situation.
Graph the line = −5𝑥 + 120 . Verify that each
ordered pair in the table lies on the line.
c. What is the meaning of the variables (𝑥 and 𝑦) and the
numbers (1, 5, and 120) in the equation 5𝑥 + 1𝑦 =120?

Education Time Courseware Inc. Copyright 2014 Page 87
Unit 6 – Solution Sets to Equations with Two Variables
Homework 4: Foundations–Graphs of Simultaneous Equations (A-REI.6, A-REI.10, F-IF.1)
Review
1) If the point lies on the line represented by the equation , the value of k is
(1) 1 (2) 2 (3) -1 (4) -2
2) The sum of two numbers is 8. What are the possible numbers?
a) Create an equation using two variables to represent this situation. Be sure to explain the meaning of
each variable.
b) List at least 6 solutions to the equation you created in part
(a).
c) Create a graph that represents the solution set to the equation.
3) On the given set of axes, solve the following system of equations graphically. State the coordinates
of the solution.
) 6
10
b y x
x y
) 4
2
a y x
x y

Education Time Courseware Inc. Copyright 2014 Page 88
Hw 4 continued
4) On the given set of axes, solve the following system of equations graphically. State the coordinates of
the solution.
) 4 3 11
2 1 5
b x y
x y
) 5 3
3 2 8
a x y
y x
) 0
2
c x y
y x
) 5 2 7
3 5
d x y
x y
) 2 6 7
5 4 8
e x y
x y
) 2 5 3 0
6 2 0
f x y
x y

Education Time Courseware Inc. Copyright 2014 Page 89
Unit 6 – Solution Sets to Equations with Two Variables
Homework 5: Simultaneous Equations Algebraically (A-REI.6,12)
Review:
1) On the grid, solve the system of equations graphically for x and y. y = -2x – 1
4x – 2y = 18
2) A system of equations is graphed on the set of axes below. The solution of this system is
(1) ( 0 , 4 )
(2) ( 2 , 4 )
(3) ( 4 , 2 )
(4) ( 8 , 0 )
3) Solve the following system of equations algebraically using the elimination method.
) 12
4
a x y
x y
) 3 10
4 11
b x y
x y
) 5 3 39
3
c x y
x y
) 12 9 21
10 6 10
d a b
a b
) 5 3 12
8 2 8
e x y
x y
) 3 2 10
4 5 18
f x y
x y

Education Time Courseware Inc. Copyright 2014 Page 90
Hw 5 continued
4) Solve the following system of equations algebraically using the substitution method.
5a) Without graphing, construct a system of two linear equations where (0,1) is a solution to the first
equation but not to the second equation and where (2, 3) is a solution to the system.
5b) Graph the system and label the graph to show that the system you created in part (a) satisfies the
given conditions.
)
6
a y x
x y
) 6
4 3 27
b y x
y x
) 1
4 19
c y x
y x
) 2 3 7
3 2 4
d x y
x y
2)
3
5 34
e y x
y x
) 2
3 2 21
f y x
y x

Education Time Courseware Inc. Copyright 2014 Page 91
Hw 5 continued
6) Consider two linear equations. The graph of the first equation is shown. And a table of values
satisfying the second equation is given. What is the solution to the system of the two equations?
7) For each question below, provide an explanation or an example to support your claim.
a) Is it possible to have a system of equations that has no solution?
b) Is it possible to have a system of equations that has more than one solution?
8) Solve the following system of equations first by graphing and then algebraically.
X value -2 -1 0 1 2
Y value 4 2 0 -2 -4
3 4 3
12 2 5
x y
x y

Education Time Courseware Inc. Copyright 2014 Page 92
Unit 6 – Solution Sets to Equations with Two Variables
Homework 6: System of Inequalities (A-REI.6, A-REI.12)
Review:
1) Solve the following system of equations first by graphing and then algebraically.
2) Graph the solution set for the inequality 4x – 3y > 9 on the set of axes below. Determine if the point
(1, -3) is in the solution set. Justify your answer.
3) Which ordered pair is in the solution set of the system of linear inequalities graphed?
(1) ( 1, -4) (2) ( -5, 7) (3) (5 , 3) (4) ( -7 , -2)
2( 4) 3( 2)
4( 2) 5( 2)
x y
x y

Education Time Courseware Inc. Copyright 2014 Page 93
Hw 6 continued
4) On the set of axes, graph the following system of inequalities and state the coordinates of a point in
the solution set.
) 1
1
a y
y x
) 2
3
b y x
y x
2) 2
3
4
c y x
x y
) 2 6
2
d x y
y x
) 3
3
0
e y x
y x
y
) 2
2
0
f y x
y x
x

Education Time Courseware Inc. Copyright 2014 Page 94
Unit 6 – Solution Sets to Equations with Two Variables
Homework 7: Applications of Systems (N-Q.1, A-SSE.1A,A-CED1,2,3)
Review:
1) Explain a way to create a new system of equations with the same solution as the original
that eliminates variable 𝒚 from one equation, and then determine the solution.
ORIGINAL SYSTEM NEW SYSTEM SOLUTION
2) The sum of two numbers is 32 and their difference is 4. What are the numbers?
a) Create a system of two linear equations to represent this problem.
b) What is the solution to the system?
3) The difference between two numbers is 24 and their sum is 48. Find the two numbers
a) Create a system of two linear equations to represent this problem.
b) What is the solution to the system?
4) If 2 3 8 2 3x y and x y , then find the value of
) 3 ) 5a x y b x y
5 3 12
2 8
x y
x y

Education Time Courseware Inc. Copyright 2014 Page 95
Hw 7 continued
5) Solve the system of equations: by graphing.
Then, create a new system of equations that has the same
solution. Show either algebraically or graphically that the
systems have the same solution.
6) Without solving the systems, explain why the following systems must have the same solution.
7) George and Tim together weigh 210 pounds. The difference between three times George’s weight
and twice Tim’s weight is 30 pounds. Find the weight of each.
8) There are 242 admissions tickets sold. Three times the number of 50 cent tickets is 12 more than four
times the number of 75 cent tickets. Find the number of 50 cent tickets sold.
22 3
3y x and y x
systemi 5 -3 system ii 15 3 -9
2 -3 -8 7 2 11
x y x y
x y x y

Education Time Courseware Inc. Copyright 2014 Page 96
Hw 7 continued
9) A 20 acre orchard is planted with apple and peach trees. At most $10 000 can be spent on planting
costs. Planting cost for apple trees is $400/acre and for peach trees $1000/acre.
a) What are the variables?
b) Write inequalities for the constraints.
c) Graph and shade the solution set.
.
10) Ace Wheels Co. manufactures BMX and Mountain bikes. The plant equipment limits both kinds that
can be made in one day. The limits are as follows:
No more than 10 BMX bikes
No more than 15 mountain bikes
No more than 20 total
a) What are the variables?
b) Write inequalities for the constraints.
c) Graph and shade the solution set.

Education Time Courseware Inc. Copyright 2014 Page 97
Unit 6 – Solution Sets to Equations with Two Variables
Homework 8 - Rates and Algebra Solutions (N-Q.1, A-SSE.1A, A-CED.1, .2, .3)
Review:
1) If 2 2
17 4,a b and a b find
a b
2) The difference between two numbers is 4. Twice the larger number is equal to three times
the smaller number increased by 2. Find the two numbers
a) Create a system of two linear equations to represent this problem.
b) What is the solution to the system?
3) Solve each of the following for x
4) Solve the following problem first using a tape diagram and then using an equation:
a) In the gymnasium at school, there are 300 students. The ratio of boys to girls is 3:2. Find the number
of boys and girls in the gymnasium.
b) In the computer class, the number of boys is 3 times greater than of girls. If there are 60 female
students, how many boys are in the class?.
c) Two numbers are in the ratio 3:7. The smaller number is 12 less than the larger number. Find the
numbers.
5 1) )
4 12 3 8
5 4 4 21) )
2 2
x xa b
x
xc d
x x x

Education Time Courseware Inc. Copyright 2014 Page 98
Unit 6 – Solution Sets to Equations with Two Variables
Homework 9 - Unit 6 Review
1) A taxi ride costs 45 cents for the first mile and 25 cents for each succeeding mile. Write a formula for
the cost, , in cents, of riding miles where is an integer greater than 1.
2) A jogger observed children and dogs playing in a park. The jogger counted 12 heads and 30 legs. How
many children and how many dogs were playing in the park? Show how you arrived at your answer.
3) Frank has 28 coins. Some are nickels and some are dimes. The sum of the number of nickels and 3
times the number of dimes is 40. Find the number of nickels and dimes.
4) Robert bought 8 dollars’ worth of 6 cent stamps and 8 cent stamps. He has a total of 110 stamps.
Find how many of each stamp he has.
5) Olive is on vacation in New York City. One day she
decides to rent a bike. Power Cyclers charges $20
plus $3.50 per mile. Manhattan Cyclers charges $14
plus $5 per mile.
a) Write a cost equation for each bike rental in terms of
the number of miles.
b) Graph both cost equations.
c) For what trip distances should a customer use Power
Cyclers?
d) For what trip distances should a customer use
Manhattan Cyclers? Justify your answer algebraically and show the location of the solution
on the graph.

Education Time Courseware Inc. Copyright 2014 Page 99
Unit 6 – Solution Sets to Equations with Two Variables
Homework 10: Cumulative Review Questions (Unit 6)
1) When solving the equation 2 24(2 5) 7 3 14x x , John wrote 2 24(2 5) 3 7x x as his first
step. Which property justifies James's first step?
a) addition property of equality b) subtraction property of equality
c) multiplication property of equality d) distributive property of multiplication over addition
2) If 2ax - 3b = 5c, then x equals
(1) 5 3
2
c b
a
(2)
3 5
2
b c
a
(3) 5c + 3b – 2a (4)
5 3
2
c b
a
3) Which equation represents a line parallel to the x – axis?
(1) x = 5 (2) y = 10 (3) x = 1
3y (4) y = 5x + 17
4) Which graph does not represent a function?
(1) (2) (3) (4)
5) Which inequality is represented by this graph?
(1)
(2)
(3)
(4)

Education Time Courseware Inc. Copyright 2014 Page 100
Hw 10 continued
6) What is the solution of 5 10
2 3
a a ? (1) 3 (2) 5 (3) 8 (4) 10
7) On a certain day in Toronto, Canada, the temperature was 15 Celsius (c). Using the formula
F = 9
325
C , Peter converts this temperature to degrees Fahrenheit (F). Which temperature represents
15C in degrees Fahrenheit?
(1) -9 (2) 35 (3) 59 (4) 85
8) Which value of x is in the solution set of the inequality -3(x + 2) < 6?
(1) -12 (2) -6 (3) -4 (4) -3
9) Maureen tracks the range of outdoor temperatures
over three days. She records the following information.
Express the intersection of the three sets as an
inequality in terms of temperature, t
10) On the set of axes, graph the following system of inequalities and state the coordinates of a point in
the solution set.
2x – y ≥ 6
x > 2

Education Time Courseware Inc. Copyright 2014 Page 101
Hw 10 continued
11) Victor takes 2 pages of notes during each hour of class. Write an equation that shows the
relationship between the time in class h and the number of pages p.
12) During a 45-minute lunch period, Albert (A) went
running and Bill (B) walked for exercise. Their
times and distances are shown in the
accompanying graph. How much faster was
Albert running than Bill was walking, in miles per
hour?
13) If the value of dependent variable y increases as the value of independent variable x increases, the
graph of this relationship could be a
a) horizontal line b) line with a negative slope
c) vertical line d) line with a positive slope
14) Draw a distance–time graph to show the following story.
Mary walked from home up the steep hill opposite her house. She stopped at the top to put her
skates on, then skated quickly down the hill, back home again.

Education Time Courseware Inc. Copyright 2014 Page 102
Unit 7 – Statistics
Homework 1: Foundations: Relationships (S.ID.2,S-IC.1)
1) Determine whether each sample is biased or unbiased.
a) To determine whether a school should add a weight room, the first 5 football players that entered
the gym that day were surveyed.
b) To determine the preferred candidate for mayor, a newspaper asks readers to send in their opinion.
c) To determine which 3 members of a class will address the school board, all their names were
written on individual index cards, the cards all placed in a box that was shaken and 3 cards were
picked from the box.
2) Determine whether the given data sets can be classified as qualitative or quantitative.
a) The heights of the members of the basketball team.
b) The ages of the teachers in the school
c) The opinions of the parent council regarding school vacations.
d) The ratings of a professor as excellent, good or poor.
3) Determine if the situation should be analyzed using univariate or bivariate statistics.
a) John keeps track of his math grades for the marking period.
b) Melissa records her times for running the mile every week.
c) A farmer wishes to see the relationship between amount of rainfall and the height of his corn.
d) A student wishes to see the relationship between the amount of time spent on video games the
night before a test and the grade on the test.
4) Which of the following demonstrate a casual relationship and which do not.
a) The faster the race car, the sooner the car finishes the race.
b) If the number of packages to ship increases, the space needed in the van increases.
c) A song about the rain on the radio is heard and dark clouds appear.
d) Cutting a roll into two pieces and not finding butter in the refrigerator.
5) Find the mean, median and mode of each of the following data sets.
a) 1, 3, 6, 7, 9, 9, 10
b) 10, 14, 14, 16, 20, 21, 23, 26

Education Time Courseware Inc. Copyright 2014 Page 103
Unit 7 – Statistics
Homework 2: Foundations: Histograms, Box & Whisker, Stem & Leaf (S-ID.1, S-ID.2)
1) Ms. Hopkins recorded her students' final exam scores in the frequency table below.
a) On the grid below, construct a frequency histogram based on the table.
b) Would you describe your graph as symmetrical or skewed? Explain your choice.
2) The Fahrenheit temperature readings on 30 April mornings in Stormcity, New York, are shown below.
a) Using the data, complete the frequency table below.
b) On the grid below, construct and label a
frequency histogram based on the table.
3) The following set of data represents the scores on
a mathematics quiz:
Complete the frequency table below and, on the accompanying grid,
draw and label a frequency histogram of these scores.
41 , 58 , 61 , 54 , 49 , 46 , 52 , 58 , 67 , 43 ,
47 , 60 , 52 , 58 , 48 , 44 , 59 , 66 , 62 , 55 ,
44 , 49 , 62 , 61 , 59 , 54 , 57 , 58 , 63 , 60
58, 79, 81, 99, 68, 92, 76, 84, 53, 57,
81, 91, 77, 50, 65, 57, 51, 72, 84, 89

Education Time Courseware Inc. Copyright 2014 Page 104
Hw 2 continued
4) The test scores from Mrs. Gray’s math class are shown below.
Construct a box-and-whisker plot to display these data.
5) Using the line provided, construct a box-and-whisker plot for the 12 scores below.
6) Make a stem and leaf display for the weights of carry-on luggage in pounds. Also provide a key.
30 27 12 42 35 47 38 36 27 35
22 17 29 3 21 0 38 32 41 33
26 45 18 43 18 32 31 32 19 21
33 31 28 29 51 12 32 18 21 26
7) Law Enforcement: Speeding is a serious offense. The following data give the ages of a random
sample of 50 drivers ticketed for speeding in a 40 MPH zone.
46 16 41 26 22 33 30 22 36 34 63 21 26 18 27 24 31 38
26 55 31 47 27 43 35 22 64 40 58 20 49 37 53 25 29 32
23 49 39 40 24 56 30 51 21 45 27 34 47 35
(a) Make a stem-and-leaf display of the age distribution.
72, 73, 66, 71, 82, 85, 95, 85, 86, 89, 91, 92
26, 32, 19, 65, 57, 16, 28, 42, 40, 21, 38, 10

Education Time Courseware Inc. Copyright 2014 Page 105
Unit 7 – Statistics
Homework 3: Distributions and Their Shapes (S-ID.1, S-ID.2, S-ID.3)
1) James asked members of his class which kind of movie they liked the best. The results are in the
table below.
a) Create a Dot Plot for the data above.
b) What do you think this graph is telling us about the classes favorite movies?
c) Can you think of a reason why the data presented by this graph provides important information? Who
might be interested in this data distribution?
d) Would you describe this dot plot as representing a symmetric or a skewed data distribution?
2) A sample of 20 colleges and universities with the following class sizes are shown below.
a) Create a Dot Plot for the data above.
b) What do you think this graph is telling us about the class size in most colleges?
c) Can you think of a reason why the data presented by this graph provides important information? Who
might be interested in this data distribution?
d) Would you describe this dot plot as representing a symmetric or a skewed data distribution?
14 20 20 20 20 23 25 30 30 30
35 35 35 40 40 42 50 50 80 80

Education Time Courseware Inc. Copyright 2014 Page 106
Hw 3 continued
3) The data set 5, 6, 7, 8, 9, 9, 9, 10, 12, 14, 17, 17, 18, 19, 19 represents the number of hours spent on the
Internet in a week by students in a mathematics class. Which box-and-whisker plot represents the
data?
4) What is the value of the third quartile shown on the box-and-whisker plot below?
5) The box-and-whisker plot below represents 20 students' scores on a recent English test.
a) What is the value of the upper quartile?
b) What do you think the box plot tells us about the students’ 20 scores on the English test?
c) Why might understanding the data behind this graph be important?
6) The box-and-whisker plot below represents the math test scores of the same 20 students.
a) What percentage of the test scores are less than 72?
b) What do you think the box plot tells us about the students’ 20 scores on the Math test?
c) Why might understanding the data behind this graph be important?
d) What can you say about the math test versus the English test results?

Education Time Courseware Inc. Copyright 2014 Page 107
Hw 3 continued
7) The accompanying histogram shows the heights of the students in Kyra’s health class.
a) What is the total number of students in the class?
b) What do you think this graph is telling us about the
heights of the students in Kyra’s health class?
c) Why might we want to study the data represented
by this graph?
d) Based on your previous work with histograms, would you describe this histogram as representing a
symmetrical or a skewed distribution? Explain your answer.
8) The accompanying histogram shows the scores of students on a Math regent.
a) How many students have scores of 96 to 100?
b) What do you think this graph is telling us about the
difficulty of this math test?
c) Why might we want to study the data represented by this graph?
d) Based on your previous work with histograms, would you describe this histogram as representing a
symmetrical or a skewed distribution? Explain your answer.

Education Time Courseware Inc. Copyright 2014 Page 108
Unit 7 – Statistics
Homework 4: Describing the Center of a Distribution (S-ID.2)
Review:
1) The following cumulative frequency histogram shows the distances swimmers completed in a recent
swim test.
a) Based on the cumulative frequency histogram, determine the
number of swimmers who swam between 200 and 249 yards.
b) Determine the number of swimmers who swam between 150
and 199 yards.
c) Determine the number of swimmers who took the swim test.
d) Why might we want to study the data represented by this
graph?
e) Based on your previous work with histograms, would you
describe this histogram as representing a symmetrical or a
skewed distribution? Explain your answer.
2) Find the mode of the following data: 87, 98, 85, 90, 98, 78, 93, 87, 76, 98
3) Find the median of the following set of data: 23, 25, 12, 25, 15, 20, 18
4) Find the mean of the following set of data: 90, 88, 94, 95, 81
5) Find the mode, median and mean of the following set of data: 25, 28, 15, 32, 27, 23, 28, 22, 30, 21,
28, 15, 20, 30, 24
6) a) Find the mean, median and mode of the data presented in the given frequency table.
b) Construct a dot plot of the data
.

Education Time Courseware Inc. Copyright 2014 Page 109
Hw 4 continued
7) If the mean of a set of data is 32 and the data includes 30, 35, 28, 25, 32, and x. Find the value of x.
8) If the median of a set of data is 50 and the data includes 25, 67, 75, 48, and x. Find the value of x.
9) Which of the following statements is true about the data 25, 37, 45, 40, 37, 39?
(1) median = mode (2) mean > median (3) mean < median (4) mode > mean
10) Using the data in the given frequency table, which of the following statements is true about the data?
(1) median = mode (2) mean > median (3) mean < median (4) mode > mean
xi fi
65 8
75 4
85 5
95 3
11) The table below provides the average retail price (cents per kilowatt-hour) to residential customers
of the New England states in October of 2009. Find the mean, median and mode of this data.
a) Compute the mean and the median.
b) If you wanted to describe a typical price for
electricity, would you use the mean or the median?
Justify your choice.
12) Using the scores 47, 45, 33, 67, 47, 55, 42 and x. What is the value of x if it is the median of the
data? What is the value of x if it is the mean of the data?
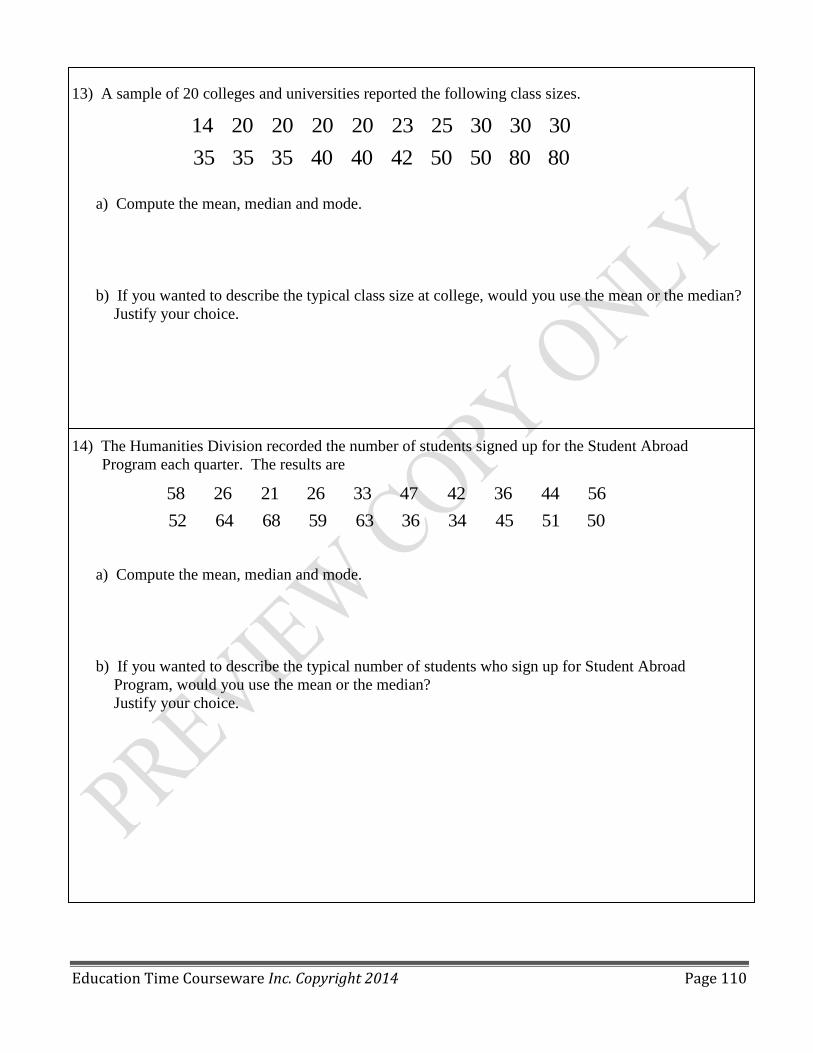
Education Time Courseware Inc. Copyright 2014 Page 110
13) A sample of 20 colleges and universities reported the following class sizes.
a) Compute the mean, median and mode.
b) If you wanted to describe the typical class size at college, would you use the mean or the median?
Justify your choice.
14) The Humanities Division recorded the number of students signed up for the Student Abroad
Program each quarter. The results are
a) Compute the mean, median and mode.
b) If you wanted to describe the typical number of students who sign up for Student Abroad
Program, would you use the mean or the median?
Justify your choice.
14 20 20 20 20 23 25 30 30 30
35 35 35 40 40 42 50 50 80 80
58 26 21 26 33 47 42 36 44 56
52 64 68 59 63 36 34 45 51 50

Education Time Courseware Inc. Copyright 2014 Page 111
Unit 7 – Statistics
Homework 5: Interpreting the Mean as a Balance Point (S-ID.1,2,3)
Review:
1) The data below are the calories in an ice cream bar. Find the quartiles and draw a box and whisker
plot. Label all aspects.
2) Make a stem and leaf display for the weights of carry-on luggage in pounds. Also provide a key.
Find the mean and the median. If you wanted to describe the typical weight of carry-on luggage
would you use the mean or the median?
Justify your choice
3) Estimate the balance point in each dot plot below by placing an arrow on the number line.
a)
b)
c)
342 377 319 353 295 234 294 286 377 1 82 310 439 1 11
201 1 82 1 97 209 1 47 1 90 1 51 1 31 1 51
30 27 1 2 42 35 47 38 36 27 35
22 1 7 29 3 21 0 38 32 41 33
26 45 1 8 43 1 8 32 31 32 1 9 21
33 31 28 29 51 1 2 32 1 8 21 26

Education Time Courseware Inc. Copyright 2014 Page 112
Hw 5 continued
4) Compute the mean for each part of question 3. How does the calculated mean score compare
with your estimated balance point?
5) Draw a dot plot of a data distribution representing the weight of twenty people for which the median
and the mean would be approximately the same.
6) Draw a dot plot of a data distribution representing the weights of twenty people for which the median
is noticeably less than the mean.
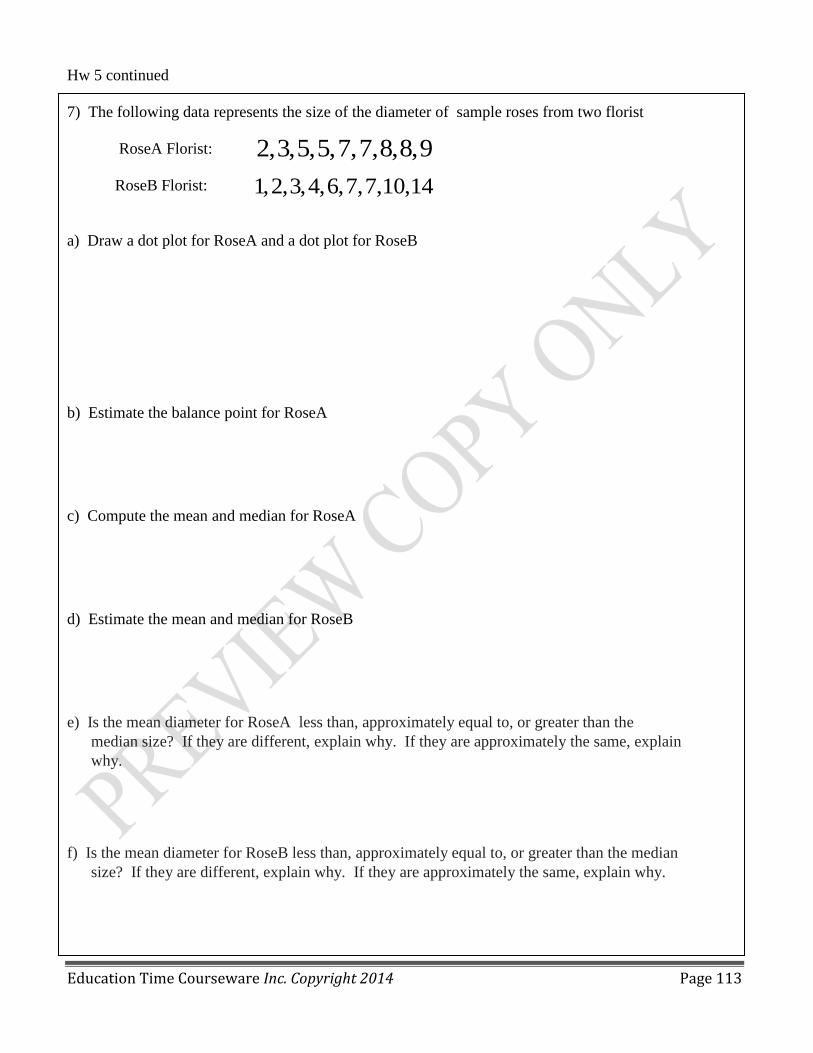
Education Time Courseware Inc. Copyright 2014 Page 113
Hw 5 continued
7) The following data represents the size of the diameter of sample roses from two florist
RoseA Florist:
RoseB Florist:
a) Draw a dot plot for RoseA and a dot plot for RoseB
b) Estimate the balance point for RoseA
c) Compute the mean and median for RoseA
d) Estimate the mean and median for RoseB
e) Is the mean diameter for RoseA less than, approximately equal to, or greater than the
median size? If they are different, explain why. If they are approximately the same, explain
why.
f) Is the mean diameter for RoseB less than, approximately equal to, or greater than the median
size? If they are different, explain why. If they are approximately the same, explain why.
2,3,5,5,7,7,8,8,9
1,2,3,4,6,7,7,10,14

Education Time Courseware Inc. Copyright 2014 Page 114
Unit 7– Statistics
Homework 6: Summarizing Deviations from the Mean (S-ID.2)
(Unless otherwise directed, round to the nearest tenth, when appropriate.)
Review:
1) Find the mean, median and mode of the following set of data. Draw the dot plot.
15, 27, 16, 18, 23, 18, 20, 24, 18, 22, 16, 24, 18, 14, 25
2) For each set of scores, find the range
a) 26, 67, 45, 62, 46, 15, 49, 55, 32 b) 15, 23, 7, 34, 12, 16, 35, 27, 19
3) The following is a list of ages of participants entered in a 5K race.
a) Compute the mean
b) Calculate the deviations from the mean for these ages, and write your answers in the
appropriate places in the table below.
4) What percentage of Canada goose nests are successful (at least one gosling survives)? Studies in
regions of Montana, Illinois, Wyoming, Utah, and California gave the following percentage of
successful nests:
23.9 52.5 60.0 68.5 78.6 71.0 17.8 57.5 59.0 52.0
a) Compute the mean.
b) Calculate the deviations from the mean for these ages, and write your answers in the
appropriate places in the table below.
24 31 8 29 36 55 42 40 24 1 9
43 38 1 8 32 50 1 0 24 35 25 28

Education Time Courseware Inc. Copyright 2014 Page 115
Unit 7– Statistics
Homework 7: Measuring Variability for Symmetrical Distributions (S-ID.2)
Review:
1) The average snowfall in January for some cities is shown in the table.
a) Compute the mean.
b) Calculate the deviations from the mean for
these ages, and write your answers in the
appropriate places in the table below.
2) What are the standard deviations of the following set of data?
158, 180, 123, 153, 176, 135, 192, 156, 144 (answer to the nearest tenth)
a) Compute the mean.
b) Calculate the deviations from the mean for these ages, and write your answers in the
appropriate places in the table below.
c) Find the sum of the squared deviation
d) What is the value of 𝒏 for this data set? Divide the sum of the squared deviations by n-1
e) State the standard deviation.

Education Time Courseware Inc. Copyright 2014 Page 116
Hw 7 continued
3) The table shows the average daily high temperature
in July for various vacation cities. Calculate, to the
nearest tenth, the mean temperature, the standard
deviation of these temperatures.
a) Compute the mean.
b) Calculate the deviations from the mean for these
ages, and write your answers in the appropriate
places in the table below.
c) Find the sum of the squared deviation
d) State the standard deviation.
4) A random sample of 7 Northern Pike from Taltson Lake (Canada) gave the following lengths rounded
to the nearest inch.
21 27 46 35 41 36 25
a) Compute the mean.
b) Calculate the deviations from the mean for these ages, and write your answers in the
appropriate places in the table below.
c) Find the sum of the squared deviation
d) State the standard deviation.

Education Time Courseware Inc. Copyright 2014 Page 117
Unit 7– Statistics
Homework 8: Interpreting the Standard Deviation (S-ID.2, S-ID.5, S-ID.9)
Perform the following questions using a calculator
Review:
1) If all of the scores on a test were 85, what is the mean? What is the standard deviation?
2) If the variance of a set of data is 64, what is the standard deviation?
3) The given table shows the ages of children who attended a recent “children’s movie” at a local
theater. (a) What is the mean age of the children attending to the nearest hundredth? (b) What are
the mode and the median of the data?
4) Both of the following sets of data have the same mean. Without actually calculating the mean or the
standard deviation, which set would appear to have the smaller standard deviation?
A) 40, 50, 55, 60, 45 B) 20, 85, 55, 50, 40
5) Check your answers by finding each mean and standard deviation.
Can you explain what causes the difference in standard deviations?
6) a) If all students were given a 5-point bonus on a particular test, what change (if any) would occur to
the mean of that test?
(b) What change (if any) would occur to the median?
(c) What change (if any) would occur to the standard deviation.

Education Time Courseware Inc. Copyright 2014 Page 118
Hw 8 continued
7) a) If all workers salary were to be doubled, what change (if any) would occur to the mean of those
salaries?
(b) What change (if any) would occur to the median?
(c) What change (if any) would occur to the standard deviation.
8) The following data represents the annual snowfalls (in inches) for a city in northern Wisconsin.
24 37 28 13 38 29 112 21 40 36
46 81 15 47 22 20 119 41 62 18
a) Find the mean b) Find the standard deviation
9) A random sample of 6 people, each 20 pounds overweight, volunteered to go on the same diet. After
3 months, their weight loss (in pounds) were
12 5 14 19 15 8
a. Find the range. _________ c. Find the variance ___________
b. Find the mean _________ d. Find the standard deviation __________
10) What percentage of Canada goose nests are successful (at least one gosling survives)? Studies in
regions of Montana, Illinois, Wyoming, Utah, and California gave the following percentage of
successful nests:
23.9 52.5 60.0 68.5 78.6 71.0 17.8 57.5 59.0 52.0
(a) Compute the range
(b) State the mean.
(c) State the standard deviation.
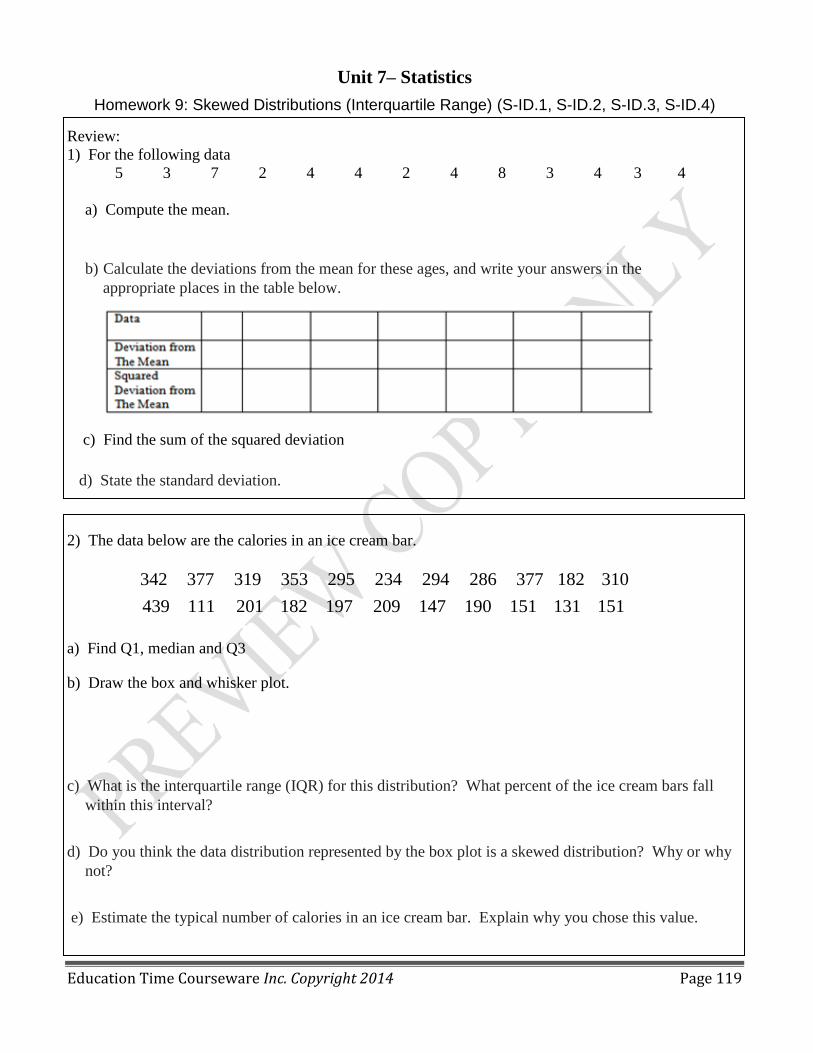
Education Time Courseware Inc. Copyright 2014 Page 119
Unit 7– Statistics
Homework 9: Skewed Distributions (Interquartile Range) (S-ID.1, S-ID.2, S-ID.3, S-ID.4)
Review:
1) For the following data
5 3 7 2 4 4 2 4 8 3 4 3 4
a) Compute the mean.
b) Calculate the deviations from the mean for these ages, and write your answers in the
appropriate places in the table below.
c) Find the sum of the squared deviation
d) State the standard deviation.
2) The data below are the calories in an ice cream bar.
a) Find Q1, median and Q3
b) Draw the box and whisker plot.
c) What is the interquartile range (IQR) for this distribution? What percent of the ice cream bars fall
within this interval?
d) Do you think the data distribution represented by the box plot is a skewed distribution? Why or why
not?
e) Estimate the typical number of calories in an ice cream bar. Explain why you chose this value.
342 377 319 353 295 234 294 286 377 1 82 310
439 1 11 201 1 82 1 97 209 1 47 1 90 1 51 1 31 1 51

Education Time Courseware Inc. Copyright 2014 Page 120
3) Law Enforcement: Speeding is a serious offense. The following data give the ages of a random
sample of 50 drivers ticketed for speeding in a 40 MPH zone
46 16 41 26 22 33 30 22 36 34 63 21 26 18 27 24 31 38
26 55 31 47 27 43 35 22 64 40 58 20 49 37 53 25 29 32
23 49 39 40 24 56 30 51 21 45 27 34 47 35
a) Draw a dot plot of the data above
b) How many drivers where older than 45?
c) Is this data distribution considered skewed? Explain your answer.
d) Is the tail of this data distribution to the right or to the left? How would you describe several
of the ages in the tail?
e) Draw a box plot over the dot plot.

Education Time Courseware Inc. Copyright 2014 Page 121
Unit 7– Statistics
Homework 10: Comparing Distributions (S-ID.1, S-ID.2, S-ID.3)
1) Using the histograms of the number of hours spent at the gym, approximately how many of the
members of gym A spend between 2 to 6 hours at their gym? Approximately how many of the
members of gym B spend between 2 to 6 hours at their gym.
2) What 2 - hour interval of members represented in the histogram of the Gym B distribution has the
most people?
3) Why are the mean hours greater than the median hours for members in Gym A?
4) Using the two histograms, can you determine which gym is more successful? Explain your answer.
5) Based on your previous work with histograms, would you describe the histogram for Gym B as
representing a symmetrical or a skewed distribution? Explain your answer.

Education Time Courseware Inc. Copyright 2014 Page 122
Hw 10 continued
6) The first dot plot is a dot plot of the ages of sixty eight people from a random sample of people who
attended a basketball game and the second dot plot is a dot plot of sixty eight ages from a random sample
of people who attended a football game.
Draw a box plot over this dot plot.
a) Based on your box plots, what is the median age for people attending the basketball game and those
attending the football game?
b) What does the box plots of the two games indicate about the possible differences in the age
distributions of people who attend the basketball games and football games?
7) The following box plot summarizes ages for a random sample from a made up county named C
County.
Make up your own sample of sixty ages that could be represented by the box plot for C County. Use a
dot plot to represent the ages of the sixty people in C County.
Is the sample of sixty ages represented in your dot plot of C County the only sample that could be
represented by the box plot? Explain your answer.

Education Time Courseware Inc. Copyright 2014 Page 123
Unit 7– Statistics
Homework 11: Bivariate Categorical Data & Relative Frequencies (S-ID.5, S-ID.9)
Review
1) Tanner and Robbie discovered that the means of their grades for the first semester in Mrs. Merrell’s
mathematics class are identical. They also noticed that the standard deviation of Tanner's scores is
20.7, while the standard deviation of Robbie's scores is 2.7. Which statement must be true?
a) In general, Robbie's grades are lower than Tanner's grades
b) Robbie's grades are more consistent than Tanner's grades.
c) Robbie had more failing grades during the semester than Tanner had.
d) The median for Robbie's grades is lower than the median for Tanner's grades.
2) A random sample of 284 students was asked to evaluate teacher performance. The students were also
asked to supply their midterm grade.
Teacher evaluation
A B C Row total
Positive 35 33 28 96
Neutral 25 46 35 106
Negative 20 22 40 82
Column Total 80 101 103 284
a) Calculate the relative frequencies for each of the cells to the nearest thousandth. Place the relative
frequencies in the cells of the following table.
b) Based on your relative frequency table, what is the relative frequency of students who had an
A?
c) Based on your table, what is the relative frequency of a student who received a B and gave a
negative rating?
d) If a student were randomly selected from the 284 students, do you think the student selected
would have received a C grade?
e) If a student were selected at random from the 284 students, do you think this student would
give a neutral rating? Explain your answer.
f) Based on the relative frequencies how would you rate this professor? Explain your answer.

Education Time Courseware Inc. Copyright 2014 Page 124
Hw 11continued
3) Several students at Common High School were debating whether males or females were more
involved in afterschool activities. There are three organized activities in the afterschool program –
intramural volleyball, computer club, and jazz band. Due to budget constraints, a student can only
select one of these activities. The students were not able to ask every student in the school whether
they participated in the afterschool program or what activity they selected if they were involved.
a) Complete the above table for the 120 students who were surveyed.
b) Write questions that could be included in the survey to investigate the question the students
are debating.
c) Common High School has approximately 1800 students. Jim suggested that the first 120
students entering the cafeteria for lunch would provide a random sample to analyze. Janet
suggested that they pick 120 students based on a school identification number. Who has a
better strategy for selecting a random sample? How do you think 120 students could be
randomly selected to complete the survey?
d) Complete the calculations of the row conditional relative frequencies. Round your answers
to the nearest thousandth. Place your answer in the table above.
e) Are the row conditional relative frequencies for males and females similar, or are they very
different?
f) Do you think there is a possible association between gender and after high school
activities? Explain your answer.
g) If Jack, a male student at Common High School, completed the after-school survey, what
would you predict was his response? Explain your answer.
h) If Joan, a female student at Common High School, completed the after-school survey, what
would you predict was her response? Explain your answer.
i) Do you think there is an association between gender and choice of after-school program?
Explain.

Education Time Courseware Inc. Copyright 2014 Page 125
Unit 7– Statistics
Homework 12: Relationships between Two Numerical Variables (S-ID.5, S-ID.6)
1) Construct a scatter plot that displays the data for 𝒙 = elevation above sea level (in feet)
and 𝒘 = mean number of partly cloudy days per year.
2) Based on the scatter plot you constructed in Question 1, is there a relationship between elevation and
the mean number of partly cloudy days per year? If so, how would you describe the relationship?
Explain your reasoning

Education Time Courseware Inc. Copyright 2014 Page 126
Hw 12 continued
3) The speeds ( in miles per hour) and stopping distances ( in feet) for an automobile braking system are
represented in the table below
a) Draw a scatter plot.
b) Is there a relationship between speed and stopping distance, or are the data points scattered?
4) What type of model (linear, quadratic or exponential) would best describe the relationship in each
scatter plot? Explain your reasoning.
a) b) c)
d) e) f)

Education Time Courseware Inc. Copyright 2014 Page 127
Hw 12 continued
5) According to basic economics, if the demand for a product increases, then the price will decrease.
The following chart shows the number of items requested and the corresponding price.
a) Draw the scatter plot
b) What type of model (linear, quadratic, or exponential) would you use to describe the
relationship between demand and the price of the items?
c) One model that could describe the relationship between and price is:
Graph this exponential curve on the same graph with the scatter plot.
d) Does this model do a good job of describing the relationship between demand and price?
Explain why or why not.
e) Based on this exponential model, what price would you predict for 30 items?
Demand Price
1 $105
4 $92
7 $80
12 $60
16 $50
20 $40
114(0.95)xy

Education Time Courseware Inc. Copyright 2014 Page 128
6) Biologists conducted a study of the nesting behavior of a type of bird called a flycatcher.
They examined a large number of nests and recorded the latitude for the location of the nest
and the number of chicks in the nest.
Data Source: Ibis, 1997
a) What type of model (linear, quadratic or exponential) would best describe the relationship
between latitude and mean number of chicks?
b) One model that could be used to describe the relationship between mean number of chicks
and latitude is: 𝒚 = 𝟎. 𝟏𝟕𝟓 + 𝟎. 𝟐𝟏𝒙 − 𝟎. 𝟎𝟎𝟐𝒙𝟐, where 𝒙 represents the latitude of the
location of the nest and 𝒚 represents the number of chicks in the nest. Use the quadratic
model to complete the following table. Then sketch a graph of the quadratic curve on the
scatter plot above.
𝒙
(degrees) 𝒚
30
40
50
60
70
c) Based on this quadratic model, what is the best latitude for hatching the most flycatcher
chicks? Justify your choice.

Education Time Courseware Inc. Copyright 2014 Page 129
Unit 7– Statistics
Homework 13: Modeling Relationships with a Line (S-ID.6, S-ID.7, S-ID.8, S-ID.9)
Review
1. Find, to the nearest hundredth, the mean, and the standard deviation of the following set of data.
Interval Frequency
110 - 129 12
90 - 109 30
70 - 89 24
50 - 69 14
2. (a) Which of the scatter diagrams on the right represent a
strong positive correlation?
(b) Which of the scatter diagrams represents no
correlation?
c) Which of the scatter diagrams on the right represent a
strong negative correlation?
3. (a) Find the linear correlation coefficient for the relationship between height and shoe size as
expressed in the given table. Round all answers to the nearest hundredth.
(b) Create a scatter diagram for the data on the axis provided.
(c) Find the mean of the heights.
(d) Find the mean of the shoe sizes.
(e) Find the equation of the line of best fit.
Height 60 61 62 63 64 65 66 67 68
Shoe Size 7 7 8 8 8.5 9 9 9.5 10

Education Time Courseware Inc. Copyright 2014 Page 130
Hw 13 continued
4. (a) Find the linear correlation coefficient for the relationship between age and the number of absences
as expressed in the given table. Round all answers to the nearest hundredth.
(b) Create a scatter diagram for the data on the axis provided.
(c) Find the mean of the ages.
(d) Find the mean of the number of absences.
(e) Find the equation of the line of best fit.
5. (a) Find the linear correlation coefficient for the relationship between the height and the weight of the
following data given in the table. Round all answers to the nearest tenth.
(b) Find the equation of the line of best fit for this data.
(c) Based on the line of best-fit model, what would the expected weight
be if the height were 70 inches?
Height
(inches)
Weight
(lbs)
45 168
55 175
55 172
63 180
65 186
80 192
50 165
48 168
51 171
60 174

Education Time Courseware Inc. Copyright 2014 Page 131
Unit 7– Statistics
Homework 14: Interpreting Residuals from a Line (S-ID.6, S-ID.7, S-ID.8, S-ID.9)
(Unless otherwise directed, round to the nearest tenth, when appropriate.)
Review
1) (a) Find the linear correlation coefficient for the relationship between the weight of a box and the
number of walnuts inside the box..
(b) Find the equation of the line of best fit for this data.
(c) Based on the line of best-fit model, what would the expected # of
walnuts in a box that weighs 42.4 grams.
2. The table below lists the total estimated numbers of a certain type of disease cases, by year of
diagnosis from 2004 to 2009 in the United States.
(a) Plot the data, letting x = 0 correspond to the year 2004
(b) Determine the quadratic regression model equation that represents the data.
(c) Plot the quadratic graph with the data to determine how well the model fits the actual data.
(d) Use the model to predict the number of cases of the disease in the year 2011.
Weight
(grams)
# of
walnuts
42.3 87
42.7 91
42.8 93
42.4 87
42.6 89
41.9 80
42.2 82
42.5 88
42.9 94
41.8 87
YEAR # of
CASES
2004 21350
2005 21150
2006 20700
2007 21180
2008 23050
2009 24010

Education Time Courseware Inc. Copyright 2014 Page 132
Hw 14 continued
Review
3) The data shows the cooling temperature of a liquid left at room temperature over time. Use the
rounded equation from part a to answer all other parts.
(a) Determine an exponential regression model equation to represent this data.
(b) Graph the new equation.
(c) When is the liquid at a temperature of 106 degrees?
(d) What is the predicted temperature of the liquid after 1 hour?
(e) How long should it take before the liquid is not hotter than 155º
TIME
(mins)
TEMP
(°F)
0 179.5
5 168.7
8 158.1
11 149.2
15 141.7
18 134.6
22 125.4
25 123.5
30 116.3
34 113.2
38 109.1
42 105.7
45 102.2
50 100.5

Education Time Courseware Inc. Copyright 2014 Page 133
Hw 14 continued
4) Complete each table below using the given linear regression model above it. Express all calculations
to the nearest tenth.
a) Linear regression model: 0.5 0.3y x
b) ) Linear regression model : 0.4 6.4y x
5) If you see a clear curve in the residual plot, what does this say about the original data set?
6) If you see a random scatter of points in the residual plot, what does this say about the original data
set?
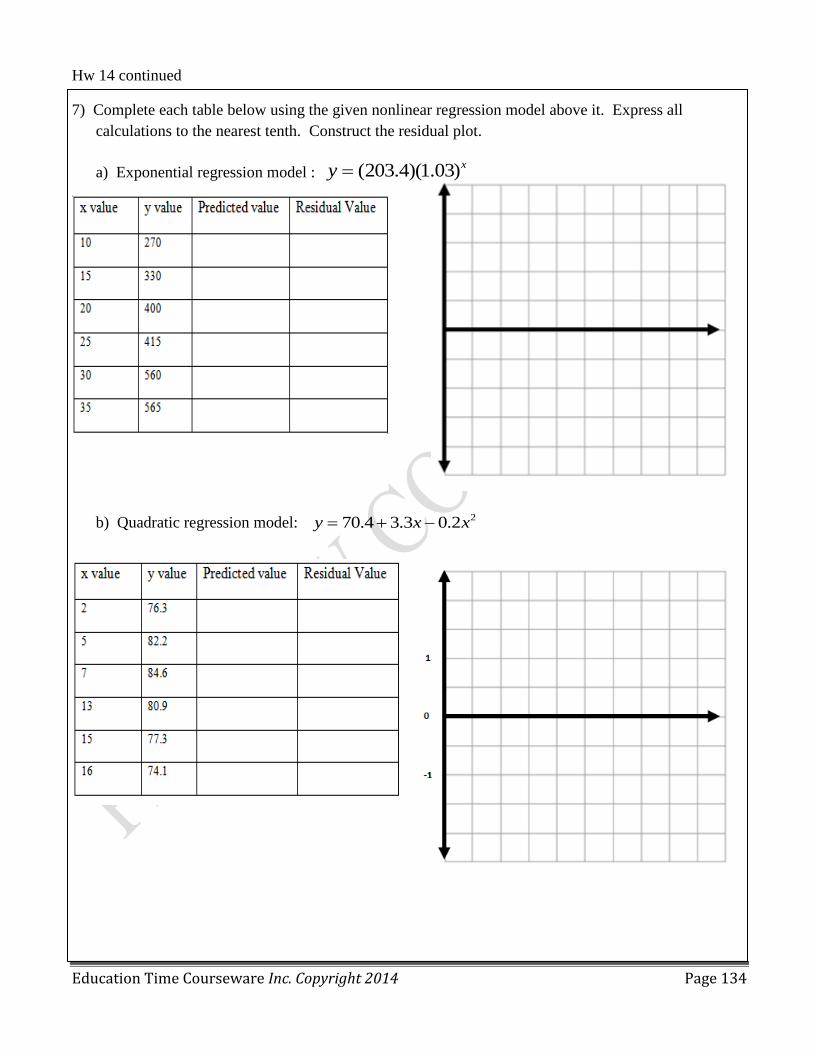
Education Time Courseware Inc. Copyright 2014 Page 134
Hw 14 continued
7) Complete each table below using the given nonlinear regression model above it. Express all
calculations to the nearest tenth. Construct the residual plot.
a) Exponential regression model : (203.4)(1.03)xy
b) Quadratic regression model: 270.4 3.3 0.2y x x
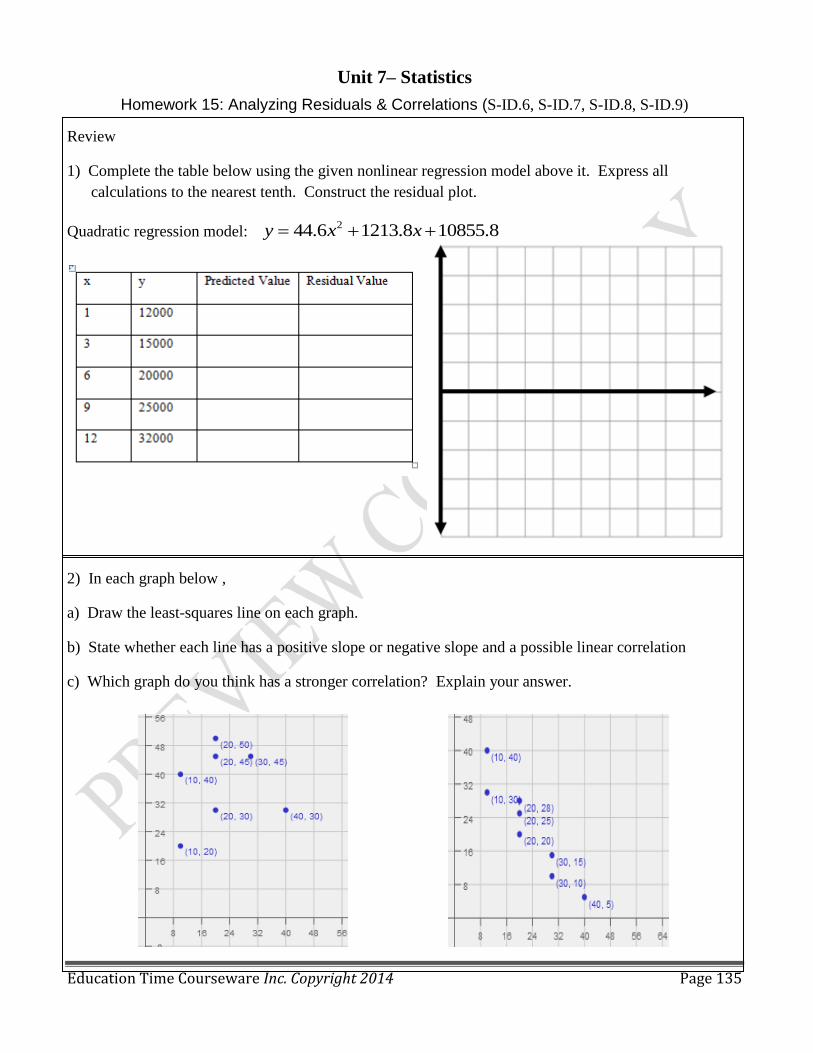
Education Time Courseware Inc. Copyright 2014 Page 135
Unit 7– Statistics
Homework 15: Analyzing Residuals & Correlations (S-ID.6, S-ID.7, S-ID.8, S-ID.9)
Review
1) Complete the table below using the given nonlinear regression model above it. Express all
calculations to the nearest tenth. Construct the residual plot.
Quadratic regression model: 244.6 1213.8 10855.8y x x
2) In each graph below ,
a) Draw the least-squares line on each graph.
b) State whether each line has a positive slope or negative slope and a possible linear correlation
c) Which graph do you think has a stronger correlation? Explain your answer.

Education Time Courseware Inc. Copyright 2014 Page 136
Hw 15 continued
3) a) Is the relationship displayed in Scatter Plot 1, a positive or negative linear relationship?
b) Is the relationship displayed in Scatter Plot 2, a positive or negative linear relationship?
c) In Scatter plot 1, does the value of the 𝒚 variable tend to increase or decrease as the value of
𝒙 increases? If you were to describe this relationship using a line, would the line have a
positive or negative slope?
d) In Scatter Plot 2, as the value of one of the variables increases, what happens to the value of
the other variable? If you were to describe this relationship using a line, would the line have
a positive or negative slope?
e) What does it mean to say that there is a positive linear relationship between two variables?
f) What does it mean to say that there is a negative linear relationship between two variables?
4. What do you think a scatter plot that shows the strongest possible positive linear relationship would
look like? Draw a scatter plot with 5 points that illustrates this.
5. How would a scatter plot that shows the strongest possible negative linear relationship look different
from the scatter plot that you drew in the previous question?

Education Time Courseware Inc. Copyright 2014 Page 137
Hw 15 continued
6) For each of the following residual plots, what conclusion would you reach about the
relationship between the variables in the original data set? Indicate whether the values
would be better represented by a linear or a non-linear relationship. Justify you answer.
7) Using a graphing calculator, construct the scatter plot of the data set and the residual plot.
Include the least-squares line on your graph. Make a sketch of the scatter plot including the
least-squares line on the axes below.
Do you see a clear curve in the residual plot? Is the original data set linear or nonlinear?
Explain your answer.

Education Time Courseware Inc. Copyright 2014 Page 138
Hw 15 continued
8) Do heavier cars really use more gasoline? Let x be the weight of the car (in hundreds of pounds and
let y be the miles per gallon in the chart below.
a) Using a graphing calculator, construct the scatter plot of the data set and the residual plot.
Include the least-squares line on your graph. Make a sketch of the scatter plot including
the least-squares line on the axes below. State the equation of the least-squares line.
b) Complete the table below using the equation from part a. Express all calculations to the
nearest tenth. Construct the residual plot.
c) What would be the miles per gallon for a car that weighs 38 (hundred pounds).
d) Using the information from the residual value, how confident are you about your answer? Explain.

Education Time Courseware Inc. Copyright 2014 Page 139
Unit 7– Statistics
Homework 16: Unit 7 Review
1) Which set of data can be classified as quantitative?
1) first names of students in a chess club
2) ages of students in a government class
3) hair colors of students in a debate club
4) favorite sports of students in a gym class
2) Which situation should be analyzed using bivariate data?
1) Ms. Saleem keeps a list of the amount of
time her daughter spends on her social
studies homework.
2) Mr. Benjamin tries to see if his students’
shoe sizes are directly related to their
heights.
3) Mr. DeStefan records his customers’ best
video game scores during the summer.
4) Mr. Chan keeps track of his daughter’s
algebra grades for the quarter.
3) A survey is being conducted to determine which school board candidate would best serve the Yonkers
community. Which group, when randomly surveyed, would likely produce the most bias?
1) 15 employees of the Yonkers school district
2) 25 people driving past Yonkers High School
3) 75 people who enter a Yonkers grocery store
4) 100 people who visit the local Yonkers
shopping mall
4) The scatter plot below shows the profit, by month, for a
new company for the first year of operation. Kate drew a
line of best fit, as shown in the diagram.
Using this line, what is the best estimate for profit in the 18th
month?
1) $35,000
2) $37,750
3) $42,500
4) $45,000

Education Time Courseware Inc. Copyright 2014 Page 140
Hw 16 continued
5) The number of hours spent on math homework each week and the
final exam grades for twelve students in Mr. Dylan's algebra class
are plotted below.
Based on a line of best fit, which exam grade is the best prediction for
a student who spends about 4 hours on math homework each week?
1) 62
2) 72
3) 82
4) 92
6) The graph below illustrates the number of acres used for
farming in Smalltown, New York, over several years.
Using a line of best fit, approximately how many acres will
be used for farming in the 5th year?
1) 0
2) 200
3) 300
4) 400
7) Megan and Bryce opened a new store called the Donut Pit. Their goal is to reach a profit of $20,000
in their 18th month of business. The table and scatter plot below represent the profit, P, in thousands
of dollars that they made during the first 12 months. Draw a reasonable line of best fit. Using the line
of best fit, predict whether Megan and Bryce will reach their goal in the 18th month of their business.
Justify your answer.

Education Time Courseware Inc. Copyright 2014 Page 141
Hw 16 - continued
8) The hours that John worked over the past 12 weeks are recorded in the table. For these hours find (to
the nearest tenth) (a) the mean (b) the median (c) the mode (d) the
standard deviation (e) the variance
9) Luggage weights (per passenger) for a particular flight are reported in
the following table. Find the mean and the standard deviation of these
weights to the nearest hundredth.
10) The residuals for a set of data represent the
(1) differences between consecutive x-values
(2) vertical differences between data points and the line of best fit
(3) data points that lie above the line of best fit
(4) data points that lie below the line of best fit
11) The following table compares the wing length (in cms) of a particular
species of bird, with the age (in days) of the bird. ( nearest tenth)
(a) Find the correlation coefficient. Is this considered a high or low
correlation?
(b) Find the equation of the line of best fit.
(c) Use this equation to estimate (nearest ten thousandth) how old a bird
with a wing length of 2.8 might be.
Hours Frequency
30 1
35 2
37 5
40 3
42 1
WEIGHTS
(lbs)
# of
PASSENGERS
0 - 8 12
9 - 17 25
18 – 26 38
27 – 35 22
36 - 44 15
WING
LENGTH
(cms)
AGE
(days)
1.5 4.0
2.2 5.0
3.1 8.0
3.2 9.0
3.2 10.0
3.9 11.0
4.1 12.0
4.7 14.0
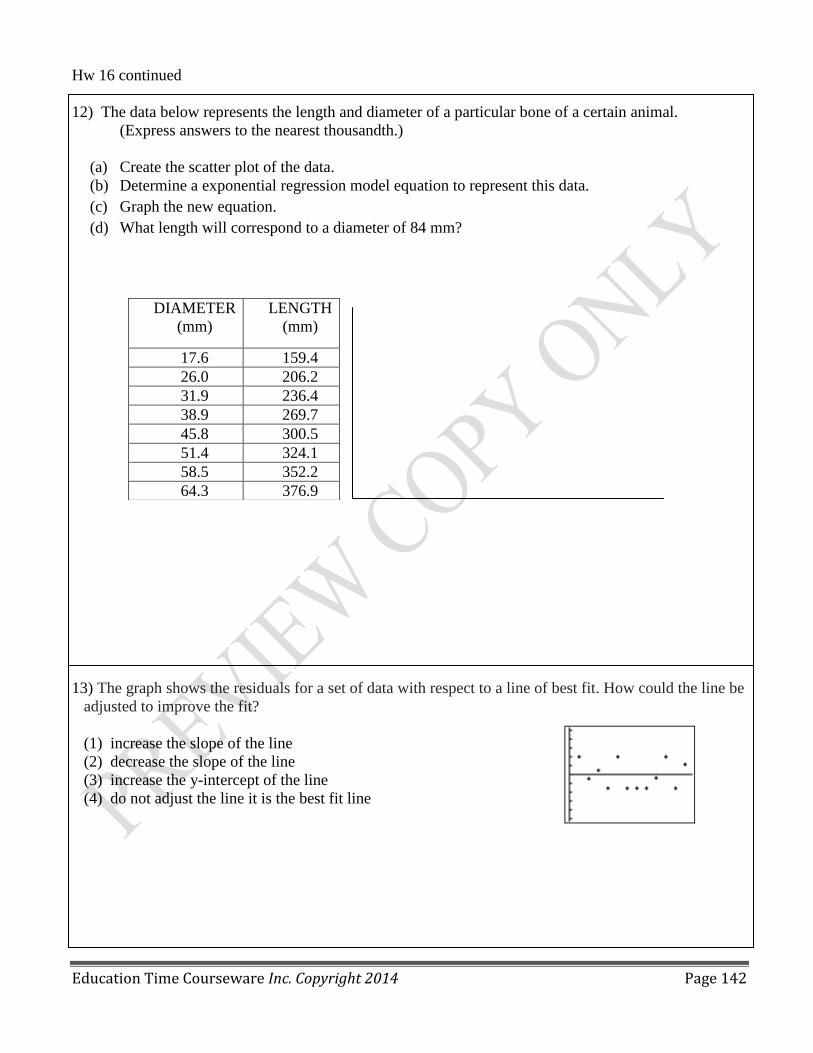
Education Time Courseware Inc. Copyright 2014 Page 142
Hw 16 continued
12) The data below represents the length and diameter of a particular bone of a certain animal.
(Express answers to the nearest thousandth.)
(a) Create the scatter plot of the data.
(b) Determine a exponential regression model equation to represent this data.
(c) Graph the new equation.
(d) What length will correspond to a diameter of 84 mm?
13) The graph shows the residuals for a set of data with respect to a line of best fit. How could the line be
adjusted to improve the fit?
(1) increase the slope of the line
(2) decrease the slope of the line
(3) increase the y-intercept of the line
(4) do not adjust the line it is the best fit line
DIAMETER
(mm)
LENGTH
(mm)
17.6 159.4
26.0 206.2
31.9 236.4
38.9 269.7
45.8 300.5
51.4 324.1
58.5 352.2
64.3 376.9

Education Time Courseware Inc. Copyright 2014 Page 143
Hw 16 continued
14) The table below represents a projection of future sales in the thousands of dollars by months in
business. (nearest hundredths)
a) Draw a scatter plot below.
b) What type of model (linear, quadratic or exponential) would best
describe the relationship between months in business and sales?
c) Determine a quadratic regression model equation to represent this
data.
d) Use the quadratic model equation to complete the following table.
Then sketch a graph of the quadratic curve on the scatter plot below.
e) Based on this quadratic model, what would you predict sales will be after 10 months?
Justify your choice.

Education Time Courseware Inc. Copyright 2014 Page 144
Unit 7– Statistics
Homework 17: Cumulative Review Unit 7
1) Mrs. Smith wrote “Eight less than three times a number is greater than fifteen” on the board. If x
represents the number, which inequality is the correct translation of this statement?
(1) 3x- 8 > 15 (2) 3x – 8 < 15 (3) 8 – 3x > 15 (4) 8 – 3x < 15
2) If 2ax - 3b = 5c, then x equals
(1) 5 3
2
c b
a
(2)
3 5
2
b c
a
(3) 5c + 3b – 2a (4)
5 3
2
c b
a
3) Which graph does not represent a function?
(1) (2) (3) (4)
4) Which inequality is represented by this graph?
(1)
(2)
(3)
(4)
5) On a certain day in Toronto, Canada, the temperature was 15 Celsius (c). Using the formula
F = 9
325
C , Peter converts this temperature to degrees Fahrenheit (F). Which temperature represents
15C in degrees Fahrenheit?
(1) -9 (2) 35 (3) 59 (4) 85
6) Which value of x is in the solution set of the inequality -3(x + 2) < 6?
(1) -12 (2) -6 (3) -4 (4) -3

Education Time Courseware Inc. Copyright 2014 Page 145
Hw 17
7) Maureen tracks the range of outdoor temperatures
over three days. She records the following
information.
Express the intersection of the three sets as an
inequality in terms of temperature, t
8) On the set of axes, graph the following system of inequalities and state the coordinates of a point in
the solution set.
2x – y ≥ 6
x > 2
9) Given:
Which expression results in a rational number?
1) L x M 2) M x N 3) N x P 4) P x L
10) During a 45-minute lunch period, Albert (A) went
running and Bill (B) walked for exercise. Their
times and distances are shown in the
accompanying graph. How much faster was
Albert running than Bill was walking, in miles per
hour?
3
2 3
15
26
L
M
N
P

Education Time Courseware Inc. Copyright 2014 Page 146
Hw 17 continued
11) Draw a distance–time graph to show the following story.
Mary walked from home up the steep hill opposite her house. She stopped at the top to put her
skates on, then skated quickly down the hill, back home again.
12) Samantha constructs the scatter plot below from a set of data.
Based on her scatter plot, which regression model would be most
appropriate?
1) exponential 3) quadratic
2) linear 4) cubic
13) John has four more nickels than dimes in his pocket, for a total of $1.25. Which equation could be
used to determine the number of dimes, x, in his pocket?
1)
2)
3)
4)

Education Time Courseware Inc. Copyright 2014 Page 147
Hw 17 continued
14) The following data represents approximate heights for a ball thrown by a shot-putter as it travels x
meters horizontally. (nearest hundredth)
a) Draw a scatter plot below.
b) What type of model (linear, quadratic or exponential) would best
describe the relationship between distance and the height?
c) Determine a quadratic regression model equation to represent this data.
d) Use the quadratic model to complete the following table.
Then sketch a graph of the quadratic curve on the scatter
plot below.
e) Based on this quadratic model, what would you predict the height of the shot put will reach
for a distance of 20 feet? Justify your choice.
15) If 2 23 4 6 and B=-3x +6x+5, then findA x x A B , A – B.
16) John has eight more nickels than dimes in his pocket, for a total of $1.35. Which equation could be
used to determine the number of dimes, x, in his pocket?
1) 0.10( 8) 0.05( ) 1.35 2) 0.05( 8) 0.10( ) 1.35
3) 0.10(8 ) 0.05( ) 1.35 4) 0.05(8 ) 0.10( ) 1.35
x x x x
x x x x

Education Time Courseware Inc. Copyright 2014 Page 148
Unit 8 – Sequences
Homework 1: Integer Sequences ( F-IF.2,F-IF.3,F-BF.1A,F-BF.2,F-LE.2)
1) Consider a sequence that follows a “plus 4” pattern: 5,9,13,17,...
a) Write a formula for the nth term of the
sequence. Be sure to specify what value of 𝑛
your formula starts with.
b) Using the formula, find the 25th term of the
sequence.
c) Graph the terms of the sequence as ordered
pairs (𝑛, 𝑓(𝑛)) on a coordinate plane.
2) Given the following pattern
a) Express the above pattern in table form
b) How many squares would you draw if n = 4
c) Write a formula for the nth term of the sequence. Be sure
to specify what value of 𝒏 your formula starts with.
d) Using the formula, find the 𝟓𝟎th term of the sequence.
e) Graph the terms of the sequence as ordered pairs (𝒏, 𝒇(𝒏)) on a coordinate plane.

Education Time Courseware Inc. Copyright 2014 Page 149
Hw 1 continued
3) Given the following pattern
a) Express the above pattern in table form
b) How many circles would you draw if n = 4, n = 10
c) Write a formula for the nth term of the sequence. Be
sure to specify what value of 𝒏 your formula starts with.
d) Using the formula, find the 𝟓𝟎th term of the sequence.
e) Graph the terms of the sequence as ordered pairs (𝒏, 𝒇(𝒏)) on a coordinate plane.

Education Time Courseware Inc. Copyright 2014 Page 150
Hw 1 continued
4) Consider a sequence that follows a “minus 3
pattern: 20,17,14,11,...
a) Write a formula for the nth term of the
sequence. Be sure to specify what value of 𝑛
your formula starts with.
b) Using the formula, find the 20th term of the
sequence.
c) Graph the terms of the sequence as ordered
pairs (𝑛, 𝑓(𝑛)) on a coordinate plane.
5) Consider a sequence generated by the formula 𝑓(𝑛) = 3𝑛 − 1 starting with 𝑛 = 1. Generate the
terms 𝑓(1), 𝑓(2), 𝑓(3), 𝑓(4), and 𝑓(5).
6) Consider a sequence given by the formula
starting with 𝑛 = 1. Generate the first 5 terms of the sequence.
7) Consider a sequence given by the formula starting with𝑛 = 1. Generate the first 5
terms of the sequence
1( )
2nf n
( ) ( 2) 5nf n

Education Time Courseware Inc. Copyright 2014 Page 151
Unit 8 – Sequences
Homework 2: Recursive Formulas for Sequences (F-IF.3)
Review
1) Consider a sequence generated by the formula 𝑓(𝑛) = −2𝑛 + 3 starting with 𝑛 = 1. Generate the
terms 𝑓(1), 𝑓(2), 𝑓(3), 𝑓(4), and 𝑓(5).
2) Consider a sequence that follows a “minus 2” pattern: 4,2,0, 2
Write a formula for the nth term of the sequence.
3) Consider the sequence given by the formula where
a) Explain what the formula means.
b) List the first 5 terms of the sequence.
c) Write an explicit formula.
4) Consider the sequence given by the formula where
a) Explain what the formula means.
b) List the first 5 terms of the sequence.
c) Write an explicit formula.
5) Consider the sequence given by the formula where
a) Explain what the formula means.
b) List the first 5 terms of the sequence.
c) Write an explicit formula.
6) Consider the sequence given by the formula
a) List the first 4 terms of the sequence.
b) Write an explicit formula.
1 15, 2n na a a
1 14, 3 2n na a a
1 1
132,
2n na a a
1 11, 2n na a a
1n
1n
1n
1n

Education Time Courseware Inc. Copyright 2014 Page 152
Hw 2 continued
7) Consider the sequence following a “minus 4” pattern: 𝟏𝟎, 𝟔, 𝟐, −𝟐, ….
a) Write an explicit formula for the sequence.
b) Write a recursive formula for the sequence.
c) Find the 𝟑𝟖th term of the sequence.
8) Consider the sequence given by the formula 𝒂(𝒏 + 𝟏) = 𝟒𝒂(𝒏) and 𝒂(𝟏) = 𝟑 for 𝒏 ≥ 𝟏.
a) Explain what the formula means.
b) List the first 𝟓 terms of the sequence.

Education Time Courseware Inc. Copyright 2014 Page 153
Unit 8 – Sequences
Homework 3: Arithmetic Sequences (F-IF3, F-BF.1, F-BF.2)
Review
1) Consider a sequence generated by the formula 𝑓(𝑛) = −4𝑛 + 3 starting with𝑛 = 1. Generate the
terms 𝑓(1), 𝑓(2), 𝑓(3), 𝑓(4), and 𝑓(5).
2) How many circles would you draw if n = 4, n = 10
Write a formula for the nth term of the sequence.
In exercises 3 – 6, find the common difference for each arithmetic sequence
3. 5, 10, 15, 20, 25 4. -4, 0, 4, 8, 12 5. 4, 1, -2, -5, -8 6. 1.5, 3, 4.5, 6
7. Find the next 3 terms in each of the sequences
5, 7, 9, ______, ______, ______
1, 1.5, 2, ______, ______, ______
c, c-3, c-6, ______, ______, ______
–n, 0, n, _____, ______, ______
8. Find the 21th
term of the arithmetic sequence with 1 3a and 1
4d .
9. Find the 50th
term in the sequence 19, 25, 31, …..
Find an explicit form for the sequence in terms of 𝒏.

Education Time Courseware Inc. Copyright 2014 Page 154
Hw 2 continued
10. Find the 30th
term in the sequence 1.5, 3, 4.5, …
Find an explicit form for the sequence in terms of 𝒏.
11. Find the 58th
term of the arithmetic sequence 10, 4, -2, ….
Find an explicit form for the sequence in terms of 𝒏.
12. Find the 28th
term of the sequence: 2, 2.4, 2.8, 3.2, 3.6, …
13. Find the 68th
term in the sequence 16, 7, -2, …….
14. Find the first term in the sequence for which 12
197a and d = 10.
15. Find the first term in the sequence for which 15
52a and d = -3
16. A sequence is formed by adding the constant c to each preceding term. The 6th
term of the sequence
is 25 and the 26th
term is 105. What is the 8th
term of the sequence?

Education Time Courseware Inc. Copyright 2014 Page 155
Unit 8 – Sequences
Homework 4: Geometric Sequences (A-SSE.4, F-BF.1, F-LE.2)
Review
1. Find the 21th term in the sequence 5, 11, 17, …… Find an explicit form for the sequence in
terms of 𝒏.
2. What is the tenth term of the arithmetic sequence: 13
22
5
2, , , …
3. List the first three terms of the sequence an
n 3 1( ) .
4. A free-falling body that starts from rest drops about 16 feet the first second, 48 feet the second second,
80 feet the third and so on. How many feet does the object fall in 10 seconds?
5. Find the common ratio and the next 3 terms in each of the geometric sequences:
a) 4, 12, 36, ______, ______, ______ b) 1 1 1, ,2 4 8
,_____, _____, _____
c) 2, -6, 18, ______, _______, ______ d) 1 1 1, , ,32 16 8
_____, _____, _____
6. The first term of a geometric sequence is –3 and the common ratio is 23
. Find, in fractional form,
the next 3 terms.
7. Find the 5th
term of the geometric sequence whose first term is 6 and whose common ratio is 2.
8. Find the 5th
term in the sequence 2, 6, 18, ….
9. Find the 6th
term in the sequence 1, 1 1,3 9
, ….
10. Find the 4th
term of the geometric sequence 10, .1, .001, ….
11. Find the first 3 terms of the geometric sequence for which a4 25 . and r = 2.

Education Time Courseware Inc. Copyright 2014 Page 156
Unit 8 – Sequences
Homework 5: Investment Applications (F-LE.5)
Review
1) Determine a2and a4
so that the following sequence 5 452 4, , , ,...,a a an is
a. an arithmetic sequence
b. a geometric sequence
2) Find the 5th
term in the sequence 1 1 1
, , ,...2 4 8
3) Carl invested $2000 at a bank that pays 𝟔% simple interest. Calculate the amount of money
in the account after 𝟏 year, 𝟒 years, 𝟔 years, and 𝟏𝟎 years.
4) The amount of money A, in a bank account is determined by the formula A = t
P 1 r , where P is
the initial amount invested, r is the yearly rate of interest and t is the number of years invested. Find
the following answers to the nearest hundredth.
a) If $2000 is invested at 5% compounded annually, what is the value of the investment after 8
years? What was the total interest earned over the eight years?
b) How long must $5000 be left in an account that pays 4% interest compounded annually in order
to grow to an amount over $7500?
5) Mary invested $2000 at a bank that pays 𝟓% interest compounded annually. Calculate the
amount of money in the account after 𝟏 year, 𝟒 years, 𝟔 years, and 𝟏𝟎 years.

Education Time Courseware Inc. Copyright 2014 Page 157
Hw 5 continued
6) Based on the information in questions 3 and 5, who made the better investment choice for
the 4 year investment?
7) A friend invests a sum of money at 8.5% interest compounded annually. How much must she invest
to have a total of $10,000 in ten years?
8) What amount is reached by investing $425 for 6 months at 10% interest compounded annually?
9 The table below shows the average yearly balance in a savings account where interest is compounded
annually. No money is deposited or withdrawn after the initial amount is deposited.
Which type of function best models the given data?
a) linear function with a negative rate of change
b) linear function with a positive rate of change
c) exponential decay function
d) exponential growth function
10) What amount should have been deposited 5 years ago at 8% interest compounded annually in order
to have $1000 today?

Education Time Courseware Inc. Copyright 2014 Page 158
Unit 8 – Sequences
Homework 6: Exponential Growth & Exponential Decay (F-LE.1C, F-LE.2, F-LE.5, F-BF.1)
Review: 1) What is a formula for the nth term of sequence B shown below?
1)
2)
3)
4)
2) What is the fifteenth term of the sequence 5, -10, 20, -40,80,…?
(1) -163,840 (2) -81,920 (3) 81,920 (4) 327,680
3) A population of 100 rabbits increases at an annual rate of 22%. How many rabbits will there be in 5
years? ( )
4) The population of Masonville was 3,620 in 2009, and is declining at an annual rate of 3.5%. If this
rate continues, what will be the approximate population in 2020? ( )
5) A type of bacteria has a very high exponential growth rate at 80% every hour. If there are 10 bacteria
to start, determine how many there will be in 5 hours. Write the explicit formula for the sequence
that models this growth.
How many hours would it take before the number of bacteria will exceed 10000?
6) If the number of electronic devices increase in a particular region by the formula
E(x) = 3.25(1.08)x, where x is the number of new residents in the region , how many electronic
devices are expected when 24 new residents arrive?
0( ) (1 )xR x R r
0( ) (1 )tP t P r

Education Time Courseware Inc. Copyright 2014 Page 159
Hw 6 continued
7) In 2002, New Land had a population of 3,962,000 with a population growth rate of 1.7% per year.
Assuming the population continues to increase at the same rate,
a) Complete the table and construct a graph to show how the population is expected to increase over the
next 4 years. Be sure to label and mark your axes. Write the explicit formula for the sequence that
models this growth.
b) How many years (from 2002) will it take for New Land’s population to reach 5,000,000? Round to
the nearest whole year.
8) The population of a certain Midwest City is modeled by the function
where t is the number of years from 2010.
a) What is the population in the year 2010?
b) What is the rate at which the population is decreasing per year?
c) In what year will the population of this city drop below 25,000?
( ) 68,990(0.925)tP t

Education Time Courseware Inc. Copyright 2014 Page 160
Unit 8 – Sequences
Homework 7: Review for Unit 8 Test
1. Write the first five terms of the sequence whose nth term is 2
1
2
n
n
.
2. Find the 7th
term of the arithmetic sequence with 1 3a and 1
2d .
3. Find the 7th
term of the geometric series 1
2
1
4
1
8 ...
4. The first term of a geometric series is 1
10. The second term is
1
5. What is the common ratio?
5. Which of the following is an expression for the nth term of the sequence 13, 17, 21,..?
A. 12n +1 B. 13
2
n
n C. 4n + 1 D. 4n + 9
6. Write the first three terms of the geometric sequence with 1 3a and 2
5r . Give your answers in
fraction form.
7. Find the third term in the recursive sequence ,
1 12 1, 3.k ka a where a

Education Time Courseware Inc. Copyright 2014 Page 161
Hw 7 continued
8. If a certain bacteria doubles every hour, starting with 2.25 thousand bacteria.
a) Write the explicit formula for the sequence that models this growth.
b) How many bacteria are present after 3 hours?
9. On a golf course in 2010, it was estimated that there were 500 Canadian Geese and that the number of
geese were growing at a rate of 5% a year. If the estimates are correct and the geese population continues
to grow at the estimated rate,
a) Write the explicit formula for the sequence that models this growth.
b) How many geese will be present after 4 years?
10. On January 1, a share of a certain stock cost $180. Each month thereafter, the cost of a share of this
stock decreased by one-third. If x represents the time, in months, and y represents the cost of the stock,
in dollars, which graph best represents the cost of a share over the following 5 months?
(1) (2)
(3) (4)

Education Time Courseware Inc. Copyright 2014 Page 162
Unit 9 – Functions and Interval Notation
Homework 1: Patterns in Linear Equations (F-IF.2, F-IF.4, F-IF.7)
1. Complete each table and find a rule for each pattern.
a)
Rule
b) Rule
c) Rule
d) Rule
e) Rule

Education Time Courseware Inc. Copyright 2014 Page 163
Unit 9 – Functions and Interval Notation
Homework 2: Modeling Linear Equations (F-IF.2, F-IF.4, F-IF.7)
Review:
1) Complete each table and find a rule for each pattern.
Rule
2) Which of the following could be modeled by y = 2x + 3? Answer YES or NO for each one.
If you answer no, give the correct equation.
a) Nicholas earns $2.00 for each magazine he sells. Each time he sells a magazine he also gets a
three-dollar tip. How much money will he earn after selling x magazines?
b) Olivia charges $2.00 an hour for babysitting. Parents are charged $3.00 if they arrive home
later than scheduled. Assuming the parents arrived late, how much money does she earn for x
hours?
c) Christopher creates a sequence of integers. The first term of the sequence is 5 and the
difference between any consecutive terms is always equal to 2.
d) Thomas wants to become a member of a video rental store. There is a $2.00 initiation fee and
a $3.00 per video rental fee.
How much would Thomas owe on his first visit if he becomes a member and rents x videos?
3) A computer salesperson earns a base salary of $30,000 plus a commission of $400 for every
computer she sells. Write an equation that shows the total amount of income the salesperson earns, if
she sells x machines in a year.
a) Write a linear equation to represent the situation above.
b) How many machines would she need to sell to earn $80,000 a year?

Education Time Courseware Inc. Copyright 2014 Page 164
Hw 2 continued
4) Mr. Jackson is tracking the progress of his plant’s growth. Today the plant is 7 cm high. The plant
grows 2.3 cm per day.
a) Write a linear equation that represents the height of the plant after d days.
b) What will the height of the plant be after 12 days?
5) Thomas is 2 miles south of his school. While walking north at a constant speed , he passes his school
after 2 hours.
a) What is Thomas' rate of speed?
b) Create a table showing Thomas' distance from school for 2 hours , 3 hours and 4 hours
c) Draw a graph illustrating this story.
d) State the function rule.

Education Time Courseware Inc. Copyright 2014 Page 165
Hw 2 continued
6) The elevator in Macys climbs 2 floors per minute. After 1 minute it is on the first floor.
a) What is the rate of speed of the elevator?
b) Create a table showing the floor the elevator is on for the following times in minutes.
c) Draw a graph illustrating this story.
d) State the function rule.

Education Time Courseware Inc. Copyright 2014 Page 166
Unit 9 – Functions and Interval Notation
Homework 3: Evaluating Functions (F-IF.1, F-IF.2)
Review
1) For the following graphs, describe the features, include: what intervals does it increase/decrease, what
quadrants does it reside in, what are its min/max, what are the intercepts, and what are the domain and
range?
a) b)
c) d)

Education Time Courseware Inc. Copyright 2014 Page 167
Hw 3 continued
2) If a function f(x) is defined as ( ) 3 1f x x , find the value of each function for the given input.
a) f(1) b) f(-2) c) f(0) d) 2
( )3
f
e) f(0.02) f) f(10.2) g) f( -0.4) h) 5
( )3
f
i) ( 5)f j) ( 2)f k) ( 2)f l) 5
( )3
f
m) f(2)+f(4) n) f(3) – f(2) o) ( 5) ( 3)f f p) 5 2
( ) ( )3 3
f f
3) If a function f(x) is defined as ( ) 0.3(4)xg x , find the value of each function for the given input.
a) g(0) b) g(1) c) g(2) d) g(-1)
e) 1
( )2
g f) 3
( )2
g g) g(2) +g(1) h) g(3 1
( ) ( ))2 2
g g

Education Time Courseware Inc. Copyright 2014 Page 168
Hw 3 continued
4) Let ( ) 5 2f x x and let ( ) 0.3(2)xg x , and suppose 𝑎, 𝑏, 𝑐, and ℎ are real numbers. Find the value
of each function for the given input.
a) f(b) b) f(a) c) g(a) d) g(b)
e) f(2b) f) f(2a) g) g(4a) h) g(2h)
i) f( c + a) j) f( a + h) k) g(a – 3) l) g( a+c)
m) f( b + 1) n) f( a – 2) o) g( a + 1) p) g ( b – 3)
q) f( b + 1 ) – f (b) r) g( b – 3) – g(b) s) f ( a + h) – f( h)

Education Time Courseware Inc. Copyright 2014 Page 169
Hw 3 continued
5) What is the range of each function given below?
a) ( ) 7 3f x x b) 1
( ) 22
f x x c) ( )f x x
d) ( ) 2xg x e) ( ) 5xg x f) 3( ) 5 xg x
g) 2( )h x x h) 2( ) 1h x x i) 2( ) 2h x x
j) ( )f x x k) ( ) 2f x x l) ( ) 2f x x
m) f(x) = 2x +1 such that x is a negative integer
n) ( ) 3 0 3xg x for x
6) Give A domain and range to complete the definition of each function.
a) let f(x) = 3x +2 b) let ( ) 3xf x
c) Let A(x) = x + 273, where A(x) is the Absolute temperature reading when the temperature is x
degrees Centigrade.
d) Let ( ) 250(3 )xb x where 𝐵(𝑥) is the number of bacteria at time 𝑥 hours over the course of one
day.

Education Time Courseware Inc. Copyright 2014 Page 170
Hw 3 continued
7) Let 𝑓: 𝑋 → 𝑌, where 𝑋 and 𝑌 are the set of all real numbers and 𝑥 and ℎ are real numbers.
a) Find a function 𝑓 such that the equation 𝑓(𝑥 − ℎ) = 𝑓(𝑥) − 𝑓(ℎ) is not true for all values of 𝑥 and ℎ.
Justify your reasoning.
b) Find a function 𝑓 such that equation 𝑓(𝑥 − ℎ) = 𝑓(𝑥) − 𝑓(ℎ) is true for all values of 𝑥 and ℎ. Justify
your reasoning.
c) Let ( ) 3xf x . Find a value for 𝑥 and a value for ℎ that makes 𝑓(𝑥 + ℎ) = 𝑓(𝑥) + 𝑓(ℎ) a true
number sentence.
8) Given the function 𝑓 whose domain is the set of real numbers, let 𝑓(𝑥) = 0 if 𝑥 is a rational number
and let 𝑓(𝑥) = 2 if 𝑥 is an irrational number.
a) Explain why 𝑓 is a function.
b) What is the range of 𝑓?
c) Evaluate 𝑓 for each domain value shown below.
𝑥 2/5 1 −3 √3 𝜋
𝑓(𝑥)
d) List four possible solutions to the equation 𝑓(𝑥) = 0.

Education Time Courseware Inc. Copyright 2014 Page 171
Unit 9 – Functions and Interval Notation
Homework 4: Foundations - Functions (F-IF.1, F-IF.2)
1) Which set of ordered pairs represents a function?
(1) { (1,6), (3,6), (3,8)} (3) { (5,3), (6,3), (7,3)}
(2) { (2,1), (6,5), (6,7), (5,0)} (4) {(3,5), (4,5), (3,7), (4,7)}
2) Match the type of function with the graphs shown.
1) Linear (A) (B)
2) Absolute value
3) Quadratic (C) (D)
4) Exponential
3) Which of the following graphs are functions? (Answer YES of NO)
a) b) c)
4) Determine if each relation is a function. (Answer YES or NO)
a) {(3,2), (4,3) (5,4)} c) d)
b) {(0,1), (0,2), (1,3),(1,4)}
e) { ( 1,2), (2,2), (3,2), (4,2) }
X Y
2 3
5 1
7 3
9 1
X Y
3 3
4 -3
4 3
5 -3

Education Time Courseware Inc. Copyright 2014 Page 172
Hw 4 continued
5) Determine whether the following relations are functions and state the domain and range of each.
a) (1,5),(1,10),(1,15){ } b) y = x2 c)
6) Which of the following graphs would describe 7) Which of the following 2 graphs
a bike trip if the biker rode slowly at first and represent the cost of a taxi trip if the
then increased speed? first ¼ mile costs $2 and every additional
¼ of a mile costs $2 more?
8) If a function f is defined by f(x) = 2x2 – 3, find
a) f(2) b) f(-3) c) f(a) d) f( a + b) e) f( 5 )
9) If a function g is defined by g(t) = 1
2
t
t
, find
a) g( 5) b) g( 1) c) g( -1) d) g( b)
10) Find the value of x such that if f(x) = 2x – 1 then f(x) = 7.

Education Time Courseware Inc. Copyright 2014 Page 173
Hw 4 continued
11) Which interval notation represents the set of all real numbers greater than 5 and less than or equal
to 15?
(1) (5,15) (2) (5,15]
(3) [5,15) (4) [5,15]
12) Which interval notation represents the set of all numbers greater than or equal to 8 and less than
16?
(1) [8,16) (2) (8,16]
(3) (8,16) (4) [8,16]
13) Which interval notation represents the set of all numbers from 4 through 9 inclusive?
(1) (4,9] (2) (4,9)
(3) [4,9) (4) [4,9]
14) Which graph is the best representation of the cooling of a very hot room once the air conditioner
is turned on?
(1) (3)
(2) (4)
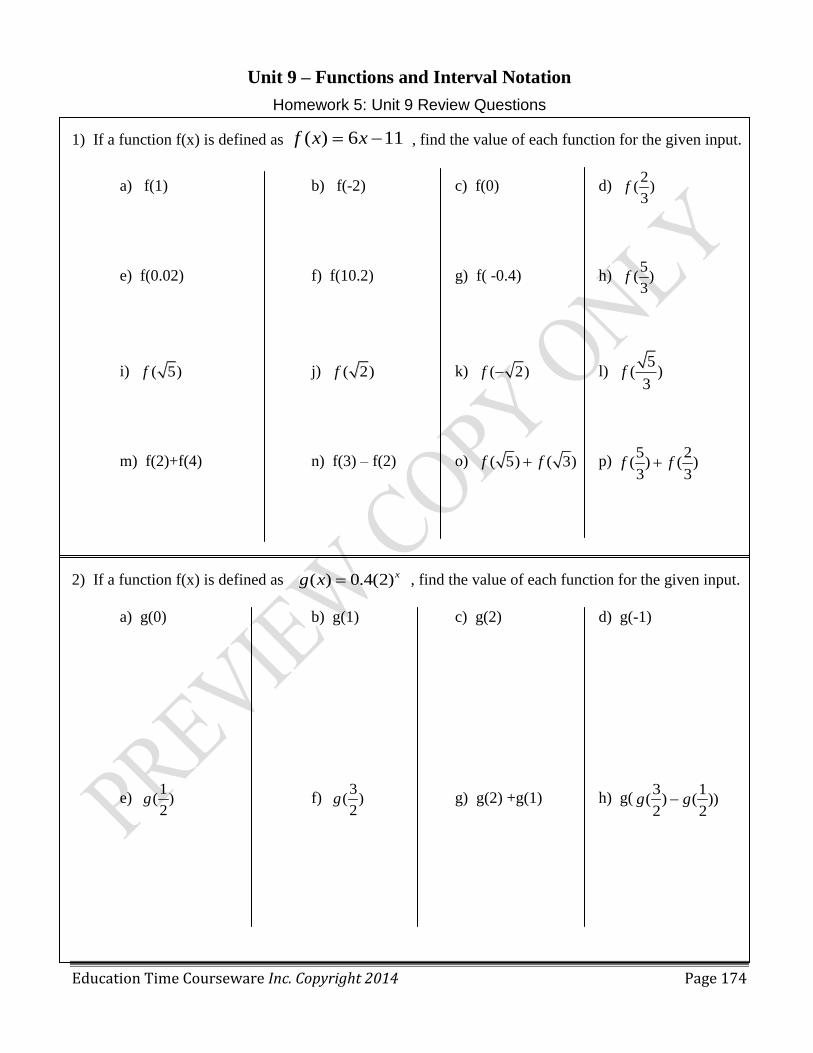
Education Time Courseware Inc. Copyright 2014 Page 174
Unit 9 – Functions and Interval Notation
Homework 5: Unit 9 Review Questions
1) If a function f(x) is defined as ( ) 6 11f x x , find the value of each function for the given input.
a) f(1) b) f(-2) c) f(0) d) 2
( )3
f
e) f(0.02) f) f(10.2) g) f( -0.4) h) 5
( )3
f
i) ( 5)f j) ( 2)f k) ( 2)f l) 5
( )3
f
m) f(2)+f(4) n) f(3) – f(2) o) ( 5) ( 3)f f p) 5 2
( ) ( )3 3
f f
2) If a function f(x) is defined as ( ) 0.4(2)xg x , find the value of each function for the given input.
a) g(0) b) g(1) c) g(2) d) g(-1)
e) 1
( )2
g f) 3
( )2
g g) g(2) +g(1) h) g(3 1
( ) ( ))2 2
g g

Education Time Courseware Inc. Copyright 2014 Page 175
Hw 5 continued
3) Provide a suitable domain and range to complete the definition of each function.
a) let f(x) = 7x - 2
b) let ( ) 2xf x
c) Let ( ) 550(3 )xb x where 𝐵(𝑥) is the number of bacteria at time 𝑥 hours over the course of one
day.
4) Officials in a town use a function, C, to analyze the number of cars that pass a certain intersection.
represents the rate of traffic through an intersection where n is the number of observed vehicles in a
specified time interval. What would be the most appropriate domain for the function? Explain your
choice.
1 2 4 7) {..., 2, 1,0,1,2,3,...} ) { 2, 1,0,1,2,3} ) {0, , ,1, , ,2} ) {0,1,2,3,...}
3 3 3 3a b c d

Education Time Courseware Inc. Copyright 2014 Page 176
x
y y y y
Unit 9 – Functions and Interval Notation
Homework 6: Cumulative Review Questions (Unit 9)
1) Which graph represents a function?
(1) (2) (3) (4)
2) Rhonda has $1.35 in nickels and dimes in her pocket. If she has six more dimes than nickels, which
equation can be used to determine x, the number of nickels she has?
(1) 0.05(x + 6) + 0.10x = 1.35 (3) 0.05 + 0.10(6x) = 1.35
(2) 0.05x + 0.10(x + 6) = 1.35 (4) 0.15(x + 6) = 1.35
3) If the formula for the perimeter of a rectangle is p = 2l + 2w, then w can be expressed as
(1) 2
2
l pw
(2)
2
2
p lw
(3)
2
p lw
(4)
2
2
p ww
4) Which value of x is the solution of 2 1 7 2
5 3 15
x x ?
(1) 3
5 (2)
31
26 (3) 3 (4) 7
5) Which value of x is in the solution set of the inequality -4x + 2 > 10 ?
(1) -2 (2) 2 (3) 3 (4) -4
6) Which interval notation represents the set of all numbers from 2 through 7, inclusive?
(1) (2,7] (2) (2,7) (3) [2,7) (4) [2,7]
x x x

Education Time Courseware Inc. Copyright 2014 Page 177
y 7) Which type of graph is shown in the accompanying diagram?
(1) absolute value (3) linear
(2) exponential (4) quadratic
8) The statement 4 + (-4) = 0 is an example of the use of which property of real numbers?
(1) associative (2) additive identity (3) additive inverse (4) distributive
9) Nicole’s aerobics class exercises to fast paced music. If the rate of the music is 120 beats per
minute, how many beats would there be in a class that is 0.75 hour long?
(1) 90 (2) 160 (3) 5400 (4) 7200
10) Which relation represents a function?
(1) { (1,4), (2,5), (1,6)} (3) { (3,0), (5,4), (5, -2)}
(2) { -4,5), (-4,7), (-11,9), (-13,6)} (4) {(-5,6), (-7,5), (-3, 6), (-8,5)}
11) Which of the following homework problems are equations? Justify your answer.
(1) 2x3 – 4x
2 (2) 6 – 3x = 6x (3) 3(2x – 7) (4) 5x
2 + 3x - 2x
2 +3 (5)
3 1
4 8
x
12) Peter begins his kindergarten year able to spell 10 words. He is going to learn to spell 2 new words
every day.
Write an inequality that can be used to determine how many days, d, it takes Peter to be able to
spell at least 75 words.
Use this inequality to determine the minimum number of whole days it will take for him to be able to
spell at least 75 words.
13) Which expression is equivalent to 4 3( )a
7 12 64(1) (2) (3) (4)a a a a

Education Time Courseware Inc. Copyright 2014 Page 178
14) Given the graph of f(x), sketch the following graphs:
a. f(x) + 2
b. f(x) – 3
c. 2f(x)
15) The graph of g(x) is given for the values -5 x 5.
Find the following
a) The domain of g(x).
b) The range of g(x).
c) Is g(x) a function?
d) g( 0) = ?
e) g( 3) = ?
f) if g(x) = 3, find x.
g) How many values of x satisfy g(x) = 1?
h) What is the maximum value of g(x)?
i) How many roots does g(x) have?
16) Administrators at a school use a function, I, to assign each student a unique identification number.
I(n) represents the id number assigned to the student and n is the students in your school. What
would be the most appropriate domain for the function? What would be the most appropriate range
for the function?
17) Express the product of 2x2 + 7x - 10 and x + 5 in standard form.

Education Time Courseware Inc. Copyright 2014 Page 179
Unit 10 – The Graph of Functions
Homework 1: Interpreting the Graph of a Function (F-IF.1, F-IF.2, F-IF.4, F-IF.6)
1) Identify the rate of change in each of the following and state how you arrived at that answer.
a) b)
Draw the diagram when n = 4
2) Identify the rate of change and the domain and range for each graph below.
a) b)
3) John left his home and walked 3 blocks to his
school, as shown in the accompanying graph.
a) What is one possible interpretation of the section
of the graph from point B to point C?
b) Between which two points was he walking the fastest?
Explain how you arrived at that decision.
x f(x)
-20 -37
-15 -27
-10 -17
-5 -7
0 3

Education Time Courseware Inc. Copyright 2014 Page 180
4) An electronic store has 20 CD players in stock. The manufacturer ships these in boxes of 12 Cd
players per box. Write a linear function that relates the number of boxes to the total number of CD
players in the store. Graph the function. State the domain of the function.
a) Identify the dependent variable
b) Identify the independent variable
c) Graph the function
d) State the domain of the function
5) Tom walks away from his house at a speed of 2 meters per second. He walks for 50 seconds.
At 100 meters from home Tom starts to walk towards home. He walks for 60 meters at a speed of 3
meters per second. Tom now changes direction and is now walking away from home at a fast pace.
His speed is 4 meters per second. He walks at this speed for 30 seconds. After Tom has walked for
160 meters in 100 seconds, he stops and rests for 20 seconds.
a) Identify the dependent variable
b) Identity the independent variable
c) Create a table of values
d) Graph the results showing his walk
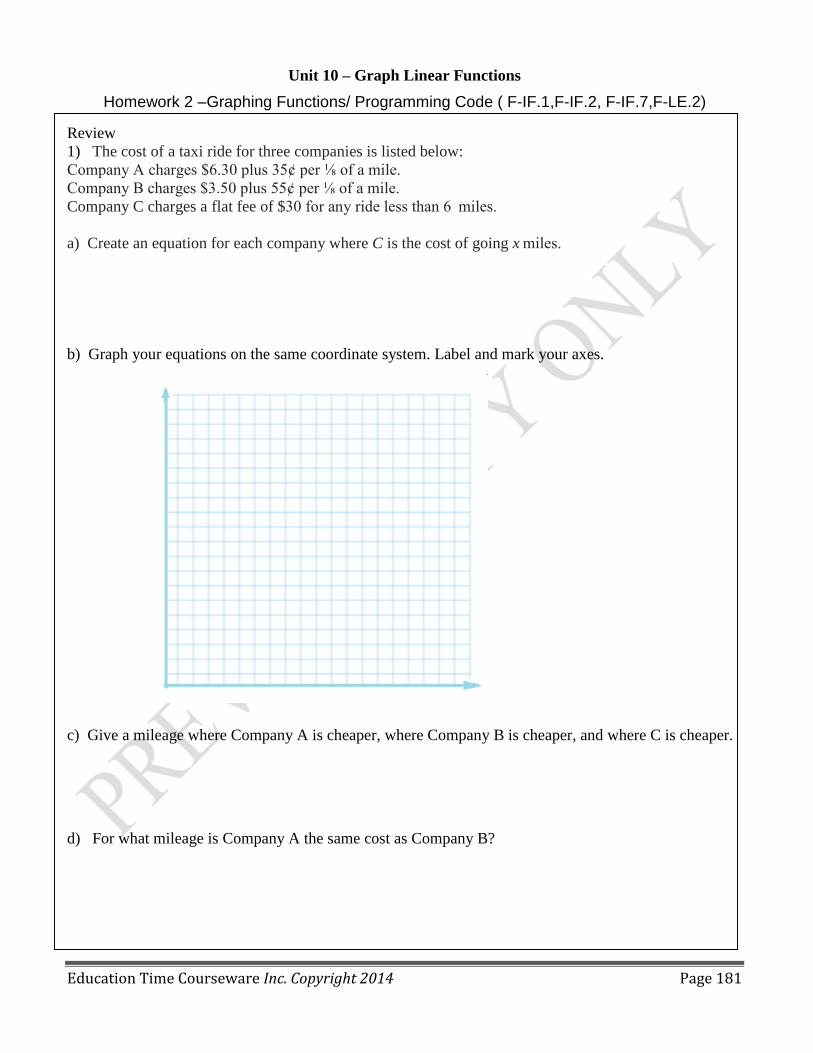
Education Time Courseware Inc. Copyright 2014 Page 181
Unit 10 – Graph Linear Functions
Homework 2 –Graphing Functions/ Programming Code ( F-IF.1,F-IF.2, F-IF.7,F-LE.2)
Review
1) The cost of a taxi ride for three companies is listed below:
Company A charges $6.30 plus 35¢ per ⅛ of a mile.
Company B charges $3.50 plus 55¢ per ⅛ of a mile.
Company C charges a flat fee of $30 for any ride less than 6 miles.
a) Create an equation for each company where C is the cost of going x miles.
b) Graph your equations on the same coordinate system. Label and mark your axes.
c) Give a mileage where Company A is cheaper, where Company B is cheaper, and where C is cheaper.
d) For what mileage is Company A the same cost as Company B?

Education Time Courseware Inc. Copyright 2014 Page 182
Hw 2 continued
2) a) Perform the instructions for the following programming code as if you were a computer and your
paper was the computer screen.
Declare x integer
Let f(x)= 3x - 1
Initialize G as {}
For all x from -1to 2
Append( x , f(x) ) to G
Next x
Plot G
b) Write three or four sentences describing in words how the
thought code works.
3) Perform the instructions for the following programming code as if you were a computer and your
paper was the computer screen.

Education Time Courseware Inc. Copyright 2014 Page 183
Hw 2 continued
4) Perform the instructions for the following programming code as if you were a computer and your
paper was the computer screen.
a)

Education Time Courseware Inc. Copyright 2014 Page 184
Hw 2 continued
5) Answer the following questions about the thought code:
a) What is the domain of the function f?
b) Plot the graph of f according to the instructions in the thought code.
c) Look at your graph of f. What is the range of f?
d) Write three or four sentences describing in words how the thought code works.

Education Time Courseware Inc. Copyright 2014 Page 185
Unit 10 – Graph Linear Functions
Homework 3 – Piecewise Functions (F-IF.6, F-IF.7, F-BF.3)
1) The graph of a piecewise function f is shown to the right. The domain of 𝑓 is 2 5x
a. Create an algebraic representation for 𝑓. Assume that the graph of 𝑓 is composed of straight line
segments.
b) Sketch the graph of 𝑦 = (𝑥-2) and state
the domain and range.
c) Sketch the graph of 𝑦 = 2(𝑥) and state the domain and range.
d) Sketch the graph of 𝑦 = (2𝑥) and state the domain and range.
e) How does the domain of 𝑦 = (𝑥) compare to the domain of 𝑦 = (𝑘𝑥), where 𝑘 > 1?

Education Time Courseware Inc. Copyright 2014 Page 186
2 1 2
5 4 2
x xf x
x x
Hw 3 continued
2) Sketch the graph of
3) Sketch the graph of
4) Mary went online to find the cost of mailing a package to her friend Jessica. She found the following
chart of cost for mailing a package using regular mail from her location to Jessica’s home
Write the equation that represents this data.
Graph the data.

Education Time Courseware Inc. Copyright 2014 Page 187
Unit 10 – Graph Linear Functions
Homework 4 – Transformations of Functions with Parent Graphs (F-IF.4, F-BF.3)
Review
1) Graph each of the function below WITHOUT using your graphing calculator.
a) 2y x b) | |y x
c) y x d) 1
yx
e) 3y x f) y x (greatest integer function)

Education Time Courseware Inc. Copyright 2014 Page 188
Hw 4 continued
2) Graph 2xy and graph the following and explain what transformation takes place.
a. 12 xy
b. 12 xy
Observation (Conclusion)
______________________________________________
______________________________________________
3) Graph 2xy and graph the following and explain what transformation takes place.
a. 2)1( xy
b. 2)1( xy
Observation (Conclusion)
_______________________________________________
_______________________________________________
4) Graph 2xy and graph the following and explain what transformation takes place.
a. 2xy
Observation (Conclusion)
________________________________________________
________________________________________________

Education Time Courseware Inc. Copyright 2014 Page 189
Hw 4 continued
5) Graph 2xy and graph the following and explain what transformation takes place.
a. 22xy
b. 2
2
1xy
Observation (Conclusion)
________________________________________________
________________________________________________
6) Graph y x and graph the following and explain what transformation takes place.
a. xy
b. y x
Observation (Conclusion)
_________________________________________________
_________________________________________________
7) Graph y x and graph the following and explain what transformation takes place.
a) 2y x
b) 1
2y x
Observation (Conclusion)
_________________________________________________
_________________________________________________

Education Time Courseware Inc. Copyright 2014 Page 190
Unit 10 – Graph Linear Functions
Homework 5: Transformations of Functions – Sketching Graphs (F-IF.4, F-BF.3, F-LE.2, F-IF.7)
Review
Explain what transformation happens to f(x) for each of the followings where c is a constant
1) a. y = f(x) + c ___________________________________________________
b. y = f(x) – c ___________________________________________________
c. y = f(x + c) ___________________________________________________
d. y = f(x – c) ___________________________________________________
e. y = 2f(x) ____________________________________________________
f. y = ½ f(x) ____________________________________________________
g. y = - f(x) _____________________________________________________
h y = f(-x) _____________________________________________________
2) Graph each of the following without your calculator.
a) 1y x b) 1 2y x

Education Time Courseware Inc. Copyright 2014 Page 191
Hw 5 continued
3) Graph each of the following without your calculator.
a) | 2 |y x b) | 1 | 2y x
c) | | 1y x d) 2 | |y x
e) 2y x f) 1y x

Education Time Courseware Inc. Copyright 2014 Page 192
Hw 5 continued
4) Write a new equation according to the transformations given on the parent equation.
a. y x Shift right 4, shift down 2
New equation ___________________________________________________
b. 3y x reflect over x-axis, shift up 1
New equation ___________________________________________________
c. Use 3y x and sketch the graph of 3( 2) 4y x
d) Use y = y x and sketch the graph of 2 1y x

Education Time Courseware Inc. Copyright 2014 Page 193
Unit 10 – Graph Linear Functions
Homework 6 - Concept Connectors (F-IF.4, F-BF.3, F-LE.2)
1. Given the graph of f(x) as shown below over the domain 3 6x
a. )()(1 xfxf b. )()(2 xfxf c. 1)()(3 xfxf
d. )1()(4 xfxf e. )2()(5 xfxf f. 6 ( ) ( ) 1f x f x
g. )2()(7 xfxf h.
22
1)(8
xfxf

Education Time Courseware Inc. Copyright 2014 Page 194
Unit 10 – Graph Linear Functions
Homework 7: Foundations – Slopes of Linear Equations (F-IF.4, F-IF.6)
1) Find the slope of each line through the given points.
a) (3,7) and (6,10) b) ( -2, 1) and (7, 1) c) ( 2, -4) and ( 4, -12)
d) (6, 8) and (6, -2) e) f)
2) What is the slope of each of the following lines?
a) y = -2x + 4 b) y – x = 2 c) 3y – 4x = 9 d) 2x – 5y = 6
3) For each of the following write the equation of the line in slope-intercept form.
a) Write the equation of a line parallel to the x-axis through the point (3 , 6).
b) Write the equation of the line parallel to y = 2x – 3 with a y-intercept of 5.
c) Write the equation of the line parallel to the y-axis through the point ( -2, -6).
d) Write the equation of the line having a slope of 3 and passing through the point (-2, 4).
4) Which point lies on the line whose equation is 3x – 4y = 5?
(1) ( 0 , 2) (2) (2 , 1) (3) (3 , 1) (4) (1 , -1)

Education Time Courseware Inc. Copyright 2014 Page 195
Hw 7 continued
5) Which linear equation represents a line containing the point (2,-2)?
(1) x + y = 4 (2) x – y = 4 (3) 2x + 2y = 4 (4) 2x – y = 2
6) What is the equation of the line that has a slope of -4 and passes through the point (3 , -2)
(1) y = -4x + 10 (2) y = -4x – 10 (3) y = -4x + 5 (4) y = -4x - 14
7) If point is on the line whose equation is , what is the value of b?
8) A line having a slope of passes through the point . Write the equation of this line in slope-
intercept form.
9) What is an equation of the line that passes through the point and has a slope of 2?
10) Which linear equation represents a line containing the point (1, 3)?
11) Write the equation that represents the line that passes through the point (3, 4) and is parallel to
the x-axis?
12) Write the equation of a line that is perpendicular to the equation 2 3 6x y and passes through the
point (4,1).

Education Time Courseware Inc. Copyright 2014 Page 196
Unit 10 – Graph Linear Functions
Homework 8: Unit 10 Review
1a) Perform the instructions for the following programming code as if you were a computer and your
paper was the computer screen.
Declare x integer
Let f(x)= 4x +3
Initialize G as {}
For all x from -1to 2
Append( x , f(x) ) to G
Next x
Plot G
b) Write three or four sentences describing in words how the thought code
works.
2) Perform the instructions for the following programming code as if you were a computer and your
paper was the computer screen.
Declare x integer
For all x from -2 to 3
Print 3x2
Next x
3) The graph of a piecewise function f is shown to the right.
The domain of 𝑓 is 6 7x
a. Create an algebraic representation for 𝑓. Assume that
the graph of 𝑓 is composed of straight line segments.
b) Sketch the graph of 𝑦 = (𝑥-2) and state
the domain and range.
c) Sketch the graph of 𝑦 = 2(𝑥) and state the domain and
range.
d) How does the domain of 𝑦 = (𝑥) compare to the
domain of 𝑦 = k(𝑥), where 𝑘 > 1?

Education Time Courseware Inc. Copyright 2014 Page 197
Hw 8 continued
4) Sketch the graph of
5) Eva and James live at opposite ends of the hallway in their apartment
building. Their doors are 40 feet apart. They each start at their door
and walk at a steady pace towards each other and stop when they meet.
Suppose that:
Eva walks at a constant rate of 2 feet every second.
James walks at a constant rate of 3 feet every second.
a. Graph both people’s distance from Eva’s door versus time
in seconds.
b. According to your graphs, approximately how far will they
be from Eva’s door when they meet?
3 1 2
2 3 2
x xf x
x x

Education Time Courseware Inc. Copyright 2014 Page 198
Unit 10 – Graph Linear Functions
Homework 9: Cumulative Review Questions (Unit 10)
1) What is the equation of the line that passes through the points (3,-3) and (-3,-3)?
(1) y = 3 (2) x = -3 (3) y = -3 (4) x = y
2) What is the value of x in the equation 2 26
3x x ?
(1) -8 (2) 1
8 (3)
1
8 (4) 8
3) What is the speed, in meters per second, of a paper airplane that flies 24 meters in 6 seconds?
(1) 144 (2) 30 (3) 18 (4) 4
4) What is the slope of the line that passes through the points (2,5) and (7,3)?
(1) 5
2 (2)
2
5 (3)
8
9 (4)
9
8
5) Which value of p is the solution of 5p – 1 = 2p + 20?
(1) 19
7 (2)
19
3 (3) 3 (4) 7
6) Which graph represents a linear function?
(1) (2) (3) (4)
7) Which property is illustrated by the equation b(x – y) = bx – by?
(1) associative (2) inverse (3) commutative (4) distributive

Education Time Courseware Inc. Copyright 2014 Page 199
Practice 10 continued
8) The accompanying table represents the number of hours a student worked and the amount of money a
student earned. Write an equation that represents the number of dollars, d, earned in terms of the number
of hours, h, worked.
Using this equation, determine the number of dollars the
student would earn for working 40 hours.
9) On the grid, solve the system of equations graphically for x and y 2x – y = 6
2y = -x + 8
and check your answers.
10) The line graph shows temperatures in
Celsius over the year in Jamaica.
a) Which month had the highest
temperature?
b) Which month had the lowest
temperature?
c) What is the difference in temperature
between March and May?
d) How many months have a temperature
higher than 32 degrees Celsius?
11) The function f has a domain of {1, 3, 5, 7} and a range of {2, 4, 6}.
Could f be represented by {(1,4), (3,6), (5,2), (7,2)}?
Justify your answer.
Number of hours (h) Dollars earned (d)
8 $50.00
15 $93.75
19 $118.75
30 $187.50

Education Time Courseware Inc. Copyright 2014 Page 200
Unit 11 – Foundations – Rational Expressions
Homework 1: Rational Expressions ( & ) (A-APR.1, A-APR.2, A-APR.6, A-APR.7)
REVIEW
1) Factor completely
a) 5y2 – 125 b) 3ax
2 – 12ax –15a c) 2x
2 + 3x – 2
2) For what value(s) of x is the rational expression undefined?
a) 3
2x b)
3
5
x
x
c)
4
x d)
2
4
9x e)
2
2
1
6
x
x x
3) Express each expression in simplest form with positive exponents only.
a) 3 5
4 3
10
15
x y
x y b)
2 3
2 2 3
9
3
x y z
x y z c)
2
2
16
4
x
x x
d)
2
2
2 8
2 8
y y
y
4) Perform the indicated operation and reduce to lowest terms.
a) 2 4 2 2
3 3 3
5 9
3 20
x y y z
y z xy b)
2 9 4
2 6 3
x x
x x
c) 2 23 2 1
5 10 10 10
x x x
x x
d)
2
2
6 3 6
4 5
x x x
x x

Education Time Courseware Inc. Copyright 2014 Page 201
HW 1 – continued
e. 2 23 2 1
6 4 6 6
y y y
y y
f.
2 2
2
16 5 6
10 40 6 8 2
x x x
x x x
Express each in simplest form.
5) 3 9 2 2
5 3 2
15 10
3 6
x y x y
y z z 6)
2
3
5 7 10
25 2
x x x
x x x
7) Find the area of a rectangle whose length is 2 9
3
x
x
and whose width is
2
4 16
7 12
x
x x
.

Education Time Courseware Inc. Copyright 2014 Page 202
Unit 11 – Foundations – – Rational Expressions
Homework 2: Rational Expressions (Addition & Subtraction) (A-APR.1, A-APR.7)
REVIEW
1) For what value(s) of x is the rational expression undefined? 2
1
4
x
x
2) Express in simplest form: 3 23 2x x x
x
3) Perform the indicated operation and reduce to lowest terms: 2
2 2
12 6 2
20 3 75
x x x
x x x
4) Express in simplest terms.
a) 6 2
5 5x x b)
7 14
2 2
x
x x
c)
2 3 3 5
2 10 2 10
y y y
y y
d) 4 2
3 5
x x e)
3 2
4x x f.)
2
3 2
y y
g) 3 3
2x x
h)
5 2
3y y
i)
2
5
25 5
y
y y

Education Time Courseware Inc. Copyright 2014 Page 203
HW 2– continued
j) 2
2 1
2 3 3
x
x x x
k)
2 2
6 3
4 3 7 12y y y y
l) 2
3 3 2
1 1 1
x
x x x
m)
2 2
2
8 12 2
y
y y y y
Express in simplest terms.
5) 7 14
2 2
x
x x
6)
2
22
1x
7) Find the perimeter of the rectangle whose length is 1x
x
and whose width is
2
2
x ?

Education Time Courseware Inc. Copyright 2014 Page 204
Unit 11 – Foundations – – Rational Expressions
Homework 3: Solving Fractional Equations (A-ARP.1, A-ARP.7, A-REI.2)
REVIEW:
Express each of the following in simplest terms:
1)2 2
2
6 16 5 5
5 109 8
x x x x
xx x
2)
2 2
7 6
49 2 35y y y
3) Solve each equation and check.
a) 5 2
2 3
x
x
b)
8 6
2 4x x
c)
3 2 1
3 2 2
x
x
d) 1 3 28
3 5 x e)
3 1 1
2 2y y f)
7 1 5
9 6x
g) 2
4 3
x x
x x
h)
2 1 1
2 5 3
y y
y y
i)
2 3 4
2 4 2
y
y y

Education Time Courseware Inc. Copyright 2014 Page 205
HW 3 continued
4) Find the solution set of each of the following.
a) 1 1 1
5 10x x b)
2 1 2
3 6 x c)
1 4
6 3 6
x
x x
5) Solve each equation and check.
a) 2
4 1 1
2 4 2x x x
b)
2 86
3 3x x

Education Time Courseware Inc. Copyright 2014 Page 206
Unit 12 – Quadratic Functions
Homework 1: Factoring Polynomial Expressions (A.SSE.2)
1) Find the product of each.
A) 4( x + 5) B) 3x( x2 – 2x + 5) C) 2a
2b
3( 5ab
2 – 7a)
D) ( x + 2)( x + 3) E) ( 2x – 5) ( x – 2) F) ( x+ 3) ( x - 3)
G) (3x – 2)( x2 + 4x – 5) H) ( 4x
2 + 3x -1) ( 2x
2 – 4x + 5)
I) 2(3 )x J) 2(2 3) 3)x x
2) Factor each. a) 4x + 8 b) 12a + 15 c) 2ax - 7a
d) 5ax + 15 e) 6x2 - 9x f) 4x
3 – 8x + 4 g) 25x
4y
2 – 10x
2y
h) 2 2x y xy i) 3 25 10 15y y j) ( ) ( )a x y b x y k) ( ) y(x y)x x y
3) Factor each:
a) x2 – 25 b) 2 36a c) 4x
2 – 49 d) 16x
2 – 9y
2
e) 2 2425
9x y f) 9 – x
2 g) x
2 – y
2 h) 225 a
i) 2 2
9 4
x y j) 2 2a b k) 20.25 0.64x l) 21
19
x

Education Time Courseware Inc. Copyright 2014 Page 207
Hw 1 continued
4) Factor each.
a) x2 + 7x + 10 b) y
2 – 9y + 18 c) x
2 - 2x –15
d) y2 + 7y – 18 e) x
2 - x – 42 f) y
2 + 25y + 150
g) 24 4 1x x h) 4 2 2 42a a b b i) 2 2 42r rs s
5) Factor completely a) 3x2 – 12 b) ay
2 – 64a
c) 2x2 – 2x – 12 d) 3x
2 – 9x – 30 e) x
4 – y
4
f) 5y3 – 10y
2 – 75y g) 3 21
9x xy h) ax
2 – 5ax + 4a

Education Time Courseware Inc. Copyright 2014 Page 208
Unit 12 – Quadratic Functions
Homework 2: Geometric Applications using Polynomials (A-APR.1, A-APR.7, F-BF.1A, F-IF.8A)
Review:
1) Factor completely:
2 2 2 4 4 24) 9 48 64 ) ) 36 24 5
25a x xy y b x x y c x x
2) Find the product of each.
A) 4( x + 5) B) 3x( x2 – 2x + 5) C) 2a
2b
3( 5ab
2 – 7a)
D) ( x + 2)( x + 3) E) ( 2x – 5) ( x – 2) F) ( x+ 3) ( x - 3)
G) (3x – 2)( x2 + 4x – 5) H) ( 4x
2 + 3x -1) ( 2x
2 – 4x + 5)
3) Use algebra to explain how you know that a rectangle with side lengths three less and three
more than a square will always be 9 square unit smaller than the square. What is the
difference if the sides are 4 more and 4 less?
4) The length of a rectangle is 7 more than its width. If x represents the width of the rectangle represent
the perimeter of the rectangle in terms of x.
5) The length of a rectangle is represented by 3x – 1 and the width by 3x, represent the area of the
rectangle as a polynomial in simplest form.

Education Time Courseware Inc. Copyright 2014 Page 209
Hw 2 continued
6) The measure of the base of a triangle is represented by 6x+1 and the height is 3x, represent the area of
the triangle as a polynomial in simplest form.
7) a) Express the area of the outer rectangle in terms of x.
b) Express the area of the inner rectangle in terms of x.
c) Express the area of the shaded region as a polynomial in simplest form.
8) a) Express the area of the outer rectangle in terms of x.
b) Express the area of the inner rectangle in terms of x.
c) Express the area of the shaded region as a polynomial in simplest form.
9) A playground in a local community consists of a rectangle and two semicircles, as shown in the
diagram below.
Write an expression that represents the amount of fencing, in yards, that would be needed to
completely enclose the playground?

Education Time Courseware Inc. Copyright 2014 Page 210
Unit 12 – Quadratic Functions
Homework 3: Factoring Strategies (A-APR.1, A-APR.7, F-BF.1A, F-IF.8A, A-SEE.3)
Review
1) Find the product and simplify each. a) 23 (2 5 )x x x b) 2 3 35 (3 4 )a b ab a b
c) 2 3 2(4 )m n d) (3x – 4y)(3x + 4y) e) ( 3x – 2)(x + 5) f) (5x – 3)2
2) Factor each completely: a) 6ax2 – 9ax b) x
2 – 81 c) x
2 + 4x – 12
d) 2 24121
25x y e) 2x
2 + 6x – 36 f) x
2 – x – 20
g) x2 +8x + 7 h) x
2 – 17x + 72 i) x
2 - 11x +30
3) Factor a) 2x2 + 7x –15 b) 3x
2 – 7x + 2 c) 5x
2 + 13x – 6
d) 6x2 + 7x – 5 e) 10x
2 +17x +3 f) 6x
2 + 11x –10
g) 12x2 + 8x – 15 h) 6x
2 – 26x – 20 i) 22 6
5 5 5
xx

Education Time Courseware Inc. Copyright 2014 Page 211
Hw 3continued
4) Use the structure of these expressions to factor completely.
2 2 4 2) 4 12 7 ) 9 12 4 ) 4 5a x x b x x c x x
5) Use algebra to explain how you know that a rectangle with side lengths five less and five
more than a square will always be 25square unit smaller than the square. What is the
difference if the sides are 2 more and 2 less?
6) A contractor needs 54 square feet of brick to construct a rectangular walkway. The length of the walkway is 15
feet more than the width. Write an equation that could be used to determine the dimensions of the walkway.
Solve this equation to find the length and width, in feet, of the walkway.
7) The area of the rectangle below is represented by the expression12𝑥2 + 12𝑥 + 3 square units.
Write two expressions to represent the dimensions, if the length is known to be three times the width.
8) Jack is building a rectangular dog pen that he wishes to enclose. The width of the pen is 2 yards less
than the length. If the area of the dog pen is 15 square yards, how many yards of fencing would he
need to completely enclose the pen?

Education Time Courseware Inc. Copyright 2014 Page 212
Unit 12 – Quadratic Functions
Homework 4: Solving Quadratic Equations (A-SSE.3, A-APR.3, A-REI.4B, F-IF.8)
Review:
1) Factor completely:
2 2 2 4 4 29) 9 48 64 ) ) 36 24 5
16a x xy y b x x y c x x
2) The accompanying diagram shows a square with side y inside a square with side x.
Express the area of the shaded region as a polynomial in terms of x and y
3) Solve each equation and check:
a) x2 – 5x –14 = 0 b) x
2 + 21 = 10x c) x
2 – 49 = 0
d) x2 –5x = 0 e) 3x
2 +13x –10 = 0 f) 2x
2 – 10x – 12 = 0
g) 3x2 + 2x – 1 = 0 h) 15x
2 – 10x = 0 i) x(x – 5) + 4 = 0
j) x2 – 7x + 6 = 0 k) x
2 + 8x + 15 = 0 l) x
2 – 3x - 10 = 0
m) 2x2 + 7x + 6 =0 n) x
2 – 4x = 0 o) 25x
2 – 9 = 0

Education Time Courseware Inc. Copyright 2014 Page 213
Unit 12 – Quadratic Functions
Homework 5: Solving Quadratic Equations (A-SSE.3, A-APR.3, A-REI.4B, F-IF.8)
Review:
1) Solve each equation for x:
a) 3x2 +10x + 3=0 b) 2y
2 + 11y + 5=0 c) 5x
2 – 3x =8 d) 6x
2 + 5x = 4
2) Solve :
3) Amy tossed a ball in the air in such a way that the path of the ball was modeled by the
equation . In the equation, y represents the height of the ball in feet and x is the
time in seconds. At what values of x does the ball hit the ground?
4) An arch is built so that its shape can be represented by a parabola with the equation ,
where y is the height of the arch. Find the width of the arch at its base.
2 2 2) 9 1 5 ) 8 4 ) 5 125 0a x b x c x
2 2 22) 4 5 11 ) 12 0 ) 6 3 15
3d x e x f x
2 2 2) 2( 3) 12 ) 5( 6) 1 19 ) 10 ( 2) 6g x h x i x

Education Time Courseware Inc. Copyright 2014 Page 214
Unit 12 – Quadratic Functions
Homework 6: Creating Quadratic Equations (A-APR.3, A-REI.4B, F-IF.8, F-BF.1, F-LE.3)
Review:
1) Solve:
2) Find three consecutive positive integers such that the square of the first is 45 more than the sum of the
second and the third.
3) One positive number is 5 more than another. Their product is 36. What are the numbers?
4) Find three consecutive positive integers such that the square of the first is 12 more than the sum of the
second and the third.
5) The area of the rectangular playground enclosure at South School is 500 square meters. The length of the
playground is 5 meters longer than the width. Find the dimensions of the playground, in meters. [Only an
algebraic solution will be accepted.]
6) A contractor needs 54 square feet of brick to construct a rectangular walkway. The length of the
walkway is 15 feet more than the width. Write an equation that could be used to determine the
dimensions of the walkway. Solve this equation to find the length and width, in feet, of the walkway
2 2 225) 1 ) ( 3) 1 8 ) 4 ( 2) 2
4a x b x c x

Education Time Courseware Inc. Copyright 2014 Page 215
Unit 12 – QUADRATICS
Homework 7: Graphs of Quadratic Functions (A-APR.3, A-REI.4B, F-IF.8A, F-IF.7C)
Review:
1) Find the roots of the following equations:
a) x2 – 7x + 6 = 0 b) x
2 + 8x + 15 = 0 c) x
2 – 3x - 10 = 0
d) 2x2 + 7x + 6 =0 e) x
2 – 4x = 0 f) 25x
2 – 9 = 0
2) Answer the following questions based on the graph below:
Graph A Graph B Graph C
a) State the x-intercepts:
b) State the y-intercept:
c) Vertex:
d) Sign of the leading coefficient:
e) Does the vertex represent a minimum or maximum?
f) Find two x values that have symmetry with the axis of symmetry
g) State the equation of the axis of symmetry.
h) Describe the end behavior.
Graph A Graph B Graph C

Education Time Courseware Inc. Copyright 2014 Page 216
Hw 7 continued
3) Answer the following questions based on the graph below:
a) Interval where the function is increasing.
b) Interval where the function is decreasing.
c) Average Rate of Change on an Interval [1,3]
d) Average Rate of Change on an Interval [3,4]
4) Compare the two graphs below
a) Explain the differences between their key features.
b) Explain the similarities between their key features.
5) Compare the two graphs below
a) Explain the differences between their key features.
b) Explain the similarities between their key features.

Education Time Courseware Inc. Copyright 2014 Page 217
Unit 12 – QUADRATICS
Homework 8: Graphing Functions from Factored Form (A-APR.3, A-REI.4B, F-IF.8A, F-IF.7C)
Review:
1) Solve the following equations: 2 2 2 2) 16 9 ) 5 6 ) 2 12 5 ) 3 17 10a x b x x c x x d x x
2) Compare the two graphs below
a) Explain the differences between their key features.
b) Explain the similarities between their key features.
3) Find the x intercepts for each of the following using algebraic techniques.
2 2 2) ( ) 21 10 ) ( ) 25 ) ( ) ( 5) 4 ) ( ) 3 16 5a f x x x b g x x c h x x x d k x x x
4) Find the y intercept for each of the following using algebraic techniques.
5) Given the equation ( ) ( 2)( 3)f x x x
a) State the x-intercepts:
b) State the y-intercept:
c) State the equation of the axis of symmetry
d) State the vertex
e) Is the vertex a maximum or a minimum?
f) Graph the equation
2 23 2) ( ) 5 1 ) ( ) ( 3) 2 ) ( ) 3
4 3a f x x x b g x x x c h x x x

Education Time Courseware Inc. Copyright 2014 Page 218
Hw 8 continued
6) Given the equation 2( ) 2 6 36g x x x
a) State the x-intercepts:
b) State the y-intercept:
c) State the equation of the axis of symmetry
d) State the vertex
e) Is the vertex a maximum or a minimum?
f) Graph the equation.
7) Given the equation ( ) 2( 3)( 1)h x x x
a) State the x-intercepts:
b) State the y-intercept:
c) State the equation of the axis of symmetry
d) State the vertex
e) Is the vertex a maximum or a minimum?
f) Graph the equation.
8) Given the equation 2( ) 9h x x
a) State the x-intercepts:
b) State the y-intercept:
c) State the equation of the axis of symmetry
d) State the vertex
e) Is the vertex a maximum or a minimum?
f) Graph the equation.

Education Time Courseware Inc. Copyright 2014 Page 219
Hw 8 continued
9) A rocket shot into the air attains a height that can be described by the equation y = -16x2 + 240x
where y is the height of the rocket in feet and x is the time in seconds after launch. What is the
maximum height of the rocket and when will it hit the ground?
10) A coin is thrown upward from the top of a platform and the height of the coin is represented by the
equation y = -4.9x2 + 19.6x + 300 where y represents the height in meters and x represents the time
in seconds. What is the coin’s maximum height to the nearest tenth of a meter? How long, to the
nearest tenth of a second, will the coin stay in the air?
11) A diver’s position above the water is represented by the equation y = -16t2 +32t + 48 where t
represents the time in seconds and y represents the height in feet above the water. Find the greatest
height the diver attains and how many seconds will elapse before the diver enters the water?
12) Future projection for sales of a company are modeled by the equation s = 2x2 – 24x +100 where s is
in thousands of dollars and x is the number of months in the future. (0 ≤ x ≤ 24). What is the
minimum amount of sales expected according to the model? In how many months will this
minimum amount occur?

Education Time Courseware Inc. Copyright 2014 Page 220
Unit 12 – QUADRATICS
Homework 9: Interpreting Quadratic Functions (F-LE.3 A-REI.4B, F-IF.8A, F-IF.7C)
Review
1) Given the equation ) 3( 4)( 2)fx x x
a) State the x-intercepts:
b) State the y-intercept:
c) State the equation of the axis of symmetry
d) State the vertex
e) Is the vertex a maximum or a minimum?
f) Graph the equation.
2) A Projects projected profit is represented in the
graph below where y is the profit in millions of
dollars and x is the number of months of operation.
a) How many months will it take for the company
to achieve its maximum profit?
b) When is the first time the company showed a
profit? Explain your answer.
c) Estimate the value of 𝑃(0) and explain what
the value means in the problem and how this
may be possible.
d) How long will it take the company to make a profit of 8 million dollars?
e) Find the domain that will only result in a profit for the company and find its corresponding range of
profit.
f) Choose the interval where the profit is increasing the fastest:
[3,4.5] [4.5,6] [7.5,9]

Education Time Courseware Inc. Copyright 2014 Page 221
Hw 9 continued
3) Jim and Kevin each threw a baseball into the air.
The vertical height of Jim’s baseball is represented by the graph 𝑷(𝒕) below. 𝑷 represents the
vertical distance of the baseball from the ground in feet and 𝒕 represents time in seconds.
The vertical height of Kevin’s baseball is represented by the table values k(t) above.
𝑲(𝒕) represents the vertical distance of the baseball from the ground in feet and 𝒕 represents
time in seconds.
Use the above functions to answer the following questions.
a) Whose baseball reached the highest? Explain your answer.
b) Whose ball reached the ground fastest? Explain your answer.
c) Jim claims that his ball reached its maximum faster than Kevin’s? Is his claim correct or
incorrect? Explain your answer.
d) Find 𝑷(𝟎) and 𝑹(𝟎) values and explain what it means in the problem. What conclusion can
you make based on these values? Did they throw the ball from the same place? Explain
your answer.
e) Kevin claims that he can throw the ball higher than Jim. Is his claim correct or incorrect?
Explain your answer.
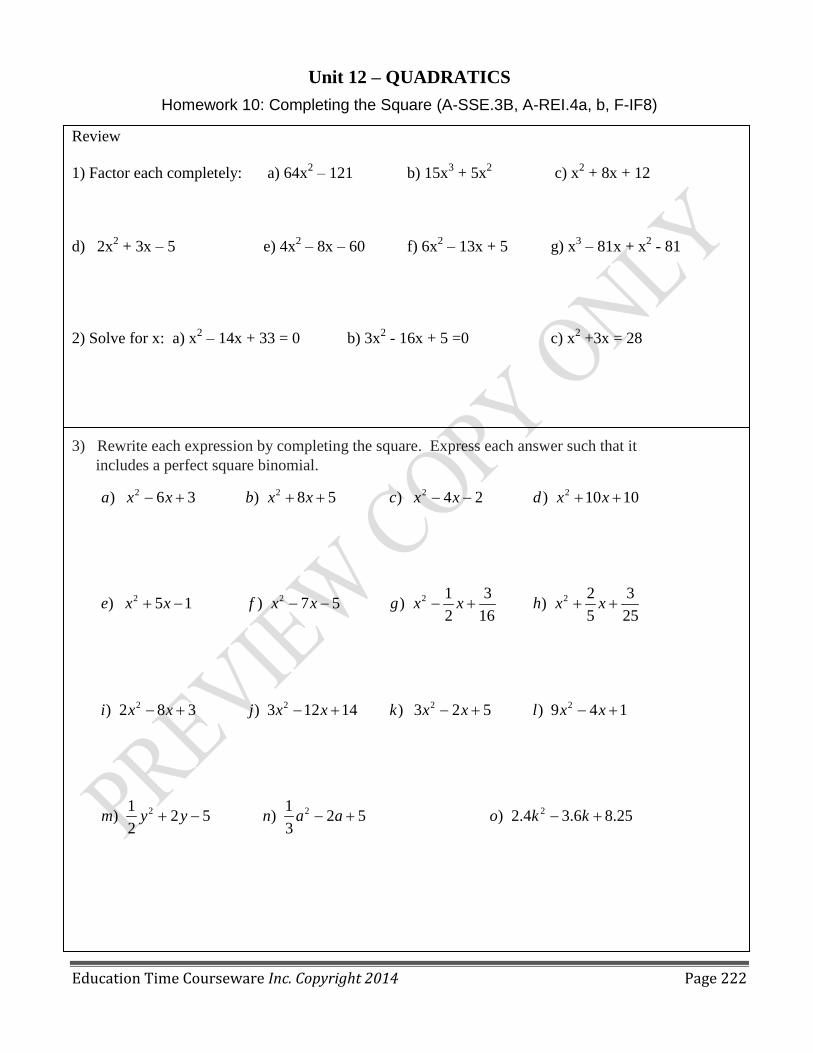
Education Time Courseware Inc. Copyright 2014 Page 222
Unit 12 – QUADRATICS
Homework 10: Completing the Square (A-SSE.3B, A-REI.4a, b, F-IF8)
Review
1) Factor each completely: a) 64x2 – 121 b) 15x
3 + 5x
2 c) x
2 + 8x + 12
d) 2x2 + 3x – 5 e) 4x
2 – 8x – 60 f) 6x
2 – 13x + 5 g) x
3 – 81x + x
2 - 81
2) Solve for x: a) x2 – 14x + 33 = 0 b) 3x
2 - 16x + 5 =0 c) x
2 +3x = 28
3) Rewrite each expression by completing the square. Express each answer such that it
includes a perfect square binomial.
2 2 2 2
2 2 2 2
2 2 2 2
2 2 2
) 6 3 ) 8 5 ) 4 2 ) 10 10
1 3 2 3) 5 1 ) 7 5 ) )
2 16 5 25
) 2 8 3 ) 3 12 14 ) 3 2 5 ) 9 4 1
1 1) 2 5 ) 2 5 ) 2.4 3.6 8.25
2 3
a x x b x x c x x d x x
e x x f x x g x x h x x
i x x j x x k x x l x x
m y y n a a o k k

Education Time Courseware Inc. Copyright 2014 Page 223
2 2 2
2 2 2
2 2 2
) 6 5 0 ) 2 6 0 ) 4 32 0
) 2 5 8 0 ) 4 4 99 0 ) 4 4 39 0
1) 5 9 ) 1.2 4.8 2.4 ) 4 24 11
2
a x x b x x c x x
d x x e x x f x x
g x x h x x i x x
Unit 12 – QUADRATICS
Homework 11: Solving by Completing the Square (A-SSE.3B, A-REI.4a, b, F-IF8)
Review:
1) Rewrite each expression by completing the square.
2) Solve each equation by completing the square.
2 2 2 21) 4 2 ) 6 12 5 ) 1.2 4.8 12 ) 2 5
3a x x b x x c x x d x x

Education Time Courseware Inc. Copyright 2014 Page 224
Unit 12 – QUADRATICS
Homework 12: Solving Equations by Formula (A-REI.4B, A-SSE.3, A-APR.3, F-IF.8)
Review:
1) Solve each equation by completing the square.
2
2
3 4) 2 7 ) ( 4) 1 ) 2a x x b x x c
x x
2) Solve each of the following by the quadratic formula. Express all answer in simplest radical form.
2 2 2
2 2
2 2
) 12 29 ) 2 7 ) 5 3
10 1) 2 3 2 ) 5 ) 2 3
2
) 3 2 0 ) 4 ( 1) 8 10 ) 2 5 0
a x x b x x c x x
d x x e x f x xx
g x x h x x x i x

Education Time Courseware Inc. Copyright 2014 Page 225
Unit 12 – QUADRATICS
Homework 13: Applying the Discriminant (A-REI.4B, A-SSE.3, A-APR.3, F-IF.8)
REVIEW:
1) Solve for x:
a) x2 – x + 4 = 3x + 49 b) x
2 – 10x – 5 = 0
2) Without solving, determine the number of real solutions for each quadratic equation.
a) 2x2 – 4x + 5 = 0 b) 3x
2 – 5x = 4 c) x
2 – 6x + 9 = 0
d) 3x2 + 5x –2 = 0 e) 4x
2 + 20x + 25 =0 f) x
2 = 25
3) Which of the following equations has real, rational and equal roots?
(1) 2x2 + 7x – 9 = 0 (2) 9x
2 + 6x + 1 = 0 (3) 9x
2 – 16 = 0 (4) x
2 – 2x –15 = 0
4) Which of the following equations has no real solutions?
(1) 2x2 + 5x + 9 = 0 (2) x
2 + 6x + 9 = 0 (3) x
2 – 49 = 0 (4) x
2 + 2x –15 = 0
5) Which of the following could be the value of the discriminant of a parabola that intersects the x axis
at 2 distinct points? (1) 0 (2) 25 (3) -15 (4) -4
6) Find the value(s) of b, which would produce two real, rational and equal roots. x2 + bx + 9 =0

Education Time Courseware Inc. Copyright 2014 Page 226
Hw 13 continued
7) Find the largest integral value of c for which the roots of 3x2 + 5x + c = 0 are real.
(1) 1 (2) 2 (3) 3 (4) - 1
8) For what value of b will the roots of 2x2 – bx + 9 = 0 produce two real, rational and unequal roots?
(1) - 1 (2) 0 (3) 5 (4) 9
9) Which of the following describes the graph of 2x2 – 3x – 2 =0?
(1) The parabola would lie entirely above the x axis.
(2) The parabola would lie entirely below the x axis.
(3) The parabola would be tangent to the x axis.
(4) The parabola would intersect the x axis at two distinct points.
10) The graph shown below is an example of a quadratic equation whose discriminant is
(1) A negative number
(2) 0
(3) A positive number that is a perfect square.
(4) A positive number that is not a perfect square

Education Time Courseware Inc. Copyright 2014 Page 227
Unit 12 – QUADRATICS
Homework 14: Vertex Form /Standard Form (F-IF.8a, A-REI.4B, A-SSE.3)
Review:
1) Without solving, determine the number of real solutions for each quadratic equation.
a) 3x2 – 5x + 5 = 0 b) 2x
2 – 5x - 3 = 4 c) x
2 – 8x + 7 = 0
d) 2x2 - 5x –2 = 0 e) x
2 - 8x + 16 =0 f) x
2 = 16
2) Find the vertex of the graphs of the following quadratic equations.
2 2 2 21) ( 3) 2 ) ( 2) 3 ) 2( 1) 4 ) ( 4.5) 2.5
2a y x b y x c y x d y x
3) Write a quadratic equation to represent a function with the following vertex.
Use a leading coefficient of 1.
) : (3,2) ) : 100, 50 ) : ( 10,30)a vertex b vertex c vertex
4) Write a quadratic equation to represent a function with the following vertex.
Use a leading coefficient other than 1.
5) Write two different quadratic equations whose graphs have vertices at
a) (3 , 2) b) ( - 4, 20) c) (-5,-1) d) (0,4)
) : (20,25) ) : 200, 150 ) : ( 100,30)a vertex b vertex c vertex

Education Time Courseware Inc. Copyright 2014 Page 228
Hw 14 continued
6) Graph each of the following on the same coordinate plane and answer the following questions:
2
2
2
) ( 1) 2
) 2( 1) 2
) 2( 1) 2
a y x
b y x
c y x
i) State the vertex of the graph in part a.
ii) What can you say about the vertices in part b and c?
iii) State the graph(s) that open up
iv) State the graph(s) that open down
v) How do graphs b and c relate to graph a?
vi) Is it a shrink or a stretch?
7) Use vocabulary stretch, shrink, opens up, opens down, etc. to compare and contrast the graphs of the
quadratic equations 𝒚 = 𝒙𝟐 + 𝟑 and 𝒚 = −𝟐𝒙𝟐 + 𝟑.

Education Time Courseware Inc. Copyright 2014 Page 229
Unit 12 – QUADRATICS
Homework 15: Graphing Root Functions ((F-IF.4, F-BF.3, F-LE.2, F-IF.7))
Review:
1) Find the vertex of the graphs of the following quadratic equations.
2) Create the graphs of 𝒚 = 𝒙𝟐 and 𝒚 = √𝒙.
a) How are the two graphs related?
b) How are they the same?
c) How are they different?
3) Create the graphs of the functions 2( ) 3 ( ) 3f x x and g x x
a) How are the two graphs related?
b) How are they the same?
c) How are they different?
2 2 2 21) ( 1) 3 ) ( 4) 1 ) 2( 5) 4 ) ( 1.5) 2.5
3a y x b y x c y x d y x

Education Time Courseware Inc. Copyright 2014 Page 230
Hw 15 continued
4) Create the graphs of 𝒚 = 𝒙𝟑 and 𝒚 = √𝒙𝟑
.
a) How are the two graphs related?
b) How are they the same?
c) How are they different?
5) Create the graphs of the functions y = 3 31 1y x and y x
a) How are the two graphs related?
b) How are they the same?
c) How are they different?
6) What transformation would you perform on 3 3toproduce 1y x y x
7) What transformation would you perform on 3 3 1y x to produce y x
8) What transformation would you perform on 3 3toproduce ( 2)y x y x

Education Time Courseware Inc. Copyright 2014 Page 231
Unit 12 – QUADRATICS
Homework 16: Translating Functions (F-IF.4, F-BF.3, F-LE.2, F-IF.7)
1) Study the graphs below. Identify the parent function and the transformations of that function depicted
by the second graph. Then write the formula for the transformed function.
2) Study the graphs below. Identify the parent function and the transformations of that function depicted
by the second graph. Then write the formula for the transformed function.

Education Time Courseware Inc. Copyright 2014 Page 232
Hw 15 continued
3) Study the graphs below. Identify the parent function and the transformations of that function depicted
by the second graph. Then write the formula for the transformed function.
4) Study the graphs below. Identify the parent function and the transformations of that function depicted
by the second graph. Then write the formula for the transformed function.
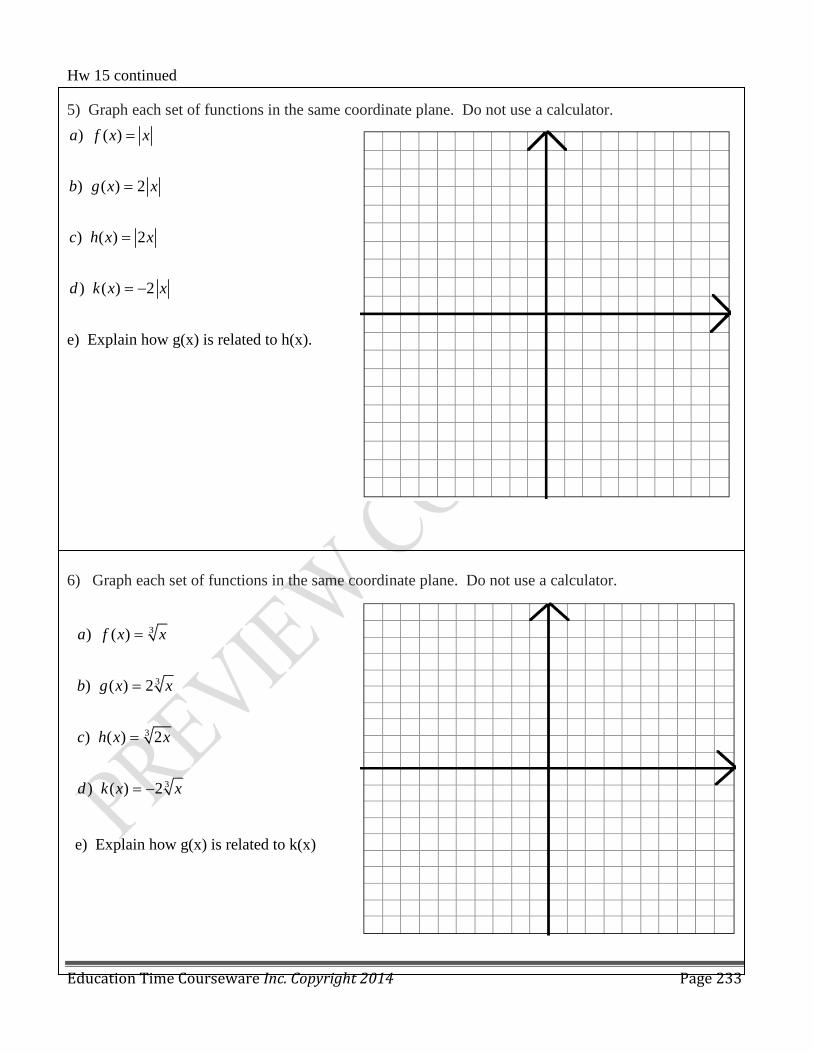
Education Time Courseware Inc. Copyright 2014 Page 233
Hw 15 continued
5) Graph each set of functions in the same coordinate plane. Do not use a calculator.
e) Explain how g(x) is related to h(x).
6) Graph each set of functions in the same coordinate plane. Do not use a calculator.
e) Explain how g(x) is related to k(x)
) ( )
) ( ) 2
) ( ) 2
) ( ) 2
a f x x
b g x x
c h x x
d k x x
3
3
3
3
) ( )
) ( ) 2
) ( ) 2
) ( ) 2
a f x x
b g x x
c h x x
d k x x

Education Time Courseware Inc. Copyright 2014 Page 234
Hw 15 continued
7) Graph each set of functions in the same coordinate plane. Do not use a calculator. State the
transformation of f(x) = x2.
8) Write the formula for the function whose graph is the graph of 𝒇(𝒙) = 𝒙𝟐 translated 𝟒. 𝟐𝟓
units to the left, vertically stretched by a factor of 𝟓, and translated 𝟏. 𝟓 units down.
9) Write the function 𝒈(𝒙) = −𝟐𝒙𝟐 + 𝟒𝒙 + 𝟏 in completed square form. Describe the
transformations of the graph of the parent function, 𝒇(𝒙) = 𝒙𝟐, that result in the graph of 𝒈.
2
2
2
2
2
) ( )
) ( ) ( 1) 3
) ( ) ( 3) 2
) ( ) 2 8 9 ,Express in vertex form
) ( ) 2 8 5 ,Express in vertex form
a f x x
b g x x
c h x x
d k x x x
e p x x x
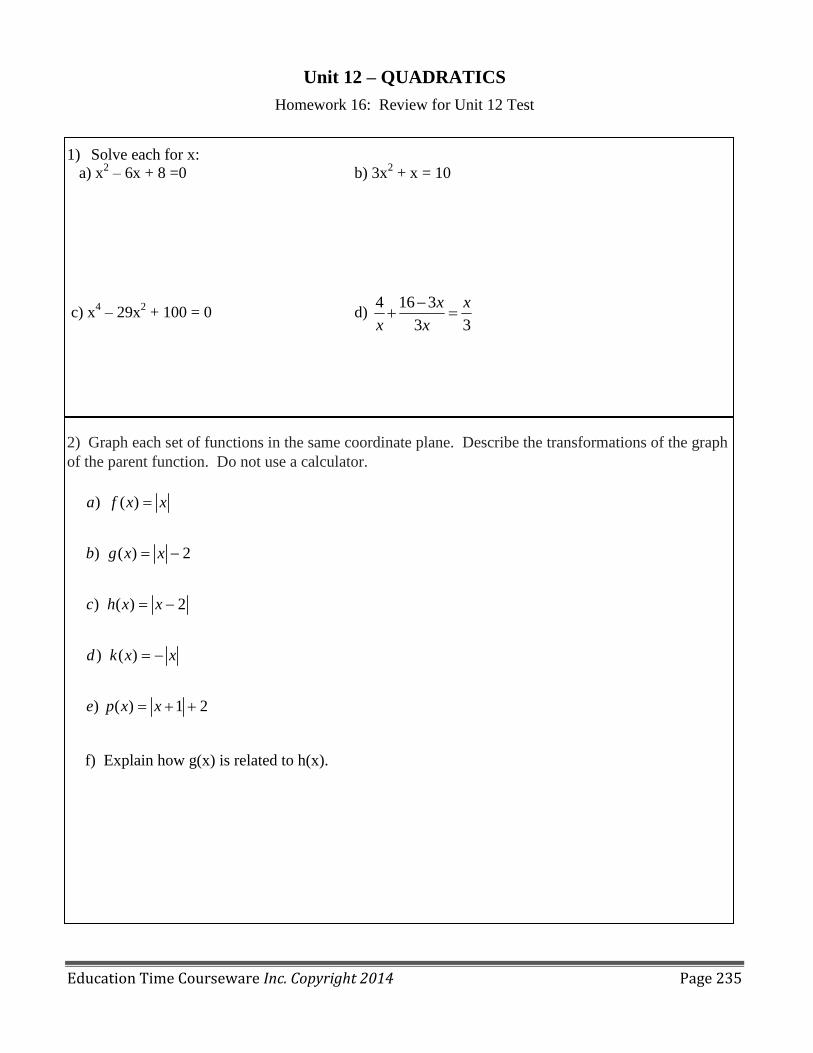
Education Time Courseware Inc. Copyright 2014 Page 235
Unit 12 – QUADRATICS
Homework 16: Review for Unit 12 Test
1) Solve each for x:
a) x2 – 6x + 8 =0 b) 3x
2 + x = 10
c) x4 – 29x
2 + 100 = 0 d)
4 16 3
3 3
x x
x x
2) Graph each set of functions in the same coordinate plane. Describe the transformations of the graph
of the parent function. Do not use a calculator.
f) Explain how g(x) is related to h(x).
) ( )
) ( ) 2
) ( ) 2
) ( )
) ( ) 1 2
a f x x
b g x x
c h x x
d k x x
e p x x

Education Time Courseware Inc. Copyright 2014 Page 236
Hw 16 continued
3) Graph each set of functions in the same coordinate plane. Describe the transformations of the graph
of the parent function. Do not use a calculator.
4) Find the vertex of the graphs of the following quadratic equations.
5) Write the formula for the function whose graph is the graph of 𝒇(𝒙) = 𝒙𝟐 translated 2 units
to the left, vertically stretched by a factor of 3, and translated 3 units up.
6) Write the formula for the function whose graph is the graph of translated 3 units
to the right, vertically stretched by a factor of 2, and translated 4 units down.
7) Write the function 2( ) 2 12 18g x x x in completed square form. Describe the
transformations of the graph of the parent function, 𝒇(𝒙) = 𝒙𝟐, that result in the graph of 𝒈.
2
2
2
2
) ( )
) ( ) ( 3)
) ( ) 2( 1)
) ( ) 2( 1) 2
a f x x
b g x x
c h x x
d k x x
2 2 2 21) ( 1) 3 ) ( 4) 1 ) 2( 3) 1 ) ( 2.5) 3.5
2a y x b y x c y x d y x
3( )f x x

Education Time Courseware Inc. Copyright 2014 Page 237
215
4y x
Hw 16 continued
8) The height of a projectile can be modeled by the equation y = -16x2 + 96x + 256, where y is the
height in feet and x is the time in seconds that the projectile is in the air. Find the greatest height of this
projectile. Find how many seconds it takes to attain this height. Find the total time that
the projectile is in the air.
9) Which of the following is the graph of ?
(1) (2) (3) (4)
10) Solve each equation by completing the square.
a) x2 + 6x – 16 = 0 b) x
2 - 4x –7 = 0
11) Jane is given the graph of the function
She wants to find the zeroes of the function but is unable to read them exactly from the graph. Find the zeroes in simplest radical form.
12) Solve each equation and express roots in simplest radical form:
a) 2x2 – 3x – 2 = 0 b) x
2 – 10x + 13 = 0

Education Time Courseware Inc. Copyright 2014 Page 238
Unit 12 – QUADRATICS
Homework 17: Cumulative Review Questions (Unit 12)
1) When solving the equation 2 24(2 5) 7 3 14x x , John wrote 2 24(2 5) 3 7x x as his first
step. Which property justifies James's first step?
a) addition property of equality b) subtraction property of addition
c) multiplication property of equality d) distributive property of multiplication over addition
2) Solve for x and express your answer in simplest radical form: 4 3
71x x
3) A baseball player throws a ball from the outfield toward home plate. The ball’s height above the
ground is modeled by the equation y = -16x2 + 48x + 6, where y represents height, in feet, and x
represents time, in seconds. The ball is initially thrown from a height of 6 feet. How many seconds after
the ball is thrown will it again be 6 feet above the ground? What is the maximum height, in feet, that the
ball reaches? ( The use of a grid is optional.)
4) A landscape architect’s designs for a town park call for two parabolic-shaped walkways. When
the park is mapped on a Cartesian coordinate plane, the pathways intersect at two points. If the
equations of the two curves of the walkways are y = 11x2 + 23x + 210 and y = -19x
2 – 7x + 390,
determine the coordinates of the two points of intersection.

Education Time Courseware Inc. Copyright 2014 Page 239
Hw 17 continued
5) The graph of ( )f x is shown here:
What are the zeroes of the function?
If 2( )f x ax bx c what is ( )f x in factored form?
6) The graph of ( )f x is shown here:
What are the zeroes of the function?
If 2( )f x ax bx c what is ( )f x in factored form?
7) What is the product of 2 1
1
x
x
and
3
3 3
x
x
expressed in simplest form?
(1) x (2) 3
x (3) x + 3 (4)
3
3
x
8) Which situation should be analyzed using bivariate data?
(1) Ms. Saleeem keeps a list of the amount of time her daughter spends on her social studies
homework.
(2) Mr. Benjamin tries to see if his student’s shoe sizes are directly related to their heights.
(3) Mr. DeStefan records his customers’ best video game scores during the summer.
(4) Mr. Chan keeps track of his daughter’s algebra grades for the quarter.
9) Kathy plans to purchase a car that depreciates (loses value) at a rate of 14% per year. The initial cost
of the car is $21,000. Which equation represents the value, v of the car after 3 years?
(1) v = 21,000(0.14)3 (2) v = 21,000(0.86)
3 (3) v = 21,000(1.14)
3 (4) v = 21,000(1.86)
3

Education Time Courseware Inc. Copyright 2014 Page 240
Hw 17 continued
10) Which equation most closely represents the line of best fit for the
accompanying scatter plot?
(1) y = x (2) 2
13
y x (3) 3
22
y x (4) 3
2y x
11) What is the value of the third quartile shown in the box
and whisker plot?
(1) 6 (2) 8.5 (3) 10 (4) 12
12) A school wants to add a coed soccer program. To determine student interest in the program, a survey
was taken. In order to get an unbiased sample, which group should the school survey?
(1) every third student entering the building (2) every member of the varsity football team
(3) every member in Mr. Zimmer’s drama classes (4) every student having a French class
13) The prices of seven race cars sold last week are listed in the table below.
What is the mean value of these race cars, in dollars?
What is the median value of these race cars, in dollars?
State which of these measures of central tendency best represents the value
of the seven race cars. Justify your answer
14) Solve the following system of equations algebraically: 3x + 2y = 4
4x + 3y = 7
(Only an algebraic solution can receive full credit)

Education Time Courseware Inc. Copyright 2014 Page 241
Hw 17 continued
15) Twenty students were surveyed about the number of days they
played outside in one week. The results of this survey are shown
below. {6,5,4,5,0,7,1,5,4,4,3,2,2,3,2,4,3,4,0,7}
Complete the frequency table below for these data.
Complete the cumulative frequency table below using these data.
On the grid , create a cumulative frequency
histogram based on the table you made.
16) There is a negative correlation between the number of hours a student watches television and his or
her social studies test score. Which scatter plot below displays this correlation?
(1) (3)
(2) (4)
(4)
17) Express the product of 2x2 + 7x - 10 and x + 5 in standard form.

Education Time Courseware Inc. Copyright 2014 Page 242
Hw 17 continued
18) The accompanying table represents the number of hours each student studied for a particular test
and the grade that each student achieved.
a) Is the data univariate or bivariate?
b) Is the data quantitative or qualitative?
c) Does the data indicate a positive correlation, negative correlation or no
correlation?
d) What is the equation of the line of best fit?(nearest hundredth)
e) Use the line of best fit to predict a grade if a student studied for exactly 4
hours
19) A company that manufactures cycles first pays a start-up cost, and then spends a certain amount
of money to manufacture each cycle. If the cost of manufacturing c cycles is given by the function
, then the value 35 best represents
a) the start-up cost b) the profit earned from the sale of one radio
c) the amount spent to manufacture each radio d) the average number of radios manufactured
What would it cost to produce 100 cycles?
What does the 25.50 represent?
Study
Time
(hrs)
Grade
3 84
1 68
5 98
4.5 92
2 66
( ) 25.50 35p c c

Education Time Courseware Inc. Copyright 2014 Page 243
Full Year Practice Test 1
Part I ( 2 points each)
1) It takes Tammy 45 minutes to ride her bike 5 miles. At this rate, how long will it take her to ride 8
miles?
(1) 0.89 hour (2) 1.125 hours (3) 48 minutes (4) 72 minutes
2) What are the roots of the equation x2 – 7x + 6 = 0?
(1) 1 and 7 (2) and 7 (3) and (4) 1 and 6
3) Which expression represents 18 5
6
27
9
x y
x y in simplest form?
(1) 3x12
y4 (2) 3x
3y
5 (3) 18x
12y
4 (4) 18x
3y
5
4) Marie currently has a collection of 58 stamps. If she buys s stamps each week for w weeks,
which expression represents the total number of stamps she will have?
(1) 58sw (2) 58 + sw (3) 58s + w (4) 58 + s + w
5) Which ordered pair is not in the solution set of 1
4 3 12
y x and y x
(1) (4,2) (2) (3,3) (3) (5,3) (4) (6,2)
6) The sign shown below is posted in front of a roller coaster ride at the Wadsworth County
Fairgrounds.
If h represents the height of a rider in inches, what is a correct translation of
the statement on this sign?
(1) h < 48 (2) h > 48 (3) h ≤48 (4) h≥ 48
7) Which value of x is the solution of the equation 2
53 6
x x ?
(1) 6 (2) 10 (3) 15 (4) 30
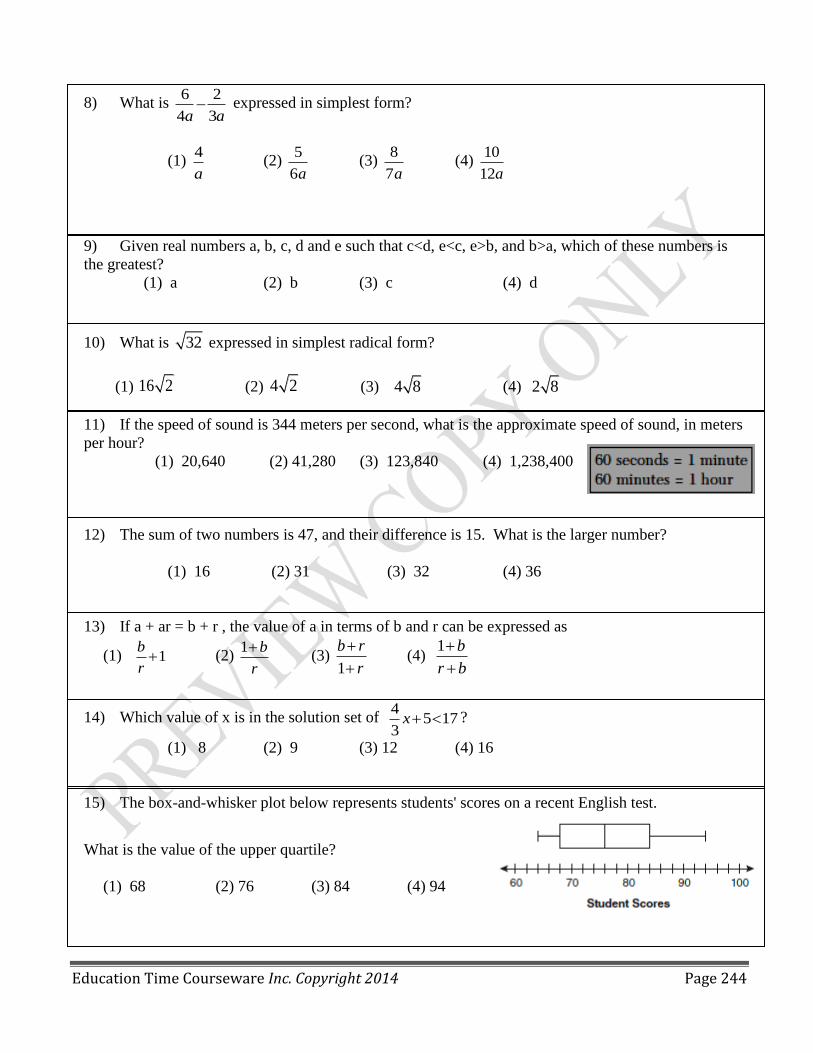
Education Time Courseware Inc. Copyright 2014 Page 244
8) What is 6 2
4 3a a expressed in simplest form?
(1) 4
a (2)
5
6a (3)
8
7a (4)
10
12a
9) Given real numbers a, b, c, d and e such that c<d, e<c, e>b, and b>a, which of these numbers is
the greatest?
(1) a (2) b (3) c (4) d
10) What is 32 expressed in simplest radical form?
(1) 16 2 (2) 4 2 (3) 4 8 (4) 2 8
11) If the speed of sound is 344 meters per second, what is the approximate speed of sound, in meters
per hour?
(1) 20,640 (2) 41,280 (3) 123,840 (4) 1,238,400
12) The sum of two numbers is 47, and their difference is 15. What is the larger number?
(1) 16 (2) 31 (3) 32 (4) 36
13) If a + ar = b + r , the value of a in terms of b and r can be expressed as
(1) 1b
r (2)
1 b
r
(3)
1
b r
r
(4)
1 b
r b
14) Which value of x is in the solution set of 4
5 173
x ?
(1) 8 (2) 9 (3) 12 (4) 16
15) The box-and-whisker plot below represents students' scores on a recent English test.
What is the value of the upper quartile?
(1) 68 (2) 76 (3) 84 (4) 94
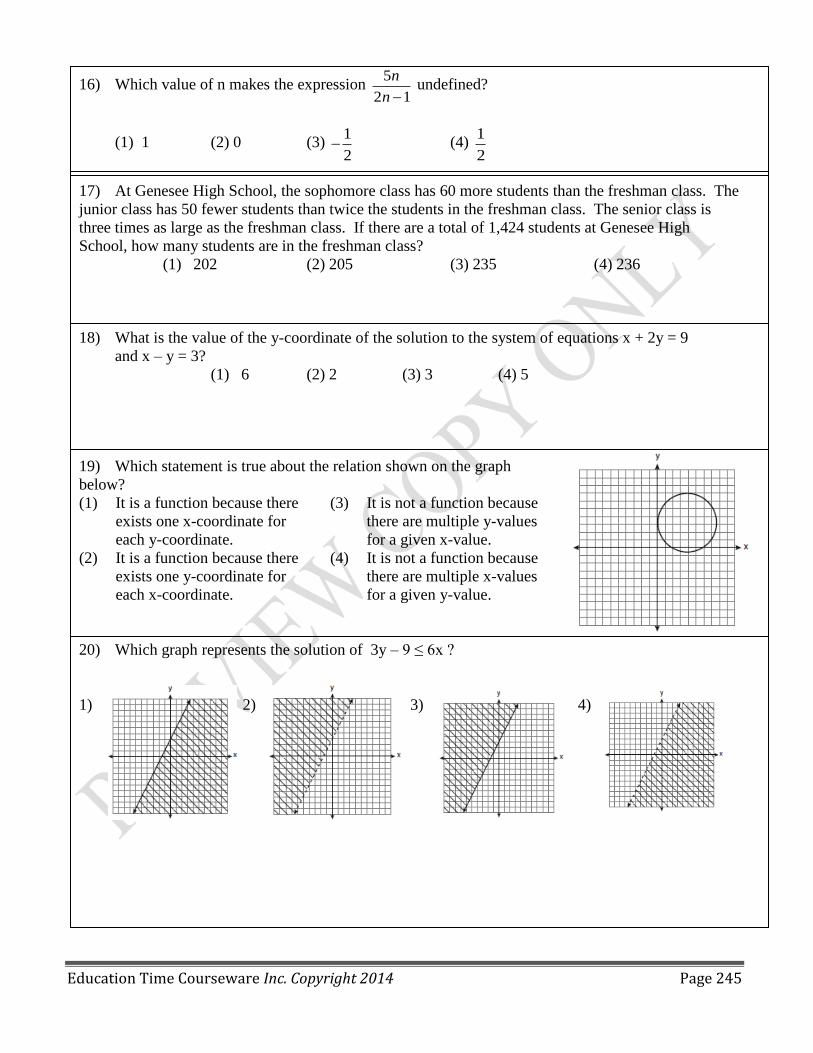
Education Time Courseware Inc. Copyright 2014 Page 245
16) Which value of n makes the expression 5
2 1
n
n undefined?
(1) 1 (2) 0 (3) 1
2 (4)
1
2
17) At Genesee High School, the sophomore class has 60 more students than the freshman class. The
junior class has 50 fewer students than twice the students in the freshman class. The senior class is
three times as large as the freshman class. If there are a total of 1,424 students at Genesee High
School, how many students are in the freshman class?
(1) 202 (2) 205 (3) 235 (4) 236
18) What is the value of the y-coordinate of the solution to the system of equations x + 2y = 9
and x – y = 3?
(1) 6 (2) 2 (3) 3 (4) 5
19) Which statement is true about the relation shown on the graph
below?
(1) It is a function because there
exists one x-coordinate for
each y-coordinate.
(3) It is not a function because
there are multiple y-values
for a given x-value.
(2) It is a function because there
exists one y-coordinate for
each x-coordinate.
(4) It is not a function because
there are multiple x-values
for a given y-value.
20) Which graph represents the solution of 3y – 9 ≤ 6x ?
1) 2) 3) 4)

Education Time Courseware Inc. Copyright 2014 Page 246
21) Which expression represents 2
2
2 15
3
x x
x x
in simplest form?
(1) -5 (2) 5x
x
(3)
2 5x
x
(4)
2 15
3
x
x
22) What is an equation of the line that passes through the point (4,-6) and has a slope of -3?
(1) y = -3x + 6 (2) y = -3x – 6 (3) y = -3x + 10 (4) y = - 3x + 14
23) When 4x2 + 7x - 5 is subtracted from 9x
2 – 2x + 3, the result is
(1) 5x2 + 5x – 2 (2) 5x
2 – 9x + 8 (3) -5x
2 + 5x – 2 (4) -5x
2 + 9x – 8
24) The equation y = x2 + 3x – 18 is graphed on the set of axes below.
Based on this graph, what are the roots of the equation x2 + 3x – 18 = 0 ?
(1) – 3 and 6 (2) 0 and 18 (3) 3 and – 6 (4) 3 and -18
Part II
Answer all 8 questions in this part. Each correct answer will receive 2 points. Clearly indicate the
necessary steps, including appropriate formulas substitutions, diagrams, graphs, charts, etc. For
all questions, in this part, a correct numerical answer with no work shown will receive only 1
credit.
25) Factor completely:
26) Jane wants to make trail mix made up of almonds, walnuts and raisins. She wants to mix one part
almonds, two parts walnuts, and three parts raisins. Almonds cost $12 per pound, walnuts cost
$10.50 per pound, and raisins cost $4 per pound. Jane has $15 to spend on the trail mix. Determine
how many pounds of trail mix she can make.

Education Time Courseware Inc. Copyright 2014 Page 247
216
2y x
27 For English class, Gary must read Grapes of Wraft in 10 days. He reads 112
of the book each of
the first 4 days. For the remaining 6 days, what fraction of the book must Gary read per day?
28 Mr James is 4 times as old as his son. In 16 years he will be only twice as old. What is the age of
the son now.
29 A rectangle’s length is 14 cm more than its width. The perimeter is 264 cm. Find the dimensions
of the rectangle.
30 Solve for x : 2 3 2
4 3
x
x
31 Jane is given the graph of the function
She wants to find the zeroes of the function but is unable to read them exactly from the graph. Find the zeroes in simplest radical form.
32 Express in simplest form: 4 3 3
2
45 90
15
a b a b
a b

Education Time Courseware Inc. Copyright 2014 Page 248
Part III
Answer all 4 questions in this part. Each correct answer will receive 4 points. Clearly indicate the
necessary steps, including appropriate formulas substitutions, diagrams, graphs, charts, etc. For
all questions, in this part, a correct numerical answer with no work shown will receive only 1
credit.
33 A bank is advertising that new customers can open a savings account with a 3
3 %4
interest rate
compounded annually. Robert invests $5,000 in an account at this rate. If he makes no additional
deposits or withdrawals on his account, find the amount of money he will have, to the nearest cent,
after three years.
34 The table below shows the number of prom tickets
sold over a ten-day period.
Plot these data points on the coordinate grid below. Use a
consistent and appropriate scale. Draw a reasonable line of
best fit and write its equation.
35 Find the roots of the equation x2 = 30 – 13x algebraically.
36 The Booster Club raised $30,000 for a sports fund. No more money will be placed into the fund.
Each year the fund will decrease by 5%. Determine the amount of money, to the nearest cent, that
will be left in the sports fund after 4 years.

Education Time Courseware Inc. Copyright 2014 Page 249
Part IV
Answer all 1 questions in this part. Each correct answer will receive 4 points. Clearly indicate the
necessary steps, including appropriate formulas substitutions, diagrams, graphs, charts, etc. For
all questions, in this part, a correct numerical answer with no work shown will receive only 1
credit.
37 A man is climbing down a ladder that is 10 feet high. At time 0 seconds, his shoes are 10 feet
above the floor, and at time 6 seconds, his shoes are at 3 feet. From time 6 seconds to the 8.5
second mark, he drinks some water on the step 3 feet off the ground. When he completes drinking
the water, he takes 1.5 seconds to reach the ground and then he walks into the living room.
a) Draw a graph representing this story
b) What does the horizontal line segment represent in your graph?
c) If you measured from the top of the man’s head instead of his shoes, how would your graph
change if he is 6 feet tall.

Education Time Courseware Inc. Copyright 2014 Page 250
Full Year Practice Test 2
Part I ( 2 points each)
1) If h represents a number, which equation is a correct translation of "Sixty more than 9 times a
number is 375"?
(1) 9h = 375 (2) 9h + 60 = 375 (3) 9h – 60 = 375 (4) 60h + 9 = 375
2) Which expression is equivalent to 9x2 – 16??
(1) (3x + 4)(3x – 4) (2) (3x – 4)(3x – 4) (3) (3x + 8)( 3x – 8) (4) (3x – 8)(3x – 8)
3) Which expression represents (3x2y
4)(4xy
2) in simplest form?
(1) 12x2y
8 (2) 12x
2y
6 (3) 12x
3y
8 (4) 12x
3y
6
4) An online music club has a one-time registration fee of $13.95 and charges $0.49 to buy each
song. If Emma has $50.00 to join the club and buy songs, what is the maximum number of songs
she can buy?
(1) 73 (2) 74 (3) 130 (4) 131
5) Which ordered pair is not in the solution set of 2 1 3 2y x and y x
(1) (1,3) (2) (-1,1) (3) (-2,-2) (4) (-4,-2)
6) Nancy’s rectangular garden is represented in the diagram below.
If a diagonal walkway crosses her garden, what is its length,
in feet?
(1) 17 (2) 22 (3) 161 4) 529

Education Time Courseware Inc. Copyright 2014 Page 251
7 Which statistic would indicate that a linear function would not be a good fit to model a data set?
(1) r = -0.96 (2) r = 1 (3) 4)
8 For which function defined by a polynomial are the zeros of the polynomial –3 and –2? 2 2 2 2(1) 5 6 (2) 5 6 (3) 5 6 (4) 5 6x x x x x x x x
9) Solve for x: 3
( 2) 45
x x
(1) 8 (2) 13 (3) 15 (4) 23
10) If the quadratic formula is used to find the roots of the equation , the correct roots are
3 3 5 3 3 5 3 3 5 3 3 5(1) (2) (3) (4)
2 2 4 4
11) Which equation represents a line parallel to the x-axis?
(1) y = -5 (2) y = -5x (3) x = 3 (4) x = 3y
12) Mr. Smith’s algebra class is inquiring about slopes of lines. The class was asked to graph the
total cost , C , of buying h hotdog that cost 75 cent each. The class was asked to describe the slope
between any two points on the graph. Which statement below is always a correct answer about the
slope between any two points on this graph.
(1) the same positive value (2) the same negative value
(3) zero (4) a positive value, but the values varies
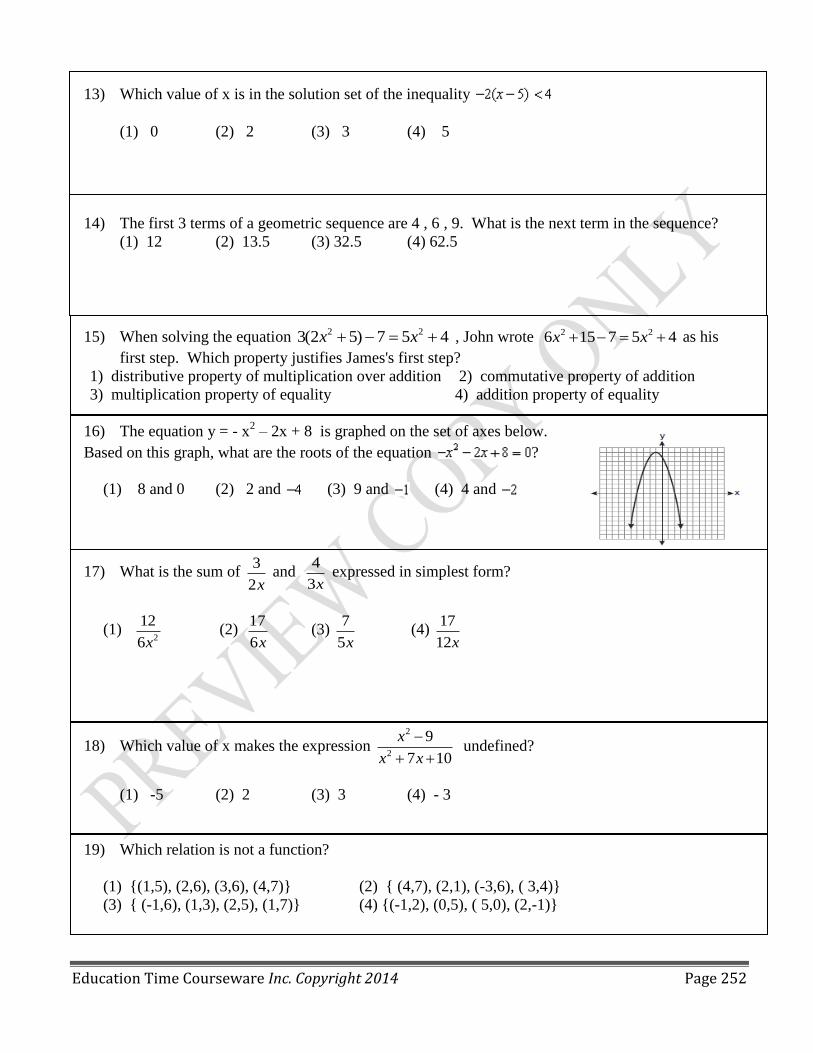
Education Time Courseware Inc. Copyright 2014 Page 252
13) Which value of x is in the solution set of the inequality
(1) 0 (2) 2 (3) 3 (4) 5
14) The first 3 terms of a geometric sequence are 4 , 6 , 9. What is the next term in the sequence?
(1) 12 (2) 13.5 (3) 32.5 (4) 62.5
15) When solving the equation 2 23(2 5) 7 5 4x x , John wrote 2 26 15 7 5 4x x as his
first step. Which property justifies James's first step?
1) distributive property of multiplication over addition 2) commutative property of addition
3) multiplication property of equality 4) addition property of equality
16) The equation y = - x2 – 2x + 8 is graphed on the set of axes below.
Based on this graph, what are the roots of the equation ?
(1) 8 and 0 (2) 2 and (3) 9 and (4) 4 and
17) What is the sum of 3
2x and
4
3x expressed in simplest form?
(1) 2
12
6x (2)
17
6x (3)
7
5x (4)
17
12x
18) Which value of x makes the expression 2
2
9
7 10
x
x x
undefined?
(1) -5 (2) 2 (3) 3 (4) - 3
19) Which relation is not a function?
(1) {(1,5), (2,6), (3,6), (4,7)} (2) { (4,7), (2,1), (-3,6), ( 3,4)}
(3) { (-1,6), (1,3), (2,5), (1,7)} (4) {(-1,2), (0,5), ( 5,0), (2,-1)}
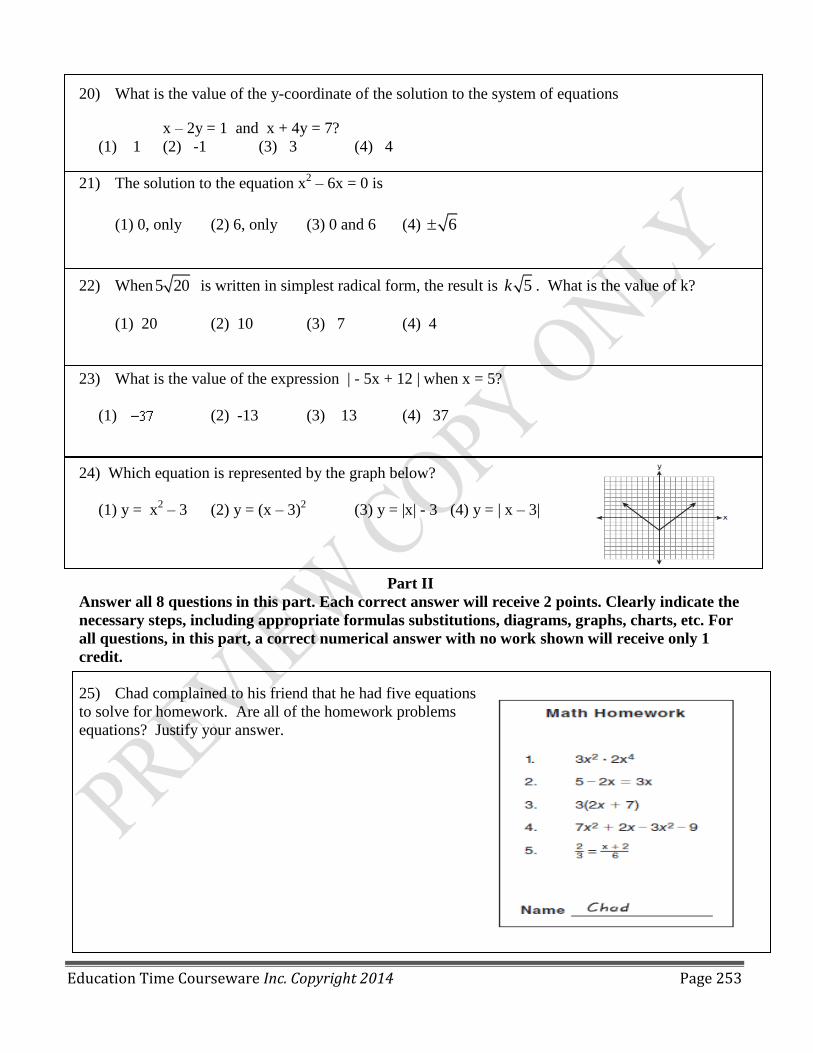
Education Time Courseware Inc. Copyright 2014 Page 253
20) What is the value of the y-coordinate of the solution to the system of equations
x – 2y = 1 and x + 4y = 7?
(1) 1 (2) -1 (3) 3 (4) 4
21) The solution to the equation x2 – 6x = 0 is
(1) 0, only (2) 6, only (3) 0 and 6 (4) 6
22) When5 20 is written in simplest radical form, the result is 5k . What is the value of k?
(1) 20 (2) 10 (3) 7 (4) 4
23) What is the value of the expression | - 5x + 12 | when x = 5?
(1) (2) -13 (3) 13 (4) 37
24) Which equation is represented by the graph below?
(1) y = x2 – 3 (2) y = (x – 3)
2 (3) y = |x| - 3 (4) y = | x – 3|
Part II
Answer all 8 questions in this part. Each correct answer will receive 2 points. Clearly indicate the
necessary steps, including appropriate formulas substitutions, diagrams, graphs, charts, etc. For
all questions, in this part, a correct numerical answer with no work shown will receive only 1
credit.
25) Chad complained to his friend that he had five equations
to solve for homework. Are all of the homework problems
equations? Justify your answer.

Education Time Courseware Inc. Copyright 2014 Page 254
212
4y x
26) If Mary takes 20 minutes to sort the customer requests and Pat takes 30 minutes to do the same
job, how many minutes will both Mary and Pat, working together, take to sort the customer list.
27) The ages of three brothers are consecutive even integers. Three times the age of the youngest
brother exceeds the oldest brother's age by 48 years. What is the age of the youngest brother?
28) Jim is given the graph of the function He wants to find the zeroes of the function
but is unable to read them exactly from the graph. Find the zeroes in simplest radical form.
29) The chart below compares two runners.
Based on the information in this chart, state which runner
has the faster rate. Justify your answer.
30 On the set of axes below, graph the function represented by 3 1y x for the domain 7 9x

Education Time Courseware Inc. Copyright 2014 Page 255
31 What is the sum of the first 19 terms of the sequence 3, 10, 17, 24, 31,…?
32 A high school drama club is putting on their annual theater production. There is a maximum of
800 tickets for the show. The costs of the tickets are $6 before the day of the show and $9 on the
day of the show. To meet the expenses of the show, the club must sell at least $5,000 worth of
tickets.
Write a system of inequalities that represent this situation.
Part III
Answer all 4 questions in this part. Each correct answer will receive 4 points. Clearly indicate the
necessary steps, including appropriate formulas substitutions, diagrams, graphs, charts, etc. For
all questions, in this part, a correct numerical answer with no work shown will receive only 1
credit.
33) Find algebraically the equation of the axis of symmetry and the coordinates of the vertex of the
parabola whose equation is y = -2x2 – 8x + 3.
34) At the end of week one, a stock had increased in value from $5.75 a share to $7.50 a share. Find
the percent of increase at the end of week one to the nearest tenth of a percent. At the end of week two,
the same stock had decreased in value from $7.50 to $5.75. Is the percent of decrease at the end of
week two the same as the percent of increase at the end of week one? Justify your answer.

Education Time Courseware Inc. Copyright 2014 Page 256
35) The test scores from Mrs. Gray’s math class are shown below.
72, 73, 66, 71, 82, 85, 95, 85, 86, 89, 91, 92
Construct a box-and-whisker plot to display these data.
36 Express in simplest form: 2 2
2 2
2 8 42 9
6 3
x x x
x x x
Part IV
Answer all 1 questions in this part. Each correct answer will receive 4 points. Clearly indicate the
necessary steps, including appropriate formulas substitutions, diagrams, graphs, charts, etc. For
all questions, in this part, a correct numerical answer with no work shown will receive only 1
credit.
37) On the grid below, solve the system of equations graphically for x and y.
4x – 2y = 10
y = - 2x - 1

Education Time Courseware Inc. Copyright 2014 Page 257
7 49 491 2 3 4 49
2 4 2) ) ) )
Practice Test 3
Multiple Choice Questions
1 Brian correctly used a method of completing the square to solve the equation . Brian’s
first step was to rewrite the equation as . He then added a number to both sides of the
equation. Which number did he add?
2 The number of minutes students took to complete a quiz is summarized in the table below.
If the mean number of minutes was 17, which equation could be used to calculate the value of x?
3 Samantha constructs the scatter plot below from a set of data.
Based on her scatter plot, which regression model would be most appropriate?
1) exponential 2) linear 3) quadratic 4) cubic
4 What is the sum of the first 19 terms of the sequence 3, 9, 15,,…?
(1) 1083 (2) 1197 (3) 1254 (4) 1292
1)
2)
3)
4)

Education Time Courseware Inc. Copyright 2014 Page 258
5 5 5 51 2 3 4
2 42 58 18) ) ) )
5 Which graph represents a relation that is not a function?
1) 2)
3) 4)
6 What is the range of ?
1)
2)
3)
4)
7 If , what is the value of ?
8 A population of rabbits doubles every 60 days according to the formula
t60P 10( 2 ) , where P is the
population of rabbits on day t. What is the value of t when the population is 320?
(1) 240 (2) 300 (3) 660 (4) 960

Education Time Courseware Inc. Copyright 2014 Page 259
9 A sequence has the following terms 1 2 3 4a 4,a 10,a 25,a 62.5.
Which formula represents the n th term in this sequence?
(1) an = 4 + 2.5n (2) an = 4 + 2.5(n-1) (3) an = 4(2.5)n (4) an = 4(2.5)
n-1
10 What is the range of f(x) = |x – 3| + 2 ?
(1) { x | x 3} ( 2 ) { y | y 2} ( 3 ) { x| x real numbers } ( 4 ) { y | y real numbers }
11 On the axes below, for 2 x 2, graph .x 1y 2 3
12 What is the domain of the function shown below?
1) 2)
3) 4)
13 Which graph represents the solution set of ?
1)
2)
3)
4)
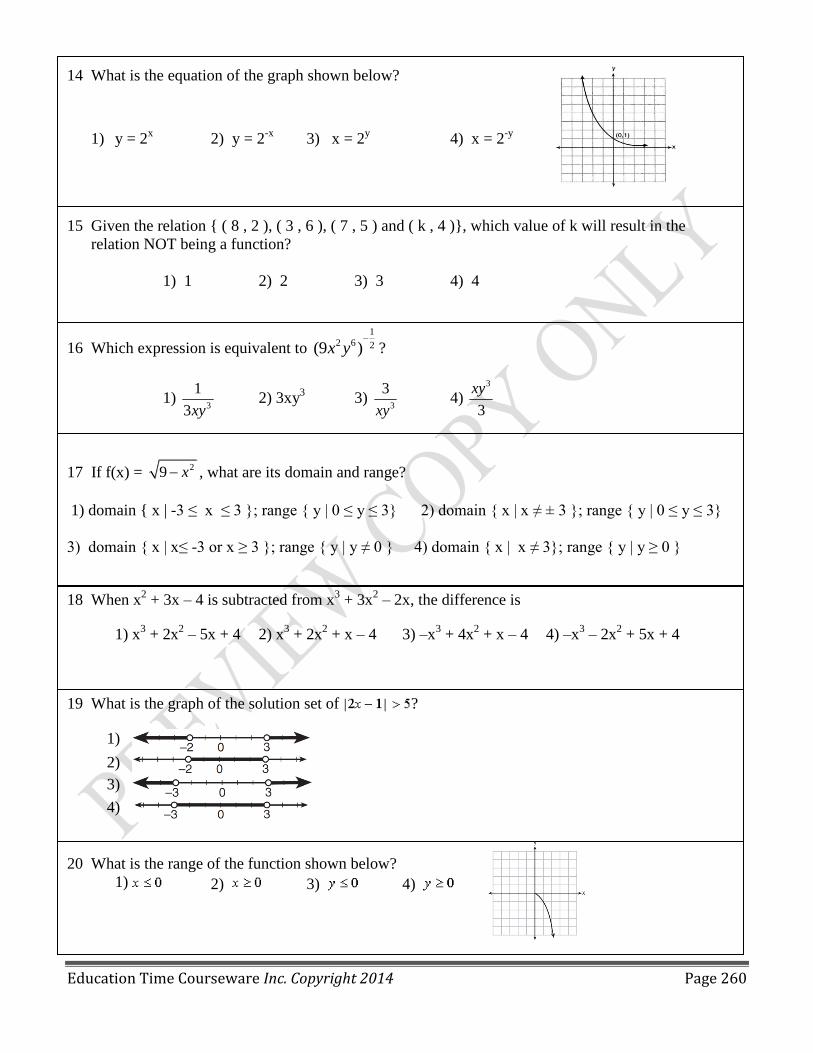
Education Time Courseware Inc. Copyright 2014 Page 260
14 What is the equation of the graph shown below?
1) y = 2x 2) y = 2
-x 3) x = 2
y 4) x = 2
-y
15 Given the relation { ( 8 , 2 ), ( 3 , 6 ), ( 7 , 5 ) and ( k , 4 )}, which value of k will result in the
relation NOT being a function?
1) 1 2) 2 3) 3 4) 4
16 Which expression is equivalent to
1
2 6 2(9 )x y
?
1) 3
1
3xy 2) 3xy
3 3)
3
3
xy 4)
3
3
xy
17 If f(x) = 29 x , what are its domain and range?
1) domain { x | -3 ≤ x ≤ 3 }; range { y | 0 ≤ y ≤ 3} 2) domain { x | x ≠ ± 3 }; range { y | 0 ≤ y ≤ 3}
3) domain { x | x≤ -3 or x ≥ 3 }; range { y | y ≠ 0 } 4) domain { x | x ≠ 3}; range { y | y ≥ 0 }
18 When x2 + 3x – 4 is subtracted from x
3 + 3x
2 – 2x, the difference is
1) x3 + 2x
2 – 5x + 4 2) x
3 + 2x
2 + x – 4 3) –x
3 + 4x
2 + x – 4 4) –x
3 – 2x
2 + 5x + 4
19 What is the graph of the solution set of ?
1)
2)
3)
4)
20 What is the range of the function shown below?
1) 2) 3) 4)

Education Time Courseware Inc. Copyright 2014 Page 261
2 2
2 2
1 1(1) (2) 3 (3) (4) 9
3 9x x
x x
(1 ) ,ntrA P
n
21) A company that manufactures radios first pays a start-up cost, and then spends a certain amount
of money to manufacture each radio. If the cost of manufacturing r radios is given by the function
, then the value 6.50 best represents
1) the start-up cost 2) the profit earned from the sale of one radio
3) the amount spent to manufacture each radio 4) the average number of radios manufactured
22 If n is a negative integer, then which statement is always true?
1) 2) 3) 4)
23 What is the common difference in the sequence 2a + 1, 4a + 4, 6a + 7, 8a + 10, ...?
(1) 2a + 3 (2) -2a – 3 (3) 2a + 5 (4) -2a + 5
24 Which expression is equivalent to 2 1(3 )x ?
25 If $5000 is invested at a rate of 3% interest compounded quarterly, what is the value of the investment
in 5 years (Use the formula where A is the amount accrued,
P is the principal, r is the interest rate, n is the number of times per year the money is
compounded, and t is the length of time, in years.)
(1) $5190.33 (2) $5796.37 (3) $5805.92 (4) $5808.08
26 The graph of is shown below.
What is the product of the roots of the equation ?
1) 2) 3) 6
4) 4
( ) 6.50 110c r r

Education Time Courseware Inc. Copyright 2014 Page 262
27) What is the correlation coefficient of the linear fit of the data shown below, to the nearest hundredth?
1) 1.00 2) 0.93 3) -0.93 4) -1.00
28) Given:
Which expression results in a rational number?
1) L + M 2) M + N 3) N + P 4) P + L
29) John has five more nickels than dimes in his pocket, for a total of $1.35. Which equation could be
used to determine the number of dimes, x, in his pocket?
30) The Jamison family kept a log of the distance they traveled during a trip, as represented by the graph
below.
During which interval was their average speed the greatest?
1) the first hour to the second hour
2) the second hour to the fourth hour
3) the sixth hour to the eighth hour
4) the eighth hour to the tenth hour
5
2 3
25
16
L
M
N
P
1) 0.10( 5) 0.05( ) 1.35 2) 0.05( 5) 0.10( ) 1.35
3) 0.10(5 ) 0.05( ) 1.35 4) 0.05(5 ) 0.10( ) 1.35
x x x x
x x x x

Education Time Courseware Inc. Copyright 2014 Page 263
31) Christopher looked at his quiz scores shown below for the first and second semester of his Algebra
class.
Semester 1: 78, 91, 88, 83, 94
Semester 2: 91, 96, 80, 77, 88, 85, 92
Which statement about Christopher's performance is correct?
1) The interquartile range for semester 1 is
greater than the interquartile range for
semester 2.
2) The median score for semester 1 is greater
than the median score for semester 2.
3) The mean score for semester 2 is greater
than the mean score for semester 1.
4) The third quartile for semester 2 is greater
than the third quartile for semester 1.
32) The diagrams below represent the first three terms of a sequence.
Assuming the pattern continues, which formula determines , the number of shaded squares in the nth
term?
33) When solving the equation , Emily wrote
as her first step.
Which property justifies Emily's first step?
(1) addition property of equality (2) commutative property of addition
(3) multiplication property of equality ( 4) distributive property of multiplication over addition
34) Officials in a town use a function, C, to analyze traffic patterns. represents the rate of traffic
through an intersection where n is the number of observed vehicles in a specified time interval.
What would be the most appropriate domain for the function?
1) {…-2,-1,0,1,2,3,…} 2) {…-2,-1,0,1,2,3}
35) If , which statement is always true?
1) f(x) < 0 3) If x < 0, then f(x) < 0.
2) f(x) > 0 4) If x > 0, then f(x) > 0.
2 212 8 9 8 7x x
1) 4 12 2) 4 8 3) 4 4 4) 4 12n n n na n a n a n a n
1 1 13){0, ,1,1 ,2,2 } (4){0,1,2,3...}
2 2 2
1( ) 3
2f x x

Education Time Courseware Inc. Copyright 2014 Page 264
Practice Test 4
Open Ended
1 Solve | 4 5 | 13x algebraically for x.
2 Solve the equation below algebraically, and express the result in simplest radical form:
3 Express in simplest form 3 9
2 6 6 2
y
y y
4 What is the common ratio of the geometric sequence shown below?
-2, 4, -8, 16, …
5 A cup of soup is left on a countertop to cool. The table below gives the temperatures, in degrees
Fahrenheit, of the soup recorded over a 10-minute period.
Write an exponential regression equation for the data, rounding all values to the nearest thousandth.
6 Find the third term in the recursive sequence , where .
7 Determine the sum of the first twenty terms of the sequence whose first five terms are
5, 14, 23, 32, and 41.

Education Time Courseware Inc. Copyright 2014 Page 265
8 The height, in inches, of 10 high school varsity basketball players are 78, 79, 79, 72, 75, 71, 74, 74, 83,
and 71. Find the interquartile range of this data set.
9 The table below shows the number of new stores in a coffee shop chain that opened during the years
1986 through 1994. Using to represent the year 1986 and y to represent the number of new
stores, write the exponential regression equation for these data. Round all values to the nearest
thousandth.
10 Determine the solution of the inequality | 3 – 2x | ≥ 7. ( the use of the graph below is optional)
11 The data collected by the biologist showing the growth of a colony of bacteria at the end of each hour
are displayed in the table below.
Write an exponential regression equation to model these data. Round all values to the nearest
thousandth.
Assuming this trend continues, use this equation to estimate, to the nearest ten, the number of
bacteria in the colony at the end of 7 hours.

Education Time Courseware Inc. Copyright 2014 Page 266
12 Graph the inequality for x. Graph the solution on the line below.
13 Find the sum of the first eight terms of the series
14 Emma recently purchased a new car. She decided to keep track of how many gallons of gas she
used on five of her business trips. The results are shown in the table below.
Write the linear regression equation for these data where
miles driven is the independent variable. (Round all
values to the nearest hundredth.)
15 Jim purchased a box of jelly beans. The nutrition label on the box stated that a serving of two
jelly beans contains a total of 10 Calories.
On the axes below, graph the function, C, where C (x) represents the number of Calories in x jelly
beans.
Write an equation that represents C (x).
A full box of jelly beans contains 180 Calories. Use the equation to determine the total number
of jelly beans in the box.
Miles Driven Number of
Gallons Used
150 7
200 10
400 19
600 29
1000 51

Education Time Courseware Inc. Copyright 2014 Page 267
16 Robert has two jobs. He earns $10 per hour babysitting his neighbor’s children and he earns
$14 per hour working at the coffee shop.
Write an inequality to represent the number of hours, x, babysitting and the number of hours, y,
working at the coffee shop that Robert will need to work to earn a minimum of $425.
Robert worked 20 hours at the coffee shop. Use the inequality to find the number of full hours he
must babysit to reach his goal of $425.
17 On the set of axes below, graph the function | 2 |y x
State the range of the function
State the domain over which the function is increasing.
Graph | 2 | 1y x
State the range of the function
State the domain over which the function is increasing.
18 Over what intervals is the function below increasing
what intervals is it decreasing?
Which quadrants does it occupy?
What is the domain and range

Education Time Courseware Inc. Copyright 2014 Page 268
19 For the following graph, describe the features, include: what intervals does it increase/decrease, what
quadrants does it reside in, what are it’s min/max, what are the intercepts, and what are the domain and
range?
20 A cup of soup is left on a countertop to cool. The
table below gives the temperatures, in degrees
Fahrenheit, of the soup recorded over a 10-minute
period.
Write an exponential regression equation for the
data, rounding all values to the nearest thousandth.
21 A wholesale t-shirt manufacturer charges the following prices for t-shirt orders:
$20 per shirt for shirt orders up to 20 shirts.
$15 per shirt for shirt between 21 and 40 shirts.
$10 per shirt for shirt orders between 41 and 80 shirts.
$5 per shirt for shirt orders over 80 shirts.
Graph the step function that represents the
cost for the number of t-shirts purchased
You've ordered 40 shirts and must pay shipping fees of $10.
How much is your total order?

Education Time Courseware Inc. Copyright 2014 Page 269
22 Solve algebraically:
[Only an algebraic solution can receive full credit.]
23 Use the data below to write the regression equation (y = ax + b) for the raw test score based on the
hours tutored. Round all values to the nearest hundredth.
Equation:
Create a residual plot on the axes below, using the residual scores in the table above.
Based on the residual plot, state whether the equation is a good fit for the data. Justify your answer

Education Time Courseware Inc. Copyright 2014 Page 270
2( ) 2f x x
24 Given the functions g(x), f(x), and h(x) shown below:
g(x)
Order g(x), f(x), and h(x) from greatest to least by average rate of change over the interval 0 2x
25 The graph of ( )f x is shown here:
What are the zeroes of the function?
If 2( )f x ax bx c what is ( )f x in factored form?
26) Factor the expression completely.
27) Write an equation that defines as a trinomial where . Solve for x
when .

Education Time Courseware Inc. Copyright 2014 Page 271
28) Robin collected data on the number of hours she watched television on Sunday through Thursday
nights for a period of 3 weeks. The data are shown in the table below.
Using an appropriate scale on the number line below, construct a box plot for the 15 values.
29) A rectangular garden measuring 12 meters by 16 meters is to have a walkway installed around it with
a width of x meters, as shown in the diagram below. Together, the walkway and the garden have an
area of 396 square meters.
Write an equation that can be used to find x, the width of
the walkway. Describe how your equation models the
situation. Determine and state the width of the
walkway, in meters.
30) An animal shelter spends $2.35 per day to care for each cat and $5.50 per day to care for each dog.
Pat noticed that the shelter spent $89.50 caring for cats and dogs on Wednesday. Write an equation
to represent the possible numbers of cats and dogs that could have been at the shelter on Wednesday.
Pat said that there might have been 8 cats and 14 dogs at the shelter on Wednesday. Are Pat’s
numbers possible? Use your equation to justify your answer. Later, Pat found a record showing that
there were a total of 22 cats and dogs at the shelter on Wednesday. How many cats were at the
shelter on Wednesday?
31) The function f has a domain of {1, 3, 5, 7} and a range of {2, 4, 6}.
Could f be represented by {(1,2), (3,4), (5,6), (7,2)}?
Justify your answer.
32) Express the product of 3x2 - 4x - 5 and x + 3 in standard form.

Education Time Courseware Inc. Copyright 2014 Page 272