common drug review - cadth.ca · common drug review august 2015 table of contents abbreviations ......
TRANSCRIPT

August 2015
Drug Aflibercept (Eylea) (40 mg/mL Solution for Intravitreal Injection available as a 2 mg single-use vial)
Indication Treatment of neovascular (wet) age-related macular degeneration (wAMD)
Listing request As per indication
Manufacturer Bayer Inc.
Common Drug Review Clinical Review Report

This review report was prepared by the Canadian Agency for Drugs and Technologies in Health (CADTH). In addition to CADTH staff, the review team included a clinical expert in specializing in the treatment of retinal disease (ophthalmologist) who provided input on the conduct of the review and the interpretation of findings. Through the CADTH Common Drug Review (CDR) process, CADTH undertakes reviews of drug submissions, resubmissions, and requests for advice, and provides formulary listing recommendations to all Canadian publicly funded federal, provincial, and territorial drug plans, with the exception of Quebec. The report contains an evidence-based clinical and/or pharmacoeconomic drug review, based on published and unpublished material, including manufacturer submissions; studies identified through independent, systematic literature searches; and patient-group submissions. In accordance with CDR Update — Issue 87, manufacturers may request that confidential information be redacted from the CDR Clinical and Pharmacoeconomic Review Reports. The information in this report is intended to help Canadian health care decision-makers, health care professionals, health systems leaders, and policy-makers make well-informed decisions and thereby improve the quality of health care services. The information in this report should not be used as a substitute for the application of clinical judgment with respect to the care of a particular patient or other professional judgment in any decision-making process, nor is it intended to replace professional medical advice. While CADTH has taken care in the preparation of this document to ensure that its contents are accurate, complete, and up-to-date as of the date of publication, CADTH does not make any guarantee to that effect. CADTH is not responsible for the quality, currency, propriety, accuracy, or reasonableness of any statements, information, or conclusions contained in the source documentation. CADTH is not responsible for any errors or omissions or injury, loss, or damage arising from or relating to the use (or misuse) of any information, statements, or conclusions contained in or implied by the information in this document or in any of the source documentation. This document is intended for use in the context of the Canadian health care system. Other health care systems are different; the issues and information related to the subject matter of this document may be different in other jurisdictions and, if used outside of Canada, it is at the user’s risk. This disclaimer and any questions or matters of any nature arising from or relating to the content or use (or misuse) of this document will be governed by and interpreted in accordance with the laws of the Province of Ontario and the laws of Canada applicable therein, and all proceedings shall be subject to the exclusive jurisdiction of the courts of the Province of Ontario, Canada. CADTH takes sole responsibility for the final form and content of this document, subject to the limitations noted above. The statements and conclusions in this document are those of CADTH and not of its advisory committees and reviewers. The statements, conclusions, and views expressed herein do not necessarily represent the views of Health Canada or any Canadian provincial or territorial government. Production of this document is made possible by financial contributions from Health Canada and the governments of Alberta, British Columbia, Manitoba, New Brunswick, Newfoundland and Labrador, Northwest Territories, Nova Scotia, Nunavut, Ontario, Prince Edward Island, Saskatchewan, and Yukon. You are permitted to make copies of this document for non-commercial purposes, provided it is not modified when reproduced and appropriate credit is given to CADTH. You may not otherwise copy, modify, translate, post on a website, store electronically, republish, or redistribute any material from this document in any form or by any means without the prior written permission of CADTH. Please contact CADTH’s Vice-President of Corporate Services at [email protected] with any inquiries about this notice or other legal matters relating to CADTH’s services.
CDR CLINICAL REVIEW REPORT FOR EYLEA
i
Common Drug Review August 2015
TABLE OF CONTENTS
ABBREVIATIONS ........................................................................................................................................... III EXECUTIVE SUMMARY ................................................................................................................................. IV 1. INTRODUCTION ..................................................................................................................................... 1 1.1 Disease Prevalence and Incidence ............................................................................................... 1 1.2 Standards of Therapy .................................................................................................................. 1 1.3 Drug ............................................................................................................................................. 2 2. OBJECTIVES AND METHODS ................................................................................................................. 4 2.1 Objectives .................................................................................................................................... 4 2.2 Methods ...................................................................................................................................... 4 3. RESULTS ................................................................................................................................................ 6 3.1 Findings From the Literature ....................................................................................................... 6 3.2 Included Studies .......................................................................................................................... 8 3.3 Patient Disposition .................................................................................................................... 12 3.4 Exposure to Study Treatments .................................................................................................. 13 3.5 Critical Appraisal ........................................................................................................................ 13 3.6 Efficacy ....................................................................................................................................... 15 3.7 Harms......................................................................................................................................... 19 4. DISCUSSION ........................................................................................................................................ 22 4.1 Summary of Available Evidence ................................................................................................ 22 4.2 Interpretation of Results ........................................................................................................... 22 4.3 Other Considerations................................................................................................................. 24 5. CONCLUSIONS ..................................................................................................................................... 25 APPENDIX 1: PATIENT INPUT SUMMARY .................................................................................................... 26 APPENDIX 2: LITERATURE SEARCH STRATEGY ............................................................................................ 29 APPENDIX 3: EXCLUDED STUDIES ............................................................................................................... 32 APPENDIX 4: DETAILED OUTCOME DATA ................................................................................................... 33 APPENDIX 5: VALIDITY OF OUTCOME MEASURES ...................................................................................... 54 APPENDIX 6: SUMMARY OF EXTENSION PHASE (96 WEEKS) ...................................................................... 58 REFERENCES ................................................................................................................................................ 62
Tables Table 1: Summary of Results ....................................................................................................................... vii Table 2: Key Characteristics of Aflibercept and Ranibizumab ...................................................................... 3 Table 3: Inclusion Criteria for the Systematic Review .................................................................................. 4 Table 4: Details of Included Studies .............................................................................................................. 7 Table 5: Summary of Demographics and Baseline Characteristics (Full Analysis Set) .................................. 9 Table 6: Patient Disposition ........................................................................................................................ 13

CDR CLINICAL REVIEW REPORT FOR EYLEA
ii
Common Drug Review August 2015
Table 7: Key Efficacy Outcomes .................................................................................................................. 17 Table 8: Harms ............................................................................................................................................ 21 Table 9: Summary of Demographics and Baseline Characteristics (Full Analysis Set) ............................... 33 Table 10: Patient Disposition (Detailed) ..................................................................................................... 34 Table 11: Treatment Exposure During Year 1 (Safety Analysis Set) ........................................................... 35 Table 12: Treatment Compliance During Year 1 (Full Analysis Set) ........................................................... 36 Table 13: Sensitivity Analyses of the Proportion of Patients Who Maintained Vision (Per-Protocol
Analysis Set) ................................................................................................................................ 36 Table 14: Sensitivity Analyses of the Proportion of Patients Who Maintained Vision (Full Analysis Set) .. 37 Table 15: Change from Baseline to Week 52 in ETDRS Letter Score in the Study Eye (Last Observation
Carried Forward) (Full Analysis Set) ............................................................................................ 38 Table 16: Change From Baseline to Week 52 in NEI VFQ-25 (Full Analysis Set) ......................................... 39 Table 17: Proportion of Patients With Visual Acuity of 20/40 or Better .................................................... 39 Table 18: Change From Baseline to Week 52 in Central Retinal Thickness (Full Analysis Set) ................... 40 Table 19: Change From Baseline to Week 52 in NEI VFQ-25 Subscale (Full Analysis Set) .......................... 40 Table 20: Change From Baseline to Week 52 in EuroQol 5-Dimensions Questionnaire Total Score
(Full Analysis Set) ........................................................................................................................ 42 Table 21: Overall Adverse Event Profile During Year 1 (Safety Analysis Set) ............................................. 43 Table 22: Ocular Treatment-Emergent Adverse Events in the Study Eye Occurring in at Least 5%
of Patients (Safety Analysis Set) .................................................................................................. 44 Table 23: Non-ocular Treatment-Emergent Adverse Events Occurring in at Least 5% of Patients
(Safety Analysis Set) .................................................................................................................... 44 Table 24: All Ocular, Injection-Related Treatment-Emergent Adverse Events (≥ 2%) in the
Study Eye by Patient (Safety Analysis Set) .................................................................................. 46 Table 25: All Ocular Serious Adverse Events in the Study Eye (Safety Analysis Set) .................................. 47 Table 26: Ocular Serious Adverse Events in the Fellow Eye by Patient (Safety Analysis Set) .................... 48 Table 27: All Non-ocular Serious Adverse Events (Safety Analysis Set) ..................................................... 49 Table 28: All Ocular Injection-Related Serious Adverse Events in the Study Eye (Safety Analysis Set) ..... 49 Table 29: Number of Patients with Treatment-Emergent Adverse Events Causing Discontinuation
of Study Drug .............................................................................................................................. 50 Table 30: Subgroup Analysis of the Proportion of Patients With Vision Maintained (Full Analysis Set) ... 51 Table 31: Subgroup Analysis of Change in ETDRS Letter Score at Week 52 From Baseline
(Full Analysis Set) ........................................................................................................................ 52 Table 32: Subgroup Analysis of the Proportion of Patients Who Gained 15 or More Letters
(Full Analysis Set) ........................................................................................................................ 53 Table 33: Validity and Minimal Clinically Important Differences of Outcome Measures .......................... 54 Table 34: Summary of Results at Week 96 ................................................................................................. 59 Table 35: Visual Outcomes at Week 96 — Full Analysis Set ....................................................................... 59 Table 36: Anatomic Outcomes at Week 96 — Full Analysis Set ................................................................. 59 Table 37: Most Frequently Reported Serious Adverse Events — Safety Analysis Set ................................ 60 Table 38: Number of Injections During Weeks 52 to 96 ............................................................................. 61 Figure Figure 1: QUOROM Flow Diagram for Inclusion and Exclusion of Studies ................................................... 6

CDR CLINICAL REVIEW REPORT FOR EYLEA
iii
Common Drug Review August 2015
ABBREVIATIONS
AE adverse event
AMD age-related macular degeneration
BCVA best corrected visual acuity
CI confidence interval
CNV choroidal neovascularization
CRT central retinal thickness
EQ-5D EuroQol 5-Dimensions Questionnaire
ETDRS Early Treatment Diabetic Retinopathy Study
FAS full analysis set
IVT intravitreal
NEI VFQ-25 National Eye Institute 25-Item Visual Function Questionnaire
OCT optical coherence tomography
PDT photodynamic therapy
PPS per-protocol analysis set
QoL quality of life
RCT randomized controlled trial
RR relative risk
SAE serious adverse event
SAF safety analysis set
TEAE treatment-emergent adverse event
VA visual acuity
VEGF vascular endothelial growth factor
wAMD neovascular (wet) age-related macular degeneration
WDAE withdrawal due to adverse event

CDR CLINICAL REVIEW REPORT FOR EYLEA
iv
Common Drug Review August 2015
EXECUTIVE SUMMARY
Introduction Age-related macular degeneration (AMD) is a degenerative disease of the macula. In Canada, about one million people currently have early AMD and approximately 250,000 have the advanced form of AMD.1,2 AMD is the leading cause of registered visual impairment in Canada.3 The prevalence of blindness due to AMD in Canada has been estimated at more than 100,000.4,5 There are two types of AMD: dry AMD and neovascular (wet) AMD (wAMD). While wAMD develops in only 10% to 20% of people with dry AMD, it accounts for more than 90% of those who have advanced vision loss.4 The hallmark of wAMD is choroidal neovascularization, which is an abnormal angiogenic process modulated by growth factors including vascular endothelial growth factor (VEGF).6 Currently, there is no cure for wAMD. The goal of treatment is to minimize vision loss and disability in order to maintain independence.7 The first line of pharmacological therapy for wAMD in Canada is 0.5 mg ranibizumab, a monoclonal antibody that inhibits VEGF and that is administered monthly by intravitreal (IVT) injection.8 Pegaptanib and photodynamic therapy (PDT) using verteporfin are also indicated for the treatment of wAMD in Canada, but as these treatments are limited to stabilization of the disease and produce little to no improvement in vision, they are generally used as a second-line therapy in clinical practice. For instance, PDT is usually reserved for patients with wAMD for whom IVT injection is not suitable. Bevacizumab is a much larger antibody fragment derived from the same parent antibody as ranibizumab. It is not approved for treatment of wAMD in Canada, although it is used off-label for treating wAMD in patients who are ineligible for ranibizumab treatment coverage. Aflibercept (Eylea) is a novel VEGF inhibitor that is indicated in Canada for the treatment of patients with wAMD. Aflibercept is supplied as a solution for IVT injection (40 mg/mL) at a dose of 2 mg every eight weeks after three initial monthly injections.9 The objective of this report was to review the beneficial and harmful effects of aflibercept at the dosing regimen recommended by Health Canada for the treatment of wAMD.
Results and Interpretation Included studies Two similarly designed, double-blind, multi-centre, active-controlled, randomized controlled trials (RCTs) (VIEW 110 and VIEW 211) met the inclusion criteria for the review. Both studies assessed whether aflibercept was non-inferior to ranibizumab for preventing moderate vision loss (≥ 15 Early Treatment Diabetic Retinopathy Study [ETDRS] letters) in treatment-naive patients with wAMD.12 The VIEW 1 and VIEW 2 studies comprised a 52-week-long, fixed-dose phase (which is the focus of the report) and a subsequent flexible-dose phase through 96 weeks (which is summarized in Appendix 6). Efficacy More than 94% of patients achieved the primary end point of maintained vision, losing fewer than 15 letters on the ETDRS letter score at 52 weeks in both treatment groups in VIEW 1 and VIEW 2. The between-treatment differences (aflibercept versus ranibizumab) in the proportion of patients with vision maintained at week 52 were –0.7% (95% confidence interval [CI], –4.5% to 3.1%) and –1.13% (95% CI, –4.81% to 2.55%) in VIEW 1 and VIEW 2, respectively. These differences met the predefined criteria for non-inferiority.

CDR CLINICAL REVIEW REPORT FOR EYLEA
v
Common Drug Review August 2015
An improvement of eight to nine ETDRS letters from baseline was observed in both studies, irrespective of treatment. There was improvement in VA (≥ 15 ETDRS letters gained) in 31% to 34% of patients treated with ranibizumab and in 31% of patients treated with aflibercept, in both studies. There was improvement in VA (≥ 30 ETDRS letters gained) in 6% of patients treated with ranibizumab and 5% to 7% of patients treated with aflibercept, in both studies. vvvvv vvvv v% and 3% of patients experienced a moderate or severe reduction in VA (≥ 15 or ≥ 30 ETDRS letters lost, respectively) in both treatment groups in both studies. None of the changes in VA between treatment groups in either study were statistically significant. VvvvvvvvvvvvvvvvvvvvvvvvvvvvvvvvvvvvvvvvvvvvvvvvvvvVvvvvvvvvvvvvvvvvvvvvvvvvvvvvvvvvvvvvvvvvvvvvvvvvvvvvvvvvVVVVvvvvvvvVVVVvvvvvvvvvvvvvvvvvvvvvvvvvvvvvvvvvvvvvvvvvvvvvvvvvvvvvvvvvvvvvvvvvvvvvvvvvvvvvvvvvvvvvvvvvvvvvvvvvvvvvvvvvvvvvvvvvvvvvvvvvvvvvvvvvvv Quality of life (QoL), as measured by the National Eye Institute 25-Item Visual Function Questionnaire (NEI VFQ-25) score, improved by at least four points by week 52 in both treatment groups in both studies. This improvement exceeded the minimal clinically important difference (4 points). The magnitude of the changes in the NEI VFQ-25 score observed in the ranibizumab group was similar to that seen in previously published studies,13-15 and there were no statistically significant differences between treatments in the change in NEI VFQ-25 scores in either study. At week 52, the central retinal thickness (CRT) had decreased by vvv mcv in both treatment groups in VIEW 1, and by 138 μm to 149 μm in VIEW 2, but there were no statistically significant differences between treatments in the change in central retinal thickness in either study. The aforementioned results are consistent with the conclusion that aflibercept is non-inferior to ranibizumab in maintaining vision in treatment-naive patients with wAMD.
Harms The overall safety profile appears to be similar between ranibizumab and aflibercept at the recommended dosing regimen. The incidence of treatment-emergent adverse events (TEAEs) was similar between ranibizumab and aflibercept (85% to 95% versus 90% to 95% for ranibizumab versus aflibercept, respectively), as was the incidence of ocular TEAEs in the study eye (64% to 81% versus 65% to vv% for ranibizumab versus aflibercept, respectively) and non-ocular TEAEs (62% to 77% versus 69% to 74% for ranibizumab versus aflibercept, respectively). The most frequently reported ocular adverse events (AEs) were conjunctival hemorrhage, vitreous floaters, eye pain, vitreous detachment, vvvvvvv vv, vvvvvvv vvvvvvv vvvvvvvvvvvvvv, vvvvvvv vvvvvvvvvvvv, and increased intraocular pressure. The incidence of serious TEAEs was similar for ranibizumab and aflibercept (15.6% to 18.5% for ranibizumab and 12.5% to 22%, for aflibercept), and most TEAEs were attributable to the injection procedure or the progression of the disease. The incidence of ocular serious adverse events (SAEs) in the study eye was numerically higher in the ranibizumab group than in the aflibercept group (3.3% versus 1.0% in VIEW 1, and 3.1% versus 2.9% in VIEW 2). The reported ocular SAEs in the study eye were mainly endophthalmitis, VA reduction, retinal hemorrhage, and vvvvvvvvv vvvvvvv vvvvvvvvvvvvv. Non-ocular SAEs were similar in both treatment groups (8.9% to 18.8% and 12.4% to 16.8% for ranibizumab and aflibercept, respectively). The incidence of AEs leading to withdrawal from the study during the 52 weeks was low (< 3%) and was similar between treatment groups in both studies. vvv vvvv vvvvvv vv vvvvvvv vv vvvvvvvvvv vvv vvv vvvvvvvvv, vvvvvvvvv vvvvvvv vvvvvvvvvv, vvvvvvv vv, vvv vvvvvvv vvvvvvvvvv.
CDR CLINICAL REVIEW REPORT FOR EYLEA
vi
Common Drug Review August 2015
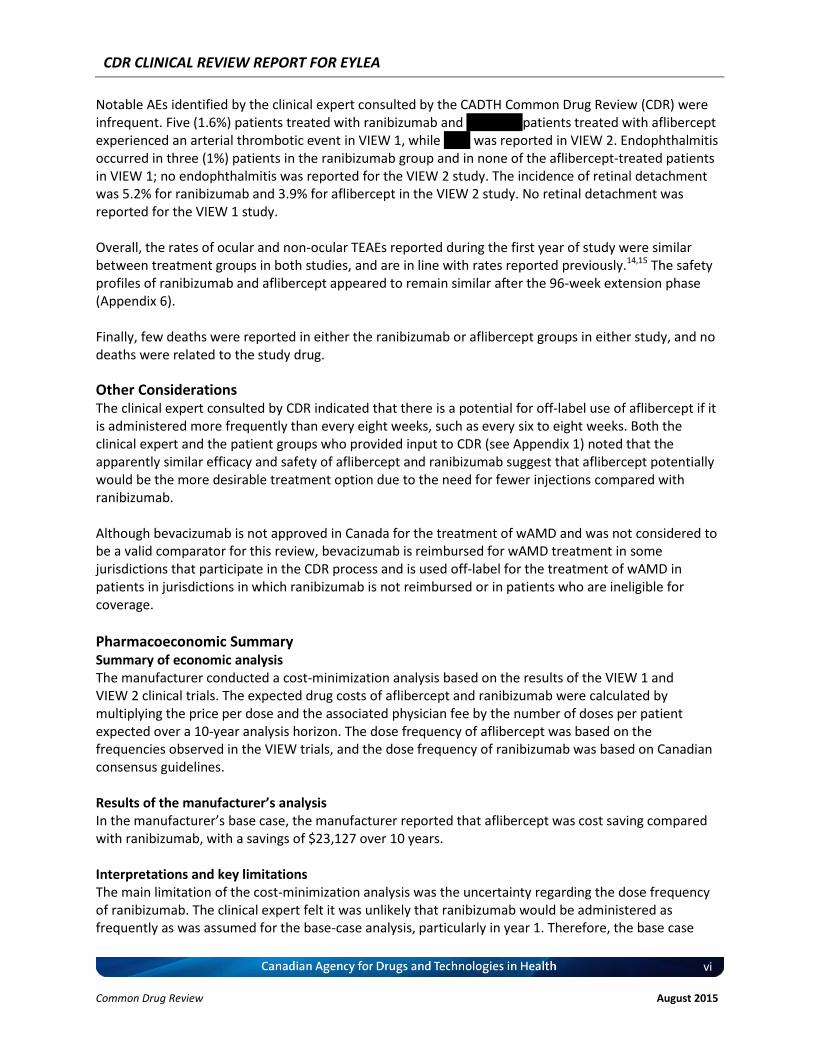
Notable AEs identified by the clinical expert consulted by the CADTH Common Drug Review (CDR) were infrequent. Five (1.6%) patients treated with ranibizumab and vv (v.v%) patients treated with aflibercept experienced an arterial thrombotic event in VIEW 1, while vvvv was reported in VIEW 2. Endophthalmitis occurred in three (1%) patients in the ranibizumab group and in none of the aflibercept-treated patients in VIEW 1; no endophthalmitis was reported for the VIEW 2 study. The incidence of retinal detachment was 5.2% for ranibizumab and 3.9% for aflibercept in the VIEW 2 study. No retinal detachment was reported for the VIEW 1 study. Overall, the rates of ocular and non-ocular TEAEs reported during the first year of study were similar between treatment groups in both studies, and are in line with rates reported previously.14,15 The safety profiles of ranibizumab and aflibercept appeared to remain similar after the 96-week extension phase (Appendix 6). Finally, few deaths were reported in either the ranibizumab or aflibercept groups in either study, and no deaths were related to the study drug.
Other Considerations The clinical expert consulted by CDR indicated that there is a potential for off-label use of aflibercept if it is administered more frequently than every eight weeks, such as every six to eight weeks. Both the clinical expert and the patient groups who provided input to CDR (see Appendix 1) noted that the apparently similar efficacy and safety of aflibercept and ranibizumab suggest that aflibercept potentially would be the more desirable treatment option due to the need for fewer injections compared with ranibizumab. Although bevacizumab is not approved in Canada for the treatment of wAMD and was not considered to be a valid comparator for this review, bevacizumab is reimbursed for wAMD treatment in some jurisdictions that participate in the CDR process and is used off-label for the treatment of wAMD in patients in jurisdictions in which ranibizumab is not reimbursed or in patients who are ineligible for coverage.
Pharmacoeconomic Summary Summary of economic analysis The manufacturer conducted a cost-minimization analysis based on the results of the VIEW 1 and VIEW 2 clinical trials. The expected drug costs of aflibercept and ranibizumab were calculated by multiplying the price per dose and the associated physician fee by the number of doses per patient expected over a 10-year analysis horizon. The dose frequency of aflibercept was based on the frequencies observed in the VIEW trials, and the dose frequency of ranibizumab was based on Canadian consensus guidelines. Results of the manufacturer’s analysis In the manufacturer’s base case, the manufacturer reported that aflibercept was cost saving compared with ranibizumab, with a savings of $23,127 over 10 years. Interpretations and key limitations The main limitation of the cost-minimization analysis was the uncertainty regarding the dose frequency of ranibizumab. The clinical expert felt it was unlikely that ranibizumab would be administered as frequently as was assumed for the base-case analysis, particularly in year 1. Therefore, the base case

CDR CLINICAL REVIEW REPORT FOR EYLEA
vii
Common Drug Review August 2015
may have overestimated the expected cost of ranibizumab and the relative cost savings associated with aflibercept. Results of the CADTH Common Drug Review analysis Considering alternative dosing schedules, as ranibizumab is rarely administered monthly in clinical practice in year 1, CDR tested the impact of individualizing ranibizumab in the first year, resulting in an estimated cost savings of $15,019 over 10 years for aflibercept. Various CDR analyses resulted in cost-savings estimates of approximately $7,000 to $15,000 over 10 years for aflibercept. At the submitted price of $1,418 per vial, aflibercept is less costly than ranibizumab. The extent of the cost savings is highly dependent on the dose frequency used for each comparator.
Conclusions The results of the two double-blind, multinational, active-controlled RCTs (VIEW 1 and VIEW 2) suggest that aflibercept is non-inferior to ranibizumab for maintaining vision in treatment-naive patients with wAMD. At least 94% of patients maintained their vision after 52 weeks of treatment, irrespective of whether they were treated with aflibercept or ranibizumab. There were no statistically significant differences between treatment groups in either study with respect to other outcomes, including changes in VA, the proportion of patients with legal blindness, and changes in QoL. Aflibercept and ranibizumab have similar safety profiles, as the incidences of TEAEs, SAEs, and withdrawals due to adverse event (WDAEs) were similar for both treatment groups in both studies. The results of the extension phase of VIEW 1 and VIEW 2 suggest that the similar efficacy and safety profile of aflibercept and ranibizumab observed at 52 weeks appears to persist through 96 weeks of treatment.
TABLE 1: SUMMARY OF RESULTS
Outcome VIEW 1 VIEW 2
RAN AFL RAN AFL
N = 304 N = 303 N = 304 N = 303
Patients With Maintaineda Vision at Week 52 (PPS)
n/N (%) 254/269 (94.4)
252/265 (95%) 254/269 (94.4)
258/270 (95.6)
Between-group difference in proportion (%) (95% CI)
–0.7 (–4.5 to 3.1) –1.13 (–4.8 to 2.6)
RR (95% CI) 0.99 (0.95 to 1.0) 0.99 (0.95 to 1.0)
NNT 100 100
Change From Baseline to Week 52 in ETDRS Letter Score in the Study Eye (FAS, LOCF)
Baseline, mean (SD) 54.0 (13.4) 55.7 (12.8) 53.8 (13.5) 51.6 (13.9)
At 52 weeks, mean (SD) 62.1 (17.7) 63.6 (16.9) 63.1 (16.6) 60.5 (17.5)
Mean change from baseline (SD) 8.1 (15.3) 7.9 (15.0) 9.4 (13.5) 8.9 (14.4)
LSM differenceb
(95% CI) between groups
0.26 (–1.97 to 2.5)
–0.90 (–3.1 to 1.3)
P value 0.82 0.41
Patients Lost ≥ 15 Letters in the ETDRS Letter Score in the Study Eye at Week 52 (FAS, LOCF)
n/N (%) vvvvvvvvvvvv vvvvvvvvvvvv vvvvvvvvvvvv vvvvvvvvvvvvv
Between-group difference in proportion (%) (95% CI)
vvvvvvvvvvvvvvvvvv vvvvvvvvvvvvvvvvvvvv
P value vvvv VV

CDR CLINICAL REVIEW REPORT FOR EYLEA
viii
Common Drug Review August 2015
Outcome VIEW 1 VIEW 2
RAN AFL RAN AFL
N = 304 N = 303 N = 304 N = 303
RR (95% CI) vvvvvvvvvvvvvvvvvvv vvvvvvvvvvvvvvvvvvv
NNT vvv vvv
P value vvvv vvvv
Legal blindness
Baseline, n (%) vvvvvvvvv vvvvvvvv vvvvvvvvv vvvvvvvvv
At week 52, n (%) vvvvvvvv vvvvvvvv vvvvvvvv vvvvvvvvv
Between-group difference in proportion (%) (95% CI) at 52 weeks
vvvvvvvvvvvvvvvvv vvvvvvvvvvvvvvvvvvvv
Withdrawals
n/N (%) vvvvvvvvvvvv vvvvvvvvvvvv vvvvvvvvvvvv vvvvvvvvvvvv
SAEs
n/N (%) 71/304 (23.4) 58/303 (19.1) 36/291 (12.4)
50/307 (16.3)
RR (95% CI) 1.22 (0.90 to 1.66) 0.76 (0.51 to 1.13)
NNH 25 25
WDAEs
n/N (%) 4/306 (1.3) 6/303 (2.0) 3/303 (1.0) 10/313 (3.3)
RR (95% CI) 0.66 (0.19 to 2.32) 0.31 (0.09 to 1.12)
NNH 100 50
Notable harm(s)
Injection-related ocular TEAE
n/N (%) 183/304 (60.2) 164/303 (54.1) 94/291 (32.3)
92/307 (30.0)
RR (95% CI) 1.11 (0.97 to 1.28) 1.08 (0.85 to 1.37)
NNH 17 50
AE = adverse event; AFL = aflibercept; CI = confidence interval; ETDRS = Early Treatment Diabetic Retinopathy Study; FAS = full analysis set; LOCF = last observation carried forward; LSM = least squares mean; NC = not calculated; NNH = number needed to harm; NNT = number needed to treat; PPS = per-protocol analysis set; RAN = ranibizumab; RR = relative risk; SAE = serious adverse event; SD = standard deviation; TEAE = treatment-emergent adverse event; VA = visual acuity; WDAE = withdrawal due to adverse event. a Maintained vision defined as VA loss < 15 letters in ETDRS.
b Difference is ranibizumab minus aflibercept; CI was calculated using a normal approximation. LSM differences were calculated
using analysis of covariance (ANCOVA) main-effect model with baseline measure as a covariate. LSM was reported and adjusted (ANCOVA) with various important baseline assessments such as VA for all efficacy outcomes analysis (such as the between-treatment group difference in proportion or the between-group difference of changes from baseline).

CDR CLINICAL REVIEW REPORT FOR EYLEA
1
Common Drug Review August 2015
1. INTRODUCTION
1.1 Disease Prevalence and Incidence Age-related macular degeneration (AMD) is a degenerative disease of the macula, the part of the retina responsible for detailed vision. In Canada, about one million people currently have early AMD and approximately 250,000 have an advanced form of AMD.1,2 Given the aging population, the number of persons aged 85 years and older and, subsequently, those affected by AMD, is expected to double over the next 25 years.8 In the United States, AMD is expected to affect 7.5 million people by 2020.16 AMD is the leading cause of vision loss in people older than 50 years in North America,17,18 and the leading cause of registered visual impairment in Canada, according to Canadian National Institute for the Blind statistics.3 The prevalence of blindness from AMD in Canada has been estimated at more than 100,000.4,5 Given the effect of blindness on activities of daily living, in particular self-care and mental health, AMD will become an even more important health issue as Canada’s population ages.19 There are two types of AMD: dry AMD and neovascular (wet) AMD (wAMD). In the early stages of AMD, the dry form predominates, accounting for 90% of the disease burden. While wAMD develops in only 10% to 20% of people with dry AMD, it accounts for more than 90% of those who have advanced vision loss.4 The hallmark of wAMD is choroidal neovascularization, which is an abnormal angiogenic process modulated by growth factors, including vascular endothelial growth factor (VEGF).6 It is characterized by the growth of abnormal new blood vessels arising from the choroid, leading to subretinal fluid, blood, and lipid exudation, culminating in the destruction of macular vision through the formation of disciform, fibrovascular scarring. Blocking the VEGF signal that contributes to the progression of choroidal neovascularization may allow for stabilization or regression of the disease process without adversely affecting the overlying retina. wAMD was originally classified by the proximity of the leading edge of the lesion to the centre of the macula (fovea): extrafoveal, juxtafoveal, and subfoveal. wAMD may also be subdivided angiographically into predominantly classic, minimally classic, and pure occult forms. About 40% of wAMD is of the classic subtypes, while about 60% is of the occult subtype.4
1.2 Standards of Therapy Currently, there is no cure for wAMD. The goal of treatment is to minimize vision loss and disability in order to maintain independence.7 Recent practice guidelines (June 2012),8 based on a national consensus from Canadian retina specialists for the management of wAMD, state that intravitreal (IVT) antivascular endothelial growth factor (anti-VEGF) drugs significantly improve vision outcomes in patients with wAMD by preventing and, in some cases, reversing the damage caused by wAMD.8 The standard pharmacological therapy is 0.5 mg ranibizumab IVT, administered monthly.8 When monthly dosing is not feasible, an individualized ranibizumab regimen with close monitoring by optical coherence tomography (OCT) is an option. Treatment should be maintained in the presence of disease activity unless the physician believes there is sufficient permanent structural damage that continued treatment would provide no visual benefit.8 Pegaptanib (Macugen), an anti-VEGF aptamer that binds VEGF 165, and photodynamic therapy (PDT) using verteporfin (Visudyne), are also indicated for the treatment of wAMD in Canada. The CADTH Common Drug Review (CDR) clinical expert involved in this review, however, indicated that pegaptanib has rarely been used in clinical practice since ranibizumab was approved in Canada. PDT is occasionally used for patients with wAMD who are not suitable for IVT therapy. Bevacizumab (Avastin), a VEGF
CDR CLINICAL REVIEW REPORT FOR EYLEA
2
Common Drug Review August 2015
antibody that is approved for the treatment of cancers such as lung cancer, has been used off-label as monotherapy or in combination (with PDT) as an IVT treatment for wAMD in some patients in some Canadian jurisdictions where ranibizumab is not reimbursed or in patients who are ineligible for coverage.
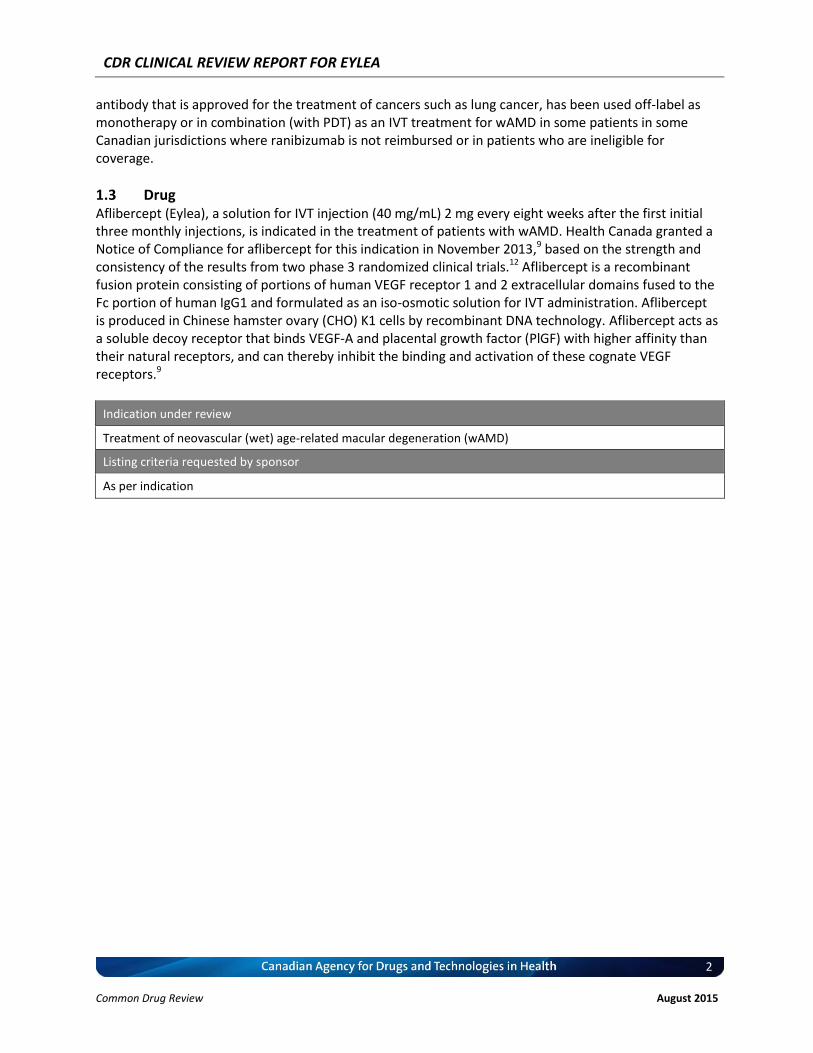
1.3 Drug Aflibercept (Eylea), a solution for IVT injection (40 mg/mL) 2 mg every eight weeks after the first initial three monthly injections, is indicated in the treatment of patients with wAMD. Health Canada granted a Notice of Compliance for aflibercept for this indication in November 2013,9 based on the strength and consistency of the results from two phase 3 randomized clinical trials.12 Aflibercept is a recombinant fusion protein consisting of portions of human VEGF receptor 1 and 2 extracellular domains fused to the Fc portion of human IgG1 and formulated as an iso-osmotic solution for IVT administration. Aflibercept is produced in Chinese hamster ovary (CHO) K1 cells by recombinant DNA technology. Aflibercept acts as a soluble decoy receptor that binds VEGF-A and placental growth factor (PlGF) with higher affinity than their natural receptors, and can thereby inhibit the binding and activation of these cognate VEGF receptors.9
Indication under review
Treatment of neovascular (wet) age-related macular degeneration (wAMD)
Listing criteria requested by sponsor
As per indication

CDR CLINICAL REVIEW REPORT FOR EYLEA
3
Common Drug Review August 2015
TABLE 2: KEY CHARACTERISTICS OF AFLIBERCEPT AND RANIBIZUMAB
IOP = intraocular pressure; PIGF = placental growth factor; SAE = serious adverse event; VEGF = vascular endothelial growth factor; wAMD = neovascular (wet) age-related macular degeneration. a
Health Canada indication. Source: Product monographs for aflibercept
9 and ranibizumab.
20
Aflibercept Ranibizumab
Mechanism of Action Aflibercept is a recombinant fusion protein consisting of portions of human VEGF receptor 1 and 2 extracellular domains. Aflibercept acts as a soluble decoy receptor that binds VEGF-A and PlGF with higher affinity than their natural receptors, and can thereby inhibit the binding and activation of these cognate VEGF receptors.
9
Ranibizumab is a humanized recombinant monoclonal antibody fragment targeted against human VEGF-A. It binds with high affinity to all active VEGF-A isoforms, thereby preventing neovascularization and vascular leakage that contribute to the progression of AMD and macular edema causing visual impairment.
20
Indicationa Treatment of wAMD
Route of Administration Intravitreal injection
Recommended Dose 2 mg, every 8 weeks after initial 3 monthly injections
0.5 mg, once a month
Serious Side Effects/ Safety Issues
SAE: endophthalmitis, traumatic cataract, increased intraocular pressure, and vitreous detachment
Contraindications: patients who are hypersensitive to this drug, who have ocular or periocular infection, and who have active intraocular inflammation
SAE: endophthalmitis, rhegmatogenous retinal detachment, retinal tear and iatrogenic traumatic cataract, intraocular inflammation, and increased IOP
Contraindications: patients who are hypersensitive to this drug, who have active or suspected ocular or periocular infections, and who have active intraocular inflammation

CDR CLINICAL REVIEW REPORT FOR EYLEA
4
Common Drug Review August 2015
2. OBJECTIVES AND METHODS
2.1 Objectives To perform a review of the beneficial and harmful effects of aflibercept, a 40 mg/mL solution for IVT injection at the Health Canada–recommended dose and regimen for the treatment of wAMD.
2.2 Methods Studies selected for inclusion in the systematic review included the pivotal studies supporting the Health Canada indication provided in the manufacturer’s submission to CDR, as well as those meeting the inclusion criteria presented in Table 3.
TABLE 3: INCLUSION CRITERIA FOR THE SYSTEMATIC REVIEW
Patient Population Adults with wAMD Subgroup: baseline VA
Intervention Aflibercept (40 mg/mL solution for IVT injection), 2 mg, IVT injection every 8 weeks after 3 initial monthly injections.
Comparators Ranibizumaba
Outcomes Efficacy outcomes:
Change from baseline in VAb
QoL/vision function (assessed by validated measures, such as NEI VFQ-25)
Legal blindness
Change in CRT Harms outcomes:
AE
SAEs (ocular or non-ocular)
WDAE
Mortality
Notable AEs: endophthalmitis, retinal detachment, ATE
Study Design Published and unpublished DB RCTs
AE = adverse event; ATE = arterial thrombotic event; CRT = central retina thickness; DB = double-blind; IVT = intravitreal injection; QoL = quality of life; RCT = randomized controlled trial; SAE = serious adverse event; NEI VFQ-25 = National Eye Institute 25-Item Visual Function Questionnaire; VA = visual acuity; wAMD = neovascular (wet) age-related macular degeneration; WDAE = withdrawal due to adverse event.
a Standard pharmacotherapy available in Canada. Other approved drugs include verteporfin photodynamic therapy and
pegaptanib. Bevacizumab has been used off-label in Canada. b
VA change from baseline comprised absolute change, percentage of patients maintaining vision (defined as VA worsening from baseline of ≤ 15 letters), percentage of patients maintaining vision (defined as VA worsening from baseline of ≥ 15 letters or ≥ 30 letters visual acuity).
The literature search was performed by an information specialist using a peer-reviewed search strategy. Published literature was identified by searching the following bibliographic databases: MEDLINE (1946–) with in-process records and daily updates through Ovid, Embase (1974–) through Ovid, and PubMed. The search strategy consisted of both controlled vocabulary, such as the National Library of Medicine’s MeSH (Medical Subject Headings), and keywords. The main search concept was Eylea (aflibercept) and macular degeneration.

CDR CLINICAL REVIEW REPORT FOR EYLEA
5
Common Drug Review August 2015
No filters were applied to limit the retrieval by study type. Retrieval was not limited by publication year or by language. Conference abstracts were excluded from the search results. The initial search was completed on May 23, 2014. Regular alerts were established to update the search until the meeting of the Canadian Drug Expert Committee (CDEC) on Sept 17, 2014. Regular search updates were performed on databases that do not provide alert services. Grey literature (literature that is not commercially published) was identified by searching relevant websites from the following sections of the CADTH Grey Matters checklist (http://www.cadth.ca/en/resources/finding-evidence-is/grey-matters): health technology assessment agencies, health economics, clinical practice guidelines, drug regulatory approvals, advisories and warnings, drug class reviews, and databases (free). Google and other Internet search engines were used to search for additional Web-based materials. These searches were supplemented by reviewing the bibliographies of key papers and by contacting appropriate experts. In addition, the manufacturer of the drug was contacted for information regarding unpublished studies. 2.2.1 Supplemental issues 1. Validity of Outcome Measures: Early Treatment Diabetic Retinopathy Study (ETDRS), Snellen chart,
National Eye Institute 25-Item Visual Function Questionnaire (NEI VFQ-25) 2. Summary of findings from extension studies at 96 weeks. Two CDR clinical reviewers independently selected studies for inclusion in the review based on titles and abstracts, according to the predetermined protocol. Full-text articles of all citations considered potentially relevant by at least one reviewer were acquired. Reviewers independently made the final selection of studies to be included in the review, and differences were resolved through discussion. Included studies are presented in Table 4; excluded studies (with reasons) are presented in Appendix 3: EXCLUDED STUDIES.

CDR CLINICAL REVIEW REPORT FOR EYLEA
6
Common Drug Review August 2015
3. RESULTS
3.1 Findings From the Literature A total of two studies were identified from the literature for inclusion in the systematic review (Figure 1). The included studies are summarized in Table 2 and described in Section 3.2. A list of excluded studies is presented in Appendix 3: EXCLUDED STUDIES. FIGURE 1: QUOROM FLOW DIAGRAM FOR INCLUSION AND EXCLUSION OF STUDIES
7
Reports included Presenting data from 2 unique studies
168
Citations identified in literature search
2
Potentially relevant reports identified and screened
10
Total potentially relevant reports identified and screened
3
Reports excluded
8
Potentially relevant reports from other sources

CDR CLINICAL REVIEW REPORT FOR EYLEA
7
Common Drug Review August 2015
TABLE 4: DETAILS OF INCLUDED STUDIES
VIEW 1 VIEW 2
DES
IGN
S &
PO
PU
LATI
ON
S
Study Design Phase 3, DB, multinational, active-controlled, non-inferiority design RCT
Locations 154 sites in the United States and Canada
172 sites in Asia, Europe, and Australia12
Randomized (N)a 609 (in ranibizumab and aflibercept [2 mg every 8 weeks]) (1,217 in all 4 groups in total)
616 (in ranibizumab and aflibercept [2 mg every 8 weeks]) (1,240 in all 4 groups in total)
Inclusion Criteria ● Age ≥ 50 years with active subfoveal CNV lesions (any subtype) secondary to AMD; juxtafoveal lesions with leakage affecting the fovea were also allowed ● CNV comprising at least 50% of total lesion size ● BCVA between 73 and 25 ETDRS letter score (20/40 to 20/320 Snellen equivalent)12
Exclusion Criteria ●Patients with prior treatment for AMD (including an investigational drug or anti-VEGF therapy) in the study eye were excludedb12
DR
UG
S Intervention 2 mg aflibercept every 8 weeks (2q8), IVT injection after 3 initial monthly injections
Comparator(s) 0.5 mg ranibizumab (Rq4) IVT injection every 4 weeks
DU
RA
TIO
N
Phase
Screen phase 21 days (day –21 to day 0)
Run-in None
DB 52 weeks
Extension phase
44 weeks (from week 52 to week 96) 40 weeks (from week 52 to week 96)
Follow-up None
OU
TCO
MES
Primary End Point The primary end point analysis was the non-inferiority of the IVT aflibercept regimens to the IVT ranibizumab regimen in the proportion of patients maintaining vision at week 52 (losing < 15 ETDRS letters; per-protocol data set) in each study.
Other End Points Pre-specified secondary efficacy variables compared baseline data and data at week 52 regarding mean change in BCVA, gain or loss ≥ 15 letters, change in total NEI VFQ-25 score, and change in CNV area on fluorescein angiography. Anatomic measures included CRT and persistent fluid as assessed by OCT.12 Adverse events.
NO
TES Publications Heier et al. (2012)12
2q4 = 2 mg aflibercept every four weeks; 2q8 = 2 mg aflibercept every eight weeks; AFL = aflibercept; AMD = age-related macular degeneration; BCVA = best corrected visual acuity; CNV = choroidal neovascularization; CRT = central retinal thickness; DB = double-blind; ETDRS = Early Treatment Diabetic Retinopathy Study; IVT = intravitreal; NEI VFQ-25 = National Eye Institute 25-Item Visual Function Questionnaire; OCT = optical coherence tomography; RCT = randomized controlled trial; Rq4 = 0.5 ranibizumab every four weeks; VEGF = vascular endothelial growth factor. a Patients were randomized in a 1:1:1:1 ratio to the following regimens: 0.5 mg aflibercept every four weeks (0.5q4); 2 mg aflibercept every four weeks (2q4); 2 mg aflibercept every eight weeks (2q8) after three injections at weeks 0, 4, and 8 (to maintain masking, sham injections were given at the interim four-week visits after week 8); or 0.5 mg ranibizumab every four weeks (Rq4). Consecutively enrolled patients were assigned to treatment groups on the basis of a predetermined central randomization scheme with balanced allocation, managed by an interactive voice response system.12 In this review, only 2q4, 2q8, and Rq4 were reported. b Prior treatment with an approved anti-VEGF therapy in the fellow eye was allowed. Note: In addition to the one published article, six additional reports and documents were included: one submission package,21 two Clinical Study Reports,10,11 two FDA review reports,22,23 and one Health Canada review report.24 Source: Heier et al. (2012).12

CDR CLINICAL REVIEW REPORT FOR EYLEA
8
Common Drug Review August 2015
3.2 Included Studies 3.2.1 Description of studies Two studies (VIEW 110 and VIEW 211) that met the inclusion criteria for the review were identified. Both studies were non-inferiority designed, double-blind, randomized controlled trials (RCTs) that examined the efficacy and safety of aflibercept versus ranibizumab in the treatment of patients with wAMD. VIEW 1 was conducted at 154 sites in the US and Canada (N = 1,217) and VIEW 2 was conducted at 172 sites in Asia, Europe, and Australia (N = 1,240).10-12 Sample sizes in the ranibizumab (Rq4) and aflibercept (2q8) groups ranged from 606 to 616. The entire trial duration was 96 weeks, including a first year (52-week), fixed-dose interval phase and a second year (up to 96 weeks), flexible-dose interval phase. The primary objective of the two studies was to assess the efficacy of IVT aflibercept compared with ranibizumab in preventing moderate vision loss (i.e., loss of < 15 ETDRS letters) at week 52.12 In the included two trials, there were four treatment groups: 0.5 mg aflibercept every four weeks (0.5q4); 2 mg aflibercept every four weeks (2q4); 2 mg aflibercept every eight weeks (2q8) after three injections at weeks 0, 4, and 8 (to maintain masking, sham injections were given at the interim four-week visits after week 8); or 0.5 mg ranibizumab every four weeks (Rq4). This report focuses primarily on the comparative efficacy and safety profile of aflibercept (2 mg aflibercept every eight weeks [2q8] after three monthly injections with ranibizumab (0.5 mg ranibizumab every four weeks [Rq4]) at week 52. The results observed at week 96 are briefly summarized in Supplemental Issues (Appendix 6). 3.2.2 Populations a) Inclusion and exclusion criteria The key inclusion criteria included patients aged 50 years or older with active subfoveal choroidal neovascularization (CNV) lesions (any subtype) secondary to AMD, including juxtafoveal lesions that had affected the fovea as evidenced by fluorescein angiography in the study eye; CNV comprising at least 50% of total lesion size; and ETDRS best corrected visual acuity (BCVA) between 73 and 25 letters (20/40 to 20/320 Snellen equivalent). Patients with prior treatment for AMD (including an investigational drug or anti-VEGF therapy) in the study eye were excluded. Inclusion and exclusion criteria were designed to maintain constancy with the pivotal trials for ranibizumab (the reference drug, the comparator) and were consistent with regulatory guidelines for non-inferiority studies.12 b) Baseline characteristics Overall, the demographic and baseline characteristics of the patients included in the studies were balanced between treatment groups in both studies (Table 5). The mean age of the randomized patients was 73 to 78 years old (range from 49 to 99 years old). More female patients (57% to 59%) were included in both trials. Patients were predominantly Caucasian (95% to 97% in VIEW 1, and 71% to 73% in VIEW 2). The mean baseline BCVA letter scores ranged from 52 to 58 and were similar between the two treatment groups (see Table 5). The proportions of patients with 20/40 BCVA ranged from 4% to 6%. The most commonly represented lesion type was occult (38% to 39% in VIEW 1, and 36% to 40% in VIEW 2). The mean central retinal thickness (CRT) ranged from 315 μm to 343 μm. The mean CNV area ranged from 6.89 mm2 to 6.99 mm2 in VIEW 1, and from 8.01 mm2 to 8.22 mm2 in VIEW 2. Mean baseline NEI VFQ-25 total scores ranged from 69 to 73 out of a total of 100 possible points (see Table 5). More detailed information on baseline characteristics is presented in Appendix 4, Table 9.

CDR CLINICAL REVIEW REPORT FOR EYLEA
9
Common Drug Review August 2015
TABLE 5: SUMMARY OF DEMOGRAPHICS AND BASELINE CHARACTERISTICS (FULL ANALYSIS SET)
VIEW 1 VIEW 2
RAN AFL RAN AFL
N = 304 N = 301 N = 291 N = 306
Age (years)
Mean (SD) 78.2 (7.6) 77.9 (8.4) 73.0 (9.0) 73.8 (8.6)
Sex, n (%)
Female 172 (56.6) 178 (59.1) 169 (58.1) 175 (57.2)
Male 132 (43.4) 123 (40.9) 122 (41.9) 131 (42.8)
Baseline ETDRS BCVA, mean (SD)
54.0 (13.4) 55.7 (12.8) 53.8 (13.5) 51.6 (13.9)
v vv, v (%) vv (vv.v) vv (v.v) vv (vv) vv (vv.v)
v vv vv v vv, v (%) vv (vv.v) vv (vv.v) vv (vv.v) vv (vv.v)
v vv, v (%) vvv (vv.v) vvv (vv.v) vvv (vv.v) vvv (vv.v)
Lesion subtype, n (%)
Predominantly classic
82 (27.0) 71 (23.6) 70 (24.1) 88 (28.8)
Minimally classic 101 (33.2) 110 (36.5) 104 (35.7) 106 (34.6)
Occult 115 (37.8) 118 (39.2) 116 (39.9) 110 (35.9)
Juxtafoveal lesions
15 (4.9) 17 (5.6) 20 (6.9) 14 (4.6)
AFL = aflibercept; BCVA = best corrected visual acuity; ETDRS = Early Treatment Diabetic Retinopathy Study; RAN = ranibizumab; SD = standard deviation. Source: Clinical Study Reports: VIEW 1
25 (T12, p. 80), VIEW 2
11 (T13, p. 87), and Heier et al. (2012)
12 (T1, p. 2,541).
3.2.3 Interventions In both trials, there were four treatment groups. Only the Health Canada–recommended dosage and regimen are discussed in this report: 0.5 mg ranibizumab every four weeks (Rq4) and 2 mg aflibercept every eight weeks (2q8) after three initial monthly injections (to maintain masking, sham injections were given at the interim four-week visits after week 8 for the aflibercept group; sham injections using a mock procedure, including pressure on the eye exerted by a syringe without a needle, were performed without intraocular penetration and thus without the injection of any substance). Patients were assigned to treatment groups on the basis of a predetermined, central randomization scheme with balanced allocation, managed by an interactive voice response system.12 For each individual patient, one eye was designated as the study eye; i.e., the eye to receive the study treatment. The non-study eye was designated as the fellow eye. If a patient’s fellow eye required treatment for AMD at study entry or during the study, the fellow eye could receive any FDA or Health Canada–approved treatment for wAMD in the VIEW 1 study, or any European Medicines Agency or regionally approved treatment in accordance with the treating physician’s decision in the VIEW 2 study, but systemic treatments (standard or investigational drugs) for AMD of the fellow eye were not permitted. The fellow eye was not considered an additional study eye. 3.2.4 Outcomes Outcomes were assessed at four-week intervals for safety and efficacy throughout the 52 weeks. BCVA was evaluated using the 4 m ETDRS protocol. QoL was measured using the NEI VFQ-25. Retinal thickness was evaluated using OCT on the study eye. OCT examinations were performed at screening, on day 1,

CDR CLINICAL REVIEW REPORT FOR EYLEA
10
Common Drug Review August 2015
and at weeks 4, 12, 24, 36, and 52. Safety was monitored through the collection of data on ocular and non-ocular adverse events (AEs) and concomitant medications. a) Primary outcome The primary outcome was maintained vision, which was defined as a VA loss of < 15 ETDRS letters compared with baseline at week 52. Usually, a loss of < 15 letters on the ETDRS chart was considered a mild VA loss. A loss of ≥ 15 letters was considered a moderate vision loss. A loss of ≥ 30 letters was considered to be a severe VA loss. Therefore, the primary outcome, maintained vision, was also interpreted as the prevention of moderate VA loss. b) Secondary outcomes Visual acuity measured with early treatment diabetic retinopathy study letters
The secondary outcome was the change from baseline in BCVA as measured by ETDRS letter score at week 52. ETDRS charts present a series of five letters of equal difficulty on each row, with standardized spacing between the letters and rows. There are a total of 14 lines (i.e., 70 letters). Reading more lines (i.e., more letters) indicates better VA. The FDA recommends a mean change of ≥ 15 letters on an ETDRS chart, or a statistically significant difference in the proportion of patients with a ≥ 15 letter change in VA, as clinically relevant outcome measures in trials of interventions for macular edema.22 With regard to the proportion of subjects who gained or lost ≥ 15 letters of vision (or ≥ 30) from baseline to week 52, a loss or gain of three lines (15 letters) is usually considered a moderate degree of change and is commonly used as an outcome in clinical trials.26 A gain of ≥ 30 ETDRS letters is considered a significant improvement, and loss of ≥ 30 is considered severe loss in VA.26 Visual acuity measured with the Snellen eye chart
The Snellen eye chart is a commonly employed, well-recognized test of VA in clinical practice. A patient with a BCVA of 20/200 or worse at week 52 (equivalent to < 35 ETDRS letters) is considered legally blind.11,25 Quality of life/vision function
Quality of life (QoL) and vision function were evaluated using the NEI VFQ-25 in both VIEW 1 and VIEW 2. The VFQ-25 includes 25 items relevant to 11 vision-related constructs, in addition to a single-item general health component.27 The possible range of the NEI VFQ-25 total score is between 0 (worst possible) and 100 (best possible). A four-point improvement from baseline was considered to be a minimal clinically important difference (MCID).27 The change in total NEI VFQ-25 score from baseline to week 52 was measured. QoL, measured using the EuroQol 5-Dimensions Questionnaire (EQ-5D), was also reported in VIEW 2. EQ-5D is a generic QoL instrument that has been applied to a wide range of health conditions.28,29 Change in central retinal thickness
Change in CRT was evaluated using OCT on the study eye. Safety outcomes
Mortality, ocular and non-ocular SAEs, overall AEs, potential AEs with special clinical interest, and injection-related AEs were also reported.

CDR CLINICAL REVIEW REPORT FOR EYLEA
11
Common Drug Review August 2015
3.2.5 Statistical analysis a) Primary outcome analysis The primary outcome analysis was non-inferiority of IVT aflibercept to ranibizumab in the proportion of patients maintaining vision (i.e., a loss of < 15 letters) at week 52 (per-protocol analysis set [PPS]) in both studies. The non-inferiority margin was set as < 10% of the 95% confidence interval (CI) of the difference between ranibizumab and aflibercept in the proportion of patients who maintained vision at week 52 compared with baseline. A non-inferiority margin of 10% in the individual studies was chosen to preserve approximately two-thirds of the ranibizumab effect for the prevention of moderate vision loss (loss of < 15 letters) demonstrated in the pivotal ranibizumab studies14,15 using the two-sided CI approach. For last observation carried forward (LOCF), baseline values were not carried forward. The difference was expressed as ranibizumab minus aflibercept; 95% CI was calculated using a normal approximation. A CI approach was used for the non-inferiority analysis. The statistical objective was to demonstrate that the 95% CI of the difference between ranibizumab and aflibercept in the proportion of patients who maintained vision at week 52 compared with baseline lay entirely below 10%, the non-inferiority margin. Because both included studies were designed as a four-group study, two-group pairwise comparisons were of interest, and the primary outcome was assessed by a pre-specified, hierarchical testing sequence of non-inferiority of aflibercept to ranibizumab, with the sequence to control the 5% overall type I error while maintaining a 5% significance level for each individual comparison. The sample size calculation was computed using the following assumption: test of equivalence for proportions from the commercial software nQuery Advisor 6.0. Assuming that 90% of patients treated with ranibizumab would maintain vision, and assuming that 90% of patients treated with aflibercept (2q8) would also maintain vision, and defining the non-inferiority margin at 10%, 191 patients per group would provide 90% power to demonstrate non-inferiority, assuming an alpha level = 0.049. This included an adjustment of 0.001 for the independent data monitoring committee safety assessments, 0.0001 for each of the 10 assessments, thereby preserving an overall alpha of 0.05 for the study. Assuming a dropout rate of approximately 30%, an enrolment of 300 patients per group was determined to provide adequate power for this study to achieve its objectives under the stated assumptions. b) Secondary outcome analyses Secondary outcome analyses were tested for the superiority of aflibercept (2q8) over ranibizumab. If all aflibercept groups demonstrated non-inferiority to ranibizumab for the primary end point, additional comparisons with ranibizumab were pre-specified regarding the secondary end points, also using a hierarchical testing sequence in which each secondary end point was tested for the superiority of aflibercept over ranibizumab. Analyses of continuous outcomes used analysis of covariance (ANCOVA) with a main-effects model, with baseline measure as a covariate and treatment as a fixed factor. The pairwise comparisons of aflibercept and ranibizumab were carried out in these models by corresponding CONTRAST statements and a point estimate, and two-sided 95% CIs for the treatment difference of aflibercept minus ranibizumab were calculated. The effects of investigator site differences were examined as a supportive analysis. Sites were described separately with calculations of CIs and other appropriate descriptive statistics. Assessment of treatment-by-site interaction was performed using ANCOVA for continuous variables and the Pearson chi-square test for proportion.

CDR CLINICAL REVIEW REPORT FOR EYLEA
12
Common Drug Review August 2015
c) Sensitivity analyses To assess the robustness of the main analysis results, additional methods (worst observation carried forward, all dropouts counted as non-responders, or treatment failures counted as non-responders) were used to impute missing values for the purpose of sensitivity analyses. Sensitivity analyses using worst-case scenarios were performed in both the PPS and full analysis set (FAS) populations (Table 13 and Table 14). d) Subgroup analyses The following subgroup analyses were performed on primary outcomes and key secondary outcomes: baseline VA (better than 20/100 [≥ 50 letters]), 20/100 to 20/200 VA [≥ 35 to < 50 letters], and worse than 20/200 VA [< 35 letters]); age (< 65 years, ≥ 65 to < 75 years, ≥ 75 years); gender; race (e.g., Caucasian, black or African-American); lesion size (> 10.16 mm2 to ≤ 10.16 mm2); and lesion type (predominantly classic, minimally classic, and occult) (Appendix 4, Table 30, Table 31 and Table 32). e) Analysis populations All efficacy analyses were conducted with patients as randomized. The following three analysis sets were used for all statistical analyses: FAS, PPS, and the safety analysis set (SAF). The FAS included all randomized patients who had received any study medication and who had a baseline assessment and at least one post-baseline BCVA assessment. The FAS was used for all hypothesis tests of superiority (for all secondary outcomes) (Table 6). The PPS included all patients in the FAS who had received at least nine doses of the study drug (sham injections were counted as doses administered) and who had attended at least nine scheduled visits during the first year, except for those who were excluded because of major protocol deviations. The PPS was used for the primary analysis (statistical evaluation of non-inferiority) (Table 6). The SAF included all patients who had received any study medication (Table 6).
3.3 Patient Disposition Information on patient disposition in the VIEW 1 and VIEW 2 studies is summarized in Table 6. The discontinuation rate from the study was similar between the aflibercept (2q8) and ranibizumab groups in both studies (8.9% to 9.3% in VIEW 1, and 7.2% to 8.9% in VIEW 2, respectively). The most common reason for discontinuation in the aflibercept (2q8) and ranibizumab groups was withdrawal by patients with no further detailed reason reported (3.3% to 3.6% in VIEW 1, and 2.6% to 3.5% in VIEW 2, respectively). Completion of the first year was not necessarily associated with completion of the study drug during this period; i.e., patients who discontinued the study drug were allowed to remain in the study and undergo the planned evaluations. More detailed information on patient disposition is presented in Appendix 4, Table 10.

CDR CLINICAL REVIEW REPORT FOR EYLEA
13
Common Drug Review August 2015
TABLE 6: PATIENT DISPOSITION
VIEW 1 VIEW 2
Disposition or Reason RAN AFL RAN AFL
n (%) n (%) n (%) n (%)
Screeneda 2,063 2,031
Randomized 306 (100) 303 (100) 303 313
Completed at 52 weeks 284 (92.8) 276 (91.1) 276 (91.1) 284 (90.7)
vvvvvvvvvvvvvvv vvvv vvvvv vvvvvv vv vvvvv
vv (v.v) vv (v.v) vv (v.v) vv (v.v)
vvvvvvv vvvvv v (v.v) v (v.v) v (v.v) v (v.v)
vvvvv v(v.v) v (v.v) v (v.v) v (v.v)
FASb 304 (99.3) 301 (99.3) 291 (96) 306 (97.8)
PPSb 269 (87.9) 265 (87.5) 269 (88.8) 270 (86.3)
Safety 304 (99.3) 303 (100) 291 (96) 307 (98.1)
AFL = aflibercept; FAS = full analysis set; PPS = per-protocol analysis set; RAN = ranibizumab. a
Total screened number of patients. b
The number could vary with different outcomes. Source: VIEW 1: T7, p. 73; and VIEW 2: T7, p. 83.
3.4 Exposure to Study Treatments Detailed information on medication exposure and compliance is presented in Appendix 4 (Table 11 and Table 12). The median numbers of aflibercept and ranibizumab injections were 8 and 13, respectively. The median amount of aflibercept and ranibizumab was 16 mg and 6.5 mg, respectively. Compliance with aflibercept and ranibizumab was high and also similar (97% to 98% for both treatment groups).12 During the study, patients were not permitted to receive any other treatment for AMD in the study eye. Other commonly concomitant medications, including antiseptics and disinfectants, ophthalmologicals, and dermatologicals, were used in a similar manner in both treatment groups.
3.5 Critical Appraisal 3.5.1 Internal validity The included studies were double-masked, multi-centre, randomized, active-controlled, non-inferiority trials. The randomization process, including allocation concealment and masking method, were well described and performed. Overall, the important baseline characteristics were similar between the two treatment groups. Up to 14% of patients dropped out of the PPS analysis. Protocol deviation would likely bias the study findings toward non-inferiority, which includes loss to follow-up (7% to 9%) and non-adherence to the assigned therapy. The non-inferiority analysis was based on the PPS, which is more conservative than an analysis based on the FAS. Confidence regarding non-inferiority could be enhanced if there is consistency between both analyses. In both trials, the efficacy of aflibercept and ranibizumab as compared with “placebo” is not confirmed directly. The non-inferiority findings may mean that both interventions are not significantly more effective than placebo. Under the constancy assumption, the non-inferiority trial should have a design similar to previous trials, which demonstrated the efficacy of ranibizumab versus placebo. It seems likely that this assumption was satisfied, as the absolute change in BCVA from baseline to 52 weeks was similar to previous pivotal studies on ranibizumab.14,15

CDR CLINICAL REVIEW REPORT FOR EYLEA
14
Common Drug Review August 2015
The methodological approach to assessing non-inferiority was to calculate the 95% CI using a normal approximation of the difference between the proportions of patients with maintained vision at week 52 for each group. While it is unknown whether the assumption of a normal approximation is valid, this does not substantially affect the construction of the 95% CI. Multiplicity for the primary analysis was performed to control the type I error. In the VIEW 2 study, which was conducted in Asia, Australia, and Europe, the primary analysis was also adjusted by study region. The robustness of the primary analysis results was confirmed by various sensitivity analyses, including using worst-case scenarios and worst-observation-carried-forward analysis. While the studies were considered to be well designed overall, the methodological quality could potentially have been limited because randomization was not stratified by investigation site, and the main analyses were adjusted by region only in VIEW 2, not VIEW 1. However, because VIEW 1 was conducted in the US and Canada, where the management of wAMD is highly consistent, significant treatment response variation between regions is unlikely. The randomization was not stratified based on the baseline VA, although the subgroup analysis showed that the results are consistent with the main primary analysis. The primary analysis was adjusted by baseline VA due to the relatively small sample size. It is unknown whether the absence of statistically significant differences between the two treatments in the various subgroups reflects actual differences or is due to a lack of power. Sample size was calculated based on the non-inferiority design for the primary outcome. Therefore, it remains unknown whether the observed statistically non-significant difference between ranibizumab and aflibercept (2q8) in terms of secondary outcomes is due to lack of power or because there is truly no difference. The assessment of any improvements in QoL as an effect of the treatments in study eyes may have been compromised by the treatments received by the fellow eyes at study entry or during the course of the study. 3.5.2 External validity Patients were excluded if they had had any prior or concomitant therapy, surgery, or photodynamic therapy (PDT) for wAMD. Therefore, the non-inferiority of the study drug to a standard therapy was demonstrated only in a treatment-naive population based on the two included studies for this review. Patients previously treated with anti-VEGF drugs were excluded in both studies. Only one eye per patient was treated with aflibercept; therefore, further study is needed on the efficacy and safety of aflibercept in patients with wAMD who failed previous treatment or who had aflibercept therapy administered to both eyes concurrently or consecutively. Moreover, patients with eye disease or comorbidities other than wAMD — such as a history of any
vitreous hemorrhage, vitrectomy, severe subretinal hemorrhages, or large lesion size> 12 disc areas) — were excluded from the study. Therefore, the safety profiles as demonstrated in the studies may not reflect real-world clinical practice. In other words, the comparability of efficacy and safety between aflibercept and ranibizumab was assessed based on a highly selected patient population. The non-inferiority of aflibercept to ranibizumab in the treatment of wAMD was assessed at 52 weeks. Therefore, the sustainability of the comparative efficacy and safety of aflibercept (2q8) versus ranibizumab beyond one year remains uncertain.

CDR CLINICAL REVIEW REPORT FOR EYLEA
15
Common Drug Review August 2015
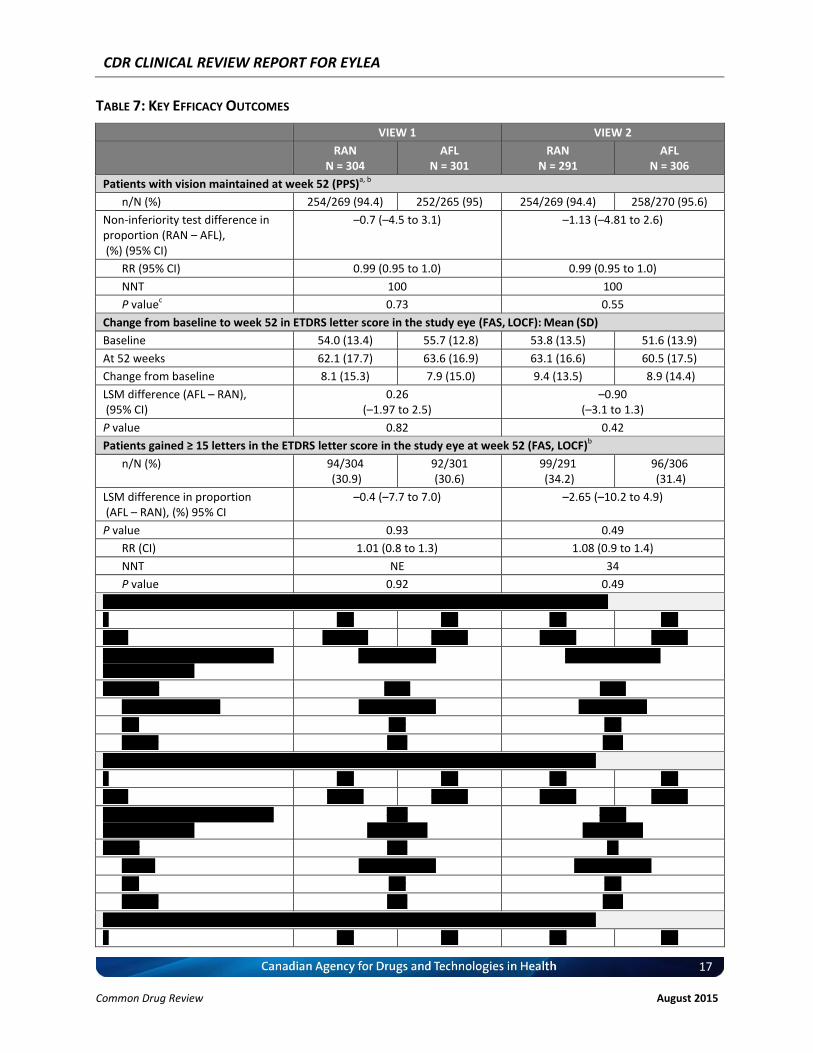
3.6 Efficacy Only those efficacy outcomes identified in the review protocol are reported below (Section 2.2, Table 3). See Appendix 4: DETAILED OUTCOME DATA for detailed efficacy data. This report focuses primarily on the comparative efficacy and safety profile of aflibercept with ranibizumab at week 52. The results observed at week 96 are briefly summarized in Supplemental Issues (Appendix 6). 3.6.1 Patients with vision maintained at week 52 At week 52, based on the per-protocol analysis, the proportion of patients who achieved maintained vision was 94% in the ranibizumab groups and 95% in the aflibercept (2q8) groups in both studies. It was shown that aflibercept (2q8) was non-inferior to ranibizumab, as demonstrated by the upper bound of the 95% CI (≤ 3.1%), which was well below the pre-specified, non-inferiority margin of 10%. The difference in vision maintenance between the ranibizumab and aflibercept (2q8) groups was –0.7% (95% CI, – 4.5% to 3.1%; P = 0.73) and –1.13 (95% CI, –4.81 to 2.55; P = 0.55) in VIEW 1 and VIEW 2, respectively (Table 7). Furthermore, the observed upper bound of 95% CI of difference (4.5% to 4.8%) also met the threshold for clinical equivalence based on a pre-specified margin of 5%. In addition, the observed upper bound of the 95% CI of difference (4.5% to 4.8%) also met the threshold for clinical equivalence based on a pre-specified margin of 5%. The results from various sensitivity analyses using FAS were consistent with the PPS result (Appendix 4, Table 13 and Table 14). The subgroup analyses based on baseline VA showed that treatment group differences in terms of maintained vision were all similar to those in the vvvvvvv vvvvvvvvvv vv vvvvvvvvv vvvvvvvv vv vvvvvv (vvvvvvvv v, ). The relative risk (95% CI) (ranibizumab versus aflibercept, calculated by CDR) is 0.99 (0.95 to 1.03) for both VIEW 1 and VIEW 2 (Table 7). 3.6.2 Change from baseline to week 52 in ETDRS letter score Baseline BCVA was similar between treatment groups in FAS. A BCVA improvement of eight to nine letters was observed in both the ranibizumab and aflibercept groups in both studies. The least squares mean treatment group difference of BCVA improvement from baseline (aflibercept minus ranibizumab, mean [95% CI]) was 0.26 (–1.97 to 2.49) in VIEW 1 and –0.90 (–3.06 to 1.26) in VIEW 2, respectively. No statistically significant difference between the two treatment groups was observed (Table 7). Repetition of the ANCOVA with region adjustment yielded nearly identical results; i.e., vv vvvvvv vv vvvvvv vvv vvvvvvvv vv vvvv vvvvvvvv (v v v.vvv) vv vvvv v. No region adjustment was performed in VIEW 1. The subgroup analyses based on baseline VA showed that treatment group differences in terms of change from baseline to week 52 in ETDRS letter score were all similar to those in the overall study population among different baseline VA levels (Appendix 4, Table 31). 3.6.3 Proportion of patients with 20/40 vision or better The proportion of patients with 20/40 vision or better was similar among treatment groups at baseline in both studies. vv vvvv vv, vv vvvv v, vvv vvvvvvvvvv vv vvvvvvvv vvvv vv/vv vvvvvv vv vvvvvv vvvvvvvvv vv vv.v% vv vvvvvvvvvvv vvvvvvvv vvvv vvv vv.v% vv vvvvvvvvvvv vvvvvv, vvv vv vvvv v, vv vvv vv.v% vvvvvv vv.v%, vvvvvvvvvvvv. vvv vvvvvvvvvv vvvvvvv vvv vvvvvvvvvvv vvvvv vvv vvv vvvvvvvvvvv vvvvv vvv vvvvvvvvvvv vv vvvvvv vv vvv vvvvvvvvvvv vvvvv vv vvvv v (vvvv vvvvvvvvvv, v.vv vv%vv, –v.v% vv vv%v v v v.vvvv)v vvvvv vv vvvv v, vvv vvvvvvvvvv vvvvvvv vvv vvvvvvvvvvv vvvvv vvv vvv vvvvvvvvvvv vvvvv vvv vvvvvvvvvvv vv vvvvvv vv vvvvvvvvvvv (vvvv vvvvvvvvvv, –v.vvv vv%vv, –vv.vv % vv –v.vv%v v v v.vvv).

CDR CLINICAL REVIEW REPORT FOR EYLEA
16
Common Drug Review August 2015
3.6.4 Proportion of patients who gained ≥ 15 letters (or ≥ 30 letters) in the ETDRS letter score At week 52, the proportions of patients who made a gain in vision of ≥ 15 letters in the aflibercept (2q8) group and in the ranibizumab group were similar (31% in both the aflibercept and ranibizumab groups in VIEW 1, and 31% in aflibercept and 34% in the ranibizumab group in VIEW 2). The treatment group differences in percentage improvement between aflibercept and ranibizumab were –0.4 (95% CI, –7.7 to 7) in VIEW 1 and –2.65 (95% CI, –10.18 to 4.88) in VIEW 2, respectively. vv vvvvvvvvvvvvv vvvvvvvvvvv vvvvvvvvvvv vvvv vvvvvvvv. vvv vvvvvvvvvv vv vvvvvvvv vvv vvvv v vvvv vv vvvvvv vv vv vvvvvvv vv vvvv vvv vvvv vvvvvvv vv vvv vvv vvvvvvvvv vvvvvv. vvv vvvvvvvv vvvvvvvv vvvvv vv vvvvvvvv vv vvvvvv vvvv vvvvvvvvv vvvvv vvvvvvvvvvv vv vvvvv vv v vvvv vv vvvvvv vv vv vvvvvvv vv vvvv vvvv vvv vvvvvvv vv vvvvv vv vvv vvvvvvv vvvvvvvvvv vvvvv vvvvvvvvv vvvvvvvv vv vvvvvv (vvvvvvvv v). 3.6.5 Proportion of patients who lost ≥ 15 letters (or ≥ 30 letters) in the ETDRS letter score Overall, the proportion of patients who lost ≥ 15 letters in the aflibercept group was similar to the proportion in the ranibizumab group in both VIEW 1 (6%) and VIEW 2 (5%) at week 52 (Table 7). vvvvvv vvvvvv vvvv (vv v vv vvvvvvv) vvv vvvv vvv vvvvvvv vv vvvv vvvvvv (v% vv vvvv v vvv v v% vv vvvv vv vvv). vvvv vvv vvvv vvvvvvvvv vv vvv vvvvvvvvvvvvv vvvvvvv vvvvvvvv vvvv vvv vvvv vv vvv vvv. vv vvvvvvvv vvvvvvvv vvv vvvvvvvv. 3.6.6 Quality of life/vision function The baseline mean NEI VFQ-25 total score was similar in both treatment groups in both studies (70 to 73, out of a total score of 100). At week 52, the NEI VFQ-25 total score improved by about five points in both the ranibizumab and aflibercept (2q8) groups in both studies. The mean difference between treatment groups in the changes from baseline (ANCOVA), with or without region adjustment, was not statistically significant (Table 7). No noticeable improvement in the EQ-5D score was observed in either of the treatment groups in VIEW 2 (Table 20).
3.6.7 Legal blindness Legal blindness refers to a BCVA of 20/200 or worse. The proportion of patients with a BCVA of 20/200 or worse at baseline was vv.v% vv vvvvvvvvvvv vvvvvv v.v% vv vvvvvvvvvvv vv vvvv v vvv vv.v% vv vvvvvvvvvvv vvvvvv vv.v% vv vvvvvvvvvvv vv vvvv v. At week 52, vvvv vvvvvvvvvv vvvvvvvvv vv v.v% vv v.v% vv vvvv v vvv v.v% vv vv.v% vv vvvv v in ranibizumab and aflibercept, respectively. There was no statistically significant difference between treatment groups at week 52 (Table 7). 3.6.8 Change from baseline to week 52 in central retinal thickness Baseline CRT was similar between treatment groups in both studies, although the central retina was thicker in VIEW 2 than in VIEW 1 in the FAS (326 μm to 342 μm in VIEW 2 and 267 μm to 269 μm in VIEW 1, respectively). At week 52, in VIEW 1, vvv vvvvvvvvv vvvv vvvvvvvv vv –vvv.v μv vvv –vvv.v μv vv vvv vvvvvvvvvvv vvv vvvvvvvvvvv vvvvvv, vvvvvvvvvvvv. In VIEW 2, vvv vvvv vvv vvvvvvvvv vvvv vvvvvvvv vv –vvv.v μv vvv –vvv μv vv vvv vvvvvvvvvvv vvv vvvvvvvvvvv vvvvvv, vvvvvvvvvvvv. vv vvvvvvvvvvvvv vvvvvvvvvvv vvvvvvvvv vvvvv vvvvvvvvvv vv vvvvvvv vvvv vvvvvvvv vvv vvvvvvvv (v v v.vv vvv v v v.v vv vvvv v vvv vvvv v, vvvvvvvvvvvvv
CDR CLINICAL REVIEW REPORT FOR EYLEA
17
Common Drug Review August 2015
TABLE 7: KEY EFFICACY OUTCOMES
VIEW 1 VIEW 2
RAN N = 304
AFL N = 301
RAN N = 291
AFL N = 306
Patients with vision maintained at week 52 (PPS)a, b
n/N (%) 254/269 (94.4) 252/265 (95) 254/269 (94.4) 258/270 (95.6)
Non-inferiority test difference in proportion (RAN – AFL), (%) (95% CI)
–0.7 (–4.5 to 3.1) –1.13 (–4.81 to 2.6)
RR (95% CI) 0.99 (0.95 to 1.0) 0.99 (0.95 to 1.0)
NNT 100 100
P valuec 0.73 0.55
Change from baseline to week 52 in ETDRS letter score in the study eye (FAS, LOCF): Mean (SD)
Baseline 54.0 (13.4) 55.7 (12.8) 53.8 (13.5) 51.6 (13.9)
At 52 weeks 62.1 (17.7) 63.6 (16.9) 63.1 (16.6) 60.5 (17.5)
Change from baseline 8.1 (15.3) 7.9 (15.0) 9.4 (13.5) 8.9 (14.4)
LSM difference (AFL – RAN), (95% CI)
0.26 (–1.97 to 2.5)
–0.90 (–3.1 to 1.3)
P value 0.82 0.42
Patients gained ≥ 15 letters in the ETDRS letter score in the study eye at week 52 (FAS, LOCF)b
n/N (%) 94/304 (30.9)
92/301 (30.6)
99/291 (34.2)
96/306 (31.4)
LSM difference in proportion (AFL – RAN), (%) 95% CI
–0.4 (–7.7 to 7.0) –2.65 (–10.2 to 4.9)
P value 0.93 0.49
RR (CI) 1.01 (0.8 to 1.3) 1.08 (0.9 to 1.4)
NNT NE 34
P value 0.92 0.49
vvvvvvvv vvvvvv v vv vvvvvvv vv vvv vvvvv vvvvvv vvvvv vv vvv vvvvv vvv vv vvvv vv (vvv, vvvv)v
v vvv vvv vvv vvv
v (%) vv (v.v%) vv (v.v) vv (v.v) vv (v.v)
vvv vvvvvvvvvv vv vvvvvvvvvv (%) vv% vv (vvv – vvv)
v.v (–v.v vv v.v) –v.vv (–v.v vv v.vv)
v vvvvv vvv v.vvv v.vvv
vv (vv) (vvv vv. vvv) v.vv (v.v vv v.v) v.vv (v vv v.v)
vvv vvv vvv
v vvvvv v.vv v.vv
vvvvvvvv vvvv v vv vvvvvvv vv vvv vvvvv vvvvvv vvvvv vv vvv vvvvv vvv vv vvvv vv (vvv, vvvv)v
v vvv vvv vvv vvv
v (%) vv (v.v) vv (v.v) vv (v.v) vv (v.v)
vvv vvvvvvvvvv vv vvvvvvvvvv (%) vv% vv (vvv – vvv)
–v.v (–v.v vv v.v)
–v.vv (–v.v vv v.v)
v vvvvv v.vv vv
vv (vv) v.vv (v.v vv v.v) v.vv (v.v vv v.v)
vvv vvv vvv
v vvvvv v.vv v.vv
vvvvvvvv vvvv v vv vvvvvvv vv vvv vvvvv vvvvvv vvvvv vv vvv vvvvv vvv vv vvvv vv (vvv, vvvv)v
v vvv vvv vvv vvv

CDR CLINICAL REVIEW REPORT FOR EYLEA
18
Common Drug Review August 2015
VIEW 1 VIEW 2
RAN N = 304
AFL N = 301
RAN N = 291
AFL N = 306
v (%) v (v.v) v (v.v) v (v.v) v (v.v)
vvv vvvvvvvvvv vv vvvvvvvvvv (%) vv% vv (vvv – vvv)
v (–v.v vv v.v) v.vv (–v.v vv v.v)
v vvvvv vvv v v.vvv
vv (vv) v.vv (v.v vv v.v) v.vv (v.v vv v.v)
vvv vv vvv
v vvvvv v.vv v.vv
vvvvv vvvvvvvvv (vvv)v, v
vvvvvvvv v (%) vv (vv.v) vv (v.v) vv (vv.v) vv (vv.v)
vv vvvv vv v (%) vv (v.v) vv (v.v) vv (v.v) vv (vv.v)
Between-group difference in proportion (%) (95% CI) at 52 weeks
0.1 (–4.5 to 4.7) 3.22 (–1.39 to 7.84)
P value < 1 0.173
Change from baseline to week 52 in NEI VFQ-25 (total score) (FAS, LOCF)
Baseline
n 303 293 291 306
Mean (SD) 71.8 (17.2) 69.6 (16.8) 72.9 (19.1) 71.3 (19.1)
At 52 weeks
n 300 299 287 299
Mean (SD) 76.8 (16.1) 74.6 (17.7) 79.5 (16.7) 76.4 (19.3)
Change from baseline at week 52 4.9 (14.1) 5.1 (14.7) 6.3 (14.8) 4.9 (14.7)
LSM between-group difference in changes from baseline, % (95% CI) (AFL – RAN)
–0.60 (–2.6 to 1.4) –1.95 (–4.1 to 0.2)
P value - 0.56 - 0.072
Change from baseline to week 52 in CRT (FAS, LOCF)
vvvvvvvv
vvvv (vv), mcv vvv.v (vvv.v) vvv.v (vvv.v) vvv.v (vvv.v) vvv.v (vvv.v)
vv vv vvvvv
vvvv (vv), mcv vvv.v (vv.v) vvv.v (vv.v) vvv.v (vv.v) vvv.v (vv.v)
vvvvvv vvvv vvvvvvvv vv vvvv vv
vvvv (vv), mcv –vvv.v (vvv.v) –vvv.v (vvv.v) –vvv.v (vvv.v) –vvv.v (vvv.v)
LSM between-group difference in changes from baseline, (95% CI) (AFL – RAN)
–0.05 (–9.7 to 9.6) 3.6 (–6.99 to 14.2)
P value 0.99 - 0.51
AFL = aflibercept; CDR = CADTH Common Drug Review; CI = confidence interval; CRT = central retinal thickness; ETDRS = Early Treatment Diabetic Retinopathy Study; FAS = full analysis set; LOCF = last observation carried forward; LSM = least squares mean; NEI VFQ-25 = National Eye Institute 25-Item Visual Function Questionnaire; NNT = number needed to treat; PPS = per-protocol analysis set; RAN = ranibizumab; RR = relative risk; SD = standard deviation; VA = visual acuity. a “Maintained vision” is defined as VA loss < 15 letters in ETDRS. Difference is ranibizumab minus aflibercept; CI was calculated using a normal approximation. LSM difference was calculated using an analysis of covariance (ANCOVA) main-effect model with baseline measure as a covariate. b All RR, absolute risk reduction, NNT, and NNH for proportion outcome were calculated by CDR. c “Legal blindness” is defined as a patient with VA of 20/200 or worse. Source: VIEW 1: T18, p.88, and VIEW 2: T19, p. 97; VIEW 1: T28, p. 108, p. 930–931, and VIEW 2: T30, p. 124; VIEW 1: T23, p. 97, and VIEW 2: T25, p. 111; VIEW 1: T24, p. 100, and VIEW 2: T26, p. 114; VIEW 1: T30, p. 111, and VIEW 2: T32, p. 130.

CDR CLINICAL REVIEW REPORT FOR EYLEA
19
Common Drug Review August 2015
3.7 Harms Only those harms identified in the review protocol are reported below (see Section 2.2.1 – Protocol, and Appendix 4: DETAILED OUTCOME DATA for detailed harms data). All AEs occurring during this study were classified as either ocular AEs or non-ocular AEs. Harms data from the included studies are reported as treatment-emergent adverse events (TEAEs). In addition, SAEs, mortality, and WDAEs, injection-related TEAEs, and notable AEs identified for the review following discussion with the clinical expert involved in the review, such as an arterial thrombotic event (ATE), are reported. 3.7.1 Adverse events Overall, 95% of patients in VIEW 1 and 85% to 90% in VIEW 2 reported TEAEs during the first year of the study (Table 8). The incidences of overall TEAEs, ocular TEAEs in the study (Table 21, Table 22), and non-ocular TEAEs (Table 23) were similar between the treatment groups. Injection-related TEAEs were reported to be 60% in the ranibizumab group versus 54% in the aflibercept group in VIEW 1, and 32% and 29% in the ranibizumab and aflibercept groups, respectively, in VIEW 2 (Table 24). The most commonly reported ocular AEs were conjunctival hemorrhage, vitreous floaters, eye pain, vitreous detachment, reduced VA, retinal pigment epitheliopathy, macular degeneration, and increased intraocular pressure (Table 22). 3.7.2 Serious adverse events In VIEW 1, the incidence of treatment-emergent SAEs was numerically higher in the ranibizumab group (22.4%) than in the aflibercept group (18.5%), while in VIEW 2, the incidence of treatment-emergent SAEs was numerically higher in the aflibercept group (15.6%) than in the ranibizumab group (12.0%) (Table 8). a) Ocular serious adverse events in the study eye A serious ocular AE was defined as an AE causing a decrease in VA of more than 30 letters lasting more than one hour post-injection, and an AE requiring surgical intervention to prevent permanent loss of vision. The incidence of ocular SAEs in the study eye was numerically higher in the ranibizumab group than in the aflibercept group (3.3% versus 1.0% in VIEW 1 and 3.1% versus 2.9% in VIEW 2, respectively). Most of them were attributable to the injection procedure or the progression of the disease. The reported ocular SAEs in the study eye were mainly endophthalmitis, retinal hemorrhage, reduction in VA, and posterior capsule opacification. Details on ocular SAEs in the study eye are presented in Table 25. b) Ocular serious adverse events in the fellow eye The incidence of ocular SAEs in the fellow eye was low and was similar between treatment groups in both studies (1.0% versus 0.7% in VIEW 1 and 1% versus 1% in VIEW 2, respectively). Details on ocular SAEs in the fellow eye are presented in Table 26. c) Non-ocular serious adverse events The overall incidence of non-ocular SAEs was similar in both treatment groups (18.8% versus 16.8% in the ranibizumab and aflibercept groups, respectively, in VIEW 1; and 8.9% versus 12.4% in the ranibizumab and aflibercept groups, respectively, in VIEW 2) (Table 27). The reported non-ocular SAEs included pneumonia (ranibizumab versus aflibercept: 2.3% versus 1.7%, in VIEW 1, and 0% versus 0.7% in VIEW 2, respectively) and falls (ranibizumab versus aflibercept: 1.6% versus 2.0% in VIEW 1, and 0.7% versus 0% in VIEW 2, respectively). Details on non-ocular SAEs are presented in Table 27.

CDR CLINICAL REVIEW REPORT FOR EYLEA
20
Common Drug Review August 2015
d) Ocular injection-related serious adverse events in the study eye In the ranibizumab groups in both studies, 1.3% of patients experienced ocular injection-related SAEs in the study eye. No ocular injection-related SAEs were reported by patients in the aflibercept group in VIEW 1, but 0.3% reported ocular injection-related SAEs in the study eye in both treatment groups in VIEW 2 (Table 28).
3.7.3 Withdrawals due to adverse events a) Withdrawal from the study due to adverse event The incidence of AEs leading to withdrawal from the study during the 52 weeks was low in both studies. It was similar in both treatment groups (ranibizumab versus aflibercept: 1.3% versus 1.3% in VIEW 1); however, it was numerically higher in the aflibercept (2.9%) than in the ranibizumab (0.7%) group in VIEW 2 (Table 6). The most common AEs leading to withdrawal were eye disorders including retinal hemorrhage, reduced VA, and retinal detachment (Table 29). b) Discontinuation of the study drug due to adverse event The incidence of TEAEs leading to discontinuation of the study drug was also low. It was similar in both treatment groups in VIEW 1 (ranibizumab versus aflibercept: 1.6% versus 1.0%). However, it was numerically higher in the aflibercept group (3.3%) than in the ranibizumab group (1.4%) in VIEW 2. The most common AE leading to discontinuation of the study drug was retinal hemorrhage (0.3% in both the ranibizumab and aflibercept groups in VIEW 1, and 0% in both groups in VIEW 2). Detailed data on TEAEs are presented in Table 29. 3.7.4 Mortality In VIEW 1, five deaths (1.6%) in the ranibizumab group and eight deaths (2.6%) in the aflibercept group were reported during the first year, while in VIEW 2, two deaths (0.7% in both ranibizumab and aflibercept) were reported in each group (Table 6 and Table 8). None of the deaths was considered to be related to the study drug. 3.7.5 Notable harms After consulting with the clinical expert involved in the review, the following notable harms (i.e., AEs with special interest clinically) were identified: endophthalmitis, retinal detachment, and ATEs. In VIEW 1, endophthalmitis occurred in three patients (1%) in the ranibizumab group, but did not occur in the aflibercept (2q8) group. No endophthalmitis was reported in VIEW 2. The incidence of retinal detachment was 5.2% in the ranibizumab group and 3.9% in the aflibercept (2q8) group in VIEW 2. No retinal detachments were reported in the ranibizumab and aflibercept (2q8) groups in VIEW 1. ATEs are adverse events potentially related to systemic VEGF inhibition. There is a potential risk of ATEs following IVT use of VEGF inhibitors, including aflibercept.21 ATEs, as defined by the Antiplatelet Trialists’ Collaboration criteria, include nonfatal myocardial infarction, nonfatal stroke, or vascular death (including deaths of unknown cause).21 During the first year, vvvv (v.v%) in the ranibizumab group and vv (v.v%) in the aflibercept (2q8) group in VIEW 1 reported an ATE; none were reported in VIEW 2 in the ranibizumab and aflibercept (2q8) groups (Table 8).

CDR CLINICAL REVIEW REPORT FOR EYLEA
21
Common Drug Review August 2015
TABLE 8: HARMS
VIEW 1 VIEW 2
RAN AFL RAN AFL
N = 304 N = 303 N = 291 N = 307
n (%) n (%) n (%) n (%)
AE
Patients with ≥ 1 TEAEs, N (%) 290 (95.4) 289 (95.4) 250 (85.9) 277 (90.2)
Any ocular TEAE 263 (86.5) 257 (84.8) 210 (72.2) 220 (71.7
Study eye 246 (80.9) 238 (78.5) 187 (64.3) 198 (64.5)
Fellow eye 150 (49.3) 143 (47.2) 124 (42.6) 123 (40.1)
SAE
Patients with ≥ 1 serious TEAEs, N (%) 68 (22.4) 56 (18.5) 35 (12.0) 48 (15.6)
Most common ocular SAEsa
Endophthalmitis 3 (1.0) 0 NR NR
Reduced VA 2 (0.7) 0 1 (0.3) 5 (1.6)
Retinal hemorrhage 2 (0.7) 2 (0.7) 1 (0.3) 1 (0.3)
Most common injection-related ocular SAEs
a
Endophthalmitis 3 (1.0) 0 NR NR
WDAE
WDAEs, N (%) (discontinuation from study)
4 (1.3) 4 (1.3) 2 (0.7) 9 (2.9)
Most common reasons
Retinal hemorrhage 1 (0.3) 1 (0.3) 0 (0.0) 0 (0.0)
Endophthalmitis 1 (0.3) 0 NR NR
Deaths
Deaths, N (%) 5 (1.6) 8 (2.6) 2 (0.7) 2 (0.6)
Notable Harms
Retinal detachment NR NR 15 (5.2) 12 (3.9)
ATE 5 (1.6) 12 (4.0) 0 0
AFL = aflibercept; ATE = arterial thrombotic event; NR = not reported; RAN = ranibizumab; SAE = serious adverse event; TEAE = treatment-emergent adverse event; VA = visual acuity; WDAE = withdrawal due to adverse event. a Frequency > 1%.
Source: VIEW 1: T37, p. 122 and VIEW 2: T36, p. 141; VIEW 1: T38, p. 124 and VIEW 2: T37, p. 144; VIEW 1: T39, p. 126–127 and VIEW 2: T38, p. 146–147; VIEW 1: T44, p. 137–138 and VIEW 2: T43, p. 157.
CDR CLINICAL REVIEW REPORT FOR EYLEA
22
Common Drug Review August 2015
4. DISCUSSION
4.1 Summary of Available Evidence The evidence for this review was derived from two double-blind, randomized, active-controlled trials (VIEW 1 and VIEW 2) that compared aflibercept (2 mg every eight weeks following initial three monthly IVT injections [2q8 IVT]) with 0.5 mg IVT ranibizumab monthly for treating wAMD in treatment-naive patients. A total of 1,225 patients were treated with either aflibercept or ranibizumab. The aim of these studies was to determine whether aflibercept was non-inferior to ranibizumab in maintaining vision in wAMD patients over 52 weeks. The non-inferiority margin (< 10%) was set to preserve approximately two-thirds of the ranibizumab treatment effect for the prevention of moderate vision loss (loss of < 15 letters), based on several pivotal ranibizumab studies.14,15 VA was measured with a valid ETDRS score. QoL was assessed using the NEI VFQ-25. Overall baseline characteristics were similar in all treatment groups. Dropout rates were low (< 9%) and similar between treatment groups in both studies. As patients who were previously treated with anti-VEGF drugs were excluded from both studies, the available data cannot be used to determine the efficacy or safety of aflibercept in patients with wAMD who have failed previous treatment or in those patients who require treatment in both eyes concurrently or consecutively. No RCTs have been carried out to assess this population. There were no serious violations of internal validity, but it is worth noting that no placebo group was included in the studies. The effect size for these active treatments must be seen in perspective versus the progression of vision deterioration in untreated patients. In addition, it is unclear whether the changes from baseline in VA were statistically significant, although the magnitude of changes in BCVA and NEI VFQ-25 were consistent with previous studies.14,15 In addition, because the sample size was calculated to power the primary outcome, there may have been a lack of power for detecting differences between treatment groups for the secondary outcomes.
4.2 Interpretation of Results 4.2.1 Efficacy More than 94% of patients in both treatment groups in both studies achieved maintained vision (losing < 15 letters on the ETDRS letter score) at 52 weeks. The between-group differences in the proportion of patients with vision maintained at week 52 compared with baseline were –0.7% (95% CI,–4.5 to 3.1%; P = 0.73) and –1.13 (95% CI, –4.81 to 2.55; P = 0.55) in VIEW 1 and in VIEW 2, respectively, which was well below the pre-specified upper bound of 10%. Therefore, aflibercept was non-inferior to ranibizumab for maintaining vision in treatment-naive wAMD patients over 52 weeks. In addition, aflibercept met the threshold for clinical equivalence to ranibizumab for the same outcome. The improvement of eight to nine ETDRS letters from baseline in either the ranibizumab or aflibercept (2q8) groups was also observed in both studies; this improvement is consistent with the finding reported previously,14,15 although it was not reported whether this improvement from baseline was statistically significant. Note that the effect size for these active treatments must be seen in perspective versus the progression of vision deterioration in untreated patients: in trials in which the active treatments have been compared with placebo, vision was maintained in 60% of patients who were treated with placebo.15 In both studies, 30% to 34% of patients in the ranibizumab and aflibercept groups, respectively, experienced a moderate VA improvement (gained ≥ 15 ETDRS letters), and 5% to 7% of patients, respectively, experienced a significant VA improvement (gained ≥ 30 ETDRS letters). Patients
CDR CLINICAL REVIEW REPORT FOR EYLEA
23
Common Drug Review August 2015
experiencing a moderate or severe VA reduction (lost ≥ 15 or ≥ 30 ETDRS letters) were ≤ 6% and ≤ 3%, respectively, in both treatments in both studies. The proportion of patients with legal blindness was lower at week 52 compared with baseline in both the ranibizumab and aflibercept groups. No statistical significance was reported for the proportion of patients with legal blindness at week 52 in either of the studies. There was no statistically significant difference between the aflibercept (2q8) and ranibizumab groups in either study in terms of the above VA improvement or VA reduction, outcomes, or the proportion of patients with legal blindness. However, as these outcomes were secondary outcomes, it is not known whether the sample size provided was powered enough to detect treatment group difference. Therefore, the findings of the secondary outcomes should be interpreted with caution. QoL and vision function were measured using the NEI VFQ-25 total score. The reported MCID for NEI VFQ-25 was 4 points,27 which corresponds to a 15-letter gain in BCVA.13 It was observed that the NEI VFQ-25 total score was improved (> 4 points) and was similar in both treatment groups in both studies at week 52. The between-treatment group difference in the changes from baseline was not statistically significant. The improvement in the mean NEI VFQ-25 score appears to be clinically relevant, and the magnitude of these changes was similar to that observed in published studies.13 However, the assessment of any improvements in QoL as an effect of the treatments in study eyes may have been compromised by treatments that the fellow eyes may have received at study entry or during the course of the study. At week 52, CRT decreased from baseline by 130 μm to 139 μm in the ranibizumab group and by 130 μm to 149 μm in the aflibercept (2q8) group, respectively. It was not reported whether these changes were statistically significant. In addition, the clinical significance of these changes is uncertain due to the lack of information regarding the MCID for this outcome. Nevertheless, no statistically significant differences were observed between treatments in either study. In the extension phase of the VIEW trials, which evaluated patients using a flexible dosing regimen between weeks 52 and 96, visual and anatomical improvements appeared to have remained similar between treatment groups. However, the aflibercept treatment group received an average of five fewer injections over the 96-week study period.30 4.2.2 Harms The overall safety profile appears to be similar for ranibizumab and aflibercept. Although the incidence of TEAEs was numerically lower in VIEW 2 than in VIEW 1, the overall TEAEs were similar between the ranibizumab and aflibercept groups (85% to 95% versus 90% to 95% in the ranibizumab and aflibercept groups, respectively). The incidences of ocular TEAEs in the study eye (ranibizumab versus aflibercept: 64% to 81% versus 65% to 89%), non-ocular TEAEs (ranibizumab versus aflibercept: 62% to 77% versus 69% to 74%) and the injection-related TEAEs (ranibizumab versus aflibercept: 32% to 60% versus 29% to 54%) were also similar between treatment groups. The most commonly reported ocular AEs were conjunctival hemorrhage, vitreous floaters, eye pain, vitreous detachment, reduced VA, retinal pigment epitheliopathy, macular degeneration, and increased intraocular pressure. The incidence of serious TEAEs was similar in the ranibizumab and aflibercept groups (15.6% to 18.5% in ranibizumab and 12.5% to 22% in aflibercept). Most of them were attributable to the injection procedure or the progression of the disease. The incidence of ocular SAEs in
CDR CLINICAL REVIEW REPORT FOR EYLEA
24
Common Drug Review August 2015
the study eye was numerically higher in the ranibizumab group than in the aflibercept group (3.3% versus 1.0% in VIEW 1 and 3.1% versus 2.9% in VIEW 2, respectively). The reported ocular SAEs in the study eye were mainly endophthalmitis, VA reduction, retinal hemorrhage, and posterior capsule opacification. Non-ocular SAEs were similar in the ranibizumab and aflibercept groups (8.9% to 18.8% versus 12.4% to 16.8% in ranibizumab and aflibercept, respectively). The reported non-ocular SAEs included pneumonia and falls. The incidence of AEs leading to withdrawal from the study during the 52 weeks was low (< 3%) and was similar between treatment groups in both studies. The most common AEs leading to withdrawal were eye disorders, including retinal hemorrhage, reduced VA, and retinal detachment. vvvv vvvvvvvv (v.v%) in the ranibizumab group and vv (v.v%) in the aflibercept group experienced an ATE in VIEW 1, while none was reported in VIEW 2. Endophthalmitis occurred in three patients (1%) in the ranibizumab group and none occurred in the aflibercept group in VIEW 1; no endophthalmitis was reported in VIEW 2. The incidence of retinal detachment was 5.2% in the ranibizumab group and 3.9% in the aflibercept group in VIEW 2; none were reported in the ranibizumab and aflibercept groups in VIEW 1. Overall, the rates of both ocular and non-ocular TEAEs reported during the first year of study were similar among the treatment groups. The TEAE pattern reported for the ranibizumab group in this study was generally consistent with the experience previously reported from the pivotal ranibizumab studies.14,15 Very few deaths were reported in either the ranibizumab or aflibercept (2q8) groups in both studies, although numerically more deaths occurred in the aflibercept groups (aflibercept versus ranibizumab: 0.6% to 2.6% versus 0.7% to 1.6%, respectively). None of the deaths were considered related to the study drug. In the extension phase of the VIEW trials, no new or unexpected safety issues were observed through week 96.30
4.3 Other Considerations The clinical expert involved in this review indicated that there is a potential for the off-label use of aflibercept if it is administered more frequently than every eight weeks, such as every six to eight weeks. Both the clinical expert and patient groups cited the potential of having fewer injections to administer for aflibercept compared with ranibizumab as a desirable characteristic of the new drug. Moreover, they noted that the similar efficacy and safety profile of aflibercept and ranibizumab suggests that aflibercept would be the potentially more desirable treatment option because of the need for fewer injections. Indeed, the results of the extension phase (Appendix 6) revealed that aflibercept users required five fewer injections than did ranibizumab users over a period of approximately one year. The included studies did not provide evidence related to the use of aflibercept in treatment-naive patients; there is a dearth of evidence related to the use of aflibercept patients who have been treated previously with another VEGF inhibitor. Indeed, only one low-quality study31 was identified (an uncontrolled, retrospective chart review of a small number of patients) that suggested that aflibercept might be beneficial in a subset of patients with neovascular AMD who exhibit recurrent or resistant intraretinal or subretinal fluid following injections with bevacizumab or ranibizumab. Bevacizumab (Avastin), a VEGF antibody that has been approved for the treatment of certain types of cancer, has not been approved in Canada for the treatment of wAMD and was not considered to be a valid comparator for the purpose of this review. However, bevacizumab is reimbursed for wAMD treatment in some of the jurisdictions that participate in the CDR process. In addition, according to the

CDR CLINICAL REVIEW REPORT FOR EYLEA
25
Common Drug Review August 2015
clinical expert, bevacizumab is used off-label for the treatment of wAMD in patients living in jurisdictions in which ranibizumab is not reimbursed and in patients who are ineligible for coverage. It is noteworthy that recently, Italy decided to pay for bevacizumab to be used to treat AMD instead of ranibizumab, based on the lower cost of bevacizumab.32 France is likely to do the same, despite bevacizumab’s not being approved for AMD in the European Union.32
5. CONCLUSIONS
The results of the two double-blind, multinational, active-controlled, RCTs (VIEW 1 and VIEW 2) suggest that aflibercept is non-inferior to ranibizumab for maintaining vision in treatment-naive patients with wAMD. At least 94% patients in the trials maintained their vision after 52 weeks of treatment, irrespective of whether they were treated with aflibercept or ranibizumab. There were no statistically significant differences between treatments in either study with respect to other outcomes, including changes in VA, the proportion of patients with legal blindness, and changes in QoL. Aflibercept and ranibizumab have similar safety profiles, as the incidences of TEAEs, SAEs, and WDAEs were similar for both treatments in both studies. The results of the extension phase of VIEW 1 and VIEW 2 suggest that the similar efficacy and safety profiles of aflibercept and ranibizumab observed at 52 weeks appear to persist through 96 weeks of treatment.

CDR CLINICAL REVIEW REPORT FOR EYLEA
26
Common Drug Review August 2015
APPENDIX 1: PATIENT INPUT SUMMARY This section was summarized by CADTH Common Drug Review (CDR) staff based on the input provided by patient groups. While it has not been systematically reviewed, it has been reviewed by the submitting patient groups.
1. Brief Description of Patient Group(s) Supplying Input The Canadian Council of the Blind (CCB), a registered charity, was founded in 1944 by blind war veterans and graduates from schools of the blind. All officers and directors are blind or visually impaired. The CCB has more than 65 chapters across Canada, and with more than 1,500 members, it is the largest membership-based organization for the blind in the country. From 2011 to 2014, CCB received support from the following: VIA Rail, Cannondale, Community Foundation of Ottawa, Lions Club, Keith Communications Inc., Human Resources and Skills Development Canada, and the following pharmaceutical companies: Bayer, Merck Frosst, Novartis, and Pfizer. CCB declared no conflicts of interest in the preparation of this submission.
2. Condition- and Current Therapy–Related Information CCB indicated that information provided in this section was obtained from printed information on current therapy from drug companies, online searches, one-to-one conversations with patients using current therapy, and focus groups. Patients identified that the availability of coverage and the lack of choice of Health Canada–approved drugs for the treatment of eye diseases such as advanced macular degeneration (AMD), diabetic macular edema, and retinal vein occlusion (RVO) are important issues. Impaired vision affects quality of life (QoL) and daily living. Because patients can no longer drive, they need to find alternative ways to attend medical appointments and social activities, and to go shopping. Assistance is required for simple tasks such as preparing meals, daily household chores, and reading (due to patients’ inability to read regular-sized font). Vision loss can lead to falls and more frequent injuries. Patients often experience an economic impact due to loss of employment and the cost of treatment. There is a social impact to AMD. Often, people visit patients with vision loss less frequently because they are unsure of how to deal with their friend’s situation. Patients become isolated because they cannot move independently in their former environment. Depression may be experienced due to knowledge of the pending loss of independence, potential loss of employment, loss of driving privileges, and the uncertainty of QoL and of a life with no vision. Family dynamics often change as patients become more reliant on those around them. Currently available therapies include laser therapy, oral therapies (Vitalux, ASA, Lutein) and injection therapies (ranibizumab [Lucentis] and bevacizumab [Avastin]). Many patients are using currently Health Canada–approved ranibizumab with good results, but ranibizumab may require more injections than Eylea. Some patients are receiving bevacizumab, which has not been tested or approved by Health Canada for this indication. Its long-term effects are not known and could lead to adverse results.

CDR CLINICAL REVIEW REPORT FOR EYLEA
27
Common Drug Review August 2015
Some patients are restricted in their choice of treatment due to the costs incurred by travel to regional clinics; therefore, they feel they do not receive optimal treatment. Some provinces provide only a certain amount of funding for currently approved drug therapy. The patients indicated that they need a choice of approved treatments, as only one is currently available. Physicians would benefit by having alternative treatments available should one not be available or not meet the current needs of their patients. Some patients may have an adverse reaction to an additive that may not be present in Eylea or experience irritation with the current treatment, which could possibly be avoided with a second choice of medication. Patients expressed the desire to receive the best approved care for AMD, diabetic macular edema, and RVO wherever they live so that the cost of travel and out-of-pocket medication expenses do not prevent them from getting care. Impact on caregivers With a diagnosis of AMD or RVO in a loved one, caregivers have to deal with the emotional effects of vision loss in someone who had been previously independent; they must also deal with their own emotions. They may need to provide comfort and reassurance and a safe environment for the patient, may need to take time off work to transport the patient to medical appointments or do their shopping, and may need to do more household chores, especially if the patient lives alone. Caregivers deal with an added financial burden due to both the patient and caregiver having to take time off from employment or arrange child care for other family members as they care for a loved one. Because of their lack of knowledge or understanding, they may not know how to deal with the personal feelings or depression in the patient.
3. Related Information About the Drug Being Reviewed CCB indicated that information about Eylea was obtained through computer research, talking with physicians, and one-to-one conversations with patients. Patients expect their lives will be improved with Eylea through decreased macular edema and therefore improved vision by arresting the progress of macular degeneration and possibly regaining vision. If patients felt they were going to regain vision or prevent further vision loss, they would often be willing to experience some temporary adverse effects, e.g., mild, short-term irritation. Infection is not acceptable and may be reduced through the use of single-dose vials of Eylea. Regaining vision, controlling bleeding, requiring fewer hospital visits, returning to work, and regaining independence to a greater degree than before treatment would be considered adequate improvement and worth the risk of side effects. Patients indicated Eylea may meet an unmet need by offering a second option to patients who experience an adverse reaction to the currently available therapy. There may be a reduction in the number of eye drops needed in the future, thereby reducing adverse reactions or irritations. Eylea may be administered every eight weeks, which is less frequently than current treatment and could result in fewer physician visits and caregivers missing less time from work.

CDR CLINICAL REVIEW REPORT FOR EYLEA
28
Common Drug Review August 2015
None of the patients contacted by CCB had had experience with Eylea. However, based on material provided by the manufacturer (posted on the Internet), patients’ expectations for Eylea include: • a different treatment option • five fewer injections • no need for interim monitoring • a predictable injections schedule.
4. Additional Information CCB indicated that the questions they answered for this report were clear and easy to navigate. The council said it is important to have patient input when a new drug is being assessed for approval because patients are the ones who will benefit from the treatment. In addition, patients are the people most aware of the potential results if treatment is not available.
CDR CLINICAL REVIEW REPORT FOR EYLEA
29
Common Drug Review August 2015
APPENDIX 2: LITERATURE SEARCH STRATEGY
OVERVIEW
Interface: Ovid
Databases: Embase 1974 to present MEDLINE Daily and MEDLINE 1946 to present MEDLINE In-Process & Other Non-Indexed Citations Note: Subject headings have been customized for each database. Duplicates between databases were removed in Ovid.
Date of Search: May 23, 2014
Alerts: Weekly search updates until Sept 17, 2014
Study Types: No search filters were applied
Limits: No date or language limits were used Conference abstracts were excluded
SYNTAX GUIDE
/ At the end of a phrase, searches the phrase as a subject heading
.sh At the end of a phrase, searches the phrase as a subject heading
MeSH Medical Subject Heading
fs Floating subheading
exp Explode a subject heading
* Before a word, indicates that the marked subject heading is a primary topic; or, after a word, a truncation symbol (wildcard) to retrieve plurals or varying endings
# Truncation symbol for one character
? Truncation symbol for one or no characters only
adj Requires words are adjacent to each other (in any order)
adj# Adjacency within # number of words (in any order)
.ti Title
.ab Abstract
.ot Original title
.hw Heading word; usually includes subject headings and controlled vocabulary
.pt Publication type
.rn CAS registry number
.nm Name of substance word
pmez
Ovid database code; MEDLINE In-Process & Other Non-Indexed Citations, MEDLINE Daily and Ovid MEDLINE 1946 to Present
oemezd Ovid database code; Embase 1974 to present, updated daily

CDR CLINICAL REVIEW REPORT FOR EYLEA
30
Common Drug Review August 2015
MULTI-DATABASE STRATEGY
Search Strategy:
# Searches Results
1 (Eylea* or aflibercept* or "AVE 0005" or AVE0005 or Bay 86-5321 or Bay86-5321 or VEGF Trap or Zaltrap or Ziv-aflibercept or vasculotropin trap or vascular endothelial growth factor trap).ti,ab,rn,nm,sh,hw,ot.
2201
2 862111-32-8.rn,nm. 1370
3 1 or 2 2201
4 Macular degeneration/ 18184
5 (macular degeneration* or Age-Related Maculopathies or macular Dystrophy or Macular Dystrophies or Age-Related Maculopathy or AMD or ARMD).ti,ab,sh,hw,ot.
36613
6 4 or 5 39587
7 3 and 6 351
8 7 use pmez 105
9 *aflibercept/ 314
10 (Eylea* or aflibercept* or "AVE 0005" or AVE0005 or Bay 86-5321 or Bay86-5321 or VEGF Trap or Zaltrap or Ziv-aflibercept or vasculotropin trap or vascular endothelial growth factor trap).ti,ab.
1026
11 9 or 10 1064
12 exudative macular degeneration/ or retina macula age related degeneration/ 12086
13 (macular degeneration* or Age-Related Maculopathies or macular Dystrophy or Macular Dystrophies or Age-Related Maculopathy or AMD or ARMD).ti,ab.
33602
14 12 or 13 36873
15 11 and 14 238
16 15 use oemezd 150
17 conference abstract.pt. 1452799
18 16 not 17 124
19 8 or 18 229
20 remove duplicates from 19 154
OTHER DATABASES
PubMed Same MeSH, keywords, limits, and study types used as per MEDLINE search, with appropriate syntax used.
Trial registries (Clinicaltrials.gov and others)
Same keywords, limits used as per MEDLINE search.
Grey literature
Dates for Search: May 2014
Keywords: Drug name, Indication
Limits: No date or language limits used

CDR CLINICAL REVIEW REPORT FOR EYLEA
31
Common Drug Review August 2015
Relevant websites from the following sections of the CADTH grey literature checklist, “Grey matters: a practical tool for evidence-based searching” (http://www.cadth.ca/en/resources/finding-evidence-is/grey-matters), were searched:
Health Technology Assessment Agencies
Health Economics
Clinical Practice Guidelines
Drug and Device Regulatory Approvals
Advisories and Warnings
Drug Class Reviews
Databases (free)
Internet Search.

CDR CLINICAL REVIEW REPORT FOR EYLEA
32
Common Drug Review August 2015
APPENDIX 3: EXCLUDED STUDIES
Reference Reason for Exclusion
Clinical Study Report: VGFT-OD-0605 (VIEW 1 – Year 2)25
Not approved regimen
Clinical Study Report: A62515 (VIEW 2 – Year 2)33
Not approved regimen
Heier et al. (2013)34
Not approved regimen

CDR CLINICAL REVIEW REPORT FOR EYLEA
33
Common Drug Review August 2015
APPENDIX 4: DETAILED OUTCOME DATA
TABLE 9: SUMMARY OF DEMOGRAPHICS AND BASELINE CHARACTERISTICS (FULL ANALYSIS SET)
VIEW 1 VIEW 2
RAN AFL RAN AFL
N = 304 N = 301 N = 291 N = 306
Age (years)
Mean (SD) 78.2 (7.6) 77.9 (8.4) 73.0 (9.0) 73.8 (8.6)
Median 79.0 79.0 74.0 75.0
Min to max 56 to 99 49a to 94 50 to 92 50 to 93
Sex (n [%])
Female 172 (56.6) 178 (59.1) 169 (58.1) 175 (57.2)
Male 132 (43.4) 123 (40.9) 122 (41.9) 131 (42.8)
Race (n [%])
White 296 (97.4) 287 (95.3) 213 (73.2) 217 (70.9)
Black 1 (0.3) 1 (0.3) 1 (0.3) 2 (0.7)
Asian 0 4 (1.3) 60 (20.6) 69 (22.5)
Weight (kg)
Mean (SD) 75.9 (17.8) 74.4 (17.7) 69.83 (15.0) 69.56 (14.4)
Median 74.8 72.6 68.0 68.0
Min to max 40 to 135 41 to 143 40.0 to 133.0 41.0 to 123.0
Body mass index (kg/m2)
Mean (SD) 27.3 (5.2) 27.2 (5.8) 26.3 (4.8) 26.2 (4.5)
Median 26.8 26.6 25.97 25.62
Min to max 15 to 45 17 to 71 15.8 to 57.6 17.1 to 39.2
Baseline ETDRS BCVA, mean (SD)
54.0 (13.4) 55.7 (12.8) 53.8 (13.5) 51.6 (13.9)
v vv vv vv vv vv
v vv vv v vv vv vv vv vv
v vv vvv vvv vvv vvv
Patients with 20/40 BCVA, n (%)
13 (4.3) 20 (6.6) 8 (2.7) 10 (3.3)
Lesion type, n (%)
Predominantly classic 82 (27.0) 71 (23.6) 70 (24.1) 88 (28.8)
Minimally classic 101 (33.2) 110 (36.5) 104 (35.7) 106 (34.6)
Occult 115 (37.8) 118 (39.2) 116 (39.9) 110 (35.9)
Juxtafoveal lesions 15 (4.9) 17 (5.6) 20 (6.9) 14 (4.6)
CRT, μm, mean (SD) 315.3 (108.3) 324.4 (111.2) 325.9 (110.9) 342.6 (124.0)
NEI VFQ-25 mean (SD) 71.8 (17.2) 69.6 (16.8) 72.9 (19.1) 71.3 (19.1)
AFL = aflibercept; BCVA = best corrected visual acuity; CNV = choroidal neovascularization; CRT = central retina thickness; ETDRS = Early Treatment Diabetic Retinopathy Study; FAS = full analysis set; max = maximum; min = minimum; NEI VFQ-25 = National Eye Institute 25-Item Visual Function Questionnaire; RAN = ranibizumab; SD = standard deviation. a Although one of the inclusion criteria was ≥ 50 years of age, one patient who was 49 years old was admitted into the study as
he was close to his 50th birthday and all other causes of CNV had been ruled out, rendering it highly likely that his CNV was age-related. Source: Clinical Study Reports: VIEW 1,
25 T12, p. 80; VIEW 2,
11 T13, p. 87; and Heier et al. (2012),
12 T1, p. 2,541.

CDR CLINICAL REVIEW REPORT FOR EYLEA
34
Common Drug Review August 2015
TABLE 10: PATIENT DISPOSITION (DETAILED)
Disposition/Reason VIEW 1 VIEW 2
RAN AFL RAN AFL
n (%) n (%) n (%) n (%)
Screeneda 2,063 2,031
Randomized 306 (100) 303 (100) 303 313
Completed at 52 weeks 284 (92.8) 276 (91.1) 276 (91.1) 284 (90.7)
Discontinuation from study within 52 weeks
22 (7.2) 27 (8.9) 27 (8.9) 29 (9.3)
Adverse event 4 (1.3) 4 (1.3) 2 (0.7) 9 (2.9)
Death 5(1.6) v (v.v) 2 (0.7) 2 (0.6)
Withdrawal by patient 10 (3.3) 8 (2.6) 11 (3.6) 11 (3.5)
Protocol deviation 3 (1.0) 1 (0.3) 2 (0.7) 0 (0.0)
Lost to follow-up 1 (0.3) 4 (1.3) 4 (1.3) 2 (0.6)
Treatment failureb 0 2 (0.7) 0 (0.0) 1 (0.3)
Otherc 1 (0.3) 1 (0.3) 7 (2.3) 5 (1.6)
Completed study medicationd
vvv (vv.v) vvv (vv.v) vvv (vv.v) vvv (vv.v)
Prematurely discontinued study medication
vv (v.v) vv (v.v) vv (vv.v) vv (vv.v)
Adverse event v (v.v) v (v.v) v (v.v) vv (v.v)
Death v (v.v) v (v.v) v (v.v) v (v.v)
Withdrawal by patient vv (v.v) v (v.v) vv (v.v) vv (v.v)
Protocol deviation v (v.v) v (v.v) v (v.v) v (v.v)
Lost to follow-up v (v.v) v (v.v) v (v.v) v (v.v)
Treatment failure a v (v.v) v (v.v) v (v.v) v (v.v)
Otherc v (v.v) v (v.v%) v (v.v) v (v.v)
FASe 304 (99.3) 301 (99.3) 291 (96) 306 (97.8)
PPSe 269 (87.9) 265 (87.5) 269 (88.8) 270 (86.3)
Safety 304 (99.3) 303 (100) 291 (96) 307 (98.1)
AFL = aflibercept; FAS = full analysis set; PPS = per-protocol analysis set; RAN = ranibizumab. a
Total number of patients screened. b Treatment failure was defined as a decrease from baseline in BCVA by ≥ 15 letters at 2 consecutive assessments, four weeks
apart, during the first 52 weeks of the study. c “Other” included patients who were discontinued from the study by the investigator for reasons such as no leakage,
noncompliance, or health issues. d
Derived based on the number randomized and the number who prematurely discontinued study medication. e
The number could vary with different outcomes. Source: VIEW 1: T7, p. 73 and VIEW 2: T7, p. 83.

CDR CLINICAL REVIEW REPORT FOR EYLEA
35
Common Drug Review August 2015
TABLE 11: TREATMENT EXPOSURE DURING YEAR 1 (SAFETY ANALYSIS SET)
VIEW 1 VIEW 2
RAN AFL RAN AFL
N = 304 N = 303 N = 291 N = 307
Number of all injections (including sham) during year 1, n (%)
1 to 4 9 (3) 6 (2) 5 (1.7) 9 (2.9)
5 to 8 9 (3) 17 (6) 6 (2.1) 11 (3.6)
9 to 13 286 (94.1) 280 (92.4) 280 (96.2) 287 (93.5)
Mean (SD) 12.1 (2) 12.0 (2) 12.4 (1.8) 12.2 (2.2)
vvvvvv vv.v vv.v vv.v vv.v
vvv vv vvv v vv vv v vv vv v vv vv v vv vv
Number of active injections during the first year (excluding sham), n (%)
v vv v vv vv v (v.v) vv (v.v)
v vv v vv vv v (v.v) vvv (vv.v)
v vv vv vv vv vvv (vv.v) v (v.v)
Mean (SD) 12.1 (2) 7.5 (1) 12.4 (1.8) 7.5 (1.3)
Median 13.0 8.0 13.0 8.0
vvv vv vvv v vv vv v vv v v vv vv v vv v
Total amount of study medication during the first year (mg)
n 304 300 287 268
Mean (SD) 6.0 (1) 14.9 (2) 6.22 (0.90) 15.05 (2.88)
vvvvvv v.v vv.v v.vv vv.v
Min to max 1.0 to 7.0 2.0 to 16.0 0.5 to 8.0 2.0 to 34.0
Treatment duration in year 1 (days)a
n 304 303 291 307
Mean (SD) 350.1 (56) 347.3 (58) 353.3 (47.4) 347.6 (62.2)
vvvvvv vvv.v vvv.v vvv vvv
Min to max 28 to 378 28 to 379 28 to 378 28 to 385
AFL = aflibercept; min = minimum; max = maximum; RAN = ranibizumab; SD = standard deviation. a
Duration of study medication = last dose date – first dose date + 28. Note: Sham injections were counted in the number of injections. Source: VIEW 1: T35, p. 120 and T36, p. 121; and VIEW 2: T35, p. 139.

CDR CLINICAL REVIEW REPORT FOR EYLEA
36
Common Drug Review August 2015
TABLE 12: TREATMENT COMPLIANCE DURING YEAR 1 (FULL ANALYSIS SET)
VIEW 1 VIEW 2
RAN AFL RAN AFL
N = 304 N = 301 N = 291 N = 306
Patients receiving all 3 injections within the first 12 weeks (n [%])
vvv (vv%) vvv (vv.v%) vvv (vv.v) vvv (vv.v)
Patients with < 75 % compliance in the first year (n [%])
a
v (v.v%) v (v.v%) v (v.v) v (v.v)
Patients with ≥ 75 % compliance in the first year (n [%])
a
vvv (vv.v%) vvv (vv.v%) vvv (vv.v) vvv (vv.v)
Compliance in the first year (%)a
Mean (SD) vv.v (v.vv) vv.v (v.vv) vv.v (v.v) vv.v (v.v)
Median vvv.v vvv.v vvv.v vvv.v
Min to max vv vv vvv vv vv vvv vv vv vvv vv vv vvv
AFL = aflibercept; min = minimum; max = maximum; RAN = ranibizumab; SD = standard deviation. a Treatment compliance in the first year was calculated as the (number of doses administered during period/number of planned
doses) x 100. Period was defined as from day 1 to date of last visit. Planned doses included both aflibercept and sham injections. Source: VIEW 1: T17, p. 87; and VIEW 2: T18, p. 97.
TABLE 13: SENSITIVITY ANALYSES OF THE PROPORTION OF PATIENTS WHO MAINTAINED VISION (PER-PROTOCOL
ANALYSIS SET)
VIEW 1 VIEW 2
RAN AFL RAN AFL
N = 269 N = 265 N = 269 N = 270
Worst observation carried forward
Patients who maintained vision at week 52, n (%)
a
vvv (vv.v) vvv (vv.v) vvv (vv.vv) vvv (vv.vv)
Difference (%) (95% CI) - –v.v (–v.v vv v.v) - –v.vv (–v.vv vv v.vv)
All dropouts counted as non-responders
Patients who maintained vision at week 52, n (%)
a
vvv /vvv (vv.v) vvv (vv.v) vvv (vv.vv) vvv (vvv)
Difference (%) (95% CI) - v.v (–v.v vv v.v) - –v.vv (–v.vv vv v.vv)
All treatment failures counted as non-responders
Patients who maintained vision at week 52, n (%)
a
vvv (vv.v) vvv (vv.v) vvv (vv.vv) vvv (vv.vv)
Proportion difference, % (95% CI)
- –v.v (–v vv v.v) - –v.vv (–v.vv vv v.vv)
AFL = aflibercept; CI = confidence interval; RAN = ranibizumab; SD = standard deviation; VA = visual acuity. a Maintenance of vision was defined as a loss of < 15 letters in the ETDRS letter score. Difference is ranibizumab minus
aflibercept; CI calculated using a normal approximation. Source: VIEW 1: T19, p. 90; VIEW 2: T22, p. 102.

CDR CLINICAL REVIEW REPORT FOR EYLEA
37
Common Drug Review August 2015
TABLE 14: SENSITIVITY ANALYSES OF THE PROPORTION OF PATIENTS WHO MAINTAINED VISION (FULL ANALYSIS
SET)
VIEW 1 VIEW 2
RAN AFL RAN AFL
N = 304 N = 301 N = 291 N = 306
Last observation carried forward
Patients who maintained vision at week 52 (%)
a
285 (93.8) 284 (94.4) 276 (94.9) 292 (95.4)
Proportion difference (%) (95% CI) –0.6 (–4.4 to 3.2) –0.58 (–4.03 to 2.88)
Worst observation carried forward
Patients who maintained vision at week 52 (%)
a
vvv (vv.v) vvv (vv.v) vvv (vv.v) vvv (vv.v)
Proportion difference (%) (95% CI) v.v (–v.v vv v) –v.vv (–v.vv vv v.vv)
All dropouts counted as non-responders
Patients who maintained vision at week 52 (%)
a
vvv (vv.v) vvv (vv.v) vvv (vv.v) vvv (vv.v)
Proportion difference (%) (95% CI) v.v (–v.v vv v.v) v.vv (–v.vv vv v.vv)
All treatment failures counted as non-responders
Patients who maintained vision at week 52, n (%)
a
vvv (vv.v) vvv (vv.v) vvv (vv.v) vvv (vv.v)
Proportion difference (%) (95% CI) –v.v (–v.v vv v.v) –v.vv (–v.vv vv v.vv)
AFL = aflibercept; CI = confidence interval; ETDRS = Early Treatment Diabetic Retinopathy Study; RAN = ranibizumab; SD = standard deviation; VA = visual acuity. a Maintenance of vision was defined as a loss of < 15 letters in the ETDRS letter score. Difference is ranibizumab minus
aflibercept; CI was calculated using a normal approximation. Source: VIEW 1: T20, p. 91; VIEW 2: T21, p. 102.

CDR CLINICAL REVIEW REPORT FOR EYLEA
38
Common Drug Review August 2015
TABLE 15: CHANGE FROM BASELINE TO WEEK 52 IN ETDRS LETTER SCORE IN THE STUDY EYE (LAST
OBSERVATION CARRIED FORWARD) (FULL ANALYSIS SET)
VIEW 1 VIEW 2
RAN AFL RAN AFL
Baseline
n 304 301 291 306
Mean (SD) 54.0 (13.41) 55.7 (12.77) 53.8 (13.5) 51.6 (13.9)
Median 56.0 56.0 56.0 52.0
Range 10.0 to 78.0 15.0 to 83.0 10.0 to 83.0 16.0 to 76.0
Week 52
n 304 301 291 306
Mean (SD) 62.1 (17.71) 63.6 (16.85) 63.1 (16.6) 60.5 (17.5)
Median 67.0 68.0 67.0 64.0
Range 0.0 to 88.0 11.0 to 93.0 8.0 to 90.0 7.0 to 93.0
Week 52 (change from baseline)
n 304 301 291 306
Mean (SD) 8.1 (15.25) 7.9 (15.00) 9.4 (13.5) 8.9 (14.4)
Median 9.0 9.0 10.0 9.0
Range –75.0 to 56.0 –48.0 to 54.0 –47.0 to 56.0 –63.0 to 50.0
LSM differencea
(95% CI) 0.26 (–1.97 to 2.49) –0.90 (–3.06 to 1.26)
P value 0.8179 0.413
AFL = aflibercept; CI = confidence interval; ETDRS = Early Treatment Diabetic Retinopathy Study LSM = least squares mean; RAN = ranibizumab; SD = standard deviation. a
Difference is aflibercept minus ranibizumab. CI calculated using normal approximation. ANCOVA main-effect model. Source: VIEW 1:T22, p. 94; VIEW 2: T24, p. 107.
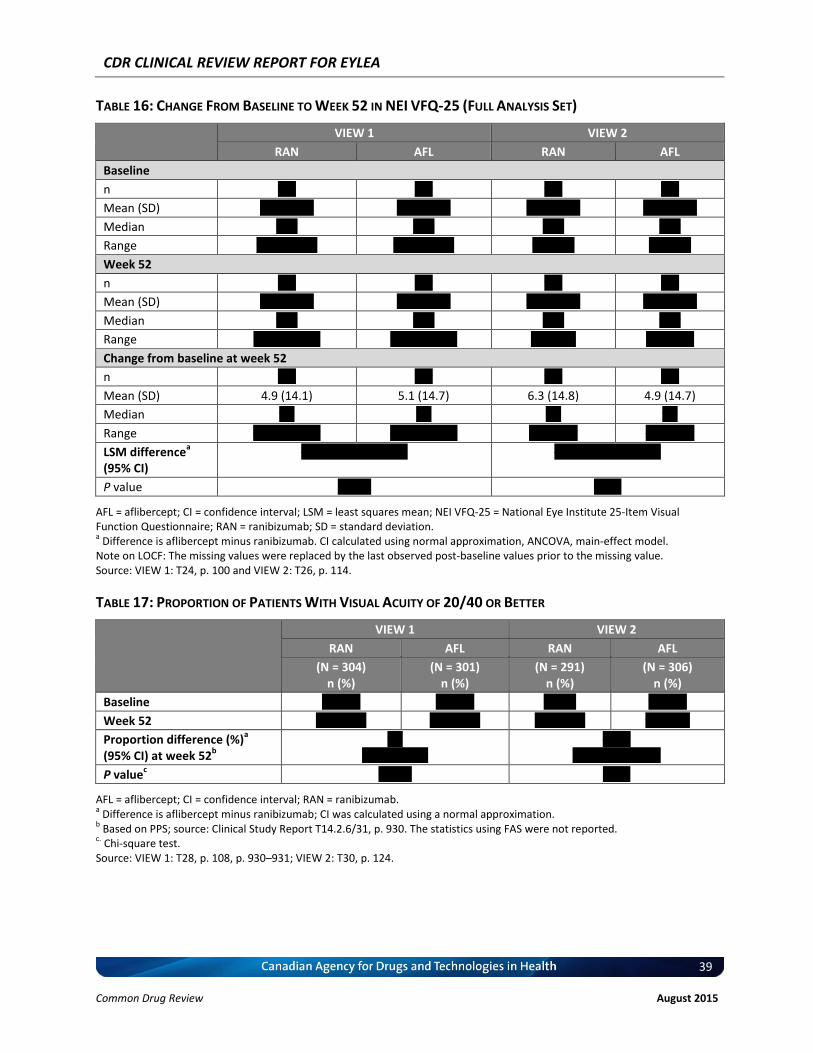
CDR CLINICAL REVIEW REPORT FOR EYLEA
39
Common Drug Review August 2015
TABLE 16: CHANGE FROM BASELINE TO WEEK 52 IN NEI VFQ-25 (FULL ANALYSIS SET)
VIEW 1 VIEW 2
RAN AFL RAN AFL
Baseline
n vvv vvv vvv vvv
Mean (SD) vv.v (vv.v) vv.v (vv.v) vv.v (vv.v) vv.v (vv.v)
Median vv.v vv.v vv.v vv.v
Range vv.v vv vv.v vv.v vv vv.v vv vv vv vv vv vv
Week 52
n vvv vvv vvv vvv
Mean (SD) vv.v (vv.v) vv.v (vv.v) vv.v (vv.v) vv.v (vv.v)
Median vv.v vv.v vv.v vv.v
Range vv.v vv vvv.v vv.v vv vvv.v vv vvvvv vv vv vvv
Change from baseline at week 52
n vvv vvv vvv vvv
Mean (SD) 4.9 (14.1) 5.1 (14.7) 6.3 (14.8) 4.9 (14.7)
Median v.v v.v v.v v.v
Range –vv.v vv vv.v –vv.v vv vv.v –vv vv vv –vv vv vv
LSM differencea
(95% CI) –v.vv (–v.vv vv v.vv) –v.vv (–v.vv vv v.vv)
P value v.vvvv v.vvv
AFL = aflibercept; CI = confidence interval; LSM = least squares mean; NEI VFQ-25 = National Eye Institute 25-Item Visual Function Questionnaire; RAN = ranibizumab; SD = standard deviation. a Difference is aflibercept minus ranibizumab. CI calculated using normal approximation, ANCOVA, main-effect model.
Note on LOCF: The missing values were replaced by the last observed post-baseline values prior to the missing value. Source: VIEW 1: T24, p. 100 and VIEW 2: T26, p. 114.
TABLE 17: PROPORTION OF PATIENTS WITH VISUAL ACUITY OF 20/40 OR BETTER
VIEW 1 VIEW 2
RAN AFL RAN AFL
(N = 304) n (%)
(N = 301) n (%)
(N = 291) n (%)
(N = 306) n (%)
Baseline vv (v.v) vv (v.v) v (v.v) vv (v.v)
Week 52 vvv (vv.v) vvv (vv.v) vvv (vv.v) vv (vv.v)
Proportion difference (%)a
(95% CI) at week 52b
v.v (–v.v vv vv)v
–v.vv (–vv.vv vv –v.vv)
P valuec v.vvvv v.vvv
AFL = aflibercept; CI = confidence interval; RAN = ranibizumab. a Difference is aflibercept minus ranibizumab; CI was calculated using a normal approximation.
b Based on PPS; source: Clinical Study Report T14.2.6/31, p. 930. The statistics using FAS were not reported.
c. Chi-square test.
Source: VIEW 1: T28, p. 108, p. 930–931; VIEW 2: T30, p. 124.

CDR CLINICAL REVIEW REPORT FOR EYLEA
40
Common Drug Review August 2015
TABLE 18: CHANGE FROM BASELINE TO WEEK 52 IN CENTRAL RETINAL THICKNESS (FULL ANALYSIS SET)
VIEW 1 VIEW 2
RAN AFL RAN AFL
Baseline
n vvv vvv vvv vvv
Mean (SD), μm vvv.v (vvv.v) vvv.v (vvv.v) vvv.v (vvv.v) vvv.v (vvv.v)
Median vvv.v vvv.v vvv.v vvv.v
Range vv.v vv vvv.v vv.v vv vvv.v vvv vv vvv vvv vv vvv
Week 52
n vvv vvv vvv vvv
Mean (SD), μm vvv.v (vv.v) vvv.v (vv.v) vvv.v (vv.v) vvv.v (vv.v)
Median vvv.v vvv.v vvv.v vvv.v
Range vv.v vv vvv.v v.v vv vvv.v vv vv vvv vv vv vvv
Week 52 (change from baseline)
n vvv vvv vvv vvv
Mean (SD), μm –vvv.v (vvv.v) –vvv.v (vvv.v) –vvv.v (vvv.v) –vvv.v (vvv.v)
Median –vv.v –vvv.v –vvv.v –vvv.v
Range –vvv.v vv vvv.v –vvv.v vv vvv.v –vvv vv vvv –vvv vv vvv
LSM differencea
95% CI) –v.vv (–v.vv, v.vv) v.v (–v.vv, vv.vv)
P value v.vvvv v.vvv
AFL = aflibercept; CI = confidence interval; LSM = least squares mean; RAN = ranibizumab; SD = standard deviation. a Difference is aflibercept minus ranibizumab. CI calculated using normal approximation; ANCOVA, main-effect model.
Source: VIEW 1: T30, p. 111; VIEW 2:T32, p. 130.
TABLE 19: CHANGE FROM BASELINE TO WEEK 52 IN NEI VFQ-25 SUBSCALE (FULL ANALYSIS SET)
VIEW 1 VIEW 2
RAN AFL RAN AFL
Near Activities
Baseline
n vvv vvv vvv vvv
Mean (SD) vv.v (vv.v) vv.v (vv.v) vv.v (vv.v) vv.v (vv.v)
Median vv.v vv.v vv.v vv.v
Range v.v vv vvv.v vv.v vv vvv.v v vv vvv v vv vvv
Week 52
n vvv vvv vvv vvv
Mean (SD) vv.v (vv.v) vv.v (vv.v) vv.v (vv.v) vv.v (vv.v)
Median vv.v vv.v vv.v vv.v
Range v.v vv vvv.v v.v vv vvv.v v vv vvv v vv vvv
Change From baseline at week 52
n vvv vvv vvv vvv
Mean (SD) v.v (vv.v) v.v (vv.v) v.v (vv.v) v.v (vv.v)
Median v.v v.v v.v v.v
Range –vv.v vv vv.v –vv.v vv vv.v –vv vv vv –vv vv vv
LSM differencea (95% CI) vv –v.vv (–v.vv vv v.vv)

CDR CLINICAL REVIEW REPORT FOR EYLEA
41
Common Drug Review August 2015
VIEW 1 VIEW 2
RAN AFL RAN AFL
P value vv v.vvvv
Distance Activities
Baseline
n vvv vvv vvv vvv
Mean (SD) vv.v (vv.v) vv.v (vv.v) vv.v (vv.v) vv.v (vv.v)
Median vv.v vv.v vv.v vv.v
Min to Max v.v vv vvv.v vv.v vv vvv.v v vv vvv v vv vvv
Week 52
n vvv vvv vvv vvv
Mean (SD) vv.v (vv.vv) vv.v (vv.vv) vv.v (vv.v) vv.v (vv.v)
Median vv.v vv.v vv.v vv.v
Min to Max v.v vv vvv.v v.v vv vvv.v vv vv vvv v vv vvv
Change From baseline at week 52
n vvv vvv vvv vvv
Mean (SD) v.v (vv.v) v.v (vv.v) v.v (vv.v) v.v (vv.v)
Median v.v v.v v.v v.v
Range –vvv.v vv vv.v –vv.v vv vv.v –vv vv vv –vv vv vv
LSM differencea (95% CI) vv –v.vv (–v.vv, –v.vv)
P value vv v.vvvv
Vision Dependency
Baseline
n vvv vvv vvv vvv
Mean (SD) vv.v (vv.v) vv.v (vv.v) vv.v (vv.v) vv.v (vv.v)
Median vv.v vv.v vvv.v vv.v
Range v.v vv vvv.v v.v vv vvv.v v vv vvv v vv vvv
Week 52
n vvv vvv vvv vvv
Mean (SD) vv.v (vv.v) vv.v (vv.v) vv.v (vv.v) vv.v (vv.v)
Median vv.v vv.v vvv.v vvv.v
Range v.v vv vvv.v v.v vv vvv.v v vv vvv v vv vvv
Change From baseline at week 52
n vvv vvv vvv vvv
Mean (SD) v.v (vv.v) v.v (vv.v) v.v (vv.v) v.v (vv.v)
Median v.v v.v v.v v.v
Range –vv.v vv vvv.v –vv.v vv vv.v –vvv vv vvv –vv vv vvv
LSM differencea (95% CI) vv –v.vv (–v.vv vv v.vv)
P value vv v.vvvv
AFL = aflibercept; CI = confidence interval; LSM = least squares mean; NEI VFQ-25 = National Eye Institute 25-Item Visual Function Questionnaire; RAN = ranibizumab; SD = standard deviation. a Difference is aflibercept minus ranibizumab. CI calculated using normal approximation; ANCOVA, main-effect model.
Source: VIEW 1: T32, p. 116, T33, p. 117, T34, p. 118; VIEW 2: T33, p. 134–135.
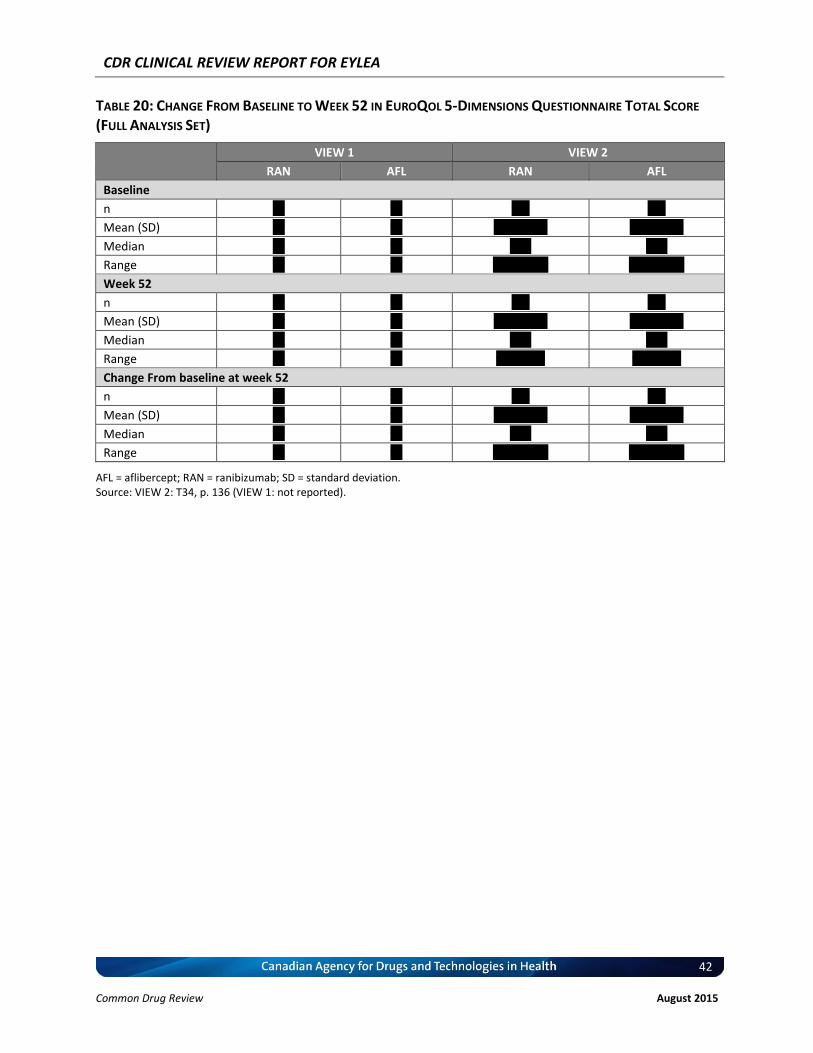
CDR CLINICAL REVIEW REPORT FOR EYLEA
42
Common Drug Review August 2015
TABLE 20: CHANGE FROM BASELINE TO WEEK 52 IN EUROQOL 5-DIMENSIONS QUESTIONNAIRE TOTAL SCORE
(FULL ANALYSIS SET)
VIEW 1 VIEW 2
RAN AFL RAN AFL
Baseline
n vv vv vvv vvv
Mean (SD) vv vv v.vv (v.vv) v.vv (v.vv)
Median vv vv v.vv v.vv
Range vv vv –v.v vv v.v –v.v vv v.v
Week 52
n vv vv vvv vvv
Mean (SD) vv vv v.vv (v.vv) v.vv (v.vv)
Median vv vv v.vv v.vv
Range vv vv v.v vv v.v v.v vv v.v
Change From baseline at week 52
n vv vv vvv vvv
Mean (SD) vv vv v.vv (v.vv) v.vv (v.vv)
Median vv vv v.vv v.vv
Range vv vv –v.v vv v.v –v.v vv v.v
AFL = aflibercept; RAN = ranibizumab; SD = standard deviation. Source: VIEW 2: T34, p. 136 (VIEW 1: not reported).

CDR CLINICAL REVIEW REPORT FOR EYLEA
43
Common Drug Review August 2015
TABLE 21: OVERALL ADVERSE EVENT PROFILE DURING YEAR 1 (SAFETY ANALYSIS SET)
VIEW 1 VIEW 2
RAN AFL RAN AFL
N = 304 N = 303 N = 291 N = 307
n (%) n (%) n (%) n (%)
Patients with any AE 301 (99.0) 298 (98.3) 255 (87.6) 281 (91.5)
Any pre-treatment AE 224 (73.7) 226 (74.6) 63 (21.6) 69 (22.5)
Any TEAE 290 (95.4) 289 (95.4) 250 (85.9) 277 (90.2)
Any ocular TEAE 263 (86.5) 257 (84.8) 210 (72.2) 220 (71.7
Study eye 246 (80.9) 238 (78.5) 187 (64.3) 198 (64.5)
Fellow eye 150 (49.3) 143 (47.2) 124 (42.6) 123 (40.1)
Any treatment-related ocular TEAE 16 (5.3) 9 (3.0) 23 (7.9) 27 (8.8)
Study eye 16 (5.3) 8 (2.6) 23 (7.9) 25 (8.1)
Fellow eye 0 1 (0.3) NR NR
Any treatment-related TEAE 17 (5.6) 11 (3.6) 26 (8.9) 34 (11.1)
Any injection-related ocular TEAE 183 (60.2) 164 (54.1) 94 (32.3) 92 (30.0)
Study eye 182 (59.9) 163 (53.8) 93 (32.0) 89 (29.0)
Fellow eye 13 (4.3) 8 (2.6) NR NR
Maximum intensity for any ocular TEAE
Mild 166 (54.6) 160 (52.8) 116 (39.9) 112 (36.5)
Moderate 78 (25.7) 92 (30.4) 83 (28.5) 91 (29.6)
Severe 19 (6.3) 5 (1.7) 11 (3.8) 17 (5.5)
Any non-ocular TEAE 234 (77.0) 223 (73.6) 181 (62.2) 213 (69.4)
Any treatment-related non-ocular TEAE 2 (0.7) 3 (1.0) 4 (1.4) 8 (2.6)
Maximum intensity for any non-ocular TEAE
Mild 103 (33.9) 112 (37.0) 88 (30.2) 105 (34.2)
Moderate 96 (31.6) 83 (27.4) 78 (26.8) 81 (26.4)
Severe 35 (11.5) 28 (9.2) 15 (5.2) 27 (8.8)
Any death 5 (1.6) 7 (2.3%) 2 (0.7) 2 (0.7)
Any SAE 71 (23.4) 58 (19.1) 36 (12.4) 50 (16.3)
Any treatment-emergent SAE 68 (22.4) 56 (18.5) 35 (12.0) 48 (15.6)
Any AE leading to withdrawal from the study 4 (1.3) 6 (2.0) 3 (1.0) 10 (3.3)
Any AE leading to withdrawal from the study drug 5 (1.6) 4 (1.3) 4 (1.4) 10 (3.3)
AE = adverse event; AFL = aflibercept; NR = not reported; RAN = ranibizumab; SAE = serious adverse event; TEAE = treatment-emergent adverse event. Source: VIEW 1: T37, p.122; VIEW 2: T36, p. 141.

CDR CLINICAL REVIEW REPORT FOR EYLEA
44
Common Drug Review August 2015
TABLE 22: OCULAR TREATMENT-EMERGENT ADVERSE EVENTS IN THE STUDY EYE OCCURRING IN AT LEAST 5% OF
PATIENTS (SAFETY ANALYSIS SET)
VIEW 1 VIEW 2
RAN AFL RAN AFL
N = 304 n (%)
N = 303 n (%)
N = 291 n (%)
N = 307 n (%)
Number of patients with at least 1 ocular TEAE in study eye
246 (80.9) 238 (78.5) 187 (64.3) 198 (64.5)
Conjunctival hemorrhage 144 (47.4) 131 (43.2) 23 (7.9) 30 (9.8)
Vitreous floaters 33 (10.9) 21 (6.9%) NR NR
Eye pain 26 (8.6) 22 (7.3) 27 (9.3) 21 (6.8)
Vitreous detachment 24 (7.9) 19 (6.3) 9 (3.1) 15 (4.9)
Reduced VA 20 (6.6) 20 (6.6) 20 (6.9) 33 (10.7)
Retinal hemorrhage 19 (6.3) 23 (7.6) 29 (10.0) 27 (8.8)
Macular degeneration 16 (5.3) 10 (3.3) 23 (7.9) 30 (9.8)
Increased intraocular pressure 22 (7.2) 15 (5.0) 19 (6.5) 15 (4.9)
Eye irritation 16 (5.3) 12 (4.0) NR NR
Maculopathy 19 (6.3) 8 (2.6) NR NR
Sensation of foreign body in eyes 9 (3.0) 16 (5.3) NR NR
Detachment of retinal pigment epithelium NR NR 15 (5.2) 12 (3.9)
Cataract NR NR 15 (5.2) 12 (3.9)
Ocular hyperemia NR NR 18 (6.2) 9 (2.9)
AFL = aflibercept; NR = not reported; RAN = ranibizumab; TEAE = treatment-emergent adverse event; VA = visual acuity. Source: VIEW 1: T38, p. 124; VIEW 2: T37, p. 144.
TABLE 23: NON-OCULAR TREATMENT-EMERGENT ADVERSE EVENTS OCCURRING IN AT LEAST 5% OF PATIENTS
(SAFETY ANALYSIS SET)
VIEW 1 VIEW 2
RAN AFL RAN AFL
N = 304 n (%)
N = 303 n (%)
N = 291 n (%)
N = 307 n (%)
Number of patients with at least 1 non-ocular TEAE
234 (77.0) 223 (73.6) 181 (62.2) 213 (69.4)
Infections and infestations 123 (40.5) 104 (34.3) 77 (26.5) 73 (23.8)
Nasopharyngitis 23 (7.6) 26 (8.6) 25 (8.6) 19 (6.2)
Upper respiratory tract infection 13 (4.3) 18 (5.9) 6 (2.1) 5 (1.6)
Urinary tract infection 17 (5.6) 13 (4.3) 9 (3.1) 5 (1.6)
Bronchitis 16 (5.3) 17 (5.6) 7 (2.4) 9 (2.9)
Sinusitis 8 (2.6) 11 (3.6) NR NR
Influenza 9 (3.0) 7 (2.3) 7 (2.4) 17 (5.5)
Pneumonia 14 (4.6) 6 (2.0) NR NR
Cellulitis 7 (2.3) 2 (0.7) NR NR
Cystitis NR NR 3 (1.0) 2 (0.7)
Investigations 48 (15.8) 60 (19.8) 43 (14.8) 61 (19.9)
Blood glucose increased 8 (2.6) 7 (2.3) 1 (0.3) 8 (2.6)
Protein urine present 7 (2.3) 10 (3.3) NR NR
Urine protein/creatinine ratio 3 (1.0) 6 (2.0) NR NR

CDR CLINICAL REVIEW REPORT FOR EYLEA
45
Common Drug Review August 2015
VIEW 1 VIEW 2
RAN AFL RAN AFL
N = 304 n (%)
N = 303 n (%)
N = 291 n (%)
N = 307 n (%)
increased
Blood urine present 4 (1.3) 6 (2.0) NR NR
Blood pressure increased 4 (1.3) 9 (3.0) NR NR
Electrocardiogram T-wave inversion NR NR 5 (1.7) 7 (2.3)
Nervous system disorders 35 (11.5) 47 (15.5) 27 (9.3) 35 (11.4)
Headache 19 (6.3) 12 (4.0) 11 (3.8) 17 (5.5)
Dizziness 5 (1.6) 7 (2.3) 9 (3.1) 3 (1.0)
Injury, poisoning, and procedural complications
42 (13.8) 45 (14.9) 19 (6.5) 27 (8.8)
Fall 15 (4.9) 16 (5.3) 9 (3.1) 2 (0.7)
Contusion 4 (1.3) 3 (1.0) NR NR
Gastrointestinal disorders 52 (17.1) 40 (13.2) 30 (10.3) 45 (14.7)
Nausea 13 (4.3) 7 (2.3) NR NR
Diarrhea 9 (3.0) 5 (1.7) 10 (3.4) 14 (4.6)
Gastroesophageal reflux disease 6 (2.0) 6 (2.0) NR NR
Constipation 12 (3.9) 6 (2.0) NR NR
Abdominal pain upper NR NR 0 (0.0) 1 (0.3)
Vomiting NR NR 6 (2.1) 2 (0.7)
Musculoskeletal and connective tissue disorders
54 (17.8) 41 (13.5) 31 (10.7) 39 (12.7)
Arthralgia 11 (3.6) 5 (1.7) 8 (2.7) 3 (1.0)
Back pain 9 (3.0) 9 (3.0) 13 (4.5) 11 (3.6)
Osteoarthritis 5 (1.6) 7 (2.3) 4 (1.4) 6 (2.0)
Arthritis 9 (3.0) 2 (0.7) NR NR
Respiratory, thoracic, and mediastinal
47 (15.5) 36 (11.9) 24 (8.2) 24 (7.8)
Cough 11 (3.6) 10 (3.3) 7 (2.4) 3 (1.0)
Chronic obstructive pulmonary disease
6 (2.0) 7 (2.3) NR NR
Dyspnea 8 (2.6) 3 (1.0) NR NR
Cardiac disorders 41 (13.5) 32 (10.6) 32 (11.0) 40 (13.0)
Atrial fibrillation 11 (3.6) 6 (2.0) 3 (1.0) 5 (1.6)
Atrioventricular block – first degree NR NR 10 (3.4) 9 (2.9)
Vascular disorders 34 (11.2) 28 (9.2) 27 (9.3) 23 (7.5)
Hypertension 25 (8.2) 20 (6.6) 22 (7.6) 16 (5.2)
Metabolism and nutrition disorders 29 (9.5) 24 (7.9) 12 (4.1) 23 (7.5)
Hypercholesterolemia 5 (1.6) 7 (2.3) NR NR
Diabetes mellitus NR NR 4 (1.4) 7 (2.3)
Hyperglycemia NR NR 2 (0.7) 2 (0.7)
Skin and subcutaneous tissue disorders
22 (7.2) 20 (6.6) 18 (6.2) 14 (4.6)
General disorders and injection administration site conditions
19 (6.3) 22 (7.3) 18 (6.2) 13 (4.2)
Pyrexia NR NR 8 (2.7) 5 (1.6)
Neoplasms benign, malignant, and unspecified
22 (7.2) 22 (7.3) 6 (2.1) 8 (2.6)
Basal cell carcinoma 4 (1.3) 8 (2.6) NR NR
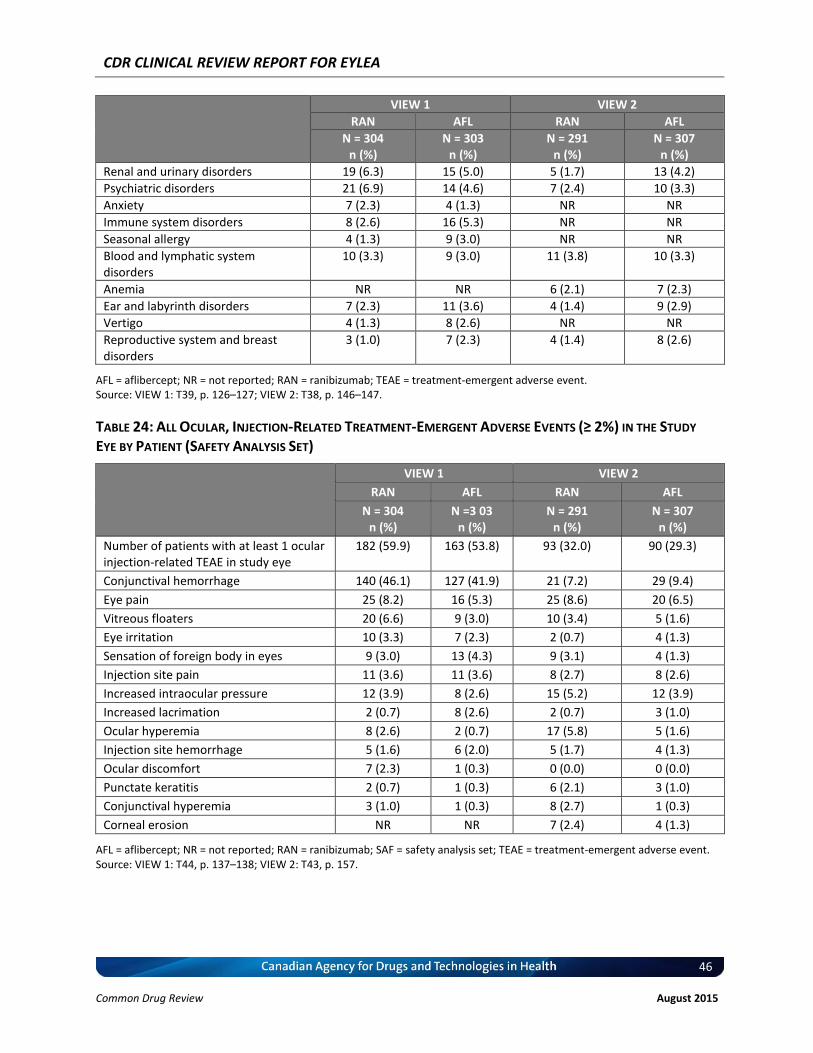
CDR CLINICAL REVIEW REPORT FOR EYLEA
46
Common Drug Review August 2015
VIEW 1 VIEW 2
RAN AFL RAN AFL
N = 304 n (%)
N = 303 n (%)
N = 291 n (%)
N = 307 n (%)
Renal and urinary disorders 19 (6.3) 15 (5.0) 5 (1.7) 13 (4.2)
Psychiatric disorders 21 (6.9) 14 (4.6) 7 (2.4) 10 (3.3)
Anxiety 7 (2.3) 4 (1.3) NR NR
Immune system disorders 8 (2.6) 16 (5.3) NR NR
Seasonal allergy 4 (1.3) 9 (3.0) NR NR
Blood and lymphatic system disorders
10 (3.3) 9 (3.0) 11 (3.8) 10 (3.3)
Anemia NR NR 6 (2.1) 7 (2.3)
Ear and labyrinth disorders 7 (2.3) 11 (3.6) 4 (1.4) 9 (2.9)
Vertigo 4 (1.3) 8 (2.6) NR NR
Reproductive system and breast disorders
3 (1.0) 7 (2.3) 4 (1.4) 8 (2.6)
AFL = aflibercept; NR = not reported; RAN = ranibizumab; TEAE = treatment-emergent adverse event. Source: VIEW 1: T39, p. 126–127; VIEW 2: T38, p. 146–147.
TABLE 24: ALL OCULAR, INJECTION-RELATED TREATMENT-EMERGENT ADVERSE EVENTS (≥ 2%) IN THE STUDY
EYE BY PATIENT (SAFETY ANALYSIS SET)
VIEW 1 VIEW 2
RAN AFL RAN AFL
N = 304 n (%)
N =3 03 n (%)
N = 291 n (%)
N = 307 n (%)
Number of patients with at least 1 ocular injection-related TEAE in study eye
182 (59.9) 163 (53.8) 93 (32.0) 90 (29.3)
Conjunctival hemorrhage 140 (46.1) 127 (41.9) 21 (7.2) 29 (9.4)
Eye pain 25 (8.2) 16 (5.3) 25 (8.6) 20 (6.5)
Vitreous floaters 20 (6.6) 9 (3.0) 10 (3.4) 5 (1.6)
Eye irritation 10 (3.3) 7 (2.3) 2 (0.7) 4 (1.3)
Sensation of foreign body in eyes 9 (3.0) 13 (4.3) 9 (3.1) 4 (1.3)
Injection site pain 11 (3.6) 11 (3.6) 8 (2.7) 8 (2.6)
Increased intraocular pressure 12 (3.9) 8 (2.6) 15 (5.2) 12 (3.9)
Increased lacrimation 2 (0.7) 8 (2.6) 2 (0.7) 3 (1.0)
Ocular hyperemia 8 (2.6) 2 (0.7) 17 (5.8) 5 (1.6)
Injection site hemorrhage 5 (1.6) 6 (2.0) 5 (1.7) 4 (1.3)
Ocular discomfort 7 (2.3) 1 (0.3) 0 (0.0) 0 (0.0)
Punctate keratitis 2 (0.7) 1 (0.3) 6 (2.1) 3 (1.0)
Conjunctival hyperemia 3 (1.0) 1 (0.3) 8 (2.7) 1 (0.3)
Corneal erosion NR NR 7 (2.4) 4 (1.3)
AFL = aflibercept; NR = not reported; RAN = ranibizumab; SAF = safety analysis set; TEAE = treatment-emergent adverse event. Source: VIEW 1: T44, p. 137–138; VIEW 2: T43, p. 157.

CDR CLINICAL REVIEW REPORT FOR EYLEA
47
Common Drug Review August 2015
TABLE 25: ALL OCULAR SERIOUS ADVERSE EVENTS IN THE STUDY EYE (SAFETY ANALYSIS SET)
VIEW 1 VIEW 2
RAN AFL RAN AFL
N = 304 n (%)
N = 303 n (%)
N = 291 n (%)
N = 307 n (%)
Number of patients with ≥ 1 serious TEAE
a (study eye)
10 (3.3) 3 (1.0%) 9 (3.1) 9 (2.9)
Endophthalmitis 3 (1.0%) 0 NR NR
Reduced VA 2 (0.7%) 0 1 (0.3) 5 (1.6)
Retinal hemorrhage 2 (0.7%) 2 (0.7%) 1 (0.3) 1 (0.3)
Cataract 0 0 1 (0.3) 1 (0.3)
Retinal degeneration 0 0 1 (0.3) 0 (0.0)
Retinal detachment 0 0 1 (0.3) 0 (0.0)
Retinal edema 1 (0.3%) 0 NR NR
Retinal pigment epithelial tear 0 1 (0.3%) 1 (0.3) 1 (0.3)
Retinal tear 1 (0.3%) 0 NR NR
Incorrect dose administered 1 (0.3%) 0 NR NR
Increased intraocular pressure 1 (0.3%) 0 0 (0.0) 1 (0.3)
Posterior capsule opacification NR NR 2 (0.7) 0 (0.0)
Cataract cortical NR NR 1 (0.3) 0 (0.0)
Hyphema NR NR 1 (0.3) 0 (0.0)
Macular cyst NR NR 0 (0.0) 1 (0.3)
Macular degeneration NR NR 0 (0.0) 1 (0.3)
AE = adverse event; AFL = aflibercept; NR = not reported; RAN = ranibizumab; TEAE = treatment-emergent adverse event; VA = visual acuity. a
Serious ocular AE was defined as follows: AE causing a decrease in VA of > 30 letters (compared with the most recent assessment of VA) and lasting more than one hour; AE causing a decrease in VA to the level of light perception or worse lasting > one hour post-injection; AE requiring surgical intervention to prevent permanent loss of vision; AE associated with severe intraocular inflammation; AE may require medical intervention to prevent permanent loss of sight. Source: VIEW 1: T46, p. 140; VIEW 2: T45, p. 160.

CDR CLINICAL REVIEW REPORT FOR EYLEA
48
Common Drug Review August 2015
TABLE 26: OCULAR SERIOUS ADVERSE EVENTS IN THE FELLOW EYE BY PATIENT (SAFETY ANALYSIS SET)
VIEW 1 VIEW 1 VIEW 2 VIEW 2
RAN AFL RAN AFL
N = 304 n (%)
N = 303 n (%)
N = 291 n (%)
N = 307 n (%)
Number of patients with ≥ 1 serious TEAE (fellow eye)
3 (1.0) 2 (0.7) 3 (1.0) 3 (1.0)
Reduced VA 1 (0.3) 0 0 (0.0) 1 (0.3)
Retinal hemorrhage 0 1 (0.3) 1 (0.3) 0 (0.0)
Retinal tear 0 1 (0.3) NR NR
Endophthalmitis 1 (0.3) 0 NR NR
Posterior capsule opacification 1 (0.3) 0 NR NR
Cataract NR NR 3 (1.0) 1 (0.3)
Choroidal neovascularization NR NR 1 (0.3) 1 (0.3)
Vitreous hemorrhage NR NR 1 (0.3) 0 (0.0)
Macular degeneration NR NR 0 (0.0) 1 (0.3)
Maculopathy NR NR 0 (0.0) 1 (0.3)
AFL = aflibercept; NR = not reported; RAN = ranibizumab; TEAE = treatment-emergent adverse event; VA = visual acuity. Source: VIEW 1: T47, p. 141; VIEW 2: T46, p. 162.

CDR CLINICAL REVIEW REPORT FOR EYLEA
49
Common Drug Review August 2015
TABLE 27: ALL NON-OCULAR SERIOUS ADVERSE EVENTS (SAFETY ANALYSIS SET)
VIEW 1 VIEW 2
RAN AFL RAN AFL
N = 304 n (%)
N = 303 n (%)
N = 291 n (%)
N = 307 n (%)
Number of patients with at least 1 non-ocular serious TEAE
57 (18.8) 51 (16.8) 26 (8.9) 38 (12.4)
Pneumonia 7 (2.3) 5 (1.7) 0 (0.0) 2 (0.7)
Cellulitis 2 (0.7) 0 NR NR
Gastroenteritis 1 (0.3) 2 (0.7) NR NR
Atrial fibrillation 2 (0.7) 3 (1.0) 2 (0.7) 3 (1.0)
Congestive cardiac failure 2 (0.7) 3 (1.0) NR NR
Myocardial infarction 3 (1.0) 2 (0.7) 2 (0.7) 3 (1.0)
Coronary artery disease 4 (1.3) 0 NR NR
Squamous cell carcinoma of skin 3 (1.0) 3 (1.0) NR NR
Transient ischemic attack 0 1 (0.3) 0 (0.0) 0 (0.0)
Cerebrovascular accident 0 3 (1.0) 1 (0.3) 2 (0.7)
Fall 5 (1.6) 6 (2.0) 2 (0.7) 0 (0.0)
Subdural hematoma 1 (0.3) 2 (0.7) NR NR
Gastrointestinal disorders 5 (1.6) 3 (1.0) 0 (0.0) 6 (2.0)
Chronic obstructive pulmonary disease
2 (0.7) 2 (0.7) NR NR
Hypertension 2 (0.7) 0 NR NR
Osteoarthritis 3 (1.0) 0 NR NR
Mental status changes 2 (0.7) 0 NR NR
AFL = aflibercept; NR = not reported; RAN = ranibizumab; TEAE = treatment-emergent adverse event. Source: VIEW 1: T48, p. 143–148; VIEW 2: T43, p. 157, p. 164 (for VIEW 1 and VIEW 2: ≥ 2%).
TABLE 28: ALL OCULAR INJECTION-RELATED SERIOUS ADVERSE EVENTS IN THE STUDY EYE (SAFETY ANALYSIS SET)
VIEW 1 VIEW 2
RAN AFL RAN AFL
N = 304 n (%)
N = 303 n (%)
N = 291 n (%)
N = 307 n (%)
Number of patients with ≥ 1 ocular injection-related serious TEAE (study eye)
4 (1.3) 0 1 (0.3) 1 (0.3)
Endophthalmitis 3 (1.0) 0 NR NR
Incorrect dose administered 1 (0.3) 0 NR NR
Increased intraocular pressure 1 (0.3) 0 NR NR
Retinal pigment epithelial tear NR NR 1 (0.3) 1 (0.3)
AFL = aflibercept; NR = not reported; RAN = ranibizumab; TEAE = treatment-emergent adverse event. Source: VIEW 1: T51, p. 152; VIEW 2: T14.3.2, p. 5,571.

CDR CLINICAL REVIEW REPORT FOR EYLEA
50
Common Drug Review August 2015
TABLE 29: NUMBER OF PATIENTS WITH TREATMENT-EMERGENT ADVERSE EVENTS CAUSING DISCONTINUATION
OF STUDY DRUG
VIEW 1 VIEW 2
RAN AFL RAN AFL
N = 304 n (%)
N = 303 n (%)
N = 291 n (%)
N = 307 n (%)
Number of patients with at ≥ 1 TEAE causing withdrawal
4 (1.3) 3 (1.0) 4 (1.4) 10 (3.3)
Retinal hemorrhage 1 (0.3) 1 (0.3) 0 0
Reduced VA 0 1 (0.3) 0 0
Retinal detachment 0 0 1 (0.3) 0
Malignant hepatic neoplasm 1 (0.3) 0 0 0
Malignant lung neoplasm 1 (0.3) 0 0 0
Metastatic lung cancer 0 0 0 1 (0.3)
Esophageal carcinoma 0 0 1 (0.3) 0
Catheter site hematoma 0 1 (0.3) 0 0
Endophthalmitis 1 (0.3) 0 NR NR
Cerebrovascular accident 0 0 0 2 (0.7)
Presyncope 0 0 0 1 (0.3)
Acute interstitial pneumonitis 0 0 0 1 (0.3)
Myocardial infarction 0 0 0 1 (0.3)
Angina pectoris 0 0 1 (0.3) 0
Acute pancreatitis 0 0 0 1 (0.3)
Investigations 0 0 0 1 (0.3)
Increased intraocular pressure 0 0 0 1 (0.3)
Urinary tract obstruction 0 0 0 1 (0.3)
Surgical and medical procedures 0 0 0 1 (0.3)
Hip surgery 0 0 0 1 (0.3)
AFL = aflibercept; NR = not reported; RAN = ranibizumab; TEAE = treatment-emergent adverse event; VA = visual acuity. Source: VIEW 1: T52, p. 153; VIEW 2: T48, p.167–168.
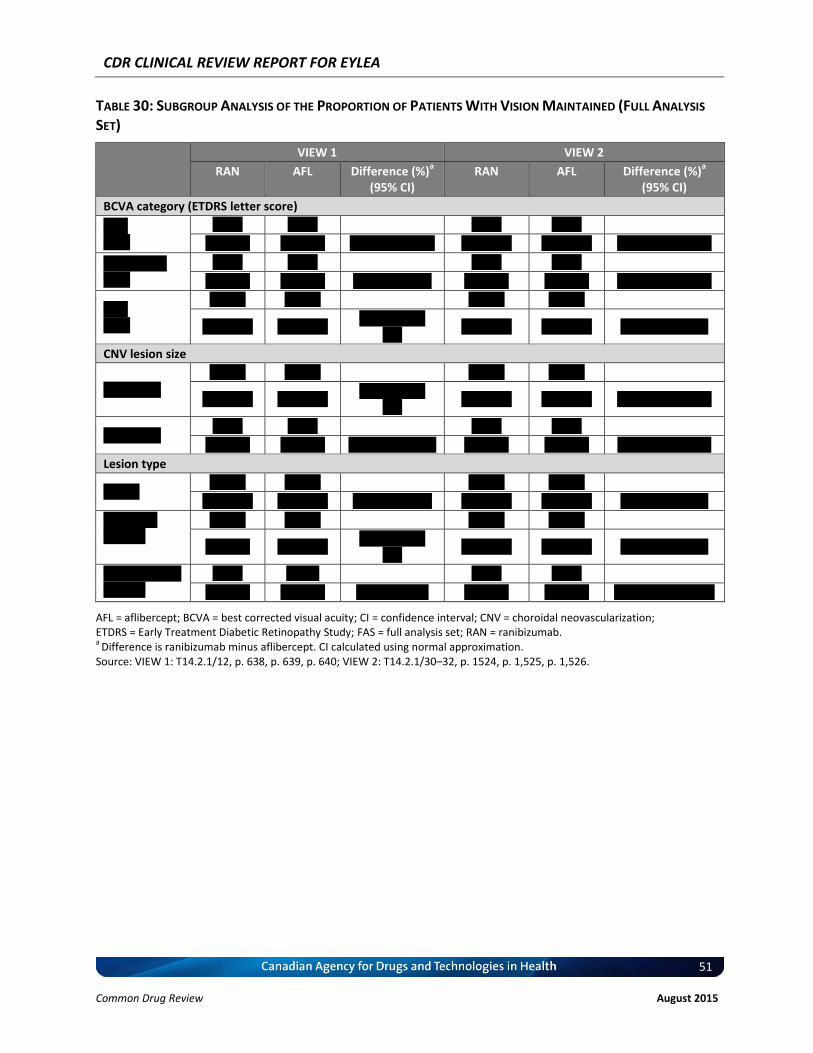
CDR CLINICAL REVIEW REPORT FOR EYLEA
51
Common Drug Review August 2015
TABLE 30: SUBGROUP ANALYSIS OF THE PROPORTION OF PATIENTS WITH VISION MAINTAINED (FULL ANALYSIS
SET)
VIEW 1 VIEW 2
RAN AFL Difference (%)a
(95% CI) RAN AFL Difference (%)
a
(95% CI)
BCVA category (ETDRS letter score)
v vv, v (%)
v v vv v v vv v v vv v v vv
vv (vv.v) vv (vv.v) –v (–vv.v vv v.v) vv (vv.vv) vv (vvv.v) –v.vv (–v.v vv v.v)
v vv vv v vv, v (%)
v v vv v v vv v v vv v v vv
vv (vv.v) vv (vv.v) v.v (–v vv vv.v) vv (vv.v) vv (vv.v) –v.vv (–v.v vv v.v)
v vv, v (%)
v v vvv v v vvv v v vvv v v vvv
vvv (vv.v) vvv (vv.v) –v.v (–v.v vv
v.v) vvv (vv.v) vvv (vv.v) v.vv (–v.v vv v.v)
CNV lesion size
v vv.vv vvv
v v vvv v v vvv v v vvv v v vvv
vvv (vv.v) vvv (vv.v) –v.v (–v.v vv
v.v) vvv (vv.v) vvv (vv.v) –v.vv (–v.v vv v.v)
v vv.vv vvv v v vv v v vv v v vv v v vv
vv (vv.v) vv (vv.v) v.v (–v.v vv vv.v) vv (vv.v) vv (vv.v) v.vv (–v.vv vv v.v)
Lesion type
vvvvvv v v vvv v v vvv v v vvv v v vvv
vvv (vv.v) vvv (vv.v) –v (–v.v vv v.v) vvv (vv.v) vvv (vv.v) v.vv (–v.v vv v.v)
vvvvvvvvv vvvvvvv
v v vvv v v vvv v v vvv v v vvv
vv (vv.v) vvv (vv.v) –v.v (–v.v vv
v.v) vvv (vv.v) vvv (vv.v) v.vv (–v.v vv v.v)
vvvvvvvvvvvvv vvvvvvv
v v vv v v vv v v vv v v vv
vv (vv.v) vv (vv.v) v.v (–v vv v.v) vv (vv.v) vv (vv.v) –v.vv (–vv.v vv v.v)
AFL = aflibercept; BCVA = best corrected visual acuity; CI = confidence interval; CNV = choroidal neovascularization; ETDRS = Early Treatment Diabetic Retinopathy Study; FAS = full analysis set; RAN = ranibizumab. a
Difference is ranibizumab minus aflibercept. CI calculated using normal approximation. Source: VIEW 1: T14.2.1/12, p. 638, p. 639, p. 640; VIEW 2: T14.2.1/30–32, p. 1524, p. 1,525, p. 1,526.

CDR CLINICAL REVIEW REPORT FOR EYLEA
52
Common Drug Review August 2015
TABLE 31: SUBGROUP ANALYSIS OF CHANGE IN ETDRS LETTER SCORE AT WEEK 52 FROM BASELINE (FULL
ANALYSIS SET)
VIEW 1 VIEW 2
RAN AFL RAN AFL
Baseline BCVA (ETDRS letter score)
< 35 N vv vv vv vv
Baseline, mean vv.v vv.v vv.v vv.v
Change from baseline at week 52, mean
vv.v vv.v vv.v vv.v
LSM difference (95% CI) (AFL – RAN)
- v.vv (–v.vv vv vv.vv)
- v.vv (–v.vv vv v.vv)
≥ 35 to < 50 N vv vv vv vv
Baseline, mean vv.v vv.v vv.v vv.v
Change from baseline at week 52, mean
vv.v v.v vv.v vv.v
LSM difference (95% CI) (AFL – RAN)
- –v.vv (–v.vv vv v.vv)
- –v.vv (–v.vv vv v.vv)
≥ 50 N vvv vvv vvv vvv
Baseline, mean vv.v vv.v vv.v vv.v
Change from baseline at week 52, mean
v.v v.v v.v v.v
LSM difference (95% CI) (AFL – RAN)
- v.vv (–v.vv vv v.vv)
- –v.vv (–v.vv vv v.vv)
Baseline CNV lesion size
≤ 10.16 mm2 N vvv vvv vvv vvv
Baseline, mean vv.v vv.v vv vv
Change from baseline at week 52, mean
v.v v.v vv.v v.v
LSM difference (95% CI) (AFL – RAN)
- v.vv (–v.vv vv v.vv) - –v.vv (–v.vv vv v.vv)
> 10.16 mm2 N vv vv vv vv
Baseline, mean vv.v vv vv.v vv.v
Change from baseline at week 52, mean
v.v v.v v.v v.v
LSM difference (95% CI) (AFL – RAN)
- –v.vv (–v.vv vv v.vv)
- –v.vv (–v.vv vv v.vv)
Baseline lesion type
Occult N vvv vvv vvv vvv
Baseline, mean vv.v vv vv.v vv.v
Change from baseline at week 52, mean
v.v v.v v.v v.v
LSM difference (95% CI) (AFL – RAN)
- –v.vv (–v.vv vv v.vv)
- v.vv (–v.vv vv v.vv)
Minimally classic
n vvv vvv vvv vvv
Baseline, mean vv.v vv.v vv.v vv.v
Change from baseline at week 52, mean
v.v v.v vv v.v
LSM difference (95% CI) (AFL – RAN)
- v.vv (–v.vv vv v.vv)
- –v.vv (–v.vv vv v.vv)
Predominantly n vv vv vv vv

CDR CLINICAL REVIEW REPORT FOR EYLEA
53
Common Drug Review August 2015
VIEW 1 VIEW 2
RAN AFL RAN AFL
classic Baseline, mean vv vv.v vv.v vv.v
Change from baseline at week 52, mean
v.v vv.v vv.v v.v
LSM difference (95% CI) (AFL – RAN)
- v.vv (–v.vv vv v.vv) - –v.vv (–v.vv vv v.vv)
AFL = aflibercept; BCVA = best corrected visual acuity; CI = confidence interval; ETDRS = Early Treatment Diabetic Retinopathy Study; FAS = full analysis set; LSM = least squares mean; RAN = ranibizumab. Source: VIEW 1: T14.2.2/14, p. 693–695; VIEW 2: T14.2.2/47, p. 1,668, 1,675, 1,683.
TABLE 32: SUBGROUP ANALYSIS OF THE PROPORTION OF PATIENTS WHO GAINED 15 OR MORE LETTERS (FULL
ANALYSIS SET)
VIEW 1 VIEW 2
RAN AFL Difference (%)a
(95% CI) RAN AFL
Difference (%)
a
(95% CI)
BCVA category (ETDRS letters)
< 35, n (%)
v v vv v v vv v v vv v v vv
vv (vv.v) vv (vv.v) v (–vv vv vv) vv (vv.v) vv (vv.v) –v.vv (vv.v vv –vv.v)
≥ 35 to < 50, n (%)
v v vv v v vv v v vv v v vv
vv (vv.v) vv (vv.v) –vv.v (–vv.v vv v) vv (vv.v) vv (vv.v) –vv.vv (–v.v vv –vv.v)
≥ 50, n (%)
v v vvv v v vvv v v vvv v v vvv
vv (vv.v) vv (vv.v) v.v (–v.v vv vv) vv (vv.v) vv(vv.v) –v.vv (v.v vv –vv.v)
CNV lesion size
≤ 10.16 mm2,
n (%) v v vvv v v vvv v v vvv vvvvv
vv (vv.v) vv (vv.v) v (–v.v vv v.v) vv (vv.v) vv (vv.v) –v.vv (v.v vv –vv.v)
> 10.16 mm2,
n (%)
(v v vv) (v v vv) (v v vv) (v v vv)
vv (vv.v%)
vv (vv.v%)
–v.v (–vv.v vv vv.v)
vv (vv.v) vv (vv.v) v.vv (vv.v vv –v.v)
Lesion type
Occult, n (%)
v v vvv v v vvv v v vvv v v vvv
vv (vv.v) vv (vv.v) v.v (–vv.v vv vv.v)
vv (vv.v) vv (vv) v.vv (vv.v vv –v.v)
Minimally classic, n (%)
v v vvv v v vvv v v vvv v v vvv
vv (vv.v) vv (vv.v) v.v (–vv.v vv vv.v)
vv (vv.v) vv (vv.v) –vv.vv (v.v vv –vv.v)
Predominantly classic, n (%)
v v vv v v vv v v vv v v vv
vv (vv.v) vv (vv.v) –v.v (–vv.v vv vv.v)
vv (vv.v) vv (vv.v) –vv.vv (v.v vv –vv.v)
AFL = aflibercept; BCVA = best corrected visual acuity; CNV = choroidal neovascularization; ETDRS = Early Treatment Diabetic Retinopathy Study; FAS = full analysis set; LSM = least squares mean; RAN = ranibizumab. a
Difference is ranibizumab minus aflibercept. CI calculated using normal approximation. Source: VIEW 1: T14.2.3/9, p. 730–732; VIEW 2: T14.2.2/66, p. 1,698–1,770.

CDR CLINICAL REVIEW REPORT FOR EYLEA
54
Common Drug Review August 2015
APPENDIX 5: VALIDITY OF OUTCOME MEASURES
Aim To summarize the validity of the following outcome measures used in the VIEW 1 and VIEW 2 studies. Vision acuity (VA) measurement: Early Treatment Diabetic Retinopathy Study (ETDRS) letters score
and Snellen charts National Eye Institute 25-Item Visual Function Questionnaire (NEI VFQ-25).
Findings TABLE 33: VALIDITY AND MINIMAL CLINICALLY IMPORTANT DIFFERENCES OF OUTCOME MEASURES
Instrument Type Validated MCID Reference Number
ETDRS letters ETDRS charts present a series of 5 letters of equal difficulty on each row, with standardized spacing between letters and rows — a total of 14 lines (70 letters).
Yes ≥ 15 letters 22
NEI VFQ-25 The NEI VFQ-25 was developed as a means to measure vision-targeted quality of life. There are 51 items in the original version (NEI VFQ-51).
35 The NEI VFQ-25,
a short version of the NEI VFQ-51, was subsequently developed.
27 The NEI VFQ-25
includes 25 items relevant to 11 vision-related constructs, in addition to a single-item general health component.
Yes 4 points (NEI VFQ-25)
27
ETDRS = Early Treatment Diabetic Retinopathy Study; MCID = minimal clinically important difference; NEI VFQ-25 = National Eye Institute 25-Item Visual Function Questionnaire.
Measuring visual acuity The Snellen eye chart is a commonly employed, well-recognized test of VA in clinical practice.36,37 The chart presents a series of letters of decreasing size, with an increasing number of letters on subsequent lines. One or two mistakes per line are allowed and the smallest line that can be read corresponds to the VA. The resultant measure of VA is expressed as a Snellen fraction, in which the numerator indicates the distance at which the chart was read, and the denominator the distance at which a person may discern letters of a particular size. A larger denominator indicates worsening vision. For example, a person with 20/100 vision can read letters at 20 feet that a person with 20/20 vision could read at 100 feet. Snellen acuity may also be expressed in metric units. As 20 feet is roughly equivalent to 6 m, 20/20 vision may be expressed as 6/6, or 20/100 as 6/30. Snellen fractions may be expressed as decimal acuity where 20/20 is expressed as 1.00 and 20/100 as 0.2. Further, the logarithm of the reciprocal Snellen fraction may be calculated to produce a linear scoring system suitable for statistical analysis; Snellen fractions of 20/20 and 20/100 would correspond to log scores of 0.0 and 0.7 respectively.
CDR CLINICAL REVIEW REPORT FOR EYLEA
55
Common Drug Review August 2015
A number of limitations of the Snellen charts, especially for clinical research, have been identified.36,37 Specifically, the use of letters with different difficulty scores (A and L are more easily discernible than B, E, and F) and an unequal number of letters on each line allows for a different percentage of errors depending on the line read and number of errors made.37 In addition, the change in letter size between chart lines is not uniform; thus, moving from line 20/25 to 20/20 represents a 20% improvement, compared with a 16% improvement when moving from line 20/30 to 20/25. Finally, differences in background luminance among charts, due to aging charts or different chart manufacturers, and the use of dusty or aging projector equipment can reduce contrast and may result in unreliable measures of VA.37 In response to the above limitations, alternative charts have been developed that are more appropriate in research.36,37 The ETDRS charts are based on a design by Bailey and Lovie, and are commonly used in clinical research.14,15,36,38,39 ETDRS charts present a series of five letters of equal difficulty on each row, with standardized spacing between letters and rows; there is a total of 14 lines (70 letters). The ETDRS letter score can be calculated when 20 or more letters are read correctly at 4.0 m, the VA letter score is equal to the total number of letters read correctly at 4.0 m plus 30. If fewer than 20 letters are read correctly at 4.0 m, the VA letter score is equal to the total number of letters read correctly at 4.0 m (the number recorded on line 1.0), plus the total number of letters read correctly at 1.0 m in the first six lines. The ETDRS letter score could therefore result in a maximum score of 100.40,41 ETDRS charts are used in a standard light box with a background illumination of approximately 150 cd/m2. Standard chart testing distance is 4 m; however, shorter distances may be used when vision is severely impaired.36,42 Letters range from 58.18 mm to 2.92 mm in height, corresponding to Snellen VA fractions of 20/200 to 20/10 respectively. Letter size increases further geometrically and equivalently in every line by a factor of 1.2589 (or 0.1 log unit), moving up the chart. Scoring for ETDRS charts is designed to produce a logarithmic score (logMAR) suitable for statistical analysis, in which individual letters score 0.02 log units. Holladay and Prager published the following formula to convert VA scores derived from a Bailey and Lovie–style chart read at 2 m into a Snellen denominator, where X is the number of correctly read letters (see below).43 Thus, reading all 70 letters on a Bailey–Lovie chart corresponds to a Snellen VA of 20/10.
Snellen Acuity = 20 x 10 [(55-X)/50] ETDRS charts may reliably identify changes in VA of two lines (10 letters) or more, but not changes of one line (five letters) or fewer.44 The reliability of ETDRS charts depends on the baseline VA. For eyes with acuity better than 20/100, a change in VA of five letters or more has a greater than 90% probability of being a real change, while for eyes worse than 20/100, a change of 10 letters or more is required for the same reliability.29 A loss or gain of three lines (15 letters) is considered a moderate degree of change and is commonly used as an outcome in clinical trials.26 The FDA recommends a mean change of ≥ 15 letters on an ETDRS chart, or a statistically significant difference in the proportion of patients with a change of ≥ 15 letters in VA, as clinically relevant outcome measures in trials of interventions for macular edema.22 Relationship of visual acuity to visual function and vision-related quality of life Measures of high-contrast visual distance acuity, using ETDRS charts, are commonly used to assess treatment outcomes in clinical studies. A loss of three lines or more (≥ 15 letters) on an ETDRS chart corresponds to a doubling of the visual angle and is considered to be moderate vision loss, while a loss of six lines or more (≥ 30 letters) corresponds to a quadrupling of the visual angle and is considered to

CDR CLINICAL REVIEW REPORT FOR EYLEA
56
Common Drug Review August 2015
be severe vision loss. However, VA is only one component contributing to overall visual function, the ability to perform everyday visual tasks (e.g., reading, recognizing faces, driving, and using the telephone). Overall visual function also depends upon variables such as contrast sensitivity, near vision, colour vision, and sensitivity to glare.45 The various components of visual function affect the performance of different vision-related tasks by varying degrees. For example, use of distance acuity to measure the success of treatments for AMD is not optimal given that distance vision is usually two ETDRS lines better than reading vision,26 and difficulty with reading is a common complaint among persons with eye disease.35 Rather, contrast sensitivity is a more important contributor to reading performance.26,46 Visual function and the resultant ability to perform everyday visual tasks have important implications for QoL. QoL is very much a person-specific measure that ultimately depends upon the value individuals place on the ability to perform specific tasks. QoL instruments that do not include domains or tasks that are of importance to individuals lack sensitivity to changes in their QoL. Further, the impact of vision loss on QoL may vary greatly dependent upon the vision status of the fellow eye. For these reasons, there are limitations in the use of QoL instruments to compare treatment effectiveness.45 National Eye Institute 25-Item Visual Function Questionnaire The NEI VFQ was developed as a means to measure vision-targeted QoL. The original 51-item questionnaire was developed based on focus groups consisting of persons with a number of common eye conditions (e.g., age-related cataracts, AMD, and diabetic retinopathy), and thus may be used to assess QoL in a broad range of eye conditions.35 The original 51-item questionnaire comprises 12 subscales related to general vision, ocular pain, near vision, distance vision, social functioning, mental health, role functioning, dependency, driving, peripheral vision, colour vision, and expectations for future vision. In addition, the questionnaire includes one general health subscale.47 A shorter version of the original instrument, the NEI VFQ-25, was subsequently developed, which retained the multidimensional nature of the original and is more practical and efficient to administer.27 With the exception of expectations for future vision, all of the constructs listed above were retained in the shortened version, with a reduced number of items within each construct. Thus, the NEI VFQ-25 includes 25 items relevant to 11 vision-related constructs, in addition to a single-item general health component. Responses for each item were converted to a 0 to 100 scale, with 0 representing the worst visual functioning and 100 the best visual functioning. Items within each construct, or subscale, are averaged to create 12 subscale scores, and averaging of the subscale scores produces the overall composite score. Different scoring approaches for the NEI VFQ-25 have been proposed.48 Rasch modelling is used to obtain measurements from categorical data. When comparing standard scoring to Rasch analysis and an algorithm to approximate Rasch scores, all methods were highly correlated.48 However, standard scoring is subject to floor and ceiling effects, whereby the ability of the least visually able is overestimated and the ability of the most visually able is underestimated.48 Determination of what constitutes a clinically meaningful change in the NEI VFQ-25 appears to be linked to its correlation with VA. A three-line (15 letters) change in VA has been used as the outcome of interest in clinical trials, and corresponding changes in the NEI VFQ-25 are suggested as clinically meaningful end points. Specifically, for the study eye, which is typically the worse-seeing eye, a 15-letter change in VA corresponds to a 4-point change in the overall NEI VFQ-25 score.13 For the better-seeing eye, the clinically relevant difference for NEI VFQ-25 scores based on a three-line change is 7 to 8 for overall score. Other studies have shown similar estimated clinically relevant differences.49 The

CDR CLINICAL REVIEW REPORT FOR EYLEA
57
Common Drug Review August 2015
instrument showed weaker correlation or was not responsive to changes in the VA of the worse-seeing eye.50,51 This may have implications when evaluating patients with unilateral disease. Both versions of the NEI VFQ were reported to be valid and reliable measures of health-related QoL among patients with a wide range of eye conditions,27,47,51 and all but two subscale scores (general health and ocular pain) have been shown to be responsive to changes in VA in the better-seeing eye.50,51 However, more recent studies have indicated that the NEI VFQ-25 measures visual functioning, not QoL.52 Assessments of the psychometric validity of the NEI VFQ-25 using Rasch scoring and principal component analysis have identified issues with multidimensionality (measurement of more than one construct) and poor performance of the subscales.52,53 The NEI VFQ-25 subscales were found to have too few items and were unable to discriminate among the population under measurement, and thus were not valid.52,53 Re-engineering the NEI VFQ-25 into two constructs (visual functioning and socio-emotional factors) and removing misfit items (e.g., pain around eyes, general health, and driving in difficult conditions) improved the psychometric validity of the scale in individuals with low vision.52,53 Considering this recent evidence of multidimensionality, the validity of the single composite score of the NEI VFQ-25 may be questioned. Summary The validity of VA, NEI VFQ-25, and the relationship between VA, visual function, and QoL were reviewed. VA, measured using the ETDRS charts, is a suitable outcome measure for statistical analysis in clinical trials. Visual function depends on several components, including VA, contrast sensitivity, near vision, colour vision, and sensitivity to glare.45 The various components of visual function affect the performance of different vision-related tasks by varying degrees, and have important implications for QoL. The NEI VFQ-25 is an outcome measure with 11 vision-related constructs and one single-item general health component that is subject to floor and ceiling effects.48 In more recent studies, the NEI VFQ-25 has been shown to better measure visual functioning as opposed to QoL,52 with issues arising regarding multidimensionality and poor subscale performance.52,53 Hence, due to these issues, the NEI VFQ-25 single composite score may not be as valid in measuring health-related QoL.

CDR CLINICAL REVIEW REPORT FOR EYLEA
58
Common Drug Review August 2015
APPENDIX 6: SUMMARY OF EXTENSION PHASE (96 WEEKS)
Objective To summarize the 96-week results of the VIEW 1 and VIEW 2 studies.30 Results from baseline to week 52 were examined in the main CADTH Common Drug Review (CDR) clinical report. The following summary is based on the publicly available trial publications.
Findings Study design VIEW 1 and VIEW 2 were randomized, double-masked, active-controlled, parallel group, multi-centre phase 3 clinical trials of 96 weeks’ duration. From baseline to week 52, patients received study medications every four to eight weeks, following three initial monthly doses. From weeks 52 to 96, patients received the originally assigned study drug following an “as-needed” regimen, determined using predefined retreatment criteria, and mandatory treatment with at least one dose every 12 weeks.30 Criteria for retreatment were as follows: new or persistent fluid on optical coherence tomography (OCT) an increase in central retinal thickness (CRT) of 100 μm or more compared with the lowest previous
value loss of five or more Early Treatment Diabetic Retinopathy Study (ETDRS) letters from the best
previous score in conjunction with recurrent fluid on OCT new-onset classic neovascularization new or persistent leak on fluorescein angiography new macular hemorrhage, or a time lapse of 12 weeks since the previous injection. The primary outcome measure was the proportion of eyes that maintained best corrected visual acuity (BCVA) at week 96. Secondary outcomes included mean change in BCVA from baseline, the proportion of patients gaining ≥ 15 letters, mean change from baseline choroidal neovascularization size, and the proportion of patients without retinal fluid at week 96. Data from patients in the VIEW 1 and VIEW 2 studies were pooled and presented as the 96-week results. Results At 96 weeks, visual and anatomical improvements were similar between the 2 mg aflibercept every eight weeks (2q8) group and the ranibizumab group (Table 35 and Table 36); however, the aflibercept group received an average of five fewer injections over the 96 weeks of the study (Table 38). The most frequently reported serious ocular adverse events (SAEs) at 96 weeks were reduced visual acuity (VA), retinal hemorrhage, and endophthalmitis. The most frequently reported non-ocular AEs were pneumonia, fall, atrial fibrillation, and myocardial infarction (Table 37). The occurrence of ocular and non-ocular AEs was similar between groups. No new or unexpected AEs were reported between week 52 and week 96.

CDR CLINICAL REVIEW REPORT FOR EYLEA
59
Common Drug Review August 2015
TABLE 34: SUMMARY OF RESULTS AT WEEK 96
RAN (N = 609)
n (%) AFL (N = 616)
n (%)
Patients completed week 52 560 (92.0) 560 (90.9)
Patients completed week 96 519 (85.2) 513 (83.3)
Patients discontinued before week 52 48 (8.0) 56 (9.1)
Patients discontinued before week 96 90 (14.8) 103 (16.7)
Consent withdrawal 32 (5.3) 35 (16.7)
Protocol deviation 5 (0.8) 1 (0.2)
Adverse event 16 (2.6) 25 (4.1)
Death 11 (1.8) 15 (2.4)
Lost to follow-up 14 (2.3) 15 (2.4)
Lack of efficacy 1 (0.2) 3 (0.5)
Other 11 (1.8) 9 (1.5)
AFL = aflibercept; RAN = ranibizumab.
TABLE 35: VISUAL OUTCOMES AT WEEK 96 — FULL ANALYSIS SET
RAN (N = 595) AFL (N = 607)
Mean change from baseline in BCVA (ETDRS letters)
7.9 7.6
Maintained visual acuity, n (%) 91.6% 92.4%
Gained 15 letters or more, n (%) 31.6% 33.4%
AFL = aflibercept; BCVA = best corrected visual acuity; ETDRS = Early Treatment Diabetic Retinopathy Study; RAN = ranibizumab.
TABLE 36: ANATOMIC OUTCOMES AT WEEK 96 — FULL ANALYSIS SET
Baseline to Week 52 Baseline to Week 96
RAN (N = 537)
AFL (N = 539)
RAN (N = 508)
AFL (N = 505)
Mean change from baseline CRT (μm) –123 –139 –113 –133
Patients without retinal fluid on time-domain OCT
62.0% 67.7% 45.5% 50.1%
AFL = aflibercept; CRT = central retinal thickness; OCT = optical coherence tomography; RAN = ranibizumab.

CDR CLINICAL REVIEW REPORT FOR EYLEA
60
Common Drug Review August 2015
TABLE 37: MOST FREQUENTLY REPORTED SERIOUS ADVERSE EVENTS — SAFETY ANALYSIS SET
Baseline to Week 52 Baseline to Week 96
RAN (N = 595)
N (%)
AFL (N = 610)
N (%)
RAN (N = 595)
N (%)
AFL (N = 610)
N (%)
Total patients with ≥ 1 ocular SAE 19 (3.2) 12 (2.0) 26 (4.4) 24 (3.9)
Macular hole 0 0 0 0
Posterior capsule opacification 2 (0.3) 0 2 (0.3) 0
Retinal detachment 1 (0.2) 0 3 (0.5) 0
Retinal hemorrhage 3 (0.5) 3 (0.5) 4 (0.7) 5 (0.8)
Retinal pigment epithelial tear 1 (0.2) 2 (0.3) 1 (0.2) 3 (0.5)
Reduced VA 3 (0.5) 5 (0.8) 5 (0.8) 7 (1.1)
Endophthalmitis 3 (0.5) 0 5 (0.8) 0
Cataract 1 (0.2) 1 (0.2) 1 (0.2) 4 (0.7)
Macular degeneration 0 1 (0.2) 0 2 (0.3)
Increased ocular pressure 1 (0.2) 1 (0.2) 1 (0.2) 2 (0.3)
Total patients with ≥ 1 non-ocular SAE
83 (13.9) 89 (14.6) 146 (24.5) 154 (25.2)
Atrial fibrillation 4 (0.7) 6 (1.0) 5 (0.8) 10 (1.6)
Myocardial infarction 5 (0.8) 6 (1.0) 10 (1.7) 6 (1.0)
Pneumonia 7 (1.2) 7 (1.1) 15 (2.5) 14 (2.3)
Fall 7 (1.2) 6 (1.0) 10 (1.7) 19 (3.1)
Congestive cardiac failure 2 (0.3) 3 (0.5) 5 (0.8) 9 (1.5)
Coronary artery disease 4 (0.7) 0 5 (0.8) 1 (0.2)
Transient ischemic attack 0 1 (0.2) 1 (0.2) 5 (0.8)
Cerebrovascular accident 1 (0.2) 5 (0.8) 4 (0.7) 7 (1.1)
Chronic obstructive pulmonary disease
2 (0.3) 3 (0.5) 3 (0.5) 7 (1.1)
Osteoarthritis 3 (0.5) 0 4 (0.7) 2 (0.3)
AFL = aflibercept; RAN = ranibizumab; SAE = serious adverse event; VA = visual acuity.
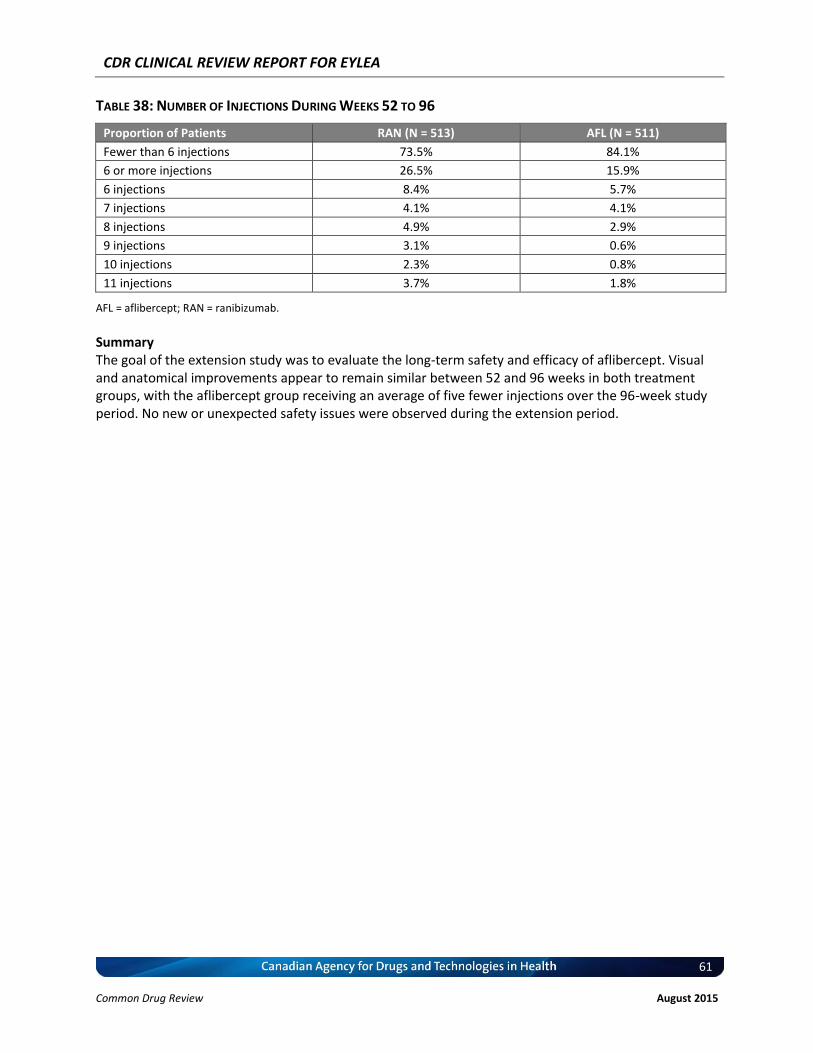
CDR CLINICAL REVIEW REPORT FOR EYLEA
61
Common Drug Review August 2015
TABLE 38: NUMBER OF INJECTIONS DURING WEEKS 52 TO 96
Proportion of Patients RAN (N = 513) AFL (N = 511)
Fewer than 6 injections 73.5% 84.1%
6 or more injections 26.5% 15.9%
6 injections 8.4% 5.7%
7 injections 4.1% 4.1%
8 injections 4.9% 2.9%
9 injections 3.1% 0.6%
10 injections 2.3% 0.8%
11 injections 3.7% 1.8%
AFL = aflibercept; RAN = ranibizumab.
Summary The goal of the extension study was to evaluate the long-term safety and efficacy of aflibercept. Visual and anatomical improvements appear to remain similar between 52 and 96 weeks in both treatment groups, with the aflibercept group receiving an average of five fewer injections over the 96-week study period. No new or unexpected safety issues were observed during the extension period.

CDR CLINICAL REVIEW REPORT FOR EYLEA
62
Common Drug Review August 2015
REFERENCES
1. Klein R, Klein BE, Tomany SC, Moss SE. Ten-year incidence of age-related maculopathy and smoking and drinking: the Beaver Dam Eye Study. Am J Epidemiol [Internet]. 2002 Oct 1 [cited 2014 Jun 30];156(7):589-98. Available from: http://aje.oxfordjournals.org/content/156/7/589.full.pdf+html
2. Foundations for a Canadian vision health strategy: towards preventing avoidable blindness and promoting vision health [Internet]. Toronto: National Coalition for Vision Health; 2007. [cited 2014 Jun 30]. Available from: http://www.visionhealth.ca/projects/documents/Foundations-For-A-Canadian-Vision-Health-Strategy.pdf
3. Data & statistics [Internet]. Toronto: National Coalition for Vision Health; 2007. [cited 2014 Jun 20]. Available from: http://www.visionhealth.ca/data.htm
4. Ferris FL, Fine SL, Hyman L. Age-related macular degeneration and blindness due to neovascular maculopathy. Arch Ophthalmol. 1984 Nov;102(11):1640-2.
5. Sharma S. Update in retina: photodynamic therapy for the treatment of subfoveal choroidal neovascularization secondary to age-related macular degeneration. Can J Ophthalmol. 2001 Feb;36(1):7-10.
6. Basic science and inherited retinal disease. In: Ryan SJ, editor. Retina. St. Louis (MO): Mosby; 2004. p. 61-2.
7. The Royal College of Ophthalmologists guidelines: the management of age related macular disease [Internet]. London: The Royal College of Ophthalmologists; 2013 Sep. [cited 2014 May 15]. Available from: http://www.rcophth.ac.uk/core/core_picker/download.asp?id=1851&filetitle=Age%2DRelated+Macular+Degeneration%3A+Guidelines+for+Management+2013
8. Cruess AF, Berger A, Colleaux K, Greve M, Harvey P, Kertes PJ, et al. Canadian expert consensus: optimal treatment of neovascular age-related macular degeneration. Can J Ophthalmol. 2012 Jun;47(3):227-35.
9. PrEylea® aflibercept single use vials for the treatment of a single eye 40 mg/mL solution for intravitreal injection [product monograph]. Toronto: Bayer Inc; 2013 Nov 8.
10. Clinical Study Report: VGFT-OD-0605 (Year 1) : A randomized, double masked, active controlled phase 3 study of the efficacy, safety, and tolerability of repeated doses of intravitreal VEGF Trap in subjects with neovascular age-related macular degeneration VEGF Trap-Eye: investigation of efficacy and safety in wet AMD (VIEW 1) [CONFIDENTIAL internal manufacturer's report]. Tarrytown (NY): Regeneron Pharmaceuticals, Inc.; 2011 Jan 25.
11. Clinical Study Report: A36355 (Year 1): A randomized, double masked, active controlled, phase 3 study of the efficacy, safety, and tolerability of repeated doses of intravitreal VEGF Trap-Eye in subjects with neovascular age-related macular degeneration (AMD) (VIEW 2) [CONFIDENTIAL internal manufacturer's report]. Leverkusen (DE): Bayer HealthCare AG; 2012 Nov 13.
12. Heier JS, Brown DM, Chong V, Korobelnik JF, Kaiser PK, Nguyen QD, et al. Intravitreal aflibercept (VEGF trap-eye) in wet age-related macular degeneration. Ophthalmology. 2012 Dec;119(12):2537-48. Erratum in: Ophthalmology. 2013 Jan;120(1):209-10.
13. Suner IJ, Kokame GT, Yu E, Ward J, Dolan C, Bressler NM. Responsiveness of NEI VFQ-25 to changes in visual acuity in neovascular AMD: validation studies from two phase 3 clinical trials. Invest Ophthalmol Vis Sci [Internet]. 2009 Aug [cited 2014 Jun 16];50(8):3629-35. Available from: http://www.iovs.org/content/50/8/3629.full.pdf+html

CDR CLINICAL REVIEW REPORT FOR EYLEA
63
Common Drug Review August 2015
14. Brown DM, Kaiser PK, Michels M, Soubrane G, Heier JS, Kim RY, et al. Ranibizumab versus verteporfin for neovascular age-related macular degeneration. N Engl J Med. 2006 Oct 5;355(14):1432-44.
15. Rosenfeld PJ, Brown DM, Heier JS, Boyer DS, Kaiser PK, Chung CY, et al. Ranibizumab for neovascular age-related macular degeneration. N Engl J Med. 2006 Oct 5;355(14):1419-31.
16. Pizzarello LD. The dimensions of the problem of eye disease among the elderly. Ophthalmology. 1987 Sep;94(9):1191-5.
17. Leibowitz HM, Krueger DE, Maunder LR, Milton RC, Kini MM, Kahn HA, et al. The Framingham Eye Study monograph: An ophthalmological and epidemiological study of cataract, glaucoma, diabetic retinopathy, macular degeneration, and visual acuity in a general population of 2631 adults, 1973-1975. Surv Ophthalmol. 1980 May;24(Suppl):335-610.
18. Sharma S, Brown GC, Brown MM, Hollands H, Shah GK. The cost-effectiveness of photodynamic therapy for fellow eyes with subfoveal choroidal neovascularization secondary to age-related macular degeneration. Ophthalmology. 2001 Nov;108(11):2051-9.
19. Williams RA, Brody BL, Thomas RG, Kaplan RM, Brown SI. The psychosocial impact of macular degeneration. Arch Ophthalmol. 1998 Apr;116(4):514-20.
20. Lucentis (ranibizumab injection) single use vials: 10 mg/mL solution for injection [product monograph]. Mississauga (ON): Novartis Pharmaceuticals Canada Inc.; 2007 Jun 26.
21. CDR submission: Eylea® (aflibercept, solution for intravitreal injection) 2 mg. Company: Bayer Inc. [CONFIDENTIAL manufacturer's submission]. Toronto: Bayer Inc; 2013 Nov 15.
22. Center for Drug Evaluation and Research, U.S. Food and Drug Administration. Statistical review(s) [Internet]. In: Eylea (Aflibercept) Injection. Company: Regeneron Pharmaceuticals, Inc. Application No.: 125387s0000. Approval Date: 11/18/2011. Rockville (MD): The Center; 2011 [cited 2014 May 7]. (FDA drug approval package). Available from: http://www.accessdata.fda.gov/drugsatfda_docs/nda/2011/125387s0000TOC.cfm.
23. Center for Drug Evaluation and Research, U.S. Food and Drug Administration. Medical review(s) [Internet]. In: Eylea (Aflibercept) Injection. Company: Regeneron Pharmaceuticals, Inc. Application No.: 125387s0000. Approval Date: 11/18/2011. Rockville (MD): The Center; 2011 [cited 2014 May 7]. (FDA drug approval package). Available from: http://www.accessdata.fda.gov/drugsatfda_docs/nda/2011/125387s0000TOC.cfm.
24. Health Canada reviewer's report: Eylea (aflibercept) [CONFIDENTIAL internal report]. Ottawa: Therapeutics Products Directorate, Health Canada; 2013.
25. Clinical Study Report: VGFT-OD-0605 (Year 2): A randomized, double masked, active controlled phase 3 study of the efficacy, safety, and tolerability of repeated doses of intravitreal VEGF Trap in subjects with neovascular age-related macular degeneration (VIEW 1) [CONFIDENTIAL internal manufacturer's report]. Regeneron Pharmaceuticals, Inc: Tarrytown (NY); 2012 Sep 25.
26. Joussen AM, Lehmacher W, Hilgers RD, Kirchhof B. Is significant relevant? Validity and patient benefit of randomized controlled clinical trials on age-related macular degeneration. Surv Ophthalmol. 2007;52(3):266-78.
27. Mangione CM, Lee PP, Gutierrez PR, Spritzer K, Berry S, Hays RD, et al. Development of the 25-item National Eye Institute Visual Function Questionnaire. Arch Ophthalmol [Internet]. 2001 Jul [cited 2014 Jun 26];119(7):1050-8. Available from: http://archopht.jamanetwork.com/article.aspx?articleid=267134
28. Brooks R. EuroQol: the current state of play. Health Policy. 1996 Jul;37(1):53-72.
CDR CLINICAL REVIEW REPORT FOR EYLEA
64
Common Drug Review August 2015
29. Beck RW, Maguire MG, Bressler NM, Glassman AR, Lindblad AS, Ferris FL. Visual acuity as an outcome measure in clinical trials of retinal diseases. Ophthalmology. 2007 Oct;114(10):1804-9.
30. Schmidt-Erfurth U, Kaiser PK, Korobelnik JF, Brown DM, Chong V, Nguyen QD, et al. Intravitreal aflibercept injection for neovascular age-related macular degeneration: ninety-six-week results of the VIEW studies. Ophthalmology. 2014 Jan;121(1):193-201.
31. Bakall B, Folk JC, Boldt HC, Sohn EH, Stone EM, Russell SR, et al. Aflibercept therapy for exudative age-related macular degeneration resistant to bevacizumab and ranibizumab. Am J Ophthalmol. 2013 Jul;156(1):15-22.
32. Weintraub A. France aims to save big bucks by subbing unapproved Avastin for eye drug Lucentis [Internet]. Washington (DC): FierceMarkets; 2014 Jul 2. [cited 2014 Jul 8]. Available from: http://www.fiercepharma.com/story/france-aims-save-big-bucks-subbing-unapproved-avastin-eye-drug-lucentis/2014-07-02?utm_medium=nl&utm_source=internal
33. Clinical Study Report: A62515 (Year 2): A randomized, double masked, active controlled, phase 3 study of the efficacy, safety, and tolerability of repeated doses of intravitreal VEGF Trap-Eye in subjects with neovascular age-related macular degeneration (AMD) (VIEW 2) [CONFIDENTIAL internal manufacturer's report]. Berlin (DE): Bayer HealthCare AG; 2012 Dec 18.
34. Heier JS, Brown DM, Chong V, Korobelnik JF, Kaiser PK, Nguyen QD, et al. Erratum: Intravitreal aflibercept (VEGF trap-eye) in wet age-related macular degeneration. Ophthalmology. 2013 Jan;120(1):209-10.
35. Mangione CM, Berry S, Spritzer K, Janz NK, Klein R, Owsley C, et al. Identifying the content area for the 51-item National Eye Institute Visual Function Questionnaire: results from focus groups with visually impaired persons. Arch Ophthalmol. 1998 Feb;116(2):227-33.
36. Kniestedt C, Stamper RL. Visual acuity and its measurement. Ophthalmol Clin North Am. 2003 Jun;16(2):155-70.
37. Ricci F, Cedrone C, Cerulli L. Standardized measurement of visual acuity. Ophthalmic Epidemiol. 1998 Mar;5(1):41-53.
38. Tewari HK, Kori V, Sony P, Venkatesh P, Garg S. Snellen chart may be preferable over early treatment diabetic retinopathy study charts for rapid visual acuity assessment. Indian J Ophthalmol. 2006 Sep;54(3):214.
39. Dong LM, Childs AL, Mangione CM, Bass EB, Bressler NM, Hawkins BS, et al. Health- and vision-related quality of life among patients with choroidal neovascularization secondary to age-related macular degeneration at enrollment in randomized trials of submacular surgery: SST report no. 4. Am J Ophthalmol. 2004 Jul;138(1):91-108.
40. Beck RW, Moke PS, Turpin AH, Ferris FL, III, SanGiovanni JP, Johnson CA, et al. A computerized method of visual acuity testing: adaptation of the early treatment of diabetic retinopathy study testing protocol. Am J Ophthalmol. 2003 Feb;135(2):194-205.
41. CATT: comparison of age-related macular degeneration treatment trials. ETDRS chart worksheet [Internet]. Philadelphia (PA): University of Pennsylvania; 2014. [cited 2014 Jul 3]. Available from: https://rt4.cceb.med.upenn.edu/crcu_html/catt/ETDRS%20Chart%20Worksheet.pdf
42. Recommended standard procedures for the clinical measurement and specification of visual acuity. Report of working group 39. Committee on vision. Assembly of Behavioral and Social Sciences, National Research Council, National Academy of Sciences, Washington, D.C. Adv Ophthalmol. 1980;41:103-48.

CDR CLINICAL REVIEW REPORT FOR EYLEA
65
Common Drug Review August 2015
43. Holladay JT, Prager TC. Snellen equivalent for the Bailey-Lovie acuity chart [letter]. Arch Ophthalmol. 1989 Jul;107(7):955.
44. Rosser DA, Cousens SN, Murdoch IE, Fitzke FW, Laidlaw DA. How sensitive to clinical change are ETDRS logMAR visual acuity measurements? Invest Ophthalmol Vis Sci. 2003 Aug;44(8):3278-81.
45. Slakter JS, Stur M. Quality of life in patients with age-related macular degeneration: impact of the condition and benefits of treatment. Surv Ophthalmol. 2005 May;50(3):263-73.
46. Hazel CA, Petre KL, Armstrong RA, Benson MT, Frost NA. Visual function and subjective quality of life compared in subjects with acquired macular disease. Invest Ophthalmol Vis Sci [Internet]. 2000 May [cited 2014 Jun 30];41(6):1309-15. Available from: http://www.iovs.org/cgi/reprint/41/6/1309
47. Mangione CM, Lee PP, Pitts J, Gutierrez P, Berry S, Hays RD, et al. Psychometric properties of the National Eye Institute Visual Function Questionnaire (NEI-VFQ). Arch Ophthalmol. 1998 Nov;116(11):1496-504.
48. Dougherty BE, Bullimore MA. Comparison of scoring approaches for the NEI VFQ-25 in low vision. Optom Vis Sci. 2010 Aug;87(8):543-8.
49. Miskala PH, Hawkins BS, Mangione CM, Bass EB, Bressler NM, Dong LM, et al. Responsiveness of the National Eye Institute Visual Function Questionnaire to changes in visual acuity: findings in patients with subfoveal choroidal neovascularization--SST report no. 1. Arch Ophthalmol. 2003 Apr;121(4):531-9.
50. Revicki DA, Rentz AM, Harnam N, Thomas VS, Lanzetta P. Reliability and validity of the National Eye Institute Visual Function Questionnaire-25 in patients with age-related macular degeneration. Invest Ophthalmol Vis Sci [Internet]. 2010 Feb [cited 2014 Jun 26];51(2):712-7. Available from: http://www.iovs.org/content/51/2/712.full.pdf+html
51. Orr P, Rentz AM, Margolis MK, Revicki DA, Dolan CM, Colman S, et al. Validation of the National Eye Institute Visual Function Questionnaire-25 (NEI VFQ-25) in age-related macular degeneration. Invest Ophthalmol Vis Sci [Internet]. 2011 May [cited 2014 Jun 26];52(6):3354-9. Available from: http://www.iovs.org/content/52/6/3354.full.pdf+html
52. Pesudovs K, Gothwal VK, Wright T, Lamoureux EL. Remediating serious flaws in the National Eye Institute Visual Function Questionnaire. J Cataract Refract Surg. 2010 May;36(5):718-32.
53. Marella M, Pesudovs K, Keeffe JE, O'Connor PM, Rees G, Lamoureux EL. The psychometric validity of the NEI VFQ-25 for use in a low-vision population. Invest Ophthalmol Vis Sci. 2010 Jun;51(6):2878-84.