common financial ratios and value investing in thailand 2_3_6.pdf · common financial ratios and...
TRANSCRIPT

Journal of Finance and Investment Analysis, vol. 2, no.3, 2013, 69-85
ISSN: 2241-0998 (print version), 2241-0996(online) Scienpress Ltd, 2013
Common Financial Ratios and Value Investing in
Thailand
Paiboon Sareewiwatthana1
Abstract
This study tests the stock selection concept of Value Investing in the Securities Exchange
of Thailand during 2002-2012. Five financial ratios commonly used by value investors to
identify stocks which provide the margin of safety are tested. The results show that
portfolios with selected stocks yield higher returns than the market average. The best
performance is from using price to earnings ratio. Risk, however, increases in consistent
with the higher returns. It is also found that decreasing the number of stocks tends to
yield better returns. In conclusion, the results of this study support the validity of value
investing in the Thai stock market.
JEL classification Numbers: G11, G32.
Keywords: Value investing, Financial Ratios, the Stock Exchange of Thailand.
1 Introduction
Lately, value investing (VI) concept has been widely accepted. Investors around the world
search for stocks together with a high level of profitability and for the discount called
margin of safety when the stock market prices fall below the intrinsic values. However,
many practitioners and scholars remain skeptic about its actual, systematic practicality.
Although there have been research studies supporting the validity of VI, the concept has
not been much researched in Thailand. This study tries to fill the research gap by testing.
Simple methods to choose stocks using financial ratios are tested to verify the validity of
VI. The information is publicized and can be easily accessed.
This report proceeds as follows. The first section introduces the review and summary of
related literatures. Then the research methodology and data used are discussed. Empirical
results found in the study are then analyzed and presented. Lastly, conclusions,
1School of Business, National Institute of Development Administration, Bangkok, Thailand.
Article Info: Received : June 2, 2013. Revised : July 21, 2013.
Published online : August 15, 2013
70 Paiboon Sareewiwatthana
implications, and limitations together with recommendations for further study are
presented.
2 Literature Review
Graham[1] introduced value investing and contended that stocks which passed a set of
criteria were worth the investment as they would produce above average returns. Basu[2]
studied on the subject and discovered that stocks with low Price/Earnings ratio (PE) had
tendency to produce more returns than stocks with higher PE. Oppenheimer[3] conducted
a research study on portfolios created according to Graham’s criteria and showed that
their returns satisfactorily exceeded the market. Chan, Hamao and Lakonishok[4]
conducted a study and concluded that investment using Book to Market, Earnings to
Price, and Cash Flow to Price ratios had potential to produce above average returns in
Japan.
Fama and French[5] employed various value investing approaches in their examination of
stock returns. They discovered that, in almost every country, value stocks produced more
average returns than growth stocks which were categorized on the basis of similar risk
levels. Piotroski[6] conducted a research study on selecting value stocks based on their
past financial statements. He found that stocks which fulfilled the nine criteria apparently
produced above average returns. Greenblatt[7] in his book “The Little Book That Beats
the Market” reported that a simple stock selection rules based on return on capital and the
EBIT to Enterprise Value (BV/MV) produced above average returns.
In Thailand, limited research has been conducted on value investment strategies until
recently. Supattarakul and Jongjaroenkamol[8] found that during 1996-2008 the level of
future shareholder returns was related to PB ratio, and the rate of growth of future net
profit was related to PE ratio. Sareewiwatthana[9] studied the stock selection
methodology in the Stock Exchange of Thailand during 1996-2010 based on PE, PB,
ROE, and found that the strategy could generate abnormal returns. Maneesilasan[10]
conducted a study on PEG ratio and showed that this strategy could generate higher
returns than the market. Sareewiwatthana[11] showed that PEG ratio was effective in
generating higher returns than the average return throughout the analysis over 1999-
2010.Panyagometh[12] compared equally weighted value stock portfolios with Mean-
Variance portfolio optimization weighted value stock portfolios and market capitalization
weighted value stock portfolios in the Thai stock market and concluded that the portfolio
management theory could be applied together with value investing to yield higher returns.
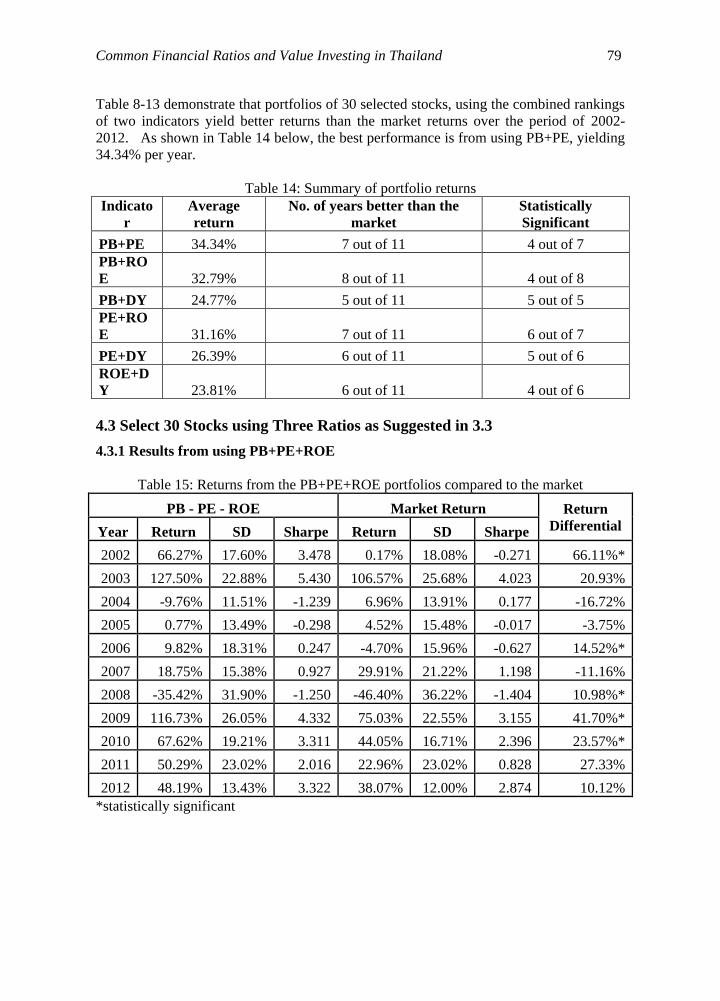
3 Data and Methodology
According to the value investing principle, stocks of which the intrinsic value provides
the margins of safety are worth the investment. The following indicators are the basic
financial ratios believed to signal stocks’ margin of safety. They are Price to Book Value
(PB), Price to Earnings per Share ratio (PE), Dividend Yield (DY), Return on Equity
(ROE), and Return on Assets (ROA)1. For stock investors, these five indicators are easily
accessed or computed from the disclosed annual financial statements.

Common Financial Ratios and Value Investing in Thailand 71
3.1
This study used the above five indicators separately to select stocks for investment and
evaluates which strategy could produce the higher average returns than the market. SET
TRI index was used as a proxy for market returns. The data were from the Securities
Exchange of Thailand over the year 2002 to 2012. The five indicators were calculated
from the annual financial statements disclosed by the end of February of the following
year. Annual returns will be evaluated together with standard deviations. Sharpe ratios2
will be evaluated to compared the performance.
3.1.1
Testing whether PE, PB, DY, ROE, and ROA can be used to select stocks for the winning
portfolios.
3.1.1.1
Select 30 stocks with the best indicator: for PE and PB, the lower the better and for DY,
ROE, and ROA, the higher the better.
3.1.1.2
Form five portfolios each with 30 selected stocks. Each year from 2002-2013, invest
evenly in each stock at the beginning of March and liquidate the holding at the end of
February in the following year. Test if there is any significant difference between the
portfolio returns and the market return and identify the best indicators which can select
the stocks for the highest returns.
3.1.1.3
Results from using ROE and ROA, both indicating the firm’s profitability, are compared.
Compare the returns from using ROE to ROA. The one with better screening power will
be used in the later hypothesis testing.
3.2
Testing whether combining two indicators can be used to select stocks for the winning
portfolios. This research applied Greenblatt’s modification method as follows:
3.2.1
Rank stocks according to:
Price to Book Value (PB) - from low to high.
Price/Earnings per Share ratio (PE) - from low to high.
Dividend Yield (DY) - from high to low.
Return on Equity (ROE) - from high to low.
Return on Assets (ROA) - from high to low.
Then assign scores to the rankings.
3.2.2
Pair two indicators together to perform the six separated tests:
PB+PE, PB+ROE (or ROA), PB+DY, PE+ROE (or ROA), PE+DY, and ROE (or
ROA)+DY.

72 Paiboon Sareewiwatthana
3.2.3
For each test, combine stock’s scores from the rankings. Select 30 stocks with the lowest
scores for investment.
At the beginning of each year, create a portfolio with 30 Stocks. Invest evenly in each
stock. Calculate returns at the year-end. Renew the process, creating a new portfolio with
30 stocks in the beginning of the next year.
Repeat the method above using different pairs of screening indicators.
3.3
Testing whether the combination of three indicators can be used to select stocks for the
winning portfolios.
3.3.1
Repeat the process as 3.2.1-3.2.3 but using three indicators. The tested portfolios will
consist of 30 stocks screened by PB+PE+ROE (OR ROA), PB+PE+DY, PB+ROE+DY,
and PE+ROE+DY.
3.4
Testing whether combining four indicators can be used to select stocks for the winning
portfolios.
3.4.1
Repeat the process as 3.2.1-3.2.3 but using four indicators. The tested portfolios will
consist of 30 stocks screened by PB+PE+ROE (OR ROA)+DY.
3.5
Test the effect of different number of selected stocks. Repeat the process in 3.2.1-3.2.3 by
selecting only 10 stocks and 20 stocks accordingly. Compare the results to those from 30
stocks.

Common Financial Ratios and Value Investing in Thailand 73
4 Empirical Results
4.1 Select 30 Stocks using a Single Ratio as Suggested in 3.1
4.1.1 Results from using low PB
Table 1: Returns from the low PB portfolios compared to the market
PB Market Return Return
Differential Year Return SD Sharpe Return SD Sharpe
2002 59.73% 17.08% 3.199 0.17% 18.08% -0.271 59.56%*
2003 176.92% 31.45% 5.521 106.57% 25.68% 4.023 70.35%*
2004 5.47% 16.46% 0.059 6.96% 13.91% 0.177 -1.49%
2005 7.94% 14.06% 0.224 4.52% 15.48% -0.017 3.42%
2006 -10.93% 20.83% -0.779 -4.70% 15.96% -0.627 -6.23%
2007 -0.56% 17.27% -0.292 29.91% 21.22% 1.198 -30.47%
2008 -27.80% 32.22% -1.002 -46.40% 36.22% -1.404 18.60%*
2009 128.28% 32.29% 3.852 75.03% 22.55% 3.155 53.25%*
2010 49.11% 28.60% 1.577 44.05% 16.71% 2.396 5.06%
2011 20.67% 21.76% 0.771 22.96% 23.02% 0.828 -2.28%
2012 81.07% 14.32% 5.413 38.07% 12.00% 2.874 43.01%*
*statistically significant
4.1.2 Results from using low PE
Table 2: Returns from the low PE portfolios compared to the market
PE Market Return Return
Differential Year Return SD Sharpe Return SD Sharpe
2002 71.45% 22.62% 2.934 0.17% 18.08% -0.271 71.28%*
2003 202.95% 29.10% 6.862 106.57% 25.68% 4.023 96.39%*
2004 -8.99% 14.14% -0.954 6.96% 13.91% 0.177 -15.95%
2005 -3.79% 13.07% -0.656 4.52% 15.48% -0.017 -8.31%
2006 14.55% 16.68% 0.554 -4.70% 15.96% -0.627 19.25%*
2007 11.60% 15.12% 0.470 29.91% 21.22% 1.198 -18.31%
2008 -36.26% 34.57% -1.178 -46.40% 36.22% -1.404 10.14%*
2009 131.70% 22.89% 5.584 75.03% 22.55% 3.155 56.67%*
2010 66.99% 18.93% 3.327 44.05% 16.71% 2.396 22.93%*
2011 50.85% 23.20% 2.024 22.96% 23.02% 0.828 27.89%
2012 72.56% 15.43% 4.470 38.07% 12.00% 2.874 34.50%*
*statistically significant

74 Paiboon Sareewiwatthana
4.1.3 Results from using high ROE
Table 3: Returns from the high ROE portfolios compared to the market
ROE Market Return Return
Differential Year Return SD Sharpe Return SD Sharpe
2002 23.79% 23.36% 0.801 0.17% 18.08% -0.271 23.63%*
2003 227.99% 30.85% 7.284 106.57% 25.68% 4.023 121.42%*
2004 -6.54% 24.45% -0.451 6.96% 13.91% 0.177 -13.50%
2005 2.74% 15.30% -0.134 4.52% 15.48% -0.017 -1.78%
2006 6.39% 17.30% 0.063 -4.70% 15.96% -0.627 11.09%*
2007 26.15% 21.31% 1.016 29.91% 21.22% 1.198 -3.76%
2008 -39.95% 35.68% -1.245 -46.40% 36.22% -1.404 6.45%*
2009 78.71% 18.81% 3.977 75.03% 22.55% 3.155 3.69%
2010 50.32% 18.83% 2.459 44.05% 16.71% 2.396 6.27%
2011 45.94% 25.13% 1.673 22.96% 23.02% 0.828 22.98%
2012 48.29% 13.89% 3.218 38.07% 12.00% 2.874 10.23%
*statistically significant
4.1.4 Results from using high ROA
Table 4: Returns from the high ROA portfolios compared to the market
ROA Market Return Return
Differential Year Return SD Sharpe Return SD Sharpe
2002 22.29% 16.82% 1.024 0.17% 18.08% -0.271 22.12%*
2003 120.28% 24.18% 4.839 106.57% 25.68% 4.023 13.71%
2004 -13.42% 18.43% -0.972 6.96% 13.91% 0.177 -20.38%
2005 1.12% 14.87% -0.247 4.52% 15.48% -0.017 -3.40%
2006 9.66% 15.88% 0.274 -4.70% 15.96% -0.627 14.36%*
2007 17.60% 15.70% 0.835 29.91% 21.22% 1.198 -12.31%
2008 -37.82% 34.52% -1.225 -46.40% 36.22% -1.404 8.59%*
2009 84.70% 19.44% 4.157 75.03% 22.55% 3.155 9.68%
2010 42.85% 15.81% 2.457 44.05% 16.71% 2.396 -1.20%
2011 11.29% 22.54% 0.328 22.96% 23.02% 0.828 -11.67%
2012 60.75% 11.22% 5.096 38.07% 12.00% 2.874 22.69%
*statistically significant

Common Financial Ratios and Value Investing in Thailand 75
4.1.5 Results from using high DY
Table 5: Returns from the high DY portfolios compared to the market
DY Market Return Return
Differential Year Return SD Sharpe Return SD Sharpe
2002 10.21% 10.46% 0.491 0.17% 18.08% -0.271 10.05%*
2003 57.15% 21.36% 2.523 106.57% 25.68% 4.023 -49.42%
2004 -2.61% 11.97% -0.593 6.96% 13.91% 0.177 -9.57%
2005 -3.79% 14.53% -0.590 4.52% 15.48% -0.017 -8.30%
2006 6.44% 15.74% 0.072 -4.70% 15.96% -0.627 11.14%*
2007 16.28% 16.04% 0.735 29.91% 21.22% 1.198 -13.63%
2008 -25.32% 36.26% -0.821 -46.40% 36.22% -1.404 21.08%*
2009 87.85% 19.31% 4.349 75.03% 22.55% 3.155 12.83%
2010 53.34% 14.39% 3.429 44.05% 16.71% 2.396 9.29%
2011 21.12% 18.51% 0.931 22.96% 23.02% 0.828 -1.83%
2012 47.05% 12.26% 3.544 38.07% 12.00% 2.874 8.98%
*statistically significant
Table 1-5 show that all portfolios consisted of select 30 stocks screened by one of the five
indicators yield better returns than the market. The results are summarized in Table 6.
Table 6: Portfolio’s returns compared to the market returns
Indicator Average return No. of years better than the market Statistically Significant
PB 33.47% 7 out of 11 5 out of 7
PE 38.96% 8 out of 11 7 out of 8
ROE 30.23% 8 out of 11 4 out of 8
ROA 22.02% 6 out of 11 3 out of 6
DY 20.38% 6 out of 11 3 out of 6
The study has shown that PE is the most powerful among five indicators used to select
stocks during the period 2002-2012, providing the annual geometric return of 38.96
percent. In addition, the result from comparing ROE to ROA as indicators signal that
using ROE can provide a better return and thus ROE should be used as proxy for
profitability in selecting stocks for investment.
Furthermore, as presented in Table 7 below, the tests show that the number of stocks
selected does matter in the way that the 10 stocks portfolios consistently outperform the
20 and 30 stocks portfolios.

76 Paiboon Sareewiwatthana
Table 7: Average returns of portfolios with 10, 20, and 30 selected stocks
Indicator 10 stocks 20 stocks 30 stocks
PB 37.86% 36.71% 33.47%
PE 47.04% 41.12% 38.96%
ROE 36.03% 31.72% 30.23%
ROA 15.41% 19.14% 22.02%
DY 16.88% 18.47% 20.38%
4.2 Select 30 stocks using two ratios as stated in 3.2
4.2.1 Results from using low PB+low PE
Table 8: Returns from the low PB+low PE portfolios compared to the market
PB - PE Market Return Return
Differential Year Return SD Sharpe Return SD Sharpe
2002 70.20% 21.91% 2.972 0.17% 18.08% -0.271 70.04%*
2003 113.34% 24.50% 4.492 106.57% 25.68% 4.023 6.77%
2004 3.14% 11.74% -0.115 6.96% 13.91% 0.177 -3.82%
2005 0.41% 11.72% -0.373 4.52% 15.48% -0.017 -4.10%
2006 10.98% 16.89% 0.336 -4.70% 15.96% -0.627 15.68%*
2007 4.51% 12.47% 0.002 29.91% 21.22% 1.198 -25.40%
2008 -29.91% 30.26% -1.136 -46.40% 36.22% -1.404 16.49%*
2009 142.29% 26.18% 5.286 75.03% 22.55% 3.155 67.26%*
2010 43.24% 23.80% 1.648 44.05% 16.71% 2.396 -0.81%
2011 61.39% 22.26% 2.582 22.96% 23.02% 0.828 38.43%
2012 50.22% 17.07% 2.732 38.07% 12.00% 2.874 12.16%
*statistically significant
4.2.2 Results from using PB+ROE
Table 9: Returns from the low PB+high ROE portfolios compared to the market
PB - ROE Market Return Return
Differential Year Return SD Sharpe Return SD Sharpe
2002 69.40% 21.13% 3.045 0.17% 18.08% -0.271 69.24%*
2003 127.20% 22.64% 5.473 106.57% 25.68% 4.023 20.63%
2004 -11.78% 13.52% -1.204 6.96% 13.91% 0.177 -18.74%
2005 -2.87% 13.41% -0.571 4.52% 15.48% -0.017 -7.39%
2006 7.95% 19.93% 0.133 -4.70% 15.96% -0.627 12.65%*
2007 20.29% 15.89% 0.995 29.91% 21.22% 1.198 -9.62%
2008 -30.76% 33.10% -1.064 -46.40% 36.22% -1.404 15.64%*
2009 116.73% 26.05% 4.332 75.03% 22.55% 3.155 41.70%*
2010 61.28% 18.86% 3.036 44.05% 16.71% 2.396 17.22%
2011 51.42% 22.86% 2.079 22.96% 23.02% 0.828 28.46%
2012 44.21% 14.26% 2.848 38.07% 12.00% 2.874 6.14%
*statistically significant

Common Financial Ratios and Value Investing in Thailand 77
4.2.3 Results from using PB+DY
Table 10: Returns from the low PB+high DY portfolios compared to the market
PB - DY Market Return Return
Differential Year Return SD Sharpe Return SD Sharpe
2002 36.69% 12.32% 2.566 0.17% 18.08% -0.271 36.52%*
2003 59.37% 17.02% 3.298 106.57% 25.68% 4.023 -47.20%
2004 4.95% 11.99% 0.038 6.96% 13.91% 0.177 -2.01%
2005 -8.14% 14.61% -0.885 4.52% 15.48% -0.017 -12.66%
2006 11.03% 14.28% 0.401 -4.70% 15.96% -0.627 15.73%*
2007 11.75% 14.05% 0.517 29.91% 21.22% 1.198 -18.15%
2008 -21.62% 31.84% -0.819 -46.40% 36.22% -1.404 24.78%*
2009 115.79% 23.53% 4.756 75.03% 22.55% 3.155 40.76%*
2010 39.26% 13.65% 2.582 44.05% 16.71% 2.396 -4.79%
2011 13.54% 17.71% 0.544 22.96% 23.02% 0.828 -9.42%
2012 63.65% 15.34% 3.915 38.07% 12.00% 2.874 25.59%*
*statistically significant
4.2.4 Results from using PE+ROE
Table 11: Returns from the low PE+high ROE portfolios compared to the market
PE - ROE Market Return Return
Differential Year Return SD Sharpe Return SD Sharpe
2002 45.64% 18.12% 2.239 0.17% 18.08% -0.271 45.47%*
2003 200.41% 25.88% 7.619 106.57% 25.68% 4.023 93.84%*
2004 -10.19% 20.24% -0.726 6.96% 13.91% 0.177 -17.15%
2005 -1.29% 15.23% -0.399 4.52% 15.48% -0.017 -5.81%
2006 15.65% 16.57% 0.624 -4.70% 15.96% -0.627 20.35%*
2007 23.70% 18.88% 1.018 29.91% 21.22% 1.198 -6.21%
2008 -35.36% 36.54% -1.090 -46.40% 36.22% -1.404 11.04%*
2009 98.13% 21.43% 4.399 75.03% 22.55% 3.155 23.11%*
2010 84.27% 19.62% 4.091 44.05% 16.71% 2.396 40.22%*
2011 3.11% 27.30% -0.029 22.96% 23.02% 0.828 -19.85%
2012 46.33% 11.31% 3.780 38.07% 12.00% 2.874 8.27%
*statistically significant
78 Paiboon Sareewiwatthana
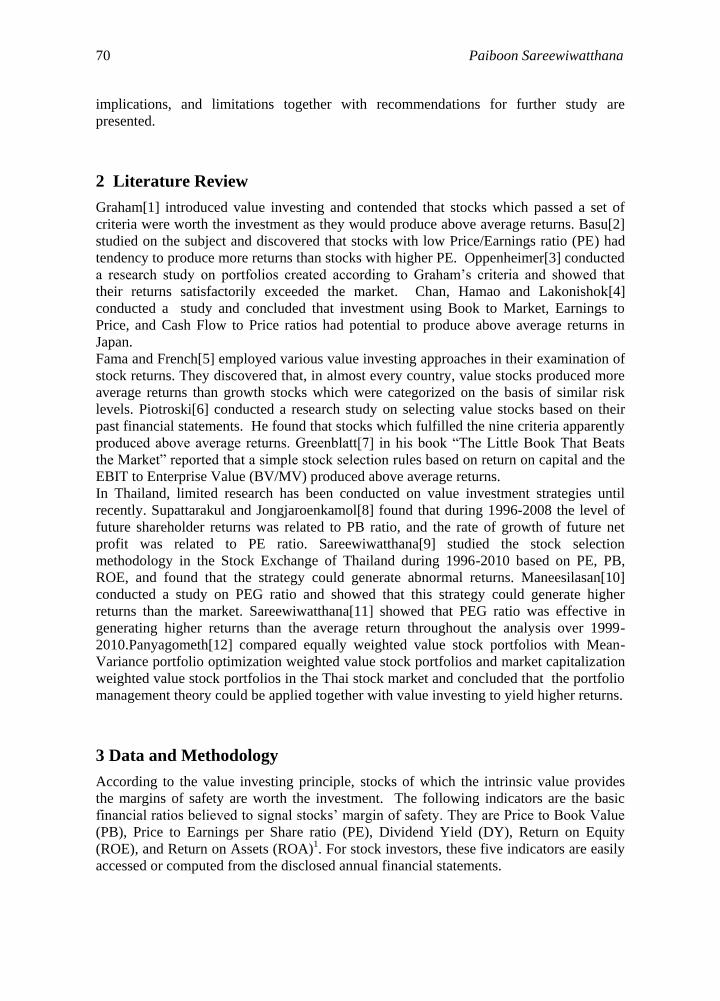
4.2.5 Results from using PE+DY
Table 12: Returns from the low PE+high DY portfolios compared to the market
PE - DY Market Return Return
Differential Year Return SD Sharpe Return SD Sharpe
2002 25.86% 12.22% 1.702 0.17% 18.08% -0.271 25.70%*
2003 71.41% 17.39% 3.919 106.57% 25.68% 4.023 -35.16%
2004 1.95% 10.32% -0.247 6.96% 13.91% 0.177 -5.01%
2005 -7.06% 11.73% -1.009 4.52% 15.48% -0.017 -11.57%
2006 16.48% 14.52% 0.770 -4.70% 15.96% -0.627 21.18%*
2007 19.11% 15.50% 0.943 29.91% 21.22% 1.198 -10.79%
2008 -20.35% 33.03% -0.751 -46.40% 36.22% -1.404 26.05%*
2009 115.13% 23.97% 4.641 75.03% 22.55% 3.155 40.11%*
2010 52.04% 16.30% 2.947 44.05% 16.71% 2.396 7.99%
2011 12.74% 20.89% 0.423 22.96% 23.02% 0.828 -10.22%
2012 57.77% 12.97% 4.179 38.07% 12.00% 2.874 19.71%*
*statistically significant
4.2.6 Results from using ROE+DY
Table 13: Returns from the high ROE+high DY portfolios compared to the market
ROE - DY Market Return Return
Differential Year Return SD Sharpe Return SD Sharpe
2002 19.31% 10.26% 1.388 0.17% 18.08% -0.271 19.14%*
2003 62.46% 14.26% 4.151 106.57% 25.68% 4.023 -44.11%
2004 -3.32% 12.97% -0.602 6.96% 13.91% 0.177 -10.28%
2005 2.53% 14.08% -0.160 4.52% 15.48% -0.017 -1.99%
2006 6.74% 11.39% 0.126 -4.70% 15.96% -0.627 11.44%*
2007 23.08% 15.85% 1.173 29.91% 21.22% 1.198 -6.83%
2008 -26.99% 36.73% -0.856 -46.40% 36.22% -1.404 19.41%*
2009 107.00% 19.90% 5.182 75.03% 22.55% 3.155 31.97%*
2010 53.25% 14.15% 3.479 44.05% 16.71% 2.396 9.19%
2011 22.92% 18.20% 1.046 22.96% 23.02% 0.828 -0.04%
2012 45.82% 10.91% 3.871 38.07% 12.00% 2.874 7.76%
*statistically significant
Common Financial Ratios and Value Investing in Thailand 79
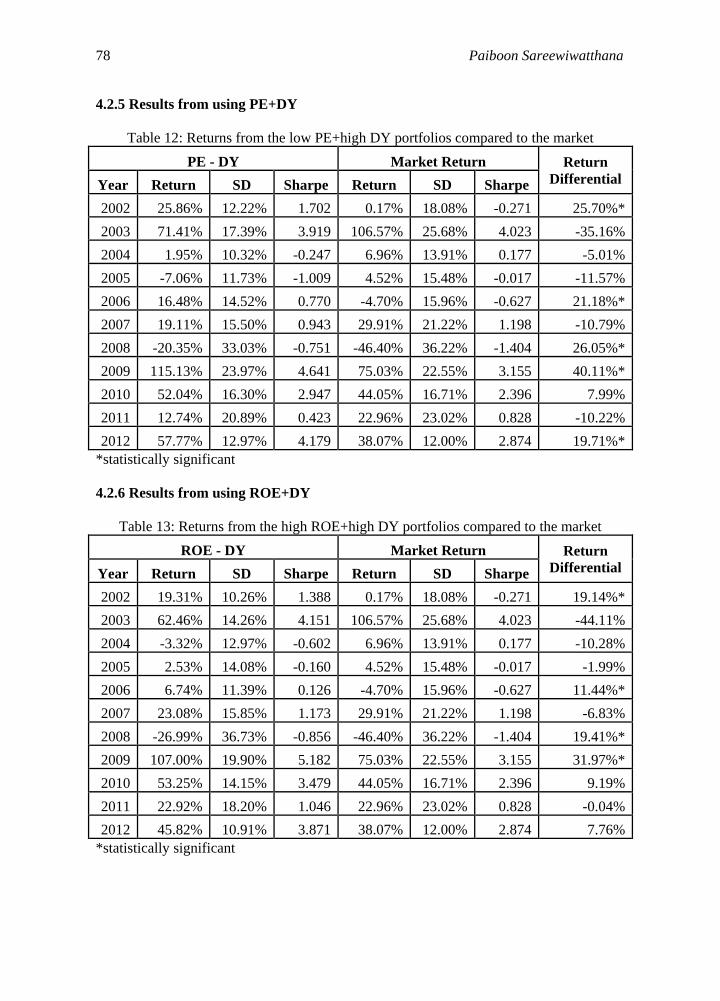
Table 8-13 demonstrate that portfolios of 30 selected stocks, using the combined rankings
of two indicators yield better returns than the market returns over the period of 2002-
2012. As shown in Table 14 below, the best performance is from using PB+PE, yielding
34.34% per year.
Table 14: Summary of portfolio returns
Indicato
r
Average
return
No. of years better than the
market
Statistically
Significant
PB+PE 34.34% 7 out of 11 4 out of 7
PB+RO
E 32.79% 8 out of 11 4 out of 8
PB+DY 24.77% 5 out of 11 5 out of 5
PE+RO
E 31.16% 7 out of 11 6 out of 7
PE+DY 26.39% 6 out of 11 5 out of 6
ROE+D
Y 23.81% 6 out of 11 4 out of 6
4.3 Select 30 Stocks using Three Ratios as Suggested in 3.3
4.3.1 Results from using PB+PE+ROE
Table 15: Returns from the PB+PE+ROE portfolios compared to the market
PB - PE - ROE Market Return Return
Differential Year Return SD Sharpe Return SD Sharpe
2002 66.27% 17.60% 3.478 0.17% 18.08% -0.271 66.11%*
2003 127.50% 22.88% 5.430 106.57% 25.68% 4.023 20.93%
2004 -9.76% 11.51% -1.239 6.96% 13.91% 0.177 -16.72%
2005 0.77% 13.49% -0.298 4.52% 15.48% -0.017 -3.75%
2006 9.82% 18.31% 0.247 -4.70% 15.96% -0.627 14.52%*
2007 18.75% 15.38% 0.927 29.91% 21.22% 1.198 -11.16%
2008 -35.42% 31.90% -1.250 -46.40% 36.22% -1.404 10.98%*
2009 116.73% 26.05% 4.332 75.03% 22.55% 3.155 41.70%*
2010 67.62% 19.21% 3.311 44.05% 16.71% 2.396 23.57%*
2011 50.29% 23.02% 2.016 22.96% 23.02% 0.828 27.33%
2012 48.19% 13.43% 3.322 38.07% 12.00% 2.874 10.12%
*statistically significant

80 Paiboon Sareewiwatthana
4.3.2 Results from using PB+ROE+DY
Table 16: Returns from the PB+ROE+DY portfolios compared to the market
PB - ROE - DY Market Return Return
Differential Year Return SD Sharpe Return SD Sharpe
2002 28.92% 9.44% 2.526 0.17% 18.08% -0.271 28.75%*
2003 60.90% 16.50% 3.493 106.57% 25.68% 4.023 -45.67%
2004 2.95% 10.15% -0.152 6.96% 13.91% 0.177 -4.01%
2005 -1.71% 11.73% -0.554 4.52% 15.48% -0.017 -6.23%
2006 16.15% 12.27% 0.883 -4.70% 15.96% -0.627 20.84%*
2007 19.63% 16.43% 0.921 29.91% 21.22% 1.198 -10.28%
2008 -18.79% 33.08% -0.703 -46.40% 36.22% -1.404 27.61%*
2009 121.80% 25.07% 4.704 75.03% 22.55% 3.155 46.78%*
2010 60.71% 16.08% 3.526 44.05% 16.71% 2.396 16.65%
2011 14.50% 20.11% 0.527 22.96% 23.02% 0.828 -8.46%
2012 63.50% 15.69% 3.819 38.07% 12.00% 2.874 25.43%*
*statistically significant
4.3.3 Results from using PB+PE+DY
Table 17: Returns from the PB+PE+DY portfolios compared to the market
PB - PE - DY Market Return Return
Differential Year Return SD Sharpe Return SD Sharpe
2002 34.30% 9.78% 2.989 0.17% 18.08% -0.271 34.14%*
2003 53.61% 16.52% 3.049 106.57% 25.68% 4.023 -52.96%
2004 6.74% 10.49% 0.214 6.96% 13.91% 0.177 -0.22%
2005 -2.96% 11.77% -0.658 4.52% 15.48% -0.017 -7.47%
2006 14.13% 12.68% 0.696 -4.70% 15.96% -0.627 18.83%*
2007 17.79% 11.96% 1.112 29.91% 21.22% 1.198 -12.12%
2008 -23.00% 31.42% -0.874 -46.40% 36.22% -1.404 23.40%*
2009 111.32% 24.23% 4.433 75.03% 22.55% 3.155 36.29%*
2010 45.57% 13.97% 2.976 44.05% 16.71% 2.396 1.52%
2011 15.99% 17.78% 0.680 22.96% 23.02% 0.828 -6.97%
2012 65.98% 15.40% 4.051 38.07% 12.00% 2.874 27.92%*
*statistically significant

Common Financial Ratios and Value Investing in Thailand 81
4.3.4 Results from using PE+ROE+DY
Table 18: Returns from the PE+ROE+DY portfolios compared to the market
PE - ROE - DY Market Return Return
Differential Year Return SD Sharpe Return SD Sharpe
2002 18.24% 10.22% 1.288 0.17% 18.08% -0.271 18.07%*
2003 77.89% 20.10% 3.713 106.57% 25.68% 4.023 -28.68%
2004 -2.42% 9.06% -0.763 6.96% 13.91% 0.177 -9.38%
2005 0.25% 14.46% -0.313 4.52% 15.48% -0.017 -4.27%
2006 6.78% 13.59% 0.109 -4.70% 15.96% -0.627 11.48%*
2007 21.93% 16.86% 1.034 29.91% 21.22% 1.198 -7.98%
2008 -25.00% 33.44% -0.881 -46.40% 36.22% -1.404 21.41%*
2009 108.85% 23.02% 4.560 75.03% 22.55% 3.155 33.83%*
2010 53.81% 15.94% 3.124 44.05% 16.71% 2.396 9.75%
2011 19.56% 22.18% 0.707 22.96% 23.02% 0.828 -3.39%
2012 48.87% 11.82% 3.831 38.07% 12.00% 2.874 10.81%
*statistically significant
Table 15-18 demonstrate that portfolios of 30 selected stocks, using the combined
rankings of three indicators, yield better than the market returns over the period of 2002-
2012 in the Securities Exchange of Thailand. As shown in Table 19 below, the best
performance is derived from using PB+PE+ROE, yielding 33.21% per year.
Table 19: Summary of portfolio returns
Indicator
Average
return
No. of years better than the
market
Statistically
Significant
PB+PE+RO
E 33.21% 8 out of 11 5 out of 8
PB+ROE+
DY 28.52% 6 out of11 5 out of 6
PB+PE+DY 26.35% 6 out of 11 5 out of 6
PE+ROE+
DY 24.85% 6 out of 11 4 out of 6

82 Paiboon Sareewiwatthana
4.4 Select Stocks using Four Indicators as Suggested in 3.4
Table 20: Returns from the PB+PE+ROE+DY portfolios compared to the market
PB - PE - ROE - DY Market Return Return
Differential Year Return SD Sharpe Return SD Sharpe
2002 25.66% 12.45% 1.654 0.17% 18.08% -0.271 25.49%*
2003 74.65% 16.89% 4.226 106.57% 25.68% 4.023 -31.92%
2004 7.18% 8.43% 0.318 6.96% 13.91% 0.177 0.22%
2005 -7.03% 12.38% -0.955 4.52% 15.48% -0.017 -11.55%
2006 16.17% 14.20% 0.765 -4.70% 15.96% -0.627 20.87%*
2007 20.30% 16.44% 0.961 29.91% 21.22% 1.198 -9.61%
2008 -21.18% 31.92% -0.803 -46.40% 36.22% -1.404 25.23%*
2009 125.33% 25.21% 4.818 75.03% 22.55% 3.155 50.31%*
2010 63.30% 17.43% 3.401 44.05% 16.71% 2.396 19.25%
2011 13.65% 20.16% 0.484 22.96% 23.02% 0.828 -9.31%
2012 55.84% 13.01% 4.017 38.07% 12.00% 2.874 17.77%*
*statistically significant
Table 21: Summary of portfolio returns
Indicator
Average
return
No. of years better than the
market
Statistically
Significant
PB+PE+ROE+
DY 28.44% 7 out of 11 5 out of 7
4.5
This study has performed tests to evaluate the effects of the reduction in the number of
stocks invested in as suggested in 3.5. As in Table 22, the results from using multiple
indicators reveal that for two and three indicators, returns increase when the number of
stocks decline. However, it is not the case for four indicators.
Table 22: Summary of the best portfolio returns
Indicator 10 stocks 20 stocks 30 stocks
PB+PE 40.51% 40.39% 34.34%
PB+PE+ROE 37.75% 35.56% 33.21%
PB+PE+ROE+DY 24.63% 28.71% 28.44%
All in all, the evidences from this study lead to a conclusion that financial ratios such as
PB, PE, ROE, DY commonly used to signal margin of safety for value investment, can
be utilized to select stocks for investment. Portfolios with low PE stocks, low PB+low PE
stocks, and low PB+low PE+ high ROE stocks are the best among the tested portfolios.

Common Financial Ratios and Value Investing in Thailand 83
5 Conclusions and Implications
This study has tested the stock selection concept of Value Investing. Using financial ratios
derived from company annual reports in the Securities Exchange of Thailand, five ratios -
price to earnings per share, price to book value, return on equity, return on assets, and
dividend yield were used as indicators to screen stocks for investment during 2002-
2012.The results show that portfolio of 30 low PE stocks yield the highest return,
Utilizing the modified Greenblatt’s Magic Formula method, when sets of two, three and
four indicators screening rules were used, the results indicate that all portfolios
consistently outperform the average market during the period 2002-2012.Using two and
three indicators respectively, the portfolios with low PE+ low PB stocks and with low
PE+lowPB+high ROE stocks yield the highest returns for investments Portfolio with low
PE+ low PB+highROE+highDY stocks yield the same result. However, the risk-return
tradeoff is somewhat inconclusive.
This study also found that, when the number of stocks decreases, from 30 to 20 and then
to 10 stocks, the tested portfolios yield higher returns, with the exception of using four
indicators. The highest returns are from 10 stocks. At the same time, when the number of
stocks declines, the risks evidently increase.
Thus, the results of this study show that the concept of value investing by selecting stocks
using common financial ratios could be used in the Thai stock market.
Nonetheless, this study encounters some limitations. Firstly, the data used are limited
because of the small and thin characteristics of the Thai stock market. In addition, the
time period covered in the study is rather short. This research would provide better
results if a longer period of time could be tested. Secondly, the financial ratios used in
this study are limited to five easily accessed ratios. The use of other ratios might yield
different results. Thirdly, this study’s results are based on annual portfolio adjustment
while different time intervals could yield different results.
Thus, recommendations for further studies are as follows. Firstly, more sophisticated
financial ratios can be used to further test the conclusion observed in this study. Such
ratios may not be easily obtained and commonly used compared to the ones in this study,
but may yield better returns. Secondly, the time interval to adjust the portfolios can be
modified. Since, there are quarterly financial reports, quarterly and semi-annually
adjustments can be studied to see that shorter holding periods could lead to better
portfolio performance.
In conclusion, despite the limitations, the empirical results found in this study imply that
the Thai stock market is inefficient, so that abnormal returns could be obtained by using
such basic screening rules as used in this study. Individual and institutional long term
investors might adopt this stock-selecting approach for their effective investments.
ACKNOWLEDGEMENTS: The author would like to thank Phasin
Wanidwaranan, Niparporn Thampatpong, and Pitsinee Sareewiwatthana for their
support in collecting data, testing the hypotheses, and editing the paper.

84 Paiboon Sareewiwatthana
References
[1] B. Graham, B and D. Dodd, “Security Analysis,” Whittlesey House, New York,
1934.
[2] S. Basu, “Investment performance of common stocks in relation to their Price-
Earnings ratios: a test of the efficient market hypothesis,” Journal of Finance, 32(3),
1977, pp. 663-682.
[3] H. Oppenheimer, “A test of Ben Graham's stock selection criteria,” Financial
Analysts Journal, 40(5), 1984, pp. 27-36.
[4] L.K. Chan and J. Lakonishok, “Value and growth investing: review and update,”
Financial Analysts Journal, 60(1), 2004, pp. 71-86.
[5] E.F. Fama and K.R. French, “Value versus growth: the international evidence,”
Journal of Finance, 53(6), 1998, pp. 1975-1999.
[6] J. Piotroski, “Value investing: the use of historical financial statement information to
separate winners from losers,” Journal of Accounting Research, 38, supplement,
2000, pp. 1-41.
[7] J. Greenblatt, “The little book that beats the market,” John Wiley & Sons, Hoboken,
2006.
[8] S. Supattarakul and P. Jongjaroenkamol, “The determinants of price-to-book value
(P/B) and price-to-earnings (P/E) ratios based on the residual income model,”
Thammasat Business Journal, Bangkok, 2010.
[9] P. Sareewiwatthana, “Value Investing in Thailand: The test of basic screening
rules,” International Review of Business Research Papers, 2011.
[10] N. Maneesilasan, “GARP Investing in Thailand,” Working Paper, National Institute
of Development Administration, Bangkok, 2011.
[11] P. Sareewiwatthana, “Value Investing in Thailand: Evidence from the use of PEG,”
Technology and Investment, 3(2), May 2012, pp.113-120.
[12] K. Panyagometh, “Weight and stock selections for equity portfolio management:
Evidence from the Stock Exchange of Thailand,” Business and Management
Review, 2(7), September 2012, pp. 20 – 27.
[13] W.F. Sharpe, “Mutual fund performance,” Journal of Business, 39(1), 1966, pp.
119-138.

Common Financial Ratios and Value Investing in Thailand 85
Appendix
The following five financial ratios are the most commonly
Price to Book Value (PB) shows a ratio of stock price to book value. The lower the ratio,
the better the stock in term of its intrinsic value compared to its market price.
Price to Earnings per Share ratio (PE) shows stock price to earnings per share. This
demonstrates a prospective stock’s intrinsic value. The lower the PE, the more its intrinsic
value exceeds its price.
Dividend Yield (DY) shows how much a company pays out in dividends compared to its
market price. To calculate the dividend yield, divide the annual dividend by the current
stock price. A high dividend yield indicates high return on long-term investment.
Return on Equity (ROE) is the amount of net income returned as a percentage of
shareholders equity. To calculate the ROE, divide the net income by shareholder’s equity.
ROE largely measures a corporation’s profitability. The higher the ROE, the more
profitable a corporation is.
Return on Assets (ROA) is the amount of net income returned as a percentage of total
assets. To calculate the ROA, divide the net income by total assets. ROA also measures a
corporation’s profitability. The higher the ROA, the more profitable a corporation is.
Sharpe ratio
Sharpe ratio is a ratio developed by William F. Sharpe[13] that is used in analyzing the
risk-adjusted returns. This makes it possible to compare returns on investment to make
sure that the excess return is not due to increased risk.The higher Sharpe ratio indicates
the higher investment efficiency. The value can be obtained as follows:
𝑆ℎ𝑎𝑟𝑝𝑒 𝑅𝑎𝑡𝑖𝑜 =𝑟𝑝 − 𝑟𝑓
𝜎𝑝
rp = portfolio’s expected rate of return
rf = rate of return on a risk-free asset(based on a10-year government bond in this case)
σp = standard deviation of the portfolio’s rates of return