common-mode to differential-mode conver- sion in …audiosystemsgroup.com/aes-scin-asgweb.pdf ·...
TRANSCRIPT

Common-Mode to Differential-Mode Conver-sion in Shielded Twisted-Pair Cables
(Shield-Current-Induced Noise) Jim Brown1 and Bill Whitlock2
1Audio Systems Group, Inc. Chicago, IL, 60640, USA [email protected]
2Jensen Transformers, Inc., Van Nuys, CA, USA 91406
This paper was presented at the 114th AES Convention in Amsterdam, March, 2003. You can search the complete AES Electronic Library at http://www.aes.org/e-lib/ This paper is available as Preprint 5747.
ABSTRACT Neil Muncy [1] has shown that audio frequency current flowing on the shield of twisted-pair audio wiring will be converted to differential mode voltage by any imbalance in the transfer impedance of the cable. He hypothesized that the effect is magnified by the presence of a drain wire and increases linearly with frequency. Whitlock [2] and others have shown that conversion also occurs with capacitive imbalance. This paper confirms Muncy's hypotheses and shows that shield-current-induced noise is significant well into the MHz range.
INTRODUCTION In his landmark 1994 paper, Muncy reported on his work showing that audio frequency current flowing on the shield of twisted-pair audio cables will be con-verted to differential mode voltage on the signal pair. His test setup used a sine wave and square wave gen-erator coupled to an audio power amplifier and output transformer to establish 100 mA of current on the shield of 175 ft lengths of an assortment of commonly used audio cables. His results showed that some cable constructions caused considerably more mode con-version than others. In general, cables having foil/drain type shields exhibited the greatest mode conversion and those having braid shields or coun-terwound overlapping spiral shields exhibited much less mode conversion.
Muncy hypothesized that the conversion mechanism was the imbalance in the transfer impedances of the balanced audio conductors to the shield, and cited the drain wire as the principal cause. He called the mechanism "shield-current-induced noise" and gave it the acronym "SCIN." His measurements used 60 Hz,
600 Hz, and 6 kHz sine and square waves, and indi-cated that the differential mode conversion was essen-tially proportional to the frequency of the excitation.
There is considerable anecdotal evidence that foil/drain-shielded cables will degrade the immunity of audio systems to radio frequency interference in the 200 kHz to 2 MHz region, and that replacing those cables with braid-shielded cables will signifi-cantly improve the immunity. The authors have long suspected that SCIN is a primary agent, converting common mode current set up by a microphone cable acting as a receiving antenna into differential mode voltage on the balanced audio pair.
An input circuit that has poor immunity to radio fre-quency signals will then detect the interfering signal by one of several mechanisms. First, square law de-tection can occur in any of the semiconductor junc-tions exposed to the interfering signal. Second, detec-tion can occur due to slew-rate limiting. Third, detec-tion can occur due to fundamental overload (that is, clipping or rectification) in any active stage.

Brown and Whitlock Shield-Current-Induced Noise
AES 114TH CONVENTION, AMSTERDAM, THE NETHERLANDS, 2003 MARCH 22-25
2
SOURCES OF SHIELD CURRENT Some common causes of shield current in audio ca-bles are:
1. Potential differences between points where shields of opposing ends of an audio cable are connected. The potential differences typically result from IR losses (that is, voltage drops) due to leakage currents of motors, lighting equipment, and electronics equipment.
2. Wiring faults in equipment unrelated to the au-dio system.
3. Magnetic induction.
4. Ground currents from building equipment such as variable-frequency-drive motors.
5. Radio signals, most commonly broadcast sig-nals, but also noise from lighting circuits and other incidental or unintentional radiators.
Power System-Related Shield Currents Muncy [11] and Windt [3] have noted that shield currents on the order of 100mA are common in North America where shields are dc-connected to ground at each end. Schmidt [4] has noted that much higher currents have been observed between television stu-dio complexes. These currents have mains power frequencies and lower order harmonics of mains power as their major components, but it is not at all unusual for components at high audio frequencies to also be significant. Impulse noise currents with com-ponents throughout the audio spectrum can also be present, most commonly the result of power faults, switching transients, and equipment faults. Impulse noise can, of course, include components well into the MHz range.
A shield current of 100 mA at 5 kHz would produce a differential mode signal of about 1 mV in 38 m of most foil/drain cables, which is enough to wreak havoc in most microphone circuits. Only 1mA of shield current at 2 kHz would produce a differential mode signal on the order of 6 µV in that same cable.
One common cause of both magnetically induced noise and ground fault current is a wiring fault com-monly known in North America as a bonded neutral, whereby the connection of a power system neutral to ground at more than one point sets up a path for neu-tral currents to flow through parts of the ground sys-tem. The neutral of every power circuit is required to be bonded to ground at one, but only one point, either where the power service enters the building, or within the building where that circuit is created by the sec-ondary of a transformer. Any additional connections
violate building codes, but they are an all too com-mon mistake in buildings.
Magnetically coupled noise and ground currents often result from a power distribution system known as 3-phase 3-wire "high leg" delta. In this system, the power company's service to a building grounds the centertap of one winding of a 3-phase 240 volt delta service. The 3 phases are brought into the building but there is no dedicated neutral. Instead, a single conductor serves as both neutral and ground. In such a system any neutral/ground currents from surround-ing buildings divide between the path to ground at the utility pole transformer and the path through the neu-tral/ground conductor and its local path(s) to ground. Muncy has found noise current from industrial equipment in an adjacent building to be flowing on a high leg delta service's ground conductor and along a water service pipe running under a studio, with the resulting magnetic field inducing noise into audio circuits.
Magnetic induction is also produced by properly in-stalled power wiring. For example, phase and neutral conductors are often neither twisted nor symmetrical, thus may not couple equally to nearby conductors, including the shields of audio cables. Even stronger fields can be produced by large triplen neutral cur-rents in 3-phase system feeders.
Shield Currents Due to AM Broadcast Fields AM broadcast interference is known to occur in sound systems when mic cables run exposed (that is, not within grounded metallic conduit) through the attic or around the floor of a wood frame building, most commonly a church. An important question is, "how much current might be flowing on the shields of balanced audio cables at frequencies that could cause interference if converted to a differential mode sig-nal." AM broadcast stations operating between 0.5 MHz and 2 MHz are a common source of such inter-ference.
The behavior of the random long wire antenna formed by the shield of an audio cable cannot easily be analyzed or predicted because of such complex factors as its radiation resistance, impedance, orienta-tion, proximity to surrounding conductive objects, and exposure to the field. On the other hand, AM broadcast field strength outdoors can be reasonably well predicted on the basis of extensive empirical data, especially within about the first 60 km from the transmitting antenna. Thus, to answer the above ques-tion, measurements were made at selected locations of the radio frequency currents flowing on the shields of 125 ft lengths of several test cables. While this

Brown and Whitlock Shield-Current-Induced Noise
AES 114TH CONVENTION, AMSTERDAM, THE NETHERLANDS, 2003 MARCH 22-25
3
survey is far from rigorous, as we shall see, it is in-formative.
At each measuring location, the cable shield of a 38m long microphone cable was connected as a long wire antenna to the center conductor of the 50 ohm input of a Hewlett Packard 3856C Selective Level Meter. This instrument is essentially a calibrated radio re-ceiver that can be tuned to any frequency up to 32 MHz with selectable measurement bandwidths of 20 Hz, 400 Hz, and 3.2 kHz. All measurements were made with a 3.2 kHz bandwidth. The chassis of the instrument was connected to the power line safety ground. Measurements were made of the carrier strengths of various local broadcast stations during daytime hours, all of which were being propagated by ground wave. Two locations were used.
At location #1, the analyzer was set up in an open wooden gazebo in the center of a small town park about 29 km from the laboratory. The 38 m cable was run about 2.5 m above moist grassy earth and sup-ported by the branches of three small trees. Location #2 was within 7 km of four omnidirectional AM broadcast transmitters, three of them operating at 50 kW. At location #2, the author's laboratory located in the second floor of his wood frame home, the cable was laid on the floor from the laboratory at the front of the house and zig-zagged through the house to the attic.
The current induced in a receiving antenna (that is, the mic cable) will be directly proportional to the field strength. The primary means of propagation within 100 km of AM broadcast stations is ground wave. The ground wave field strength in volts/meter produced by an AM broadcast transmitter varies with the inverse of the distance and an additional loss due to resistivity of the earth. The additional loss in-creases with frequency and varies with soil condi-tions.
The United States Federal Communications Commis-sion (FCC) includes within its Rules for Broadcast services a family of empirically determined curves that predict ground wave propagation for various val-ues of soil conductivity, as well as a map showing soil conductivity for the continental United States. [5] These curves were used to predict, based on meas-ured data at the two different locations, how much current would be induced in the same mic cable shield (antenna) if it were at a distance of one mile (1.6 km) from the transmitting antenna. Latitude and longitude coordinates of the receiving locations, de-termined using a GPS receiver, and coordinates of each transmitter, obtained from the FCC database, were used to determine path lengths. Measured and computed data are summarized in Tables 2 and 3.
At each location, the RSS (root of the sum of the squares prediction of rms of the combined signals) value of the current and voltage were computed from the data for individual signals. The peak value of the voltage in a circuit establishes how much detection will occur, and can be estimated as 1.4X the RSS value, assuming that no other signals contribute sig-nificantly interference (for example, a VHF transmit-ter).
Analysis of the AM radio data AM broadcast transmitters use vertical antennas hav-ing lengths ranging from 0.2 to 0.625 wavelength. Half-wave and 5/8 wave antennas have the advantage of the greatest field strength in the horizontal plane, providing gain in the vertical plane of 1.9 dB and 3.25 dB, respectively, over a quarter-wave antenna. Many AM broadcast stations use multi-tower arrays to provide directivity in the horizontal plane to opti-mize their coverage of an intended service area and protect certain azimuths from interference. The hori-zontal directivity can cause the field strength in a given direction to vary by as much as +12 dB and -10 dB from that for a single tower.
The FCC curves were found to be a good predictor of ground wave field strength over the range of distances traversed by the measured transmitters. At both measurement locations the predicted currents from most of the omnidirectional transmitters varied no more than 3 dB from each other taking into account their transmitter power and antenna directivity, even though the distances from the nearest to the farthest varied from 2 km to 60 km!
Transmitter power / Location
50 kW 5 kW 1 kW
Lab - 2nd/3rd floors of wood frame house
4.8mA 1.5mA 0.6mA
Open park - 2m above earth
5.3mA 1.7mA .75mA
Table 1 - Predicted AM Broadcast Shield Current
From the two measurement setups, predictions of current at 1.6 km from an omnidirectional transmit-ting antenna were computed and are summarized in Table 1.
The field strengths from directional antenna systems deviated by about ±6 dB from those for omnidirec-tional antennas. Thus, making allowances for trans-mitting antenna directivity, the range of currents in a typical 38 m mic cable shield unshielded by conduit or building steel might be expected to range from about 1 - 20 mA at one mile (1.6 km) from a 50,000 watt transmitter, from 0.5 - 10 mA at one mile from a 5,000 watt transmitter, and from 0.2 - 2 mA at one
Brown and Whitlock Shield-Current-Induced Noise
AES 114TH CONVENTION, AMSTERDAM, THE NETHERLANDS, 2003 MARCH 22-25
4
mile from a 1 kW transmitter. Some lengths, heights, orientations, and paths for receiving antennas could easily result in significantly greater currents, perhaps as much as 10 dB. In neither of the test setups could the audio cable shield have been considered a "good" receiving antenna.
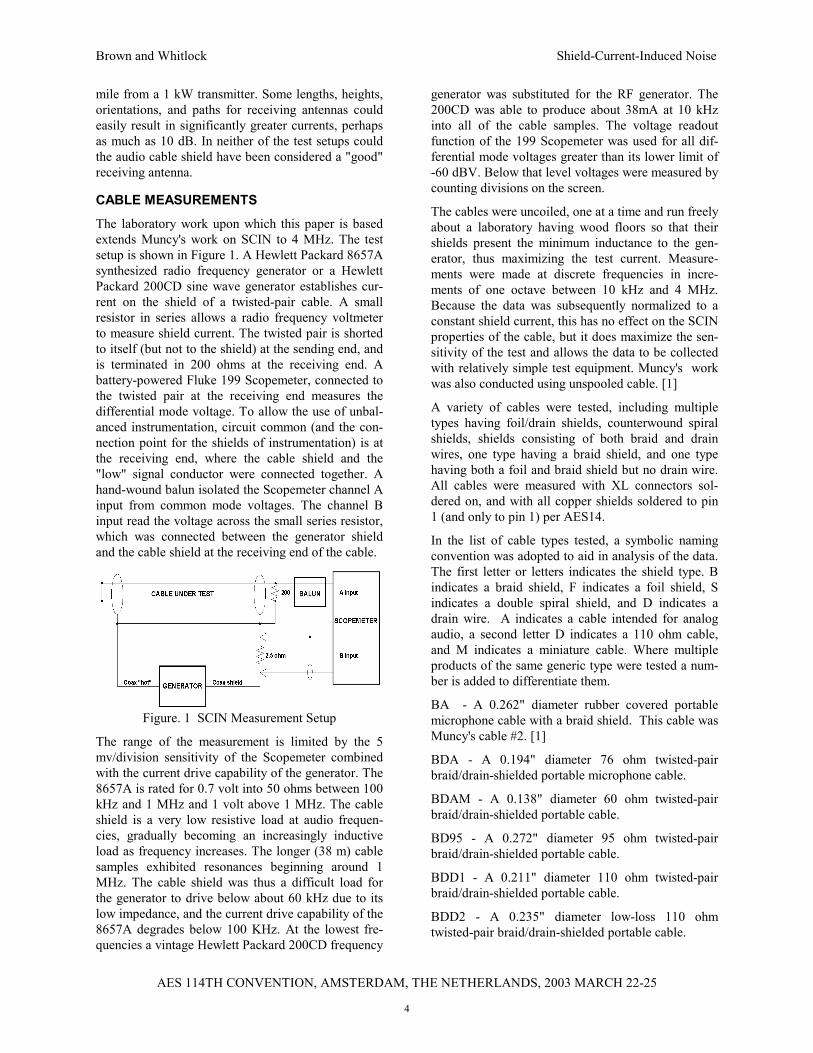
CABLE MEASUREMENTS The laboratory work upon which this paper is based extends Muncy's work on SCIN to 4 MHz. The test setup is shown in Figure 1. A Hewlett Packard 8657A synthesized radio frequency generator or a Hewlett Packard 200CD sine wave generator establishes cur-rent on the shield of a twisted-pair cable. A small resistor in series allows a radio frequency voltmeter to measure shield current. The twisted pair is shorted to itself (but not to the shield) at the sending end, and is terminated in 200 ohms at the receiving end. A battery-powered Fluke 199 Scopemeter, connected to the twisted pair at the receiving end measures the differential mode voltage. To allow the use of unbal-anced instrumentation, circuit common (and the con-nection point for the shields of instrumentation) is at the receiving end, where the cable shield and the "low" signal conductor were connected together. A hand-wound balun isolated the Scopemeter channel A input from common mode voltages. The channel B input read the voltage across the small series resistor, which was connected between the generator shield and the cable shield at the receiving end of the cable.
Figure. 1 SCIN Measurement Setup
The range of the measurement is limited by the 5 mv/division sensitivity of the Scopemeter combined with the current drive capability of the generator. The 8657A is rated for 0.7 volt into 50 ohms between 100 kHz and 1 MHz and 1 volt above 1 MHz. The cable shield is a very low resistive load at audio frequen-cies, gradually becoming an increasingly inductive load as frequency increases. The longer (38 m) cable samples exhibited resonances beginning around 1 MHz. The cable shield was thus a difficult load for the generator to drive below about 60 kHz due to its low impedance, and the current drive capability of the 8657A degrades below 100 KHz. At the lowest fre-quencies a vintage Hewlett Packard 200CD frequency
generator was substituted for the RF generator. The 200CD was able to produce about 38mA at 10 kHz into all of the cable samples. The voltage readout function of the 199 Scopemeter was used for all dif-ferential mode voltages greater than its lower limit of -60 dBV. Below that level voltages were measured by counting divisions on the screen.
The cables were uncoiled, one at a time and run freely about a laboratory having wood floors so that their shields present the minimum inductance to the gen-erator, thus maximizing the test current. Measure-ments were made at discrete frequencies in incre-ments of one octave between 10 kHz and 4 MHz. Because the data was subsequently normalized to a constant shield current, this has no effect on the SCIN properties of the cable, but it does maximize the sen-sitivity of the test and allows the data to be collected with relatively simple test equipment. Muncy's work was also conducted using unspooled cable. [1]
A variety of cables were tested, including multiple types having foil/drain shields, counterwound spiral shields, shields consisting of both braid and drain wires, one type having a braid shield, and one type having both a foil and braid shield but no drain wire. All cables were measured with XL connectors sol-dered on, and with all copper shields soldered to pin 1 (and only to pin 1) per AES14.
In the list of cable types tested, a symbolic naming convention was adopted to aid in analysis of the data. The first letter or letters indicates the shield type. B indicates a braid shield, F indicates a foil shield, S indicates a double spiral shield, and D indicates a drain wire. A indicates a cable intended for analog audio, a second letter D indicates a 110 ohm cable, and M indicates a miniature cable. Where multiple products of the same generic type were tested a num-ber is added to differentiate them.
BA - A 0.262" diameter rubber covered portable microphone cable with a braid shield. This cable was Muncy's cable #2. [1]
BDA - A 0.194" diameter 76 ohm twisted-pair braid/drain-shielded portable microphone cable.
BDAM - A 0.138" diameter 60 ohm twisted-pair braid/drain-shielded portable cable.
BD95 - A 0.272" diameter 95 ohm twisted-pair braid/drain-shielded portable cable.
BDD1 - A 0.211" diameter 110 ohm twisted-pair braid/drain-shielded portable cable.
BDD2 - A 0.235" diameter low-loss 110 ohm twisted-pair braid/drain-shielded portable cable.

Brown and Whitlock Shield-Current-Induced Noise
AES 114TH CONVENTION, AMSTERDAM, THE NETHERLANDS, 2003 MARCH 22-25
5
BDQ - A 0.24" diameter quad-star braid/drain-shielded portable microphone cable.
BF - A 0.14" diameter twisted-pair braid/foil shielded cable for fixed installation.
CP A 0.25" diameter portable twisted-pair micro-phone cable with a conductive carbon plastic shield.
FDA1 - A 0.135" diameter twisted-pair foil/drain-shielded cable.
FDA2 - A 0.14" diameter 60 ohm twisted-pair foil/drain-shielded cable.
FDA3 - A 0.138" diameter 45 ohm twisted-pair foil/drain-shielded cable. This cable was Muncy's cable #5. [1]
FDA4 - A 0.132" diameter twisted-pair foil/drain-shielded cable.
FDD1 - A 0.143" diameter 110 ohm twisted-pair foil/drain-shielded cable.
FDD2 - A 0.19" diameter low-loss 110 ohm twisted-pair foil/drain-shielded cable.
SA - A 0.19" diameter portable microphone cable with three twisted conductors and two served copper spriral shields wrapped in opposition. This cable was Muncy's cable #1. [1]
SD - A 0.204" diameter 110 ohm twisted-pair cable with two spiral shields wrapped in opposition.
To provide accurate data over the wide spectrum, it was decided to make measurements on cables of vari-ous lengths so that effects of wavelength could be studied. Each cable sample was cut into lengths of 50 ft (15 m), 40 ft (12 m), 25 ft (7.6 m), and 10 ft (3 m) and XL connectors were attached. Measurements were then made on all four lengths connected in se-ries via their XL connectors (125 ft or 38 m), and on the 50 ft (15 m), 25 ft (7.6 m), and 10 ft (3 m) sam-ples. No measurements were made on the 40 ft (12 m) samples other than as part of the 125 ft combination. All SCIN measurements were made in co-author Brown's laboratory. An additional length of each (10 ft for most cable types) was sent to co-author Whitlock's laboratory for measurement of basic elec-trical parameters. Samples of cable types SA, BA, BDAM, and BDD1 were from one of the author's stock of portable cables. The other cables tested were cut from a single roll.
Basic Electrical Parameters From end to end, a cable shield has both resistance and inductance. Any AC voltage developed across this inductance will magnetically induce a similar voltage in each conductor (as well as any other con-
ductors near the shield), thus effectively forming a three-winding transformer that has a turns ratio of approximately 1:1:1.
In the interest of simplicity, in this paper we discuss only current drive of the shield that is constant with frequency. This results in a voltage across the trans-former primary (shield inductance) and an induced common mode voltage in the signal pair that rises linearly with frequency. Magnetic induction is very strongly affected by physical proximity, especially when very near the field source, which in this case is the shield conductor. Ideal cable construction would locate the signal conductors at exactly the same dis-tances to the shield conductor, even when the shield conductor surrounds the signal pair. Thus exactly equal voltages would be induced and a differential (signal) component would not exist. Even with identi-cal induced voltages, impedance imbalances in the driver, cable, and receiver can convert a portion of the induced common mode voltage into differential mode voltage. Twisting is a first order approach in-tended to "average" the proximity of the two signal conductors to a noise source.
Measurements were made on short samples of each of the tested cables to determine its basic electrical pa-rameters. Most of the samples were approximately 3 m long; a few were on the order of 8 m. Data is sum-marized in Tables 5 and 6, and includes:
1. Capacitance between each signal conductor and the other signal conductor connected to the shield. Measurements were made at 10 kHz us-ing an Electro Scientific Industries 2100 video-bridge.
2. DC resistance of each signal conductor and the shield. Measurements were made in 4-wire mode at 1 mA using an HP/Agilent 34401A multi-meter. Samples having attached XL con-nectors were measured at solder terminals to exclude contact resistance.
3. End-to-end inductance of the shield with no connections to other conductors. Measurements were made at 50 kHz on an Electro Scientific Industries 2100 videobridge with the cable formed into an approximate circle on the floor.
4. The physical length of each sample.
Measurements of the inductance of the signal conduc-tors were made in an attempt to determine the appar-ent turns ratio, but they were not of sufficient preci-sion to be of value and are not presented here. The measured electrical parameters were post-processed to determine the apparent electrical symmetry of each cable sample. The post-processed data included:

Brown and Whitlock Shield-Current-Induced Noise
AES 114TH CONVENTION, AMSTERDAM, THE NETHERLANDS, 2003 MARCH 22-25
6
5. The ratio of the capacitances measured in #1, and that ratio expressed as a signed percent dif-ference to their mean.
6. The ratio of the series resistances of the two signal conductors, and that ratio expressed as a signed percent difference to their mean. This represents a combination of any difference in the lengths and cross sectional areas of the two conductors.
7. Capacitance and resistance per unit length.
Circuit Model Measured circuit parameters for one of the tested foil/drain cables, cable FDD1, were used to create a simple lumped parameter circuit model treating the cable as a three-winding transformer as suggested by Muncy. An ideal cable would have a 1:1 turns ratio between the signal conductors (measured end to end). It would also have equal values of series resistance for the two windings representing the signal conduc-tors, equal values for the inter-winding capacitances, and equal values for mutual inductance between the shield and each signal conductor.
Shield Construction and Distribution of Shield Current For each cable having a drain wire, the relative distri-bution of current between the drain and the shield was
computed from a combination of computed and measured data. For some of the cables, engineering data for the dc resistance of the components of the shield were provided by the manufacturer. For others the values were computed from measured data. When a drain wire was of the same gauge as a signal con-ductor, resistance measurements on the signal con-ductor were assumed to also represent the resistance of the drain. Where the drain was a different gauge, the measured resistance was multiplied by the ratio of the resistance per unit length of the drain wire to that of the signal conductor. Manufacturer-provided data tended to correlate well with measurements of the same parameters.
It should be noted that distribution of current throughout a foil or braid shield and between the shield and a drain wire will vary with frequency as a function of their respective geometries. It should also be noted that for most cables having a drain wire the drain is in contact with the more homogenous shield (that is, the braid or drain) along its entire length. An analysis of these more complex issues is beyond the scope of this paper.
MEASURED DATA
Freq kHz
dBV in 50
ohms
Shield current
mA
km to ant
1 kW -meas pt mV/m
1 kW -1.6 km mV/m
Path loss re: 1.6 km
(dB)
Extrapolate to 1.6 km
(mA)
Ant Ant vert gain (dB)
Trans-mitter
dB(kW) RSS -13.7 4.13 560 -54.5 0.038 66.6 1.2 95 38 3.0 Dir 0 7 620 -70 0.0064 82.3 0.72 95 42.4 0.84 Dir 1.9 17 670 -25 1.13 6.39 22 95 12.7 4.87 Omni 1.9 17 720 -22 1.59 5.09 28 95 10.6 5.41 Omni 2.3 17 780 -16 3.18 2.82 59 95 4.1 5.11 Omni 2.3 17 820 -40 0.20 21.9 4.1 94 27.2 4.61 Omni 1.5 7 890 -47 0.09 48 1 93 39.4 5.97 Omni 2 17 950 -52 0.051 29.6 2.3 93 32.1 2.05 Omni 0 0 1000 -32 0.504 16.9 5.2 93 25 9.02 Dir 1.9 17 1110 -23.5 1.341 4.6 27 93 10.7 4.62 Omni 3 7 1160 -26 1.006 14.6 6.3 93 23.4 14.9 Dir 0 17
Table 2 AM Broadcast Measurements - Location #1

Brown and Whitlock Shield-Current-Induced Noise
AES 114TH CONVENTION, AMSTERDAM, THE NETHERLANDS, 2003 MARCH 22-25
7
Freq kHz
dBV in 50
ohms
Shield current
mA
km to ant
1 kW -meas pt mV/m
1 kW -1.6 km mV/m
Path loss re: 1.6 km
(dB)
Extrapolate to 1.6 km
(mA)
Ant Ant vert gain (dB)
Trans-mitter
dB(kW) RSS -27.1 0.88 560 -77.4 0.0027 50 1.25 95 37.6 0.21 Dir 0 7 620 -77.5 0.0027 88 0.65 95 43.3 0.39 Dir 1.9 17 670 -43.5 0.134 33 3 95 30 4.26 Omni 1.9 17 720 -44 0.127 30 3.08 95 29.8 3.91 Omni 2.3 17 780 -45 0.113 29 3 95 30 3.58 Omni 2.3 17 820 -37.1 0.286 7 17 94 14.9 1.55 Omni 1.5 7 890 -51.2 0.0555 48 1 93 39.4 1.78 Omni 2 17 950 -54.7 0.0371 12 9.5 93 19.8 4.3 Omni 0 0 1000 -39 0.226 31 1.8 93 34.3 0.36 Dir 1.9 17 1030 -66.5 0.0095 36 1.35 93 36.8 0.7 Dir 0 5 1060 -70.9 0.0058 100 0.12 93 57.8 4.5 Omni 0 7 1080 -68.5 0.0076 37 1.2 93 37.8 0.6 Omni -1 4.7 1110 -46.2 0.0985 28 1.75 93 34.5 5.24 Omni 3 7 1130 -73.2 0.0044 93.7 0.16 93 55.6 2.7 Dir 0 17 1160 -28.8 0.729 18 3.9 93 27.5 17.4 Dir 0 17 1240 -40 0.201 7 17 91 14.6 1.08 Omni 0 0 1300 -63.8 0.013 34 0.93 91 39.8 1.3 Omni 0 6.5 1390 -58.6 0.0237 26 1.4 88 36 1.49 Dir 0.5 7 1450 -67 0.009 16 3.2 88 28.8 0.25 Omni -1 0 1490 -58.8 0.0231 14 3.65 88 27.6 0.56 Omni 0.3 0 1590 -47 0.09 6.7 13 86 16.4 0.59 Omni 0 0
Table 3 AM Broadcast Measurements - Location #2
Figure 2 Measured data for the modeled cable, FDD1, normalized for current but not normalized for length.

Brown and Whitlock Shield-Current-Induced Noise
AES 114TH CONVENTION, AMSTERDAM, THE NETHERLANDS, 2003 MARCH 22-25
8
Figure 3 Measured shield-current-induced noise for the modeled cable, FDD1, normalized to 125 ft.
Fig 4 Measured shield-current-induced noise for a miniature braid-shielded cable with a drain wire.

Brown and Whitlock Shield-Current-Induced Noise
AES 114TH CONVENTION, AMSTERDAM, THE NETHERLANDS, 2003 MARCH 22-25
9
Fig 5 Measured data for miniature foil and braid-shielded cable BF.
Figure 6 Measured data for 125 ft Foil-Shielded Cables

Brown and Whitlock Shield-Current-Induced Noise
AES 114TH CONVENTION, AMSTERDAM, THE NETHERLANDS, 2003 MARCH 22-25
10
Figure 7 Measured data for 50 ft foil-shielded cables.
Figure 8 Measured Data for 25 ft foil shielded cables.

Brown and Whitlock Shield-Current-Induced Noise
AES 114TH CONVENTION, AMSTERDAM, THE NETHERLANDS, 2003 MARCH 22-25
11
Figure 9 Measured data for 10 ft foil shielded cables.
Figure 10 Measured data for 125 long braid-shielded cables.
Brown and Whitlock Shield-Current-Induced Noise
AES 114TH CONVENTION, AMSTERDAM, THE NETHERLANDS, 2003 MARCH 22-25
12
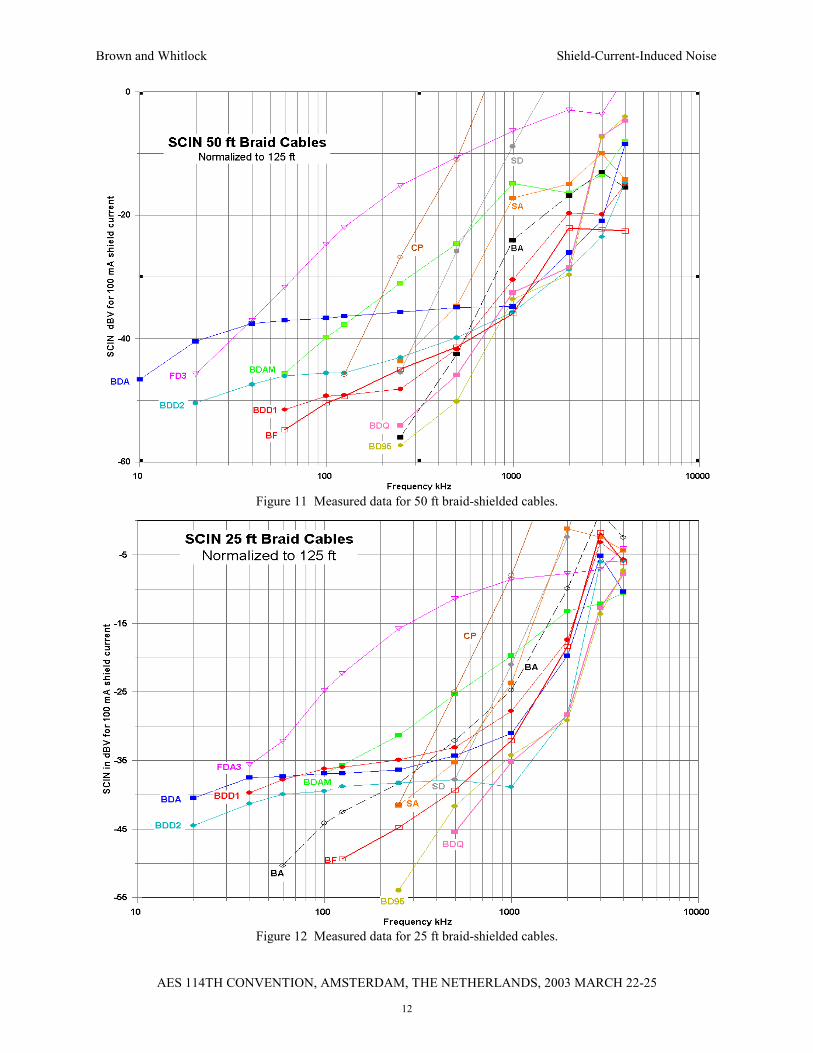
Figure 11 Measured data for 50 ft braid-shielded cables.
Figure 12 Measured data for 25 ft braid-shielded cables.
Brown and Whitlock Shield-Current-Induced Noise
AES 114TH CONVENTION, AMSTERDAM, THE NETHERLANDS, 2003 MARCH 22-25
13
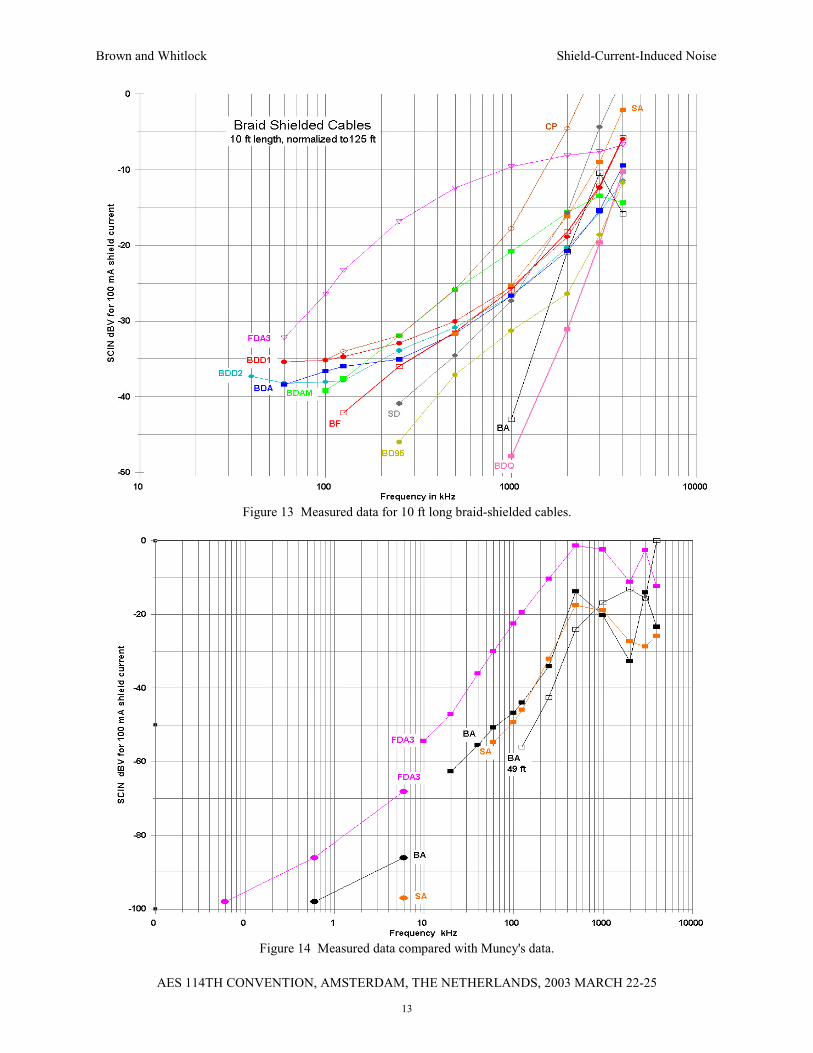
Figure 13 Measured data for 10 ft long braid-shielded cables.
Figure 14 Measured data compared with Muncy's data.
Brown and Whitlock Shield-Current-Induced Noise
AES 114TH CONVENTION, AMSTERDAM, THE NETHERLANDS, 2003 MARCH 22-25
14
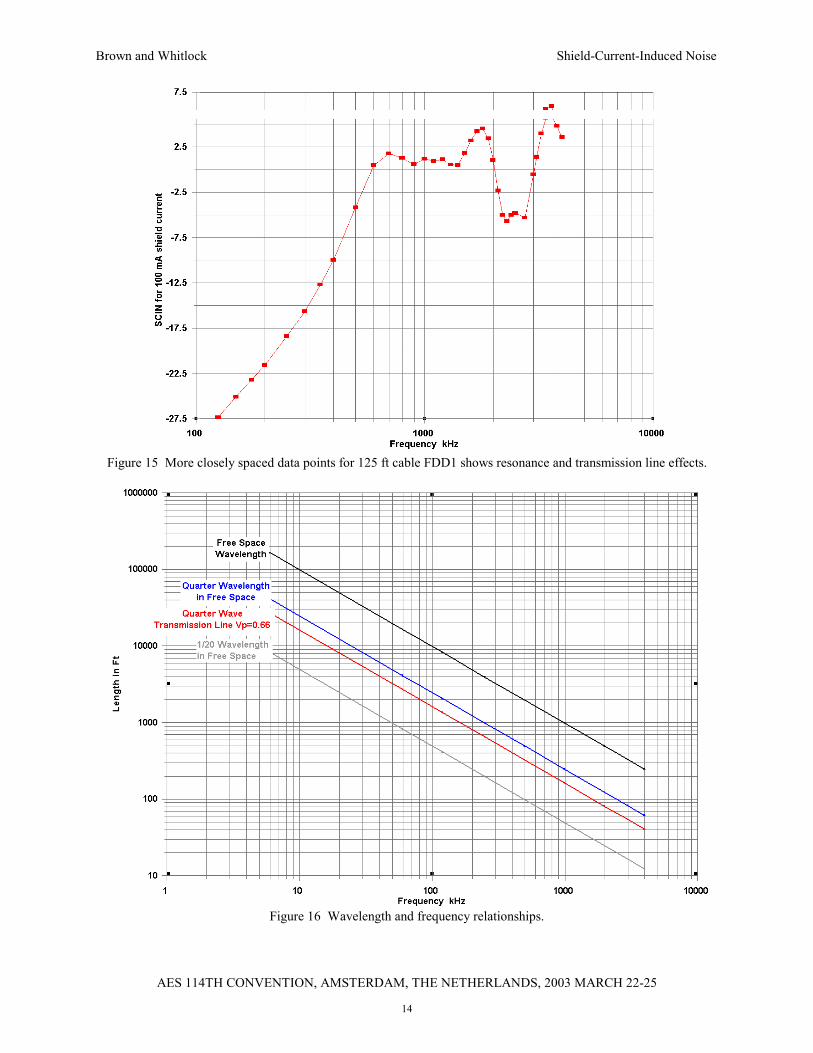
Figure 15 More closely spaced data points for 125 ft cable FDD1 shows resonance and transmission line effects.
Figure 16 Wavelength and frequency relationships.
Brown and Whitlock Shield-Current-Induced Noise
AES 114TH CONVENTION, AMSTERDAM, THE NETHERLANDS, 2003 MARCH 22-25
15
Type Sample
Length ft Cap High to
Low+Shld pF Cap Low to
High+Shld pf Cap diff
Shield R mΏ
Signal High mΏ
Signal Low mΏ
Shield µH
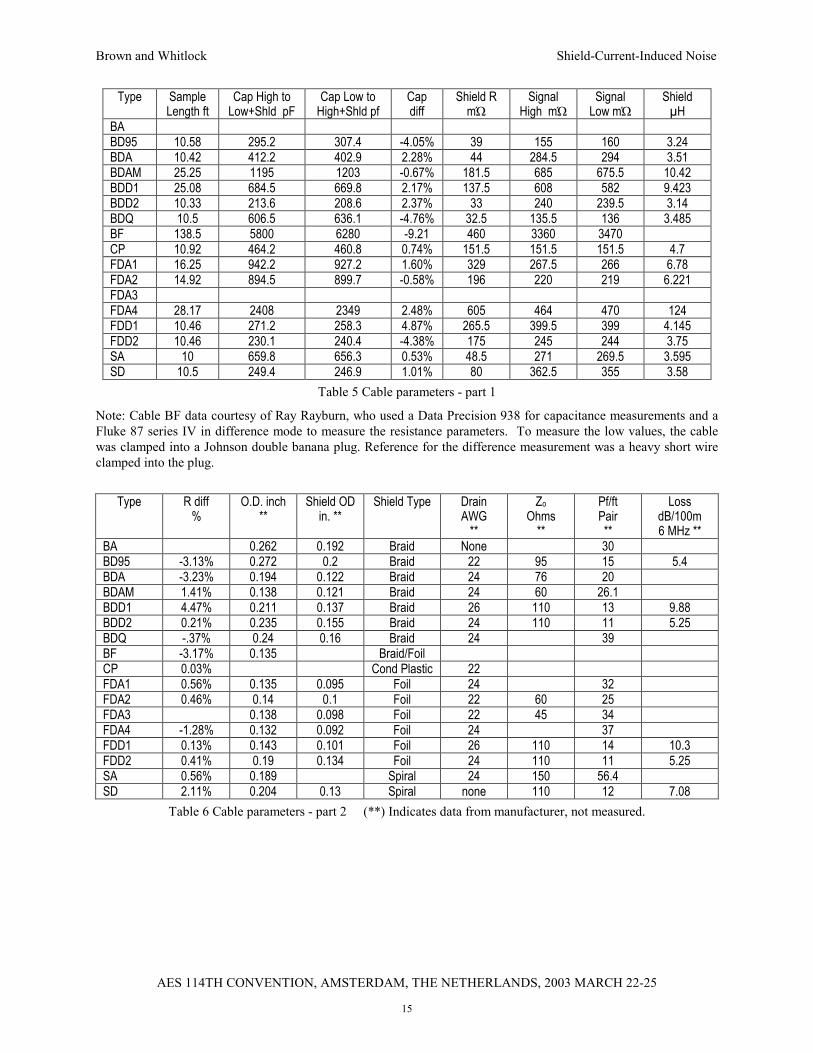
BA BD95 10.58 295.2 307.4 -4.05% 39 155 160 3.24 BDA 10.42 412.2 402.9 2.28% 44 284.5 294 3.51 BDAM 25.25 1195 1203 -0.67% 181.5 685 675.5 10.42 BDD1 25.08 684.5 669.8 2.17% 137.5 608 582 9.423 BDD2 10.33 213.6 208.6 2.37% 33 240 239.5 3.14 BDQ 10.5 606.5 636.1 -4.76% 32.5 135.5 136 3.485 BF 138.5 5800 6280 -9.21 460 3360 3470 CP 10.92 464.2 460.8 0.74% 151.5 151.5 151.5 4.7 FDA1 16.25 942.2 927.2 1.60% 329 267.5 266 6.78 FDA2 14.92 894.5 899.7 -0.58% 196 220 219 6.221 FDA3 FDA4 28.17 2408 2349 2.48% 605 464 470 124 FDD1 10.46 271.2 258.3 4.87% 265.5 399.5 399 4.145 FDD2 10.46 230.1 240.4 -4.38% 175 245 244 3.75 SA 10 659.8 656.3 0.53% 48.5 271 269.5 3.595 SD 10.5 249.4 246.9 1.01% 80 362.5 355 3.58
Table 5 Cable parameters - part 1
Note: Cable BF data courtesy of Ray Rayburn, who used a Data Precision 938 for capacitance measurements and a Fluke 87 series IV in difference mode to measure the resistance parameters. To measure the low values, the cable was clamped into a Johnson double banana plug. Reference for the difference measurement was a heavy short wire clamped into the plug.
Type R diff
% O.D. inch
** Shield OD
in. ** Shield Type Drain
AWG **
Zo Ohms
**
Pf/ft Pair **
Loss dB/100m 6 MHz **
BA 0.262 0.192 Braid None 30 BD95 -3.13% 0.272 0.2 Braid 22 95 15 5.4 BDA -3.23% 0.194 0.122 Braid 24 76 20 BDAM 1.41% 0.138 0.121 Braid 24 60 26.1 BDD1 4.47% 0.211 0.137 Braid 26 110 13 9.88 BDD2 0.21% 0.235 0.155 Braid 24 110 11 5.25 BDQ -.37% 0.24 0.16 Braid 24 39 BF -3.17% 0.135 Braid/Foil CP 0.03% Cond Plastic 22 FDA1 0.56% 0.135 0.095 Foil 24 32 FDA2 0.46% 0.14 0.1 Foil 22 60 25 FDA3 0.138 0.098 Foil 22 45 34 FDA4 -1.28% 0.132 0.092 Foil 24 37 FDD1 0.13% 0.143 0.101 Foil 26 110 14 10.3 FDD2 0.41% 0.19 0.134 Foil 24 110 11 5.25 SA 0.56% 0.189 Spiral 24 150 56.4 SD 2.11% 0.204 0.13 Spiral none 110 12 7.08
Table 6 Cable parameters - part 2 (**) Indicates data from manufacturer, not measured.

Brown and Whitlock Shield-Current-Induced Noise
AES 114TH CONVENTION, AMSTERDAM, THE NETHERLANDS, 2003 MARCH 22-25
16
Cable Type
Drain Re-sistance (R) Ω/318 m
Shield R w/o drain Ω/318 m
Total Shield R Ω/318 m
Drain cur-rent re total
Measured shield R Ω/318 m
Signal con-ductor R Ω/318 m
Shield O.D. in
Lay Length
in FDA1 26.18 86.5 -2.2 dB 20.246 16.462 .095 2.5 FDA2 14.75 111 13.1 -2.4 dB 13.137 14.745 0.1 FDA3 19.08 60.4 14.5 -2.4 dB 0.098 1.75 FDD1 38.19 75.7 25.4 -3.5 dB 25.38 38.19 0.1 FDD2 23.4 120 16.7 -2.9 dB 16.73 23.423 0.134 BDAM 27.13 10 7.3 -11.5 dB 7.188 27.129 0.121 1 BDA 27.3 4.8 4.1 -16.2 dB 4.23 27.3 0.122 0.5 BDD1 44.4 6.2 5.4 -18.2dB 5.48 24.24 0.137 1.5 BDD2 23.23 4.0 3.4 -17.2 dB 3.195 23.23 0.155 BD95 14.65 4.6 3.5 -12dB 3.686 14.65 0.2 2.75
Table 4 Cable shield Data
ANALYSIS OF SCIN DATA Data are presented in Figures 2-15. The results are consistent both with Muncy's measurements of spe-cific cable types and with his hypothesis that SCIN increases with frequency for nearly two decades above the audio spectrum. In fact, it continues to in-crease for most cables to at least 4 MHz, an arbitrary upper limit chosen for this experiment, and the au-thors have no reason to believe that it will not con-tinue to increase further. It was, for example, neces-sary to limit the bandwidth of the Scopemeter to 20 MHz to prevent corruption of the data by VHF televi-sion signals for many of the foil/drain-shielded ca-bles, even though the author's laboratory is in an area of only moderate field strength from these transmit-ters.
The measurements show that a few foil/drain-shielded cables offer better performance than others, but that, in general, all foil drain cables perform much more poorly than all braid shield cables. In general, any braid cable that also has a drain wire had greater mode conversion than a cable of similar construction without a drain wire.
In general, the degree of common mode conversion appears to be directly related to the conductance of the drain wire as compared to the conductance of the shield (i.e., foil, braid, or spiral) with which it is asso-ciated. For example, the braid-shielded cable having the poorest SCIN performance is a miniature cable with a drain wire whose cross sectional area is ap-proximately one quarter the effective cross sectional area of the braid. As will be seen, the magnitude of this factor appears to be limited to about 30 dB.
In general, measurements made on short lengths of cable correlate reasonably well with those taken on longer samples as long as the measured lengths are less than 1/20 wavelength at the test frequency. In any given real world cable installation, just as in the labo-
ratory setup, the distribution of voltage and current along the cable will vary with the wavelength of the interfering signal, the length of the cable, and bound-ary conditions established by surrounding objects and electrical terminations. For greater electrical lengths, the data becomes increasingly non-linear with respect to frequency due to voltage and current distributions along the cable acting both as an antenna and as a transmission line, and due to variations in distribution of the shield current with frequency. No attempt has been made to model or analyze these complex rela-tionships.
Normalization of Data To allow correlation of this data with Muncy's meas-urements, made with a current held constant at 100 mA, all data were normalized to a shield current of 100 mA. To allow comparison of data for cables of varying lengths, all data were normalized to the length of the longest samples measured, 125 ft (38 m) samples. Normalization for current was accomplished by multiplying the measured voltage by the ratio of 100 mA to the measured current. Figure 2 shows data normalized for 100 mA shield current, but not nor-malized for length, for the modeled cable, FDD1. Normalization for cable length was accomplished by multiplying the voltage already normalized for 100 mA shield current by the ratio of 125 ft to the actual length of the sample. Data are plotted as SCIN in dBV as a function of frequency for each cable type and for several cable lengths. Figure 3 is a plot of data for cable FDD1 normalized both for 100 mA shield current and for 125 ft (38 m) length, and all subsequent plots are normalized in this manner.
Since the cable is a linear system with respect to the magnitude of the excitation, there is no potential error in normalizing the data for current. Normalizing for length is not quite the same, in that it depends on the assumption that the voltages induced at every point in the line are in phase, and that the currents are of equal

Brown and Whitlock Shield-Current-Induced Noise
AES 114TH CONVENTION, AMSTERDAM, THE NETHERLANDS, 2003 MARCH 22-25
17
magnitude and in phase at every point on the cable. Such assumptions are generally good where the cable is shorter than 1/20 wavelength at the frequency of the interference, but becomes increasing erroneous as the electrical wavelength of the cable increases. Thus the normalization for length is simply an analytical convenience that may or may not be valid for any given cable and any given length. An analysis of the data suggests that normalization for length is valid for some cable types, frequencies, and cable lengths but is not valid for others.
Precision of Balance In general, measurements normalized for length yielded rather consistent results for cables having relatively high levels of SCIN (that is, cables with foil/drain shields and miniature braid-shielded cables with a drain wire), but gave inconsistent results for cables with relatively low levels of SCIN (most ca-bles having braid shields). The authors suspect that this is because the very precise balances required in cables and their wiring required to achieve low levels of SCIN can easily be upset by relatively small varia-tions in cable production tolerances and relatively small variations in how cables are terminated.
This can be more readily understood by remembering that balance in a system is the result of very precise cancellation of signals that are of precisely equal am-plitude, out of polarity, and with vary little phase dif-ference between them. Cancellation by 60 dB re-quires a level match of 0.1%. Although the cable it-self may have good balance, that balance will be changed when connections to it are routed through an XL connector, because the signal contacts are physi-cally asymmetrical to the shield contact by virtue of their spacing. Small variations in how the signal con-ductors and shield are arranged at the connector can also have an effect. Depending on the balance of the cable itself, the connector may either degrade or im-prove the balance of the capacitance between contacts and inductive coupling between the contacts. All of these effects were noted in the process of collecting and evaluating the data.
Figure 17 – The Circuit Model
Analysis Using the Circuit Model The circuit used to simulate behavior of the cable and test setup is shown above. H, L, and S indicate the signal high, signal low, and shield connections re-spectively at the cable ends. RH, RL, and RS are the dc resistances of the signal high, signal low, and shield conductors respectively. CH and CL are the capacitances to the shield of the signal high and sig-nal low conductors respectively (the signal high to signal low capacitances are insignificant to the analy-sis have been omitted). Each of these capacitances is halved and placed as shown to crudely approximated their distribution over the length of the cable. LTX is the mutual inductance of the ideal 3- winding trans-former. This transformer has a primary (heavier line) to signal-low secondary turns ratio of 1:1 (indicated at 1.000 T). TRH is the turns ratio of the signal-high secondary. LLH, LLL, and LLS are the leakage (un-coupled residual) inductances of the signal high, sig-nal low, and shield conductors respectively. Resistors RD are included to approximate the damping caused by skin effect in the conductors and dielectric losses in the capacitances in actual cables.
Various lengths of cable FDD1 were simulated using the circuit values in Table 5. Length 10 ft 25 ft 50 ft 125 ft RH, Ω 0.400 1.00 2.00 5.00 RL, Ω 0.400 1.00 2.00 5.00 RS, Ω 0.265 0.662 1.325 3.313 CH/2, pF 125 313 625 1563 Note 1 CL/2, pF 125 313 625 1563 Note 1 LTX, µH 3.50 8.75 17.50 43.75 TRH 1.012 1.012 1.012 1.012 LLH, µH 1.02 2.56 5.12 12.80 Note 2 LLL, µH 1.00 2.50 5.00 12.50 LLS, µH 0.50 1.25 2.50 6.25 RD, Ω 100 100 100 100 Note 3
Table 5 Circuit Values for Model
Note 1: CH to CL imbalances of 5% were used in some simulations.
Note 2: LLH is proportional to the square of TRH.
Note 3: RD value was changed in one simulation to show the effect of damping.
Since the impedance of an inductor rises linearly with frequency, a voltage with this characteristic will be produced across LTX. This will induce similar volt-ages in the two signal conductors. If they are equal, of course, there would be no differential and no SCIN. However, inasmuch as the effective turns ratio of signal high and signal low "windings" of the trans-

Brown and Whitlock Shield-Current-Induced Noise
AES 114TH CONVENTION, AMSTERDAM, THE NETHERLANDS, 2003 MARCH 22-25
18
former are mismatched, a fraction of the induced common-mode voltage will appear as differential. At audio frequencies, this is the dominant coupling mechanism. In the cable simulated here, a turns ratio mismatch of 1.2% (TRH = 1.012) produced an excel-lent correlation with the measured values at low fre-quencies. Figure 18 shows simulated SCIN for the four different lengths tested.
Figure 18 - Simulations of various lengths of cable FDD1 with 1.2% turns ratio error, matched capaci-tances, and RD = 100 ohms.
At some high frequency, roughly inversely propor-tional to cable length, an electrical resonance occurs. The main elements which resonate are leakage in-ductances and cable capacitances. At frequencies well below this resonance, the simulations tracked the measured data within about 3 dB. As frequency ap-proaches and exceeds this resonance, behavior be-comes quite complex and is strongly influenced by capacitance imbalances in the signal pair and damp-ing (losses) in the resonant elements.
Figure 19 Simulation of 25-foot length of cable FDD1 under same conditions as Fig 18 above, but with 5% mismatch in capacitances
Figure 20 - Simulation of 125-foot length of cable FDD1 under same conditions as Fig 18, but with RD = 1000 Ω.
Figure 19 shows the typical effect of a fairly common 5% capacitance imbalance, while Figure 20 shows the effect of much less damping than used in the other simulations. No attempt was made to simulate this high-frequency behavior since the test setup was in-tentionally configured to minimize the effects of cable capacitance and utilize an unbalanced instrument for output measurement. The simulation assumes, for example, that the balun used in the measurements is ideal (infinite CMRR) while we know that the real balun has unknown characteristics at high frequencies when the impedance of the driving source (the cable) rises. Using an instrument with a balanced input re-quires that it have extremely good CMRR at all the frequencies of interest, a requirement not easily met. However, the authors are eager to extend both the frequency range and the accuracy of these measure-ments.
Wavelength Figure 16 shows the relationship between frequency and electrical wavelength over the range of 1 kHz to 10 MHz. It should be noted that the electrical length of a conductor is a function of its diameter, and is typically on the order of 0.97 times the free space wavelength. The arbitrarily chosen value for the ve-locity of propagation, Vp of 0.66 is typical of shielded audio cable, but is by no means a standard.
The model is a simple one, and does not consider wavelength or the distribution of the excitation signal along the length of the cable. A 125 ft wire would be 1/4 wavelength long at approximately 2 MHz. A 125 ft transmission line having a velocity of propagation of 0.66 would be 1/4 wavelength at approximately 1.3 MHz. In general, voltage and current distributions along a wire or line can be ignored for line lengths less than about 1/20 wavelength and are still rela-tively minor for lengths up to about 1/10 wavelength.

Brown and Whitlock Shield-Current-Induced Noise
AES 114TH CONVENTION, AMSTERDAM, THE NETHERLANDS, 2003 MARCH 22-25
19
This translates to roughly 250 kHz and 500 kHz re-spectively for a 125 ft transmission line.
An analysis of the data in this light suggests that the measured data reasonably well reflect pure SCIN to at least 250 kHz for 125 ft samples, and may still be a reasonable first approximation up to about 500 kHz. Likewise, for 50 ft cables the data would appear to be valid to at least 500 kHz and a first approximation to 1 MHz, the 25 ft cable data should be valid for an octave above that, and the 10 ft data should be valid to at least 1.5 MHz and a first approximation to about 3 MHz.
It is important to realize that it is the electrical length of the cable at the frequency of the interfering signal that is important. Each individual audio cable run in an installation will behave differently as a result of its electrical length. Also, each individual audio cable run will behave differently as an antenna by virtue of its electrical length, its proximity to surrounding ob-jects, as well as its geometric orientation and expo-sure to the interfering field. The interfering voltage present at the input to electronic equipment will be the complex algebraic sum of all of the responses of the cable to all of the fields to which it is subjected.
Foil, Drain, and Braid Figures 2 and 3 show the SCIN performance of foil/drain-shielded cable type FDD1. Figure 4 shows the performance of the miniature braid/drain-shielded cable type BDAM, and Fig 5 shows the performance of foil/braid-shielded cable type BF. These cables are all nearly the same physical size and have the same size conductors, but their SCIN performance differs by nearly 30 dB. The differences are due to the drain wire or lack of it, and its resistance relative to the braid or foil. The relative resistances of foil and braid suggest that cable BDAM should have about 9 dB less SCIN than cable FDD1. The measured data show a difference of 8-10 dB over a broad frequency range, when resonances associated with various cable lengths are discounted.
Figure 14 compares the authors' data with Muncy's. Muncy measured 175 ft (53 m) samples and ex-pressed results in dB (u). The longest samples meas-ured here are 125 ft (38 m) and expressed in dB (V). Thus 5.1 dB was subtracted from Muncy's data and the result is plotted here. When noting the roughly 6 dB offset between the two sets of data, consider that all three cable types have been manufactured for at least three decades, and that cable samples for types BA and SA were from a stock of cables accumulated over a period of 25 years. Thus although the same nominal cable types were measured, they were almost certainly from very different manufacturing runs and
probably even from different factories. What is most consistent between the data are its trends -- foil/drain-shielded cables have at least 20 dB more SCIN than braid-shielded cables and measured SCIN increases approximately linearly with frequency.
AM Broadcast Data Measured SCIN data indicate that 20 mA of shield current at 0.5 - 1.5 MHz in typical braid-shielded cables 38 m long would produce differential mode voltages at equipment inputs on the order of 10-50 mV, and 100 - 500 mV in most foil/drain-shielded cables. Cable lengths of 175 - 500 ft will exhibit quarter-wave resonance in the AM broadcast band, a condition that will further increase current because the cable is a "better" antenna.
At first glance 20 mA might seem to be a lot of shield current for real world environments. A survey of cit-ies and suburbs around North America suggests that it might not be all that unusual. When AM broadcast stations were first built, their transmitters were sur-rounded by corn fields and swamps. Now the corn fields have been pushed much farther from cities, many of the swamps have been drained, and most of those same transmitters are surrounded by homes, businesses, and churches. Thus 20 mA of shield cur-rent is not at all out of line for audio system wiring running exposed through the ceiling of a church in such a neighborhood.
THE MECHANISMS OF SCIN The authors propose that shield-current-induced noise is the additive result of two basic sets of factors.
Shield Symmetry to Signal Pairs The first set of factors are those establishing the pre-cision of the balance of the coupling of shield current to the signal conductors (that is, the precise value of the ratio of the nominally 1:1:1 transformer). The most important of these factors are the makeup and construction of the shield and the absence or presence of a drain wire that is twisted in the same direction as the signal pair. For foil/drain-shielded cables and for very small diameter braid-shielded cables hav-ing a drain wire, the drain wire is almost always the dominant factor. For braid-shielded cables the presence of a drain wire generally increases SCIN but the effect is of much lesser significance than with foil shielded cables.
The Balance of the Signal Pair The second set of factors is related to the construction of the signal pairs and their relationship to the shield.
Brown and Whitlock Shield-Current-Induced Noise
AES 114TH CONVENTION, AMSTERDAM, THE NETHERLANDS, 2003 MARCH 22-25
20
These factors are the precision of the symmetry and balance of the signal pair's:
length and diameter (and thus their turns ratio to the shield)
inductance
mutual inductance to the shield
capacitance to the shield
physical positioning of the pair within the shield (influencing mutual inductance and capacitance)
twisting
insulation (dimensions and dielectric con-stant)
Thus to have low SCIN, a cable should have a braid shield and should be well manufactured to maintain a high degree of precision of the balance of all of its physical and electrical parameters with various condi-tions of installation, handling, and use.
SCIN is, by definition, a purely inductive mechanism, and thus increases linearly with frequency up to the frequency range where transmission line and antenna effects come into play. Other factors may be present and may also be causing mode conversion. For exam-ple, by virtue of IR drop along the shield a voltage gradient will exist along the length of the shield. Likewise, voltage gradients along the shield when the shield is a significant fraction of a wavelength will establish corresponding voltage gradients along the signal conductors and the capacitances between those conductors and the shield.
To the extent that skin effect and other similar factors do not modify the behavior of the cable at higher fre-quencies, the actual contribution of SCIN in a cable at high frequencies can be computed from its measured value at low frequencies and applying a linear multi-plier for the frequency difference.
Relative Magnitudes of the Effects Logic suggests that the magnitude of SCIN resulting from an asymmetrically coupled drain wire should be proportional to the fraction of the current flowing in that drain wire. When there is poor symmetry for shield current (as with a foil/drain shield) the contri-bution to SCIN from shield asymmetry is large and overwhelms the contribution of all of the remaining imbalances by something on the order of 10-20 dB. These remaining imbalances can include the line driver, line receiver, cable capacitances, cable resis-tances, and cable inductances. The measurements of
SCIN vs frequency in such cables tend to be fairly good approximations of straight lines.
When there is good symmetry for shield current, the shield imbalance contribution to SCIN is small and the contribution of the other imbalances dominates. SCIN vs frequency data for these cables tend to be far more varied, as the various reactive effects push and pull against each other, adding in some frequency ranges and at least partially canceling in others.
UNANSWERED QUESTIONS Some important questions remain. First, what hap-pens above 4 MHz? Do braid-shielded cables lose their advantage? The trends of the data suggest that they might. Are some constructions better than oth-ers? Is the significantly better performance of foil/drain-shielded cables FDA1 and FDA2 simply the result of a good day on the production line, or are they a superior design that can be duplicated and maintained?
Improving Foil-Shielded Cables Replacing the drain wire with a braid clearly im-proves SCIN performance to the level of good braid shielded cables. One manufacturer suggested that such cable would be more expensive to manufacture, but another did not. A major reason for the recent popularity of a drain wire in a braid-shielded cable is the ease of terminating the shield if only the drain wire is soldered. The authors strongly recommend against this practice. While the braid and drain may make reasonably good contact initially, over time corrosion can degrade the quality of that connection. The authors found that the presence of the relatively light braid of cable BF increased termination time only slightly as compared to a foil/drain-shielded cable.
The manufacturer of FDA1 also manufactures cable FDA4, and the manufacturer of FDA2 also manufac-tures FDD1 and FDD2. Engineers from both compa-nies have been made aware of this data. To date, nei-ther had any idea why FDA1 and FDA2 should have much better SCIN performance than other foil/drain cables.
The authors suggest the following as a possible ex-planation. If the drain wire were to have the same lay (that is, number of twists per unit length) as the signal pair, and if it were to lie precisely midway between the two signal conductors, it would couple equally to the two signal conductors and the induced voltages would cancel. Twisting the drain wire in the opposite direction from the signal pairs might also reduce the imbalance of the coupling between the drain and the

Brown and Whitlock Shield-Current-Induced Noise
AES 114TH CONVENTION, AMSTERDAM, THE NETHERLANDS, 2003 MARCH 22-25
21
two signal conductors. Either of these constructions might explain the results.
If such construction could be maintained to reason-able tolerances and not made an accident, it might be possible to significantly improve the SCIN perform-ance of foil/drain-shielded cable. Because detection of radio frequency interference is non-linear, a 10 dB reduction in the interfering signal can cause a 20-30 dB reduction in the audible interference or even eliminate it entirely.
CONCLUSIONS The implications of the data are clear. They are:
1. Current flow on the shield of a twisted-pair ca-ble produces a corresponding differential mode voltage on the twisted pair that is proportional both to frequency of the current and the length (therefore its inductance) of the cable for ca-bles that are shorter than 1/20 the wavelength of the interfering signal. This differential volt-age is called shield-current-induced noise or SCIN after Muncy.
2. Between 1/20 and 1/10 wavelength, SCIN will continue to increase approximately in propor-tion to frequency and cable length.
3. When a cable is longer than 1/10 wavelength at the frequency of the interfering current, com-plex, frequency-dependent terms will dominate and no easy prediction of SCIN can be made.
4. SCIN appears to include an additive term whose magnitude is approximately proportional to the fraction of the shield current that flows through a drain wire to the total shield current. The data suggest that the maximum degrada-tion caused by a drain wire is on the order of 25-30 dB.
5. SCIN appears to include algebraically additive reactive terms that result from imbalances in the lengths of the signal conductors, imbalances in the inductance of the signal conductors, and imbalances in the capacitances between the signal conductors and the shield. Because these reactive components have both positive and negative sign, because magnitude and phase of voltages and currents vary along the length of a cable longer than 1/20 wavelength, and because the mechanism of production of the current is so variable from one installation to another, prediction of these terms is a complex under-taking and unlikely to be worthy of the effort.
6. For cables less than 1/10 wavelength at the fre-quency of the shield current, reactive factors
are insignificant for foil/drain-shielded cables, and relatively low in influence with braid/drain-shielded cables.
7. For foil/drain-shielded cables, SCIN attribut-able to the drain wire is on the order of 20-30 dB greater than SCIN attributable to other fac-tors. For most braid-shielded cables having a drain wire, SCIN attributable to the drain wire is on the order of 10 dB greater than SCIN at-tributable to other factors.
8. Any asymmetry in the termination of a cable can degrade SCIN performance. This is most significant with cables having relatively good SCIN characteristics.
9. Manufacturing tolerances should be expected to cause variations the SCIN performance from one sample to another of braid-shielded cables.
10. Improved SCIN performance of foil-shielded cables is possible and should be a goal.
And most important:
Foil/drain-shielded cable should be avoided in any installation that could be subject to significant levels of shield cur-rent at frequencies above 1 kHz.
Drain wires that carry a significant frac-tion of shield current should be avoided.
Until foil/drain cable is universally re-placed by braid-shielded cable for per-manent installation, it is critical that au-dio equipment have good immunity to dif-ferential mode signals above the audio spectrum.
The bandwidth of audio systems should be limited to the minimum required to achieve good amplitude and phase re-sponse within the audio spectrum. In no case should the bandwidth of an audio system exceed 200 kHz
SCIN is probably active at UHF, so cir-cuit topologies should reject differential mode voltages to at least 1 GHz.
ACKNOWLEDGMENTS The authors would like to thank Ron Steinberg, Steve Kusiceil, David DeSmidt, Andrew Eckhart, Ray Rayburn and Dave Distler for their logistic support. Special thanks are due Neil Muncy and John Wood-gate for their advice and encouragement; and to Bruce Olson and Dr. Rachelle Weiss for their reviews of the draft.

Brown and Whitlock Shield-Current-Induced Noise
AES 114TH CONVENTION, AMSTERDAM, THE NETHERLANDS, 2003 MARCH 22-25
22
REFERENCES 1. N. Muncy, "Noise Susceptibility in Analog and Digital Signal Processing Systems," J. Audio Eng. Soc., vol. 43, No. 6, pp 435-453, 1995, June 2 B. Whitlock, Balanced Lines in Audio Systems: Fact, Fiction, and Transformers," J. Audio Eng. Soc., vol. 43, No. 6, pp 454-464, 1995, June 3 J. Windt, "An Easily Implemented Procedure for Identifying Potential Electromagnetic Compatibility Problems in New Equipment and Existing Systems: The Hummer Test," J. Audio Eng. Soc., vol. 43, No. 6, pp 484-487, 1995, June 4 John Schmidt, ABC-TV, NYC, Personal communication with authors. 5 Federal Communications Commission, "Rules and Regulations Vol III Part 73," section 73.184 Wash-ington, D.C., 1968