commonwealth of kentucky quarterly …osbd.ky.gov/publications/quarterly economic and...
TRANSCRIPT

COMMONWEALTH OF KENTUCKY
Quarterly Economic & Revenue Report
First Quarter Fiscal Year 2010
Governor’s Office for Economic Analysis
Office of State Budget
Director

KentuckyUnbridledSpirit.com An Equal Opportunity Employer M/F/D
Office of State Budget Director Capitol Building, 700 Capitol Avenue
Frankfort, Kentucky 40601
(502) 564-2611 or (502) 564-7300 FAX: (502) 564-7022 or (502) 564-6684 Internet: osbd.ky.gov
Governor’s Office for Policy and Management Governor’s Office for Economic Analysis
Governor’s Office for Policy Research October 30, 2009 The Honorable Steven L. Beshear Governor Commonwealth of Kentucky State Capitol Building Frankfort, KY 40601 Dear Governor Beshear: The attached Quarterly Economic and Revenue Report summarizes the revenue and economic statistics for the first quarter of Fiscal Year 2010 (FY10). It also includes an interim economic and revenue forecast for the last three quarters of FY10. General Fund receipts for the first quarter of FY10 totaled $1,968.5 million, a decrease of 5.6 percent compared to the same period in FY09. Road Fund revenues totaled $302.6 million, a decrease of 3.0 percent from the first quarter of FY09. The interim General Fund forecast for the final three quarters of FY10 calls for a decrease of 2.8 percent compared to the same period one year ago, resulting in a projected decline of 3.5 percent for the entire fiscal year. The interim forecast for the Road Fund for the final three quarters of FY10 calls for a decline of 1.2 percent, resulting in a projected decline of 1.6 percent for the entire fiscal year. Compared to the current official revenue estimates, the interim General Fund forecast for FY10 falls $160.9 million short. For the Road Fund, the interim forecast is $31.4 million higher than the current official forecast. We will continue to monitor the economic and fiscal conditions of the Commonwealth and will keep you apprised of developments. Sincerely,
Mary E. Lassiter State Budget Director Attachment
Steven L. Beshear Governor
Mary E. Lassiter State Budget Director
1 ....................................................... Executive Summary
5 ........................ Revenue Receipts - First Quarter 2010
9 ................................................................. The Economy
15 ........................................................... Interim Outlook
23 ..................... Appendix: First Quarter 2010 Receipts
TABLE OF CONTENTS
5 ....................................................... General Fund7 ........................................................... Road Fund
9 ............................................... National Economy11 ........................................... Kentucky Economy
15 ..................................................... General Fund17 .......................................................... Road Fund19 ............................................................. Economy20 ............................................. National Economy21 ................................................... State Economy

Governor's Office for Economic Analysis First Quarter FY2010
-1 -
Quarterly Economic & Revene Report First Quarter 2007Executive Summary
In accordance with KRS 48.400(2), the Officeof State Budget Director has prepared aQuarterly Economic and Revenue Report forthe first quarter of FY10. This report includesa current synopsis of the economic and fiscalconditions of the Commonwealth, as well asan outlook for the next three fiscal quarterswhich represent the final three quarters ofFY10.
General Fund receipts fell 5.6 percent in thefirst quarter of FY10, marking the thirdconsecutive quarterly decline in the GeneralFund. Road Fund receipts dipped 3.0 percent,a sixth consecutive quarterly decline.
The major sources of weakness in the GeneralFund for the first quarter were the individualincome and sales taxes, which togethercomprise approximately three-quarters of theGeneral Fund revenues. Individual incometax receipts fell 7.1 percent while the sales taxplummeted 7.7 percent. Due to timing, mostof the income tax payments received in thefirst quarter were payroll taxes collectedthrough withholding. The large rate of declineis directly attributable to fewer employedpersons and anemic wage growth stemmingfrom the underlying economic downturn. Thestory is largely the same for the Kentuckysales tax. The cumulative loss of employmentin Kentucky since the recession began has
taken an exacting toll on sales tax collections.Counterbalancing occurred as tobacco taxreceipts surged on the strength of the rateincrease which took effect in April, but themagnitude was not enough to preservepositive General Fund growth in the firstquarter.
In recent comparison, the Road Fundperformance was encouraging despite falling3.0 percent. The string of 18 consecutivemonthly declines in the Road Fund wassnapped in June, 2009. Since then the RoadFund has posted three more negative months,but the rates of decline are getting closer tozero. The motor fuels tax account in particularwas a pleasant surprise in the first quarter.Despite no change in the fuels tax rate vis-à-vis the prevailing rate one year ago, receiptsclimbed 2.7 percent over the first quarter ofFY09. Such growth can only be accomplishedthrough a higher number of gallons sold in2009, a very encouraging sign. However, theother components of the Road Fund joinedforces to completely swamp the growth in thefuels area to generate another negativequarter in aggregate collections. Weightdistance tax collections in particular werenotably weak with a -16.1 percent decline.This so-called truck-mile tax has, as its base,apportioned miles driven by licensed motorcarriers. The large rate of decline in this

Governor's Office for Economic Analysis First Quarter FY2010
-2-
revenue source underscores the reality that arobust economic recovery has yet to hit theCommonwealth.
The remainder of this executive summarywill concentrate on the highlights of theoutlook portion of this report. ProjectedGeneral Fund revenues for the next threequarters are shown in Table 5. The revenueoutlook presented in this report is identical tothe October 12, 2009, preliminary estimatesrendered by the Consensus ForecastingGroup (CFG). The standing official estimatesfor FY10 date back to the May 2009 revisionsto the enacted budget estimates. Theseestimates were modified slightly inrecognition of the actions of the regular andextraordinary sessions of the 2009 GeneralAssembly.
In May 2009, the CFG lowered the GeneralFund estimates for FY10 by $996.0 million to$8,300.0 million due to the length andunanticipated severity of the currentrecession. Legislation enacted subsequentto the official revenue revisions resulted in aminor reduction of $4.1 million, resulting inthe current official General Fund estimatefor FY10 of $8,295.9 million. The interimestimates included in this report projectGeneral Fund revenues in FY10 equal to$8,135.0 million, an amount $160.9 millionbelow the current official estimate.
A similar pattern of revisions occurred for theKentucky Road Fund. In fact, the currentrecession has hit the manufacturing sectorsparticularly hard, so the reductions to theRoad Fund have greatly exceeded the GeneralFund revisions in percentage terms. TheFY10 enacted estimate from January 2008for the Road Fund was $1,405.1 million. InMay of 2009, the enacted estimates wereofficially lowered to $1,166.0 million. The
reduction totaled $239.1 million,approximately 17.0 percent. Kentucky’scurrent official estimate for the Road Fund inFY10 is $1,141.0 million, owing to legislationenacted subsequent to the official revenuerevisions in May.
The unofficial interim estimate in this reportis $1,172.5 million. As with the General Fund,this estimate represents the forecast renderedby the CFG at the October 12, 2009 meeting.When compared to the current officialestimate, the new interim outlook is $31.5million higher.
Due to the depth and duration of the currentnational recession, a clean, robust, andimmediate recovery appears rather unlikely.Rather, the economy appears poised to movesideways until economic agents can morepositively identify that the tide has turned.Businesses, faced with slumping currentsales, will continue to be exceedingly cautiousabout expanding production andemployment. Moreover, caution aboutcurrent production decisions seems to bebleeding over into extreme caution aboutfuture production plans, which will furtherdelay any meaningful rebound in businessplanned investment.
An examination of the projections used bythe CFG and staff reveal a quantitativedepiction of the aforementioned narrative.The final three quarters of FY10 are expectedto produce GDP growth of 0.5 percent in theforecast, thus ending the period of decliningnational production. However, personalincome is only expected to grow by a tepid 0.3percent, which is well below historical growthduring recovery periods. More importantly,employment is expected to decline 2.5 percentin the next three quarters, representingnational employment losses of 3.3 million.
Executive Summary
Governor's Office for Economic Analysis First Quarter FY2010
-3 -
Quarterly Economic & Revene Report First Quarter 2007
Manufacturing employment losses represent1.0 million of the total employment decline.
The short-run outlook for the Kentuckyeconomy is dominated by weaknesses in theemployment sector. Kentucky employmentis expected to fall 2.3 percent during the finalthree quarters of FY10, as goods-producingsectors will experience the most pronouncedweakness. Construction employment isexpected to fall 11.3 percent for the remainder
of FY10 as the economy tries to work throughlarge inventories of commercial real estateand vacancies. Manufacturing employmentis expected to fall 8.4 percent, or 18,600positions, during the same period. Losses inthe goods-producing sectors are especiallyhard on the state economy due to the profoundeffect that these sectors have on supportingbusinesses that rely on a robust regionaleconomy as their customer base.
Executive Summary

Governor's Office for Economic Analysis First Quarter FY2010
-4-
This page intentionally left blank

Governor's Office for Economic Analysis First Quarter FY2010
-5 -
Quarterly Economic & Revene Report First Quarter 2007Revenue Receipts
GENERAL FUNDFirst Quarter, FY10
General Fund receipts in the first quarter ofFY10 totaled $1.968 billion compared to$2.085 billion in the first quarter of FY09, fora decline of 5.6 percent or $116.5 million.Collections in the major revenue categoriesare shown in summary form in Table 1.
Detailed information on these and otheraccounts is available in the Appendix.Receipts in the first quarter of FY10 reflectthe weak economic conditions in the U.S.and Kentucky as well as tax law changes.Poor employment data and the nationalfinancial crisis depressed first quarterindividual income, corporation income, andsales and use tax receipts. A portion of the
economic decline was counterbalanced withincreased collections from the doubling of thetax rates on cigarette and other tobaccoproducts that went into effect in April 2009.
The sales and use tax fell 7.7 percent in thefirst quarter of FY10 as consumers continuedto retrench and limit their purchases oftaxable goods. Receipts of $693.9 millioncompare to the $751.4 million collected in thefirst quarter of FY09. Sales and use taxcollections have now fallen for four consecutivequarters, the longest such streak of declinesin the modern history of the sales tax.
Individual income tax receipts declined 7.1percent in the first quarter of FY10. Receiptsof $814.4 million were $62.2 million less thanwas collected in the first quarter of the previousfiscal year. The withholding component ofthe individual income tax is especiallyvulnerable to the continued weakness in theKentucky labor market, as fewer workers havedepressed payroll incomes and withholdingcollections.
Corporation income tax posted a decrease of40.5 percent, or $33.3 million, during the firstquarter of FY10. Receipts totaled $49.0 millioncompared to the $82.4 million received a yearearlier. September is a declaration paymentmonth for calendar year filers. The weakdeclaration payments received in Septemberwere a continuation of the weak performance
Table 1Summary General Fund Receipts
First Quarter, FY10(mil $)
Diff DiffFY010 FY09 ($) (%)
Sales and Use 693.9 751.4 -57.5 -7.7Individual Income 814.4 876.7 -62.2 -7.1Corp Inc. & LLET 79.6 94.3 -14.7 -15.6Coal Severance 66.8 72.7 -5.8 -8.0Cigarette Taxes 74.3 41.4 32.9 79.5Property 60.1 63.8 -3.6 -5.7Lottery 44.0 43.0 1.0 2.3Other 135.3 141.7 -6.5 -4.6
TOTAL 1,968.5 2,084.9 -116.5 -5.6

Governor's Office for Economic Analysis First Quarter FY2010
-6-
Figure 1First Quarter, FY10
General Fund Receipts
recorded in the June cycle of income taxdeclarations.
The limited liability entity tax (LLET) sawan increase in tax collections in the firstquarter of FY10 when compared to FY09.Total collections in the current fiscal yeartotaled $30.5 million and compare to revenuesof $11.9 million in the same period a yearearlier. The increased revenue collectionsare largely the result of compliance activityconducted by the Department of Revenue.
The coal severance tax decreased 8.0 percentas coal prices have moderated from the recordlevels of recent months. Receipts of $66.8million compare to $72.7 million collected inthe first quarter of FY09.
Cigarette taxes grew 79.5 percent in the firstquarter with receipts of $74.3 million. The$32.9 million increase over FY09 first quarterreceipts is the result of a doubling of the taxrate to 60 cents per pack. Other tobaccoproducts (such as cigars, pipe tobacco, chewingtobacco, snuff,) also posted a similar bulge incollections (140.1 percent) due to a doublingof the tax rate in April 2009.
Property taxes were down 5.7 percent in thefirst quarter of FY10 due to timing ofcollections in the tangible and public serviceproperty accounts. Collections of $60.1 millioncompare to $63.8 million received in the firstquarter of the prior fiscal year.
Lottery receipts increased 2.3 percent in thefirst quarter of FY10 with revenues of $44.0million.
The “Other” category represents theremaining accounts in the General Fund,and collections in this account decreased 4.6percent with receipts of $135.3 million.
Figure 1 details the composition of first-quarter General Fund receipts by tax type.Seventy-seven percent of General Fundrevenues were collected in the areas of theindividual income and sales taxes. The nextlargest source of revenue was the “other”account at 7 percent. The major componentsin this category include inheritance taxes,insurance premium taxes, beer wholesalesales tax, telecommunications taxes, and thenatural gas severance tax. Cigarette, andthe combination of corporation income andLLET taxes each accounted for 4 percent ofthe total while property and coal severancetaxes each accounted for 3 percent of therevenues. Finally, lottery receipts accountedfor 2 percent of the General Fund.
Coal Severance3%
Cigarette Taxes4%
Property3%
Lottery2%
Corporation Inc. & LLET
4%
Sales and Use35%
Other7%
Individual Income42%
Revenue Receipts
Governor's Office for Economic Analysis First Quarter FY2010
-7 -
Quarterly Economic & Revene Report First Quarter 2007
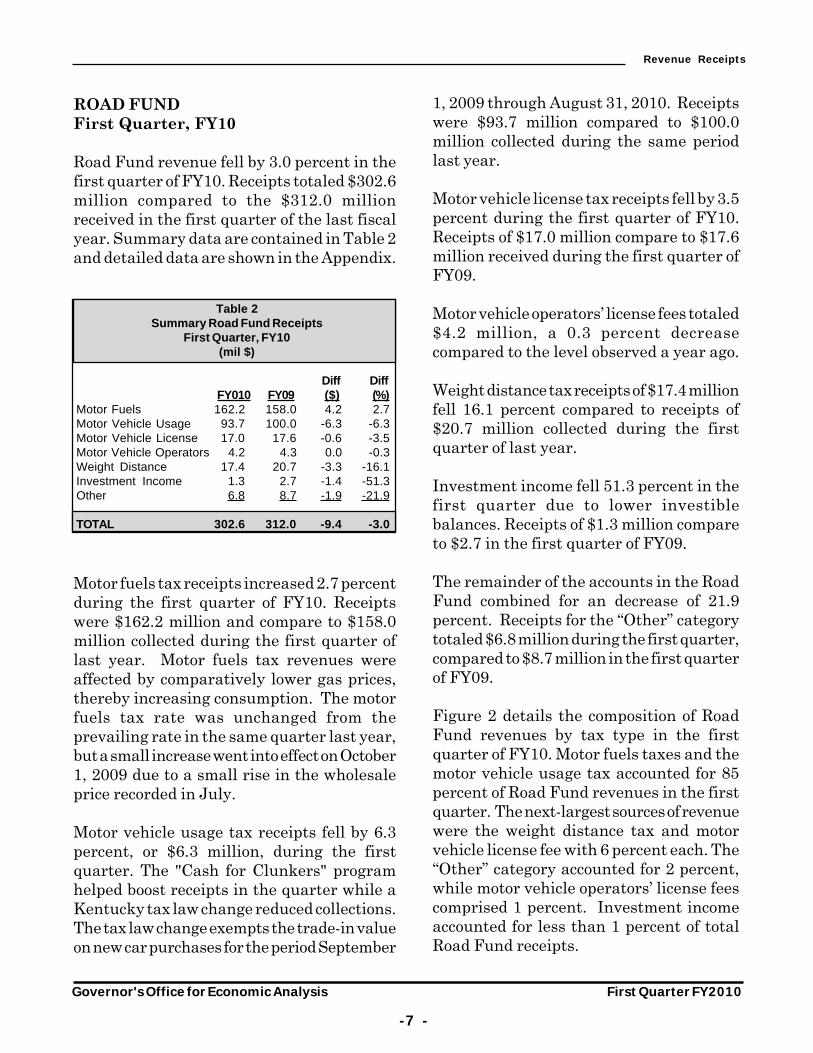
Table 2Summary Road Fund Receipts
First Quarter, FY10(mil $)
Diff DiffFY010 FY09 ($) (%)
Motor Fuels 162.2 158.0 4.2 2.7Motor Vehicle Usage 93.7 100.0 -6.3 -6.3Motor Vehicle License 17.0 17.6 -0.6 -3.5Motor Vehicle Operators 4.2 4.3 0.0 -0.3Weight Distance 17.4 20.7 -3.3 -16.1Investment Income 1.3 2.7 -1.4 -51.3Other 6.8 8.7 -1.9 -21.9
TOTAL 302.6 312.0 -9.4 -3.0
ROAD FUNDFirst Quarter, FY10
Road Fund revenue fell by 3.0 percent in thefirst quarter of FY10. Receipts totaled $302.6million compared to the $312.0 millionreceived in the first quarter of the last fiscalyear. Summary data are contained in Table 2and detailed data are shown in the Appendix.
Motor fuels tax receipts increased 2.7 percentduring the first quarter of FY10. Receiptswere $162.2 million and compare to $158.0million collected during the first quarter oflast year. Motor fuels tax revenues wereaffected by comparatively lower gas prices,thereby increasing consumption. The motorfuels tax rate was unchanged from theprevailing rate in the same quarter last year,but a small increase went into effect on October1, 2009 due to a small rise in the wholesaleprice recorded in July.
Motor vehicle usage tax receipts fell by 6.3percent, or $6.3 million, during the firstquarter. The "Cash for Clunkers" programhelped boost receipts in the quarter while aKentucky tax law change reduced collections.The tax law change exempts the trade-in valueon new car purchases for the period September
1, 2009 through August 31, 2010. Receiptswere $93.7 million compared to $100.0million collected during the same periodlast year.
Motor vehicle license tax receipts fell by 3.5percent during the first quarter of FY10.Receipts of $17.0 million compare to $17.6million received during the first quarter ofFY09.
Motor vehicle operators’ license fees totaled$4.2 million, a 0.3 percent decreasecompared to the level observed a year ago.
Weight distance tax receipts of $17.4 millionfell 16.1 percent compared to receipts of$20.7 million collected during the firstquarter of last year.
Investment income fell 51.3 percent in thefirst quarter due to lower investiblebalances. Receipts of $1.3 million compareto $2.7 in the first quarter of FY09.
The remainder of the accounts in the RoadFund combined for an decrease of 21.9percent. Receipts for the “Other” categorytotaled $6.8 million during the first quarter,compared to $8.7 million in the first quarterof FY09.
Figure 2 details the composition of RoadFund revenues by tax type in the firstquarter of FY10. Motor fuels taxes and themotor vehicle usage tax accounted for 85percent of Road Fund revenues in the firstquarter. The next-largest sources of revenuewere the weight distance tax and motorvehicle license fee with 6 percent each. The“Other” category accounted for 2 percent,while motor vehicle operators’ license feescomprised 1 percent. Investment incomeaccounted for less than 1 percent of totalRoad Fund receipts.
Revenue Receipts

Governor's Office for Economic Analysis First Quarter FY2010
-8-
Figure 2First Quarter, FY10
Road Fund Receipts
Motor Fuels 54%
Motor Vehicle Usage31%
Motor Vehicle Operators1%
Investment Income0%
Weight Distance6%
Motor Vehicle License6%
Other2%
Revenue Receipts

Governor's Office for Economic Analysis First Quarter FY2010
-9 -
Quarterly Economic & Revene Report First Quarter 2007The Economy
1 Annual chained 2005 dollars. Source: Federal ReserveBoard of St. Louis
NATIONAL ECONOMY
Real gross domestic product (real GDP) isthe broadest measure of economic activityfor a nation. It is defined as the sum of allgoods and services created within a country’sphysical boundaries in a given year. RealGDP can be broken down into fivecomponents: consumption, investment,government expenditures, imports andexports. Real GDP for the United States isestimated to have fallen to $13,009 billionin the first quarter of FY10.
Real GDP declined by $315.3 billion, a 2.4percent decline, in the first quarter of FY10over the first quarter in FY09. However,real GDP increased by $77.1 billion, a 0.9percent increase, compared to the fourthquarter of FY09. So in absolute terms, realGDP may have reached its trough duringthe fourth quarter of FY09. Assuming thatthe fourth quarter of FY09 was the trough,then real GDP lost a net $522.8 billion, aloss of 3.9 percent of real GDP from peak totrough. Historically speaking, the 2007recession is the worst recession since theGreat Depression. Using annual figures,real GDP fell by 26.7 percent during theGreat Depression from 1929 to 1933.1 Thenext worst recession was the 1973 recession.During the 1973 recession, real GDP fell by
$135.7 billion, a 3.1 percent net decline frompeak to trough.
Real consumption, the largest component ofreal GDP, made up 71.0 percent of GDP in thefirst quarter of FY10. The last seven quartershave been very weak for real consumption.Consumption has declined in four of the lastseven quarters. Nonetheless, consumptionincreased by $48.9 billion, or 0.5 percent, inthe first quarter over the fourth quarter ofFY09. During the previous four quarters,adjacent-quarter growth was -0.9, -0.8, 0.2 and-0.2 percent, respectively. Normal expansionperiod growth for real consumption is typicallybetween 0.3 percent and 1.5 percent on anadjacent quarter basis. Instability in the labormarket, tighter credit and low consumersentiment are all causes of the weakconsumption figures. While consumption hasbeen weak, it is investment spending whichhas been the largest drag on the economy.
Real investment is the smallest but the mostvolatile of the five real GDP components. Realinvestment made up 11.8 percent of real GDPin the first quarter of FY10. Real investmentgrew by $76.1 billion, or 5.2 percent, over thefourth quarter of FY09. However, realinvestment has declined in 11 of the last 14quarters. During that time, investment haslost a net $735.2 billion or 32.5 percent. Thegreat majority of those losses occurred in thefinal three quarters of FY09. Real investmentincludes the construction/sale of new homes

Governor's Office for Economic Analysis First Quarter FY2010
-10-
FY10 FY09 Chg % ChgReal GDP ($ billions) 13,009.3 13,324.6 -315.3 -2.4 Real Consumption ($ billions) 9,235.6 9,267.7 -32.1 -0.3 Real Investment ($ billions) 1,529.5 1,990.7 -461.2 -23.2 Real Govt. Expenditures ($ billions) 2,590.8 2,536.6 54.2 2.1 Real Exports ($ billions) 1,454.2 1,655.2 -201.0 -12.1 Real Imports ($ billions) 1,818.3 2,134.4 -316.1 -14.8Personal Income ($ billions) 11,979.0 12,286.6 -307.6 -2.5Inflation (% chg of CPI) 0.8 1.5 NA NAIndustrial Production Index (% chg) 1.0 -2.3 NA NACivilian Labor Force (millions) 154.4 154.7 -0.2 -0.1Total Nonfarm Employment (millions) 131.3 137.0 -5.7 -4.2Manufacturing Employment (millions) 11.8 13.4 -1.6 -12.0Unemployment Rate (percent) 9.5 6.1 NA NA
Not Seasonally Adjusted. Real series are in billions of chained 2000 dollars. GDP components may not sum due to rounding at lower levels of detail. Data for FY10 Q1 are estimates.Source: IHS Global Insight Inc., September 3, 2009 data release
Table 3Summary of US Economic Series
First Quarter FY09/FY10October 2009
First Quarter
and renovation of existing homes, but doesnot include the sale of existing homes.
Real government expenditures increasedsharply during the first quarter of FY09,increasing by 1.2 percent in one quarter.Then during the third quarter of FY09,government expenditures declined by 0.7percent. The last five quarters of growth were1.2, 0.3, -0.7, 1.6, and 0.9 percent, respectively.
Since 1959, the ratio of governmentexpenditures to GDP has been in a state ofrelative decline. The high of 29.4 percentoccurred in the second quarter of 1961. Theratio reached a low of 18.4 percent in the thirdquarter of FY07. Since the third quarter ofFY07, the ratio has been on a steady riseagain. The ratio of government expendituresto GDP was 19.9 percent in the first quarter ofFY10. Government expenditures aretypically countercyclical, increasing duringcontractions, as unemployment insurancepayments and many needs-based programexpenditures are increasing. High growth
occurred in defense outlays and transferpayments for the last several quarters.
Real exports increased for the first time infive quarters. In the first quarter of FY10,real exports increased by $37.8 billion or 2.7percent over the fourth quarter of FY09. Thepreceding four quarters of growth were -0.9,-5.3, -8.5, and -1.3 percent, respectively.Assuming the fourth quarter was the trough,the net loss from peak to trough for exportswas $254.0 billion, or a 15.2 percent loss. Theworld-wide recession hit Europe and Asiasome time after the U.S. Despite a weakerdollar, which should help exports, the rest ofthe world is also mired in a recession withdecreased spending just like the U.S.
U.S. personal income decreased by 0.1 percentin the first quarter of FY10 over the fourthquarter of FY09. This is the fourth time infive quarters that personal income hasdeclined. Personal income is down a net$313.9 billion or 2.6 percent since the fourthquarter of FY08, the previous peak. This is a
much deeper recession forU.S. personal incomethan in previousrecessions. U.S. personalincome slowedconsiderably during the2001 recession and onlydeclined during onequarter (-0.01 percent inFY02Q1).
U.S. unemployment hasgrown sharply over thelast three quarters. Theunemployment rate inthe first quarter of FY10was 9.5 percent, up from6.1 percent just a yearprior. There is typically alag between declines in
The Economy

Governor's Office for Economic Analysis First Quarter FY2010
-11 -
Quarterly Economic & Revene Report First Quarter 2007
employment and declines in personal income.In the short term, individuals can prop uppersonal income by decreasing payments intotheir 401(k) plans or even make withdrawalsfrom their 401(k) or other pension funds.This is the worst unemployment spell sinceFY83 when there were three consecutivequarters with the employment rate above 10percent.
Employment continues to decline acrossseveral sectors. Total non-farm employmentdeclined by another 0.7 percent in the firstquarter. That is the seventh consecutivedecline for non-farm employment. Theprevious peak for non-farm employment wasin the second quarter of FY08 with 138.0million employed. Since that time,employment has declined by a net 6.7 millionjobs, a 4.9 percent decline. U.S.manufacturing employment has been in astate of decline since before the recessionofficially began. U.S. manufacturingemployment has declined for the last 14consecutive quarters. The previous peakoccurred the third quarter of FY06 with 14.2million employed. Since then employmenthas fallen by 2.4 million, or a net loss of 17.1percent.
KENTUCKY ECONOMY
There is no official measure for recessionstarting points for states. In many cases, ananalysis of the key macroeconomic series forthe state, personal income and employmentcan provide a reasonable estimate of thoseturning points for states. The majority of thekey series started actively declining betweenApril and August of 2008. This is four toeight months after the official starting pointof the 2007 recession. So it can be said thatthe ‘Kentucky recession’ starting point laggedthe U.S. starting point. Kentucky’s expansionperiod also typically starts after the national
expansion has begun. The official turningpoints in the U.S. business cycle are identifiedby the National Bureau of EconomicResearch (NBER). The most recentlydetermined turning point by NBER isDecember 2007 as the last contractionstarting point. As of October 16, 2009, theexpansion period has not been determinedfor the nation.
Personal income growth has been weak inKentucky for the last five quarters. The lastfive quarters of growth were -0.4, 0.1, 0.1, 0.8and -0.3 percent, respectively. The decline inthe first quarter of FY09 resulted in a loss of$578 million in personal income, while thedecline in the first quarter of FY10 resultedin a loss of $462 million in personal income.Personal income does not always declineduring a recession. During the 2001 recession,Kentucky personal income did not fall duringany quarter. This was because wages andsalaries are a large component and itcontained a strong positive trend. Also,increases in transfer payments can make upfor some of the lost income in wages, interestor rents. Kentucky personal income is now0.7 percent above its level from a year ago.
Kentucky wages and salaries, which make up52.2 percent of personal income, declined forthe third consecutive quarter. The FY10 firstquarter decline of 0.1 percent was modest,but the preceding two quarters, -1.0 percentand -1.4 percent growth, respectively weresubstantial single-quarter declines. In justthe last three quarters, Kentucky wages andsalaries have declined by a net $1,776.2million, a 2.4 percent decline.
Kentucky non-farm employment has declinedfor seven consecutive quarters. The largestsingle quarter decline occurred in the thirdquarter of FY09 with a loss of 32,300 jobs or a1.8 percent loss. In the first quarter of FY10,
The Economy

Governor's Office for Economic Analysis First Quarter FY2010
-12-
FY10 FY09 Chg % ChgPersonal Income ($ billions) 137,376.7 136,473.0 903.7 0.7 Wages and Salary Income ($ billions) 71,723.8 73,414.0 -1,690.2 -2.3
Nonagricultural Employment (thousands) 1,774.6 1,853.8 -79.1 -4.3 Goods Producing (thousands) 300.8 352.3 -51.5 -14.6 Construction 68.5 84.8 -16.3 -19.2 Mining 25.5 24.3 1.2 5.1 Manufacturing 206.7 243.2 -36.5 -15.0 Service Providing (thousands) 1,153.0 1,180.3 -27.2 -2.3 Trade, Transportation & Utilities 364.9 382.6 -17.6 -4.6 Information 28.9 29.9 -1.0 -3.2 Finance 90.1 91.9 -1.7 -1.9 Business Services 177.5 182.6 -5.2 -2.8 Educational Services 247.2 245.4 1.8 0.7 Leisure and Hospitality Services 171.3 172.9 -1.5 -0.9 Other Services 73.0 75.0 -2.0 -2.6Government (thousands) 320.9 321.2 -0.4 -0.1
Not Seasonally Adjusted. Data for FY10 Q1 are October 2009 estimates.Source: IHS Global Insight Inc. and Governor's Office for Economic Analysis MAK model
First Quarter
First Quarter FY09/FY10October 2009
Table 4Summary of Kentucky Economic Series
non-farm employment declined by 6,900 or a0.4 percent loss. The previous peak occurredin the second quarter of FY08; Kentucky non-farm employment was 1,871.2 million. Sincethen a net 96,600 seasonally adjusted jobshave been lost. This is a net decline of 5.2percent in non-farm employment. Bycomparison, Kentucky lost 52,800 seasonallyadjusted jobs, a 2.9 percent drop, from peak totrough during the 2001 recession. It is notclear whether Kentucky non-farmemployment has found a bottom yet duringthe current recession.
The losses in Kentucky employment havebeen pretty evenly distributed across thesubsectors. Education and health services isthe only employment sector which has notexperienced a decline at all over the lasteight quarters. Growth rates in that sectorhave softened slightly, but not as significantlyas the other sectors. Employment in thefinancial services and business servicessectors both increased during the first quarter
of FY10 with 1.0 percent and 1.7 percentgrowth, respectively. This was followingmoderate to large declines in the majority ofthe last six quarters for those service sectors.
Manufacturing employment, which makesup 11.6 percent of non-farm employment inKentucky, has been in state of decline sinceMay of 2000, which was the last peak for theseasonally adjusted series. There was nopeak at any time during the last expansionperiod. In May of 2000, there were 312,100seasonally adjusted manufacturing jobs in
Kentucky. The2001 recessionofficially ended inNovember of 2001,but the freefall inK e n t u c k ymanufacturing jobsdid not stop untilApril of 2003 whenm a n u f a c t u r i n ge m p l o y m e n treached 264,600.This is a loss of47,500 jobs, a netdecline of 15.2percent. The periodfrom April 2003 toDecember 2007,which is the officialstarting point of thec u r r e n tc o n t r a c t i o n ,
contained a mixture of small declines andlateral movements for Kentuckymanufacturing employment. The fewmonthly gains that did occur in that time justbarely made up the losses from the previousmonth’s losses. From December 2007 toAugust 2009, Kentucky manufacturingemployment lost 44,600 seasonally adjustedjobs, a 17.6 percent decline. There was somesolid growth for one month in July, but it was
The Economy

Governor's Office for Economic Analysis First Quarter FY2010
-13 -
Quarterly Economic & Revene Report First Quarter 2007
completely eliminated by the losses inAugust. It does not appear thatmanufacturing employment has found abottom yet.
Since the beginning of the recessionmanufacturing employment has been thelargest loser in absolute numbers, butconstruction employment was the largestloser in terms of percent losses. Since thebeginning of the recession until the firstquarter of FY10, construction employmenthas lost 17,900 non-seasonally adjusted jobs,a 20.7 percent decline in just seven quarters.This is a reflection of the decline in residentialhousing construction in Kentucky as well asthe general slowdown in personal income.
Mining employment, which makes up 1.4percent of non-farm employment, fell slightly
in the first quarter of FY10, but has beengrowing moderately for the past couple ofyears. Since the recession started, miningemployment has added 3,500 non-seasonallyadjusted jobs, an increase of 16.1 percent forthe state. Trade, transportation and utilitiesemployment, the largest employment sectorin Kentucky (20.6 percent of non-farmemployment), lost a net 21,500 non-seasonally adjusted jobs since the recessionstarted. This is a loss of 5.6 percent duringthat time.
Kentucky government employment, whichmakes up 18.1 percent of non-farmemployment, declined by 3,700, or 1.1 percent,since the recession officially started.Kentucky government employment hasdeclined in five of the last eight quarters.
The Economy

Governor's Office for Economic Analysis First Quarter FY2010
-14-
This page intentionally left blank

Governor's Office for Economic Analysis First Quarter FY2010
-15 -
Quarterly Economic & Revene Report First Quarter 2007Interim Outlook
Official Budget Diff
Actual % Chg Estimate % Chg Estimate % Chg Estimate ($ mil)
Sales & Use 693.9 -7.7 2,070.1 -1.7 2,764.0 -3.3 2,834.4 -70.4Individual Income 814.4 -7.1 2,307.2 -5.4 3,121.7 -5.8 3,150.9 -29.3Corporation Inc & LLET 79.6 -15.6 289.4 -2.0 369.0 -5.3 408.4 -39.4Coal Severance 66.8 -8.0 177.6 -19.2 244.5 -16.5 276.9 -32.5Cigarettes 74.3 79.5 209.0 20.7 283.3 32.0 261.1 22.2Property 60.1 -5.7 451.1 0.4 511.3 -0.4 518.4 -7.1Lottery 44.0 2.3 158.0 5.0 202.0 4.4 202.0 0.0Other 135.3 -4.6 504.1 -0.8 639.4 -1.6 643.8 -4.4Total General Fund 1,968.5 -5.6 6,166.5 -2.8 8,135.0 -3.5 8,295.9 -160.9
Table 5General Fund Interim Forecast
($ millions)October 2009
Q1 Q2, Q3 & Q4 Full YearFY10 FY10 FY10
Projected General Fund revenues for thenext three quarters are shown in Table 5.The revenue outlook presented in this reportis identical to the October 12, 2009,preliminary estimates rendered by theConsensus Forecasting Group (hereafterCFG). The standing official estimates forFY10 date back to the May 2009 revisions tothe enacted budget estimates, and were againmodified slightly due to the actions of theextraordinary session of the 2009 GeneralAssembly.
In May 2009, the CFG lowered the GeneralFund estimates for FY10 by $996.0 millionto $8,300.0 million due to the length andunanticipated severity of the currentrecession. Legislation enacted subsequentto the official revenue revisions resulted in a
subsequent reduction of $4.1 million,resulting in the current official General Fundestimate for FY10 of $8,295.9 million. Theinterim estimates included in this reportproject General Fund revenues in FY10equal to $8,135.0 million, an amount $160.9million below the current official estimate.As mentioned in the introduction, theestimates used in this report are identical tothe most recent CFG estimates.
General Fund receipts through the first fiscalquarter totaled $1,968.5 million, a reductionof 5.6 percent from the amount collected inthe first quarter of FY09. The projectionsincluded in this report call for a 2.8 percentreduction for the remainder of FY10,resulting in an overall loss of 3.5 percent forFY10. By comparison, General Fund

Governor's Office for Economic Analysis First Quarter FY2010
-16-
revenues fell 2.7 percent in FY09 comparedto FY08. If the projected decline in FY10manifests, it will be the first time in the modernrate era that the General Fund has declinedin consecutive years.
Sales and use tax receipts are estimated tofall an additional 1.7 percent over theremaining three quarters of FY10. Firstquarter sales and use tax receipts fell 7.7percent despite a sizeable amount of newsales tax attributable to collections frompackage liquor sales and have now fallen forfour consecutive quarters. The sales tax isparticularly vulnerable to the underlyingweaknesses in employment and income, bothof which are expected to fall further duringthe interim forecast. During the currentfour-quarter streak of consecutive declines,the rate of decline has increased each quarter,perhaps indicative of the cumulative effect ofthe employment losses. The forecast does callfor the rates of decline to become smaller, butthat is partly a result of having a lower baseof comparison when computing the rates ofgrowth.
The interim forecast for the individual incometax calls for receipts to fall by 5.8 percent inFY10. Individual income tax receipts fell 7.1percent in the first quarter of FY10 and anadditional 5.4 percent over the three-quarterforecasting horizon. While the weakness inthis revenue source is widespread, payrollwithholding taxes have been notably weak inrecent quarters, a result once again of theunderlying weakness in the Kentucky andnational labor markets. The combination ofindividual income taxes with the sales taxtotal nearly 72.4 percent of the FY10 GeneralFund revenue estimate. Both of theserevenue sources are highly correlated withKentucky wages and salaries, and as such,
are susceptible to prolonged recessions andlabor weakness.
Combined corporation income and limitedliability entity tax (LLET) receipts fell 15.6percent in the first quarter of FY10 and areexpected to slide an additional 2.0 percentover the remainder of FY10. The FY10 totalestimate is $369.0 million, a 5.3 percentreduction. Masked within the first quarterdecline of 15.6 percent is a $18.6 million,increase in the LLET. Estimated income taxpayments continue to be very weak due to lowlevels of anticipated profits in tax year 2009.A portion of the LLET tax increase incollections is attributable to compliance effortsby the Department of Revenue and prior yeartax liabilities being paid in the current year.However, the base of the LLET is Kentuckygross receipts or gross profits, both of whichexhibit more stability than taxable netincome.
Unprecedented revenue growth in coalseverance tax revenue came to a halt in thefirst quarter of FY10, as that revenue sourcefell 8.0 percent compared to the extremelyhigh bar set in the first quarter of FY09. TheFY10 estimate for the coal severance tax is$244.5 million, a decline of 16.5 percent.Compared to the official estimate from May2009, the coal severance estimate has fallen$32.5 million. The primary reason for thedownward revision is a reduction in theoutlook for coal prices and energy prices ingeneral.
Cigarette taxes totaled $74.3 million in thefirst quarter, up $32.8 million over the firstquarter of FY09. For FY10, collections areexpected to rise 32.0 percent due to thedoubling of the tax rate from 30 cents to 60cents per pack. While it is too early to compute
Interim Outlook

Governor's Office for Economic Analysis First Quarter FY2010
-17 -
Quarterly Economic & Revene Report First Quarter 2007
elasticities from the tax increase, it doesappear that there were very modestconsumption declines in line with theprojections. The rate of growth for theremainder of FY10 diminishes off the torridpace set in the first quarter, but such aslowdown is expected in recognition that thehigher tax rates took effect in April 2009, andalso in recognition of nearly $16.3 million infloor stock taxes collected in FY09 that willnot be collected in FY10. Other tobacco taxesare expected to show similar growth to theanticipated increases in the cigarette tax.
Property tax collections are expected to fallmarginally in FY10. The rate of decline inproperty tax revenues was 5.7 percent in thefirst quarter, but the first quarter is typicallyundercollected since the largest source ofproperty tax revenue is the real property taxwhich accrues later in the year. In July, theDepartment of Revenue announced that thead valorem rate on real property would remainunchanged at 12.2 cents per $100 invaluation due to weak assessment growth. Alack of new property accumulation, coupledwith a persistent gap between billings andcollections, both point toward weak growth inreal property tax receipts over the forecastingperiod. Property tax revenues are expectedto rise 0.4 percent in the final three quartersof FY10 for total collections of $511.3 million.Property tax collection in FY09 were $513.1million.
Lottery revenues for FY10 are projected to be$202.0 million, an amount 4.4 percent higherthan the amount collected in FY09. Revenuesin the “Other” category fell 4.6 percent in thefirst quarter with an additional 0.8 percentslide predicted for the next three fiscalquarters. Expected modest growth in the
wholesale alcohol taxes, the bank franchisetax, and insurance premium taxes will becounterbalanced by weaknesses in mineraltaxes, pari-mutuel taxes, other miscellaneousrevenues.
ROAD FUND
Road Fund revenues are forecasted to decline1.2 percent over the remaining three quartersof FY10 as shown on Table 6 below. The twolargest Road Fund accounts, motor fuels andmotor vehicle usage, are expected to move inopposite directions as motor fuels will increaseand usage taxes are forecasted to continuetheir decline.
Motor fuels tax receipts are forecasted togrow 2.8 percent in the last three quarters ofFY10. This is due principally to a change inforecasted average wholesale gasoline pricesand its effect on the statutory rate of themotor fuels tax. A higher average wholesaleprice of gasoline will raise the variable portionof the motor fuels tax rate, generatingincreased tax revenues.
Motor vehicle usage tax collections areexpected to fall 6.3 percent in the final ninemonths of FY10. Receipts declined 6.3 percentin the first quarter and will remain weakthrough the end of the fiscal year due to tightconsumer credit conditions and legislativeaction. House Bill 3, passed during the 2009Special Session of the General assembly,exempts from tax the value of trade-ins onnew vehicle purchases, depressing taxcollections.
To estimate the growth of all othercomponents of the Road Fund, officials of theKentucky Transportation Cabinet and staff
Interim Outlook

Governor's Office for Economic Analysis First Quarter FY2010
-18-
of the Governor’s Office for EconomicAnalysis assessed recent growth patterns aswell as administrative and statutory factorsto formulate the projections. Motor vehiclelicense taxes are forecasted to decrease 4.3percent in the final three quarters of FY10.Motor vehicle operators’ licenses areprojected to rise 9.9 percent in the remainder
of the fiscal year. Weight distance tax revenueshould fall 1.8 percent for the remainder ofthe fiscal year. Investment income shouldfall 78.9 percent due to lower fund balances.All other revenues should combine for agrowth of 6.5 percent during the last ninemonths of FY10.
Interim Outlook
Table 6Road Fund: Interim Forecast
(millions of dollars)October 2009
FY10 FY10 FY10Quarter 1 Quarters 2, 3 & 4 Full Year
% Chg Interim % Chg Interim % ChgActual Year Ago Estimate Year Ago Estimate Year Ago
Motor Fuels & MF Use/Surtax 162.2 2.7 477.3 2.8 639.5 2.7Motor Vehicle Usage & Rental 93.7 -6.3 221.4 -6.3 315.1 -6.3Motor Vehicle License 17.0 -3.5 77.1 -4.3 94.1 -4.2Motor Vehicle Operators 4.2 -0.3 12.4 9.9 16.6 7.1Weight Distance Tax/Surtax 17.4 -16.1 53.7 -1.8 71.1 -5.7Investment 1.3 -51.3 1.7 -78.9 3.0 -72.0Other 6.8 -21.9 26.3 6.5 33.1 -0.9Road Fund 302.6 -3.0 869.9 -1.2 1,172.5 -1.6

Governor's Office for Economic Analysis First Quarter FY2010
-19 -
Quarterly Economic & Revene Report First Quarter 2007
ECONOMY
The economic outlook presented here is forthe three-quarter period from October 2009through June 2010, inclusive. This periodcorresponds to the final three fiscal quartersof FY10.
Due to the recent meetings of the ConsensusForecasting Group (CFG), this report willdeviate slightly from our recent pattern ofstrictly using the control, or baseline, forecastfrom Global Insight in the quarterly reports.Global Insight is the independent forecastingconsultant used by Kentucky andapproximately 35 other states to obtainexogenous forecasts of over 500 variables inthe national economy. These variables arethe primary drivers in our state economicmodel, as most state economies are correlatedin some way with various national economic
trends after adjusting for state fixed effectsand noncontemporaneous relationships.
The CFG met on September 25, 2009, andagain on October 12, 2009, to deliberate overthe current economic conditions andexpectations for the upcoming biennium. Inparticular, the CFG noted that Kentucky’seconomy tends to lag the national economyin the recovery period following recessions.Furthermore, it was noted that the nationalrecovery was concentrated in economic sectors(like production, national consumerspending) that were not as directly correlatedwith Kentucky revenues (like Kentuckyemployment, wages, and total personalincome). Therefore, the CFG ultimatelyadopted an equal blend of the control andpessimistic scenarios in the formation of theOctober preliminary estimates. As such, this
FY10 FY09 % Chg FY10 % ChgReal GDP ($ billions) 13,054.8 12,986.6 0.5 13,037.9 -0.3 Real Consumption ($ billions) 9,252.1 9,197.1 0.6 9,247.2 0.4 Real Investment ($ billions) 1,646.2 1,623.2 1.4 1,613.8 -5.9 Real Govt. Expenditures ($ billions) 2,602.6 2,545.9 2.2 2,599.3 2.2 Real Exports ($ billions) 1,468.2 1,473.0 -0.3 1,462.9 -3.7 Real Imports ($ billions) 1,931.7 1,869.4 3.3 1,902.8 -1.7Personal Income ($ billions) 12,097.2 12,057.7 0.3 12,064.9 -0.4Inflation (% chg of CPI) 0.6 -0.8 NA 0.3 NAIndustrial Production Index (% chg) -0.7 -7.2 NA -1.8 NACivilian Labor Force (millions) 154.4 154.5 -0.1 154.4 -0.1Total Nonfarm Employment (millions) 130.5 133.8 -2.5 130.7 -2.9Manufacturing Employment (millions) 11.5 12.5 -8.3 11.5 -9.3Unemployment Rate (percent) 10.1 8.1 NA 10.0 NA
Not Seasonally Adjusted. Real series are in billions of chained 2000 dollars. GDP components may not sum due to rounding at lower levels of detail. Source: IHS Global Insight Inc., September 3, 2009 data release
Q2, Q3, & Q4 Full Year
Table 7US Economic Outlook
Quarters 2, 3, & 4October 2009
Interim Outlook

Governor's Office for Economic Analysis First Quarter FY2010
-20-
report assumes the same blend of economicand revenue variables as used by the CFG.
National Economy
The Global Insight forecasts considered forthis report underscore the difficulty ofpegging future movements of the nationaleconomy, or even the state economy, duringa period of time that includes a turning pointfrom a recession to an ultimate recovery. Feweconomists dispute the pending nationalrecovery. The duration of the actual troughand the “slope” of the upswing, on the otherhand, continue to be hotly contested. Inplainest terms, the control scenario assumesthat the recent improvements in key economicvariables will set the stage for a robustrecovery, beginning either now for somevariables or in the next few quarters for others.In contrast, the pessimistic scenario is aptlynamed “False Dawn”. It is predicated upon abelief that some of the recent improvementsmay not lead to an immediate recovery untila longer series of inventory adjustments canrebase the economy, and until producers seethe temporary increase in aggregate demandtransition into a more sustained period ofstable demand for the goods and services ofindustry. For example, the highly-toutedmanufacturer’s new orders index recentlyeclipsed the coveted 50-mark, a sign ofexpansion in the manufacturing sector. Willthe recent movement be sustainable beyondthe immediate period where many sectorsare replenishing inventories that have beendepleted during special economic events suchas the Federal “Cash for Clunkers” program,or will the index retreat following theinventory correction phase? By blending thetwo forecasts, the outlook will be based on aneconomic scenario that indeed predicts arecovery but not an immediate and robustreversal of current trends. As the foregoing
analysis will convey, many variables,especially labor market indicators, havefurther to fall before the recovery stage cantake root.
Due to the depth and duration of the currentrecession, a clean and robust recovery appearsunlikely. Rather, the economy appears poisedto move sideways until economic agents canmore positively identify that the tide hasturned. Businesses, faced with slumpingcurrent sales, will continue to be exceedinglycautious about expanding production andemployment. Moreover, caution aboutcurrent production decisions seems to bebleeding over into extreme caution aboutfuture production plans, which will furtherdelay any meaningful rebound in businessplanned investment.
An examination of the blended projectionsprovides a quantitative depiction of theaforementioned narrative. As Table 7 shows,the final three quarters of FY10 are expectedto produce GDP growth of 0.5 percent in theblended forecast, thus ending the period ofdeclining national production. However,personal income is only expected to grow by atepid 0.3 percent, which is well below historicalgrowth in recovery periods. More importantly,employment is expected to decline 2.5 percentin the next three quarters, representingnational employment losses of 3.3 million.Manufacturing employment losses represent1.0 million of the total employment decline.
Eventually production increases will lead toa rebound in employment, but not until excesscapacity has been eliminated. In early reportsit was posited that new orders for finishedgoods could rise before aggregate demandrises due to the depletion and replenishmentof inventories. The same concept is true ofthe current uptick in national production.
Interim Outlook

Governor's Office for Economic Analysis First Quarter FY2010
-21 -
Quarterly Economic & Revene Report First Quarter 2007
Many businesses have excess capacity thataccumulated during the recession. Thisexcess capacity allows businesses to producemore in the short run without necessarilyhiring more labor and utilizing additionalcapital. Eventually the production functionwill prevail (a relationship that only allowsproduction to increase by increasing laborand capital inputs), but it is certainly plausibleto expect the employment recovery to lag theproduction data. Traditional theories of thefirm assume starting in equilibrium, whereproduction capacity is assumed fully utilized,so the current macroeconomic trends are morean acknowledgment of excess capacity ratherthan a counterproof to established theories ofproduction.
Kentucky Economy
The short-run outlook for the Kentuckyeconomy is dominated by weaknesses in theemployment sector. Kentucky employmentis expected to fall 2.3 percent during the finalthree quarters of FY10, as shown in Table 8.Goods-producing sectors will experience themost pronounced weakness. Constructionemployment is expected to fall 11.3 percentfor the remainder of FY10 as the economytries to work through large inventories ofcommercial real estate and vacancies.Manufacturing employment is expected tofall 8.4 percent, or 18,600 positions, duringthe same period. Losses in the goods-producing sectors are especially hard on thestate economy due to the profound effect thatthese sectors have on supporting businessesthat rely on a robust regional economy astheir customer base.
The weak short-term employment outlookcorresponds to similar weakness on thepersonal income front. Kentucky personalincome is expected to rise an anemic 0.8percent, but wage and salary income isexpected to fall 0.9 percent in the blendedforecast for the next three quarters. Wageand salary income comprises approximately52 percent of state personal income. Thesecond largest category of Kentucky personalincome is transfer payments, which representapproximately 24 percent of personal incomein FY10. Transfer payments are expected toincrease 8.8 percent in FY10. The rate ofgrowth in transfer payments, and thepercentage of total income, both exceed thecorresponding national data. This partiallyexplains why the Kentucky personal incomegrowth is expected to exceed that nationalrate of growth despite the underlyingweakness in Kentucky wage and salaryincome growth.
The path to recovery for the Kentuckyeconomy traverses the same terrain as thenational economy. Production will eventuallyincrease, excess capacity will be workedthrough, and then higher sustained demandfor goods and services will trigger a period ofemployment and business investment.Unfortunately, the end of the path and therecovery in employment is not projected to bereached during the three-quarter span ofthis interim report. The Office of State BudgetDirector will monitor all data regarding theKentucky labor markets looking for signalsthat the corrections phase of the employmentcycle is underway.
Interim Outlook

Governor's Office for Economic Analysis First Quarter FY2010
-22-
Interim Outlook
FY10 FY09 % Chg FY10 % ChgPersonal Income ($ millions) 138,178.7 137,067.2 0.8 137,964.7 0.8 Wages and Salary Income ($ millions) 72,013.2 72,686.2 -0.9 71,944.1 -1.3
Nonagricultural Employment (thousands) 1,765.9 1,806.8 -2.3 1,768.0 -2.8 Goods Producing (thousands) 294.1 321.5 -8.5 295.6 -10.3 Construction 66.4 74.9 -11.3 66.9 -13.5 Mining 25.0 25.4 -1.4 25.2 0.2 Manufacturing 202.6 221.2 -8.4 203.5 -10.3 Service Providing (thousands) 1,151.0 1,165.2 -1.2 1,151.7 -1.5 Trade, Transportation & Utilities 361.4 373.9 -3.3 362.3 -3.7 Information 28.3 29.5 -3.9 28.5 -3.7 Finance 89.4 90.9 -1.7 89.6 -1.7 Business Services 177.2 178.4 -0.7 177.2 -1.3 Educational Services 249.1 246.0 1.3 248.7 1.2 Leisure and Hospitality Services 171.9 173.2 -0.8 171.8 -0.8 Other Services 73.8 73.3 0.7 73.6 -0.1Government (thousands) 320.8 320.1 0.2 320.7 0.1
Seasonally adjusted annual rate.Source: IHS Global Insight Inc. and Governor's Office for Economic Analysis MAK model, September 2009
Table 8Kentucky Economic Outlook
Quarters 2, 3, & 4October 2009
Q2, Q3, & Q4 Full Year

Governor's Office for Economic Analysis First Quarter FY2010
-23 -
Quarterly Economic & Revene Report First Quarter 2007
APPENDIX

Governor's Office for Economic Analysis First Quarter FY2010
-24-
KENTUCKY STATE GOVERNMENT - GENERAL FUND REVENUE
First Quarter First QuarterFY 2010 FY 2009 % Change
TOTAL GENERAL FUND 1,968,453,450 2,084,910,078 -5.6% Tax Receipts 1,899,098,174 2,020,580,152 -6.0% Sales and Gross Receipts 848,152,069 870,858,767 -2.6% Beer Consumption 1,734,290 1,754,302 -1.1% Beer Wholesale 14,443,895 14,550,916 -0.7% Cigarette 74,188,631 41,412,129 79.1% Distilled Spirits Case Sales 27,201 27,683 -1.7% Distilled Spirits Consumption 2,709,843 2,895,426 -6.4% Distilled Spirits Wholesale 6,804,743 7,138,166 -4.7% Insurance Premium 27,685,914 31,198,941 -11.3% Pari-Mutuel (1,550,912) 607,836 --- Race Track Admission 92,698 121,628 -23.8% Sales and Use 693,895,478 751,428,090 -7.7% Wine Consumption 580,280 375,761 54.4% Wine Wholesale 2,887,009 2,512,852 14.9% Telecommunications Tax 19,060,855 14,562,276 30.9% OTP 5,456,403 2,272,762 140.1% Floor Stock Tax 135,740 0 --- License and Privilege 108,115,576 104,553,209 3.4% Alc. Bev. License Suspension 68,350 101,400 -32.6% Coal Severance 66,843,188 72,674,552 -8.0% Corporation License 678,533 1,089,515 -37.7% Corporation Organization 101,730 12,615 706.4% Occupational Licenses 41,317 62,480 -33.9% Oil Production 1,843,509 4,004,923 -54.0% Race Track License 112,500 172,500 -34.8% Bank Franchise Tax (165,750) (3,376,114) --- Driver License Fees 156,963 160,551 -2.2% Minerals Severance 3,627,032 4,190,886 -13.5% Natural Gas Severance 4,277,040 13,570,778 -68.5% Limited Liability Entity 30,531,165 11,889,122 156.8%
Income 863,467,596 959,032,081 -10.0% Corporation 49,041,270 82,372,047 -40.5% Individual 814,426,326 876,660,034 -7.1%
Property $60,134,196 $63,763,104 -5.7% Building & Loan Association 91,143 228,467 -60.1% General - Real 134,803 270,689 -50.2% General - Tangible 22,343,478 37,703,936 -40.7% Omitted & Delinquent 13,355,891 12,240,028 9.1% Public Service 23,521,697 12,738,260 84.7% Other 687,184 581,724 18.1%
Inheritance $11,168,896 $13,019,297 -14.2%
Miscellaneous $8,059,842 $9,353,695 -13.8% Legal Process 5,779,530 6,180,588 -6.5% T. V. A. In Lieu Payments 2,279,819 3,165,484 -28.0% Other 493 7,623 ---
Nontax Receipts $68,434,525 $64,610,930 5.9% Departmental Fees 7,498,852 6,216,916 20.6% PSC Assessment Fee 8,210,157 9,354,102 -12.2% Fines & Forfeitures 7,485,475 7,372,509 1.5% Interest on Investments 199,721 1,155,631 -82.7% Lottery 44,000,000 43,000,000 2.3% Sale of NOx Credits 460,780 0 --- Miscellaneous 579,540 (2,488,228) ---
Redeposit of State Funds $920,751 ($281,005) ---

Governor's Office for Economic Analysis First Quarter FY2010
-25 -
Quarterly Economic & Revene Report First Quarter 2007
KENTUCKY STATE GOVERNMENT - ROAD FUND REVENUE
First Quarter First QuarterFY 2010 FY 2009 % Change
TOTAL ROAD FUND $302,616,105 $311,972,993 -3.0%
Tax Receipts- $296,144,029 $303,190,348 -2.3%
Sales and Gross Receipts $255,861,906 $257,971,666 -0.8% Motor Fuels Taxes 162,170,900 157,975,206 2.7% Motor Vehicle Usage 93,691,006 99,996,460 -6.3%
License and Privilege $40,282,123 $45,218,682 -10.9% Motor Vehicles 17,023,190 17,644,064 -3.5% Motor Vehicle Operators 4,242,956 4,255,424 -0.3% Weight Distance 17,387,559 20,713,520 -16.1% Truck Decal Fees 29,437 43,810 -32.8% Other Special Fees 1,598,981 2,561,864 -37.6%
Nontax Receipts $6,226,500 $8,487,536 -26.6% Departmental Fees 4,564,483 5,397,125 -15.4% In Lieu of Traffic Fines 225,982 245,178 -7.8% Investment Income 1,313,006 2,694,178 -51.3% Miscellaneous 123,030 151,055 -18.6%
Redeposit of State Funds $245,576 $295,108 -16.8%