communicating scientific results - data visualization
TRANSCRIPT

Medical Affairs Professional Society | 2020 Medical Affairs Professional Society (MAPS) | 2020 1
Communicating
Scientific Results -
Data Visualization: Do's and Don’ts
Evidence Generation Focus Area Working Group

Medical Affairs Professional Society (MAPS) | 2020
>> NOW SPEAKING: Name & DegreesTitle and Company Name
Mission Statement
The mission of the Evidence Generation Focus Area Working Group (FAWG) is
to educate the MAPS membership on contemporary practices for data generation strategies, including the design, implementation, and
communication of new evidence, and educate the MAPS membership how real-world (RW) evidence may be utilized to support product value; including
labeling changes.
2
>> NOW SPEAKING: SCOTT FLANDERS, PhDVice President of Medical Affairs, Dendreon Pharmaceuticals, LLC

Medical Affairs Professional Society (MAPS) | 2020
>> NOW SPEAKING: Name & DegreesTitle and Company Name
Some Housekeeping
3
>> NOW SPEAKING: SCOTT FLANDERS, PhDVice President of Medical Affairs, Dendreon Pharmaceuticals, LLC
This webinar, as with all previous ones, will be
available on-demand
next week in the Community Portal for
MAPS members.
On-demand Availability
of Webinar:
The control panel includes a webinar
evaluation. Please
complete that evaluation so that we
can work to ensure the highest quality
presentations.
Evaluations:
Please submit questions
throughout the
presentation using the Q&A button in
your control panel.
Questions for
Presenters:
Medical Affairs Professional Society (MAPS) | 2020
>> NOW SPEAKING: Name & DegreesTitle and Company Name
Disclaimer
The views expressed in this Webinar are those of the presenters, and are not an official position statement by MAPS, nor do they
necessarily represent the views of the MAPS organization or its
members.
This presentation is for informational purposes only and is not intended as legal or regulatory advice.
4
>> NOW SPEAKING: SCOTT FLANDERS, PhDVice President of Medical Affairs, Dendreon Pharmaceuticals, LLC
Medical Affairs Professional Society (MAPS) | 2020
>> NOW SPEAKING: Name & DegreesTitle and Company Name
Challenges with Data Generation - Communication
• Scientific research and analysis can be complex
• Data sources often vary from clinical to humanistic to costs
• Many research designs and methods require assumptions
• Results must often be interpreted by non-specialists
• Our communications are often limited in time and content
Data Visualization
5
>> NOW SPEAKING: SCOTT FLANDERS, PhDVice President of Medical Affairs, Dendreon Pharmaceuticals, LLC

Medical Affairs Professional Society (MAPS) | 2020
>> NOW SPEAKING: Name & DegreesTitle and Company Name
Educational Objectives
Today we provide a learning opportunity for our audience to
understand:
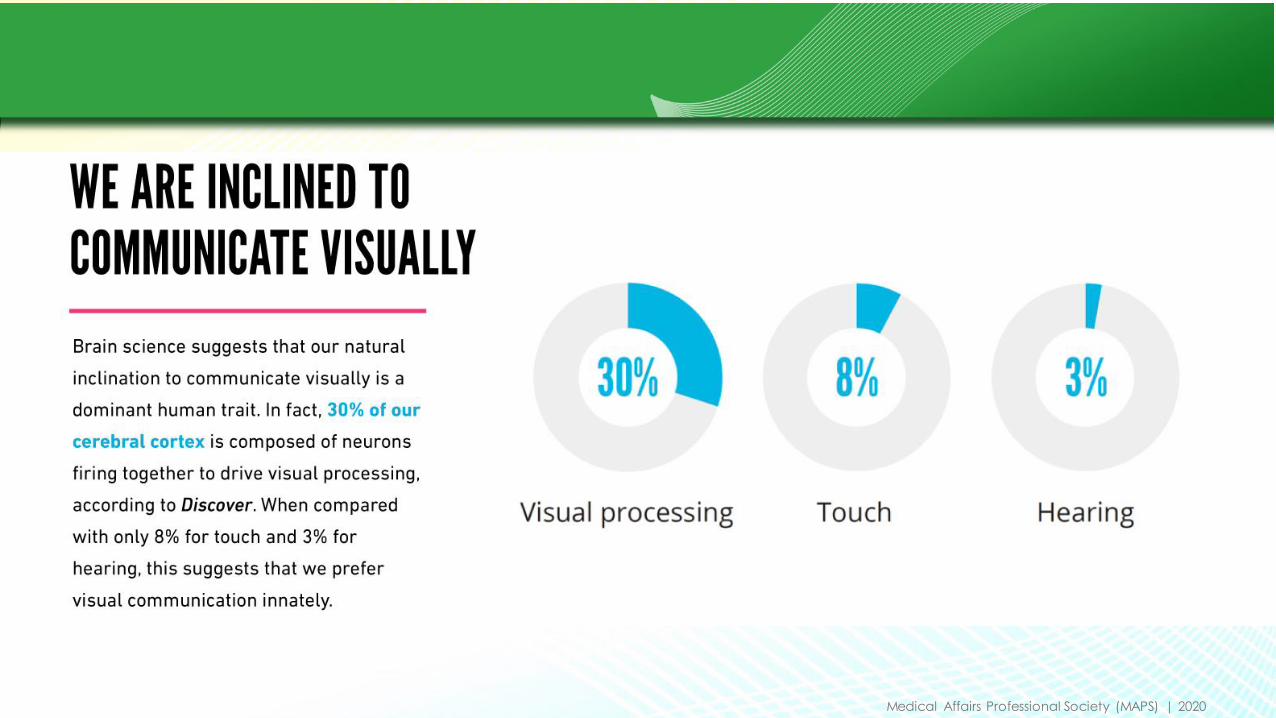
• How brain science affects our understanding of data
visualizations and visual cues
• How to identify the right chart for the job and key questions to test your chart selection
• How to avoid common data visualization mistakes
• How to take your data visualizations up a level to ensure
they stand out in your presentations
6
>> NOW SPEAKING: SCOTT FLANDERS, PhDVice President of Medical Affairs, Dendreon Pharmaceuticals, LLC

Medical Affairs Professional Society (MAPS) | 2020
>> NOW SPEAKING: Name & DegreesTitle and Company Name
Our Speaker Today
7
>> NOW SPEAKING: SCOTT FLANDERS, PhDVice President of Medical Affairs, Dendreon Pharmaceuticals, LLC
Amy Balliett
Founder and CEO of Killer Visual Strategies

Medical Affairs Professional Society (MAPS) | 2020
Part 1:
What is Visual Communication?And why does it matter?

Medical Affairs Professional Society (MAPS) | 2020

Medical Affairs Professional Society (MAPS) | 2020

Medical Affairs Professional Society (MAPS) | 2020

Medical Affairs Professional Society (MAPS) | 2020
Medical Affairs Professional Society (MAPS) | 2020

Medical Affairs Professional Society (MAPS) | 2020

Medical Affairs Professional Society (MAPS) | 2020
Part 2:
3 Steps to Visualize Data
Medical Affairs Professional Society (MAPS) | 2020
Step 1: Identify Your Audience
Ask the following questions:
• Who will be viewing this data analysis?
• What do they currently understand and what do they need to understand?
• What are their communication preferences?
• How will the content be viewed/consumed?
Medical Affairs Professional Society (MAPS) | 2020
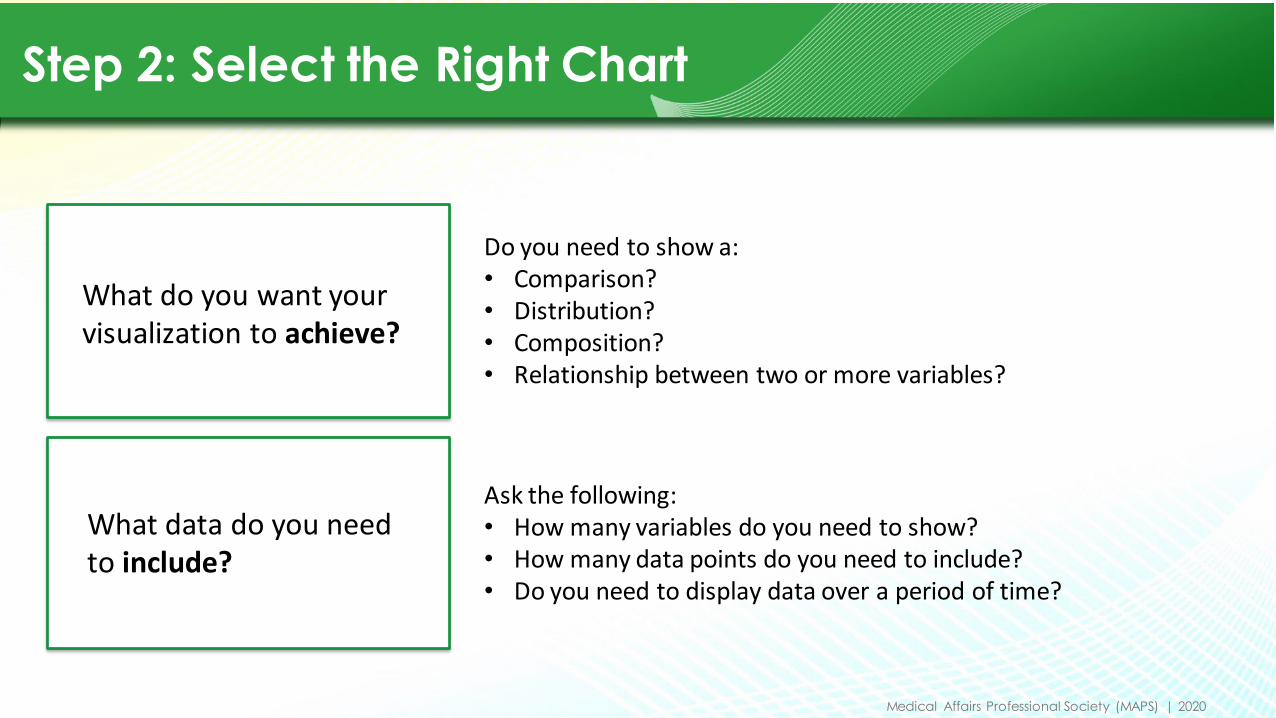
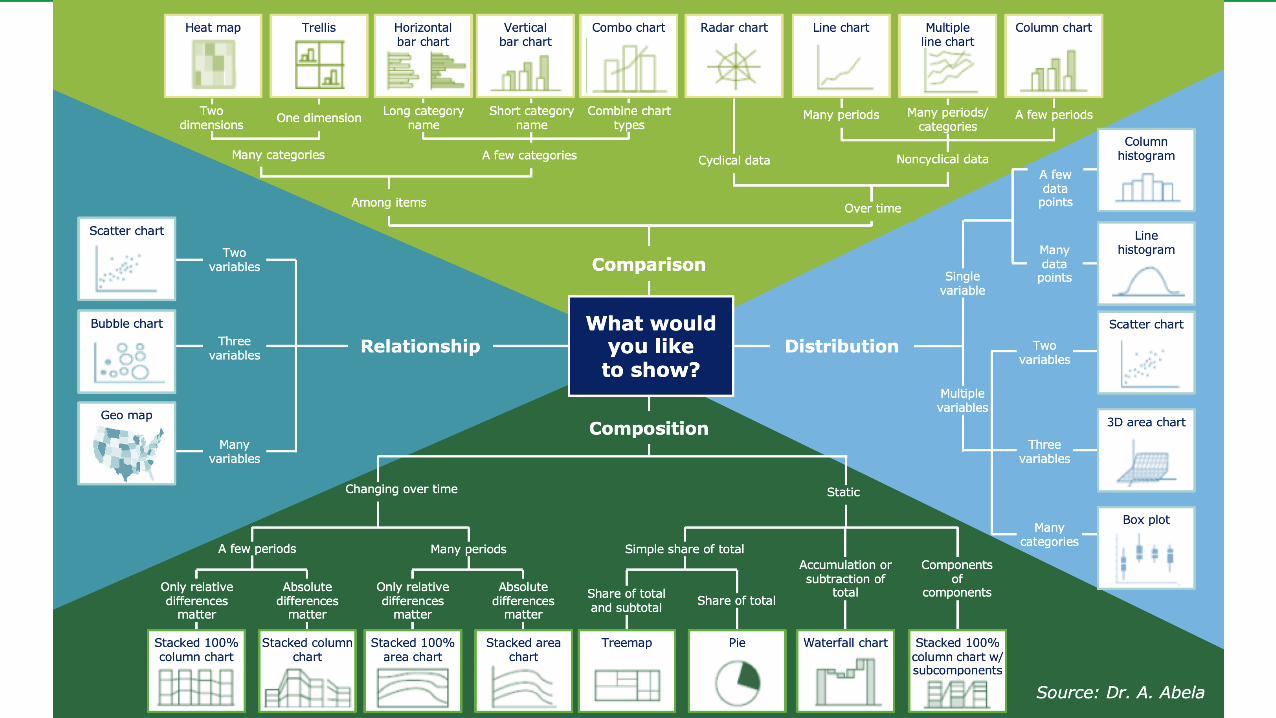
Step 2: Select the Right Chart
What do you want yourvisualization to achieve?
What data do you needto include?
Do you need to show a:• Comparison?• Distribution?• Composition?• Relationship between two or more variables?
Ask the following:• How many variables do you need to show?• How many data points do you need to include?• Do you need to display data over a period of time?
Medical Affairs Professional Society (MAPS) | 2020

Medical Affairs Professional Society (MAPS) | 2020
Part 3:
Data Viz Do’s and Don’ts

Medical Affairs Professional Society (MAPS) | 2020
Step 3: Visualize Data Correctly
Medical Affairs Professional Society (MAPS) | 2020
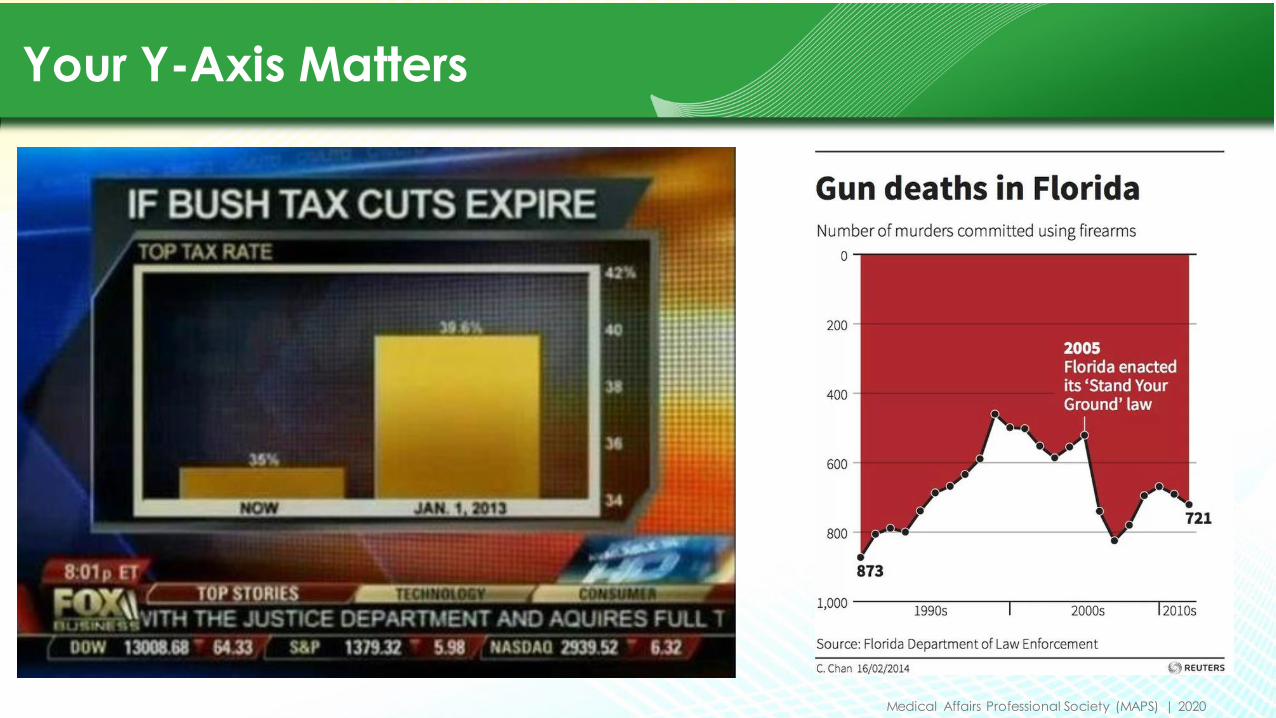
Your Y-Axis Matters

Medical Affairs Professional Society (MAPS) | 2020
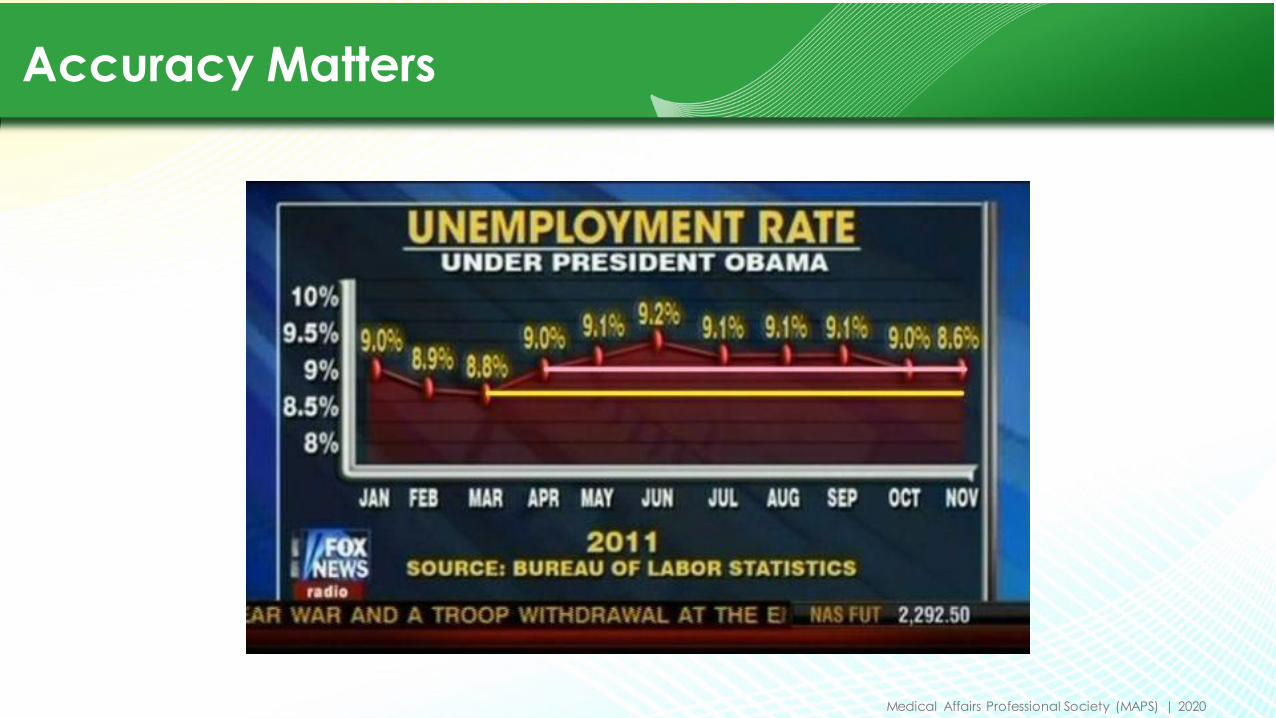
Accuracy Matters
Medical Affairs Professional Society (MAPS) | 2020
Accuracy Matters
Medical Affairs Professional Society (MAPS) | 2020
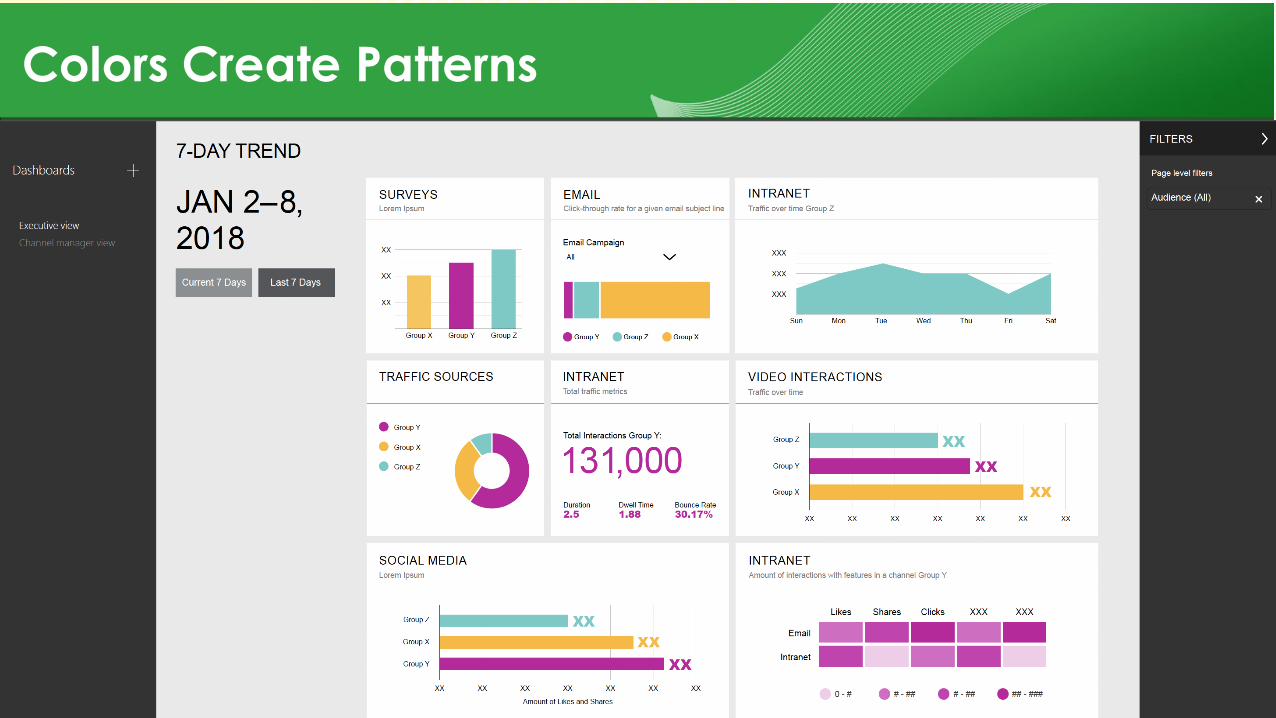
Colors Create Patterns
Medical Affairs Professional Society (MAPS) | 2020
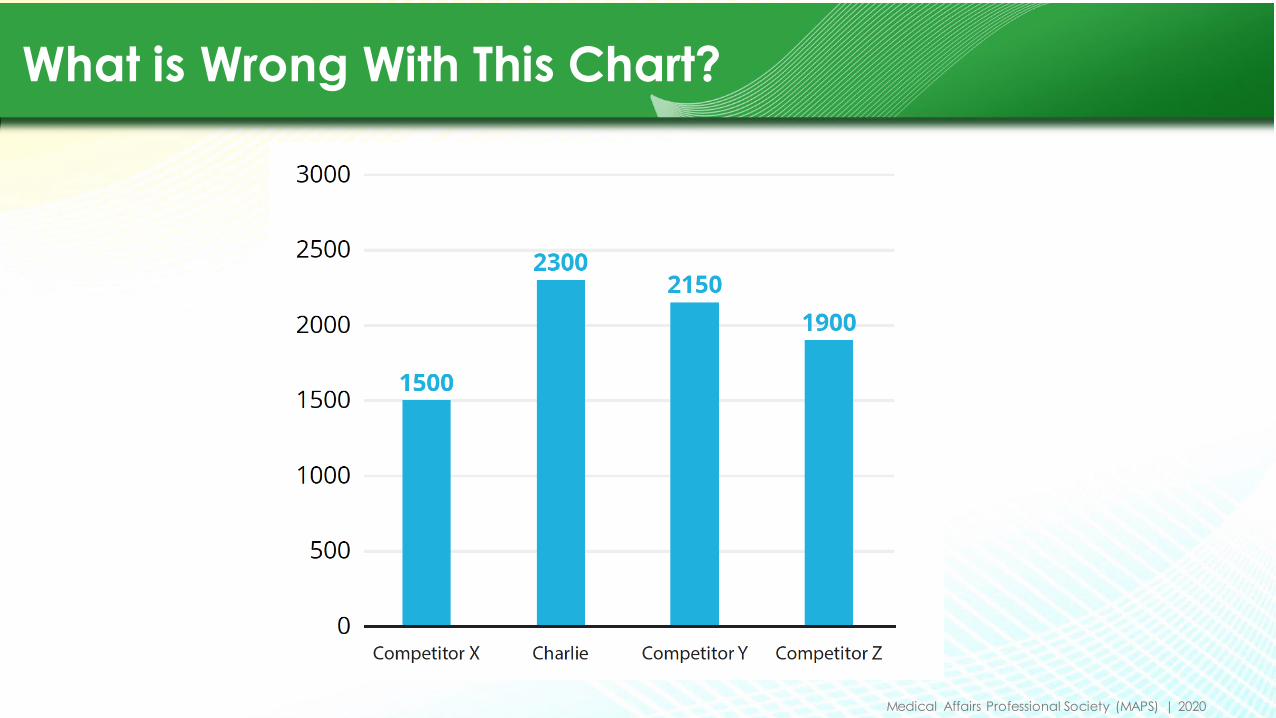
What is Wrong With This Chart?
Medical Affairs Professional Society (MAPS) | 2020
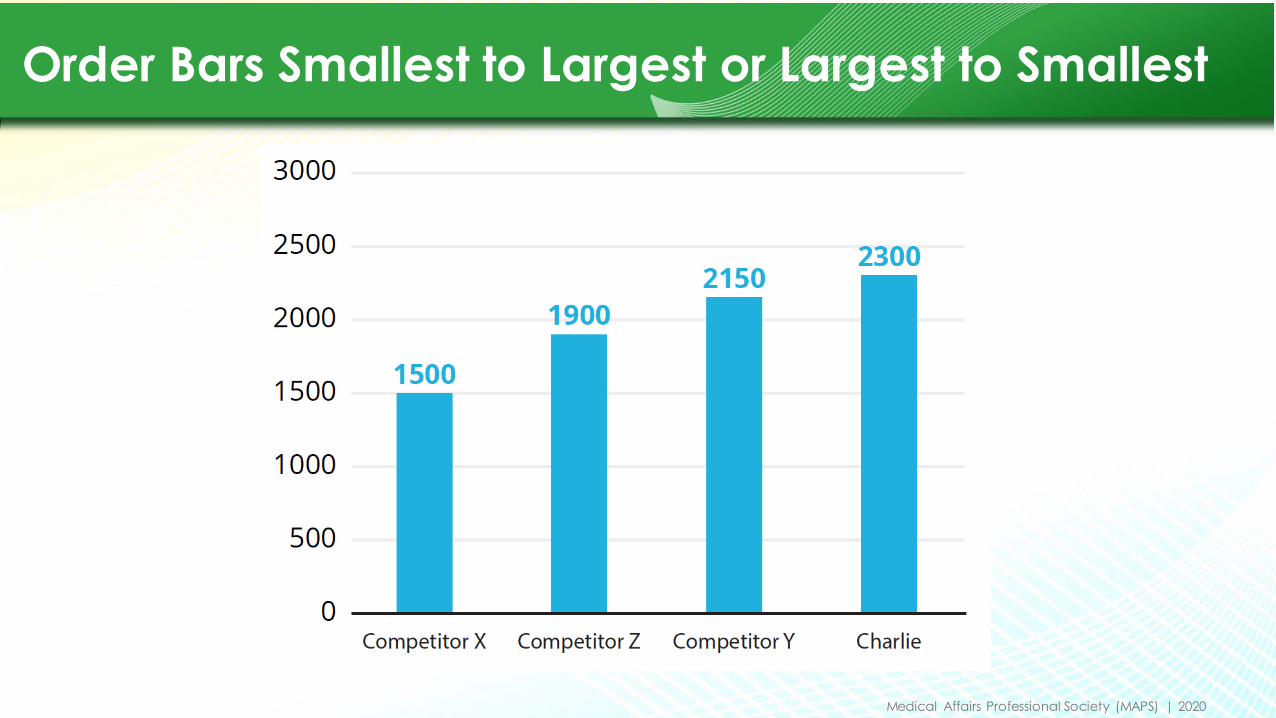
Order Bars Smallest to Largest or Largest to Smallest
Medical Affairs Professional Society (MAPS) | 2020
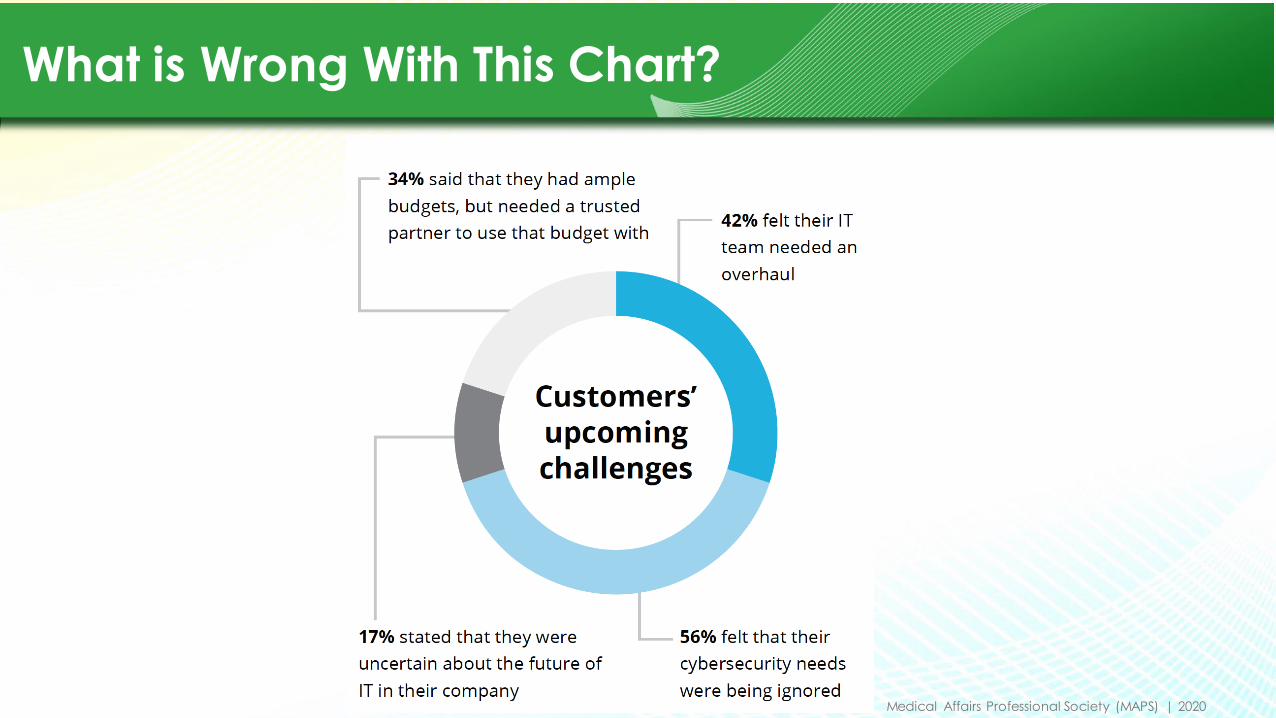
What is Wrong With This Chart?
Medical Affairs Professional Society (MAPS) | 2020
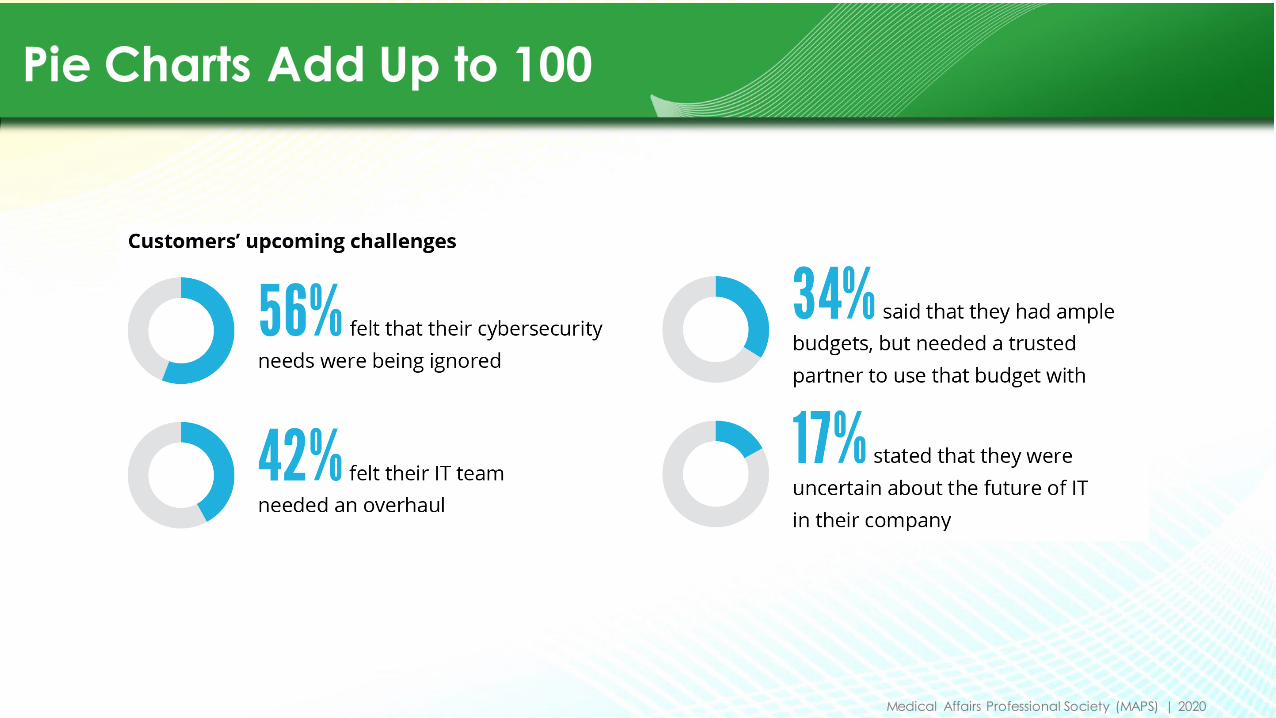
Pie Charts Add Up to 100

Medical Affairs Professional Society (MAPS) | 2020
What is Wrong With These Charts?

Medical Affairs Professional Society (MAPS) | 2020
The Dark Color Should be the “Fill” Color

Medical Affairs Professional Society (MAPS) | 2020
What is Wrong With This Quantagram?
Medical Affairs Professional Society (MAPS) | 2020
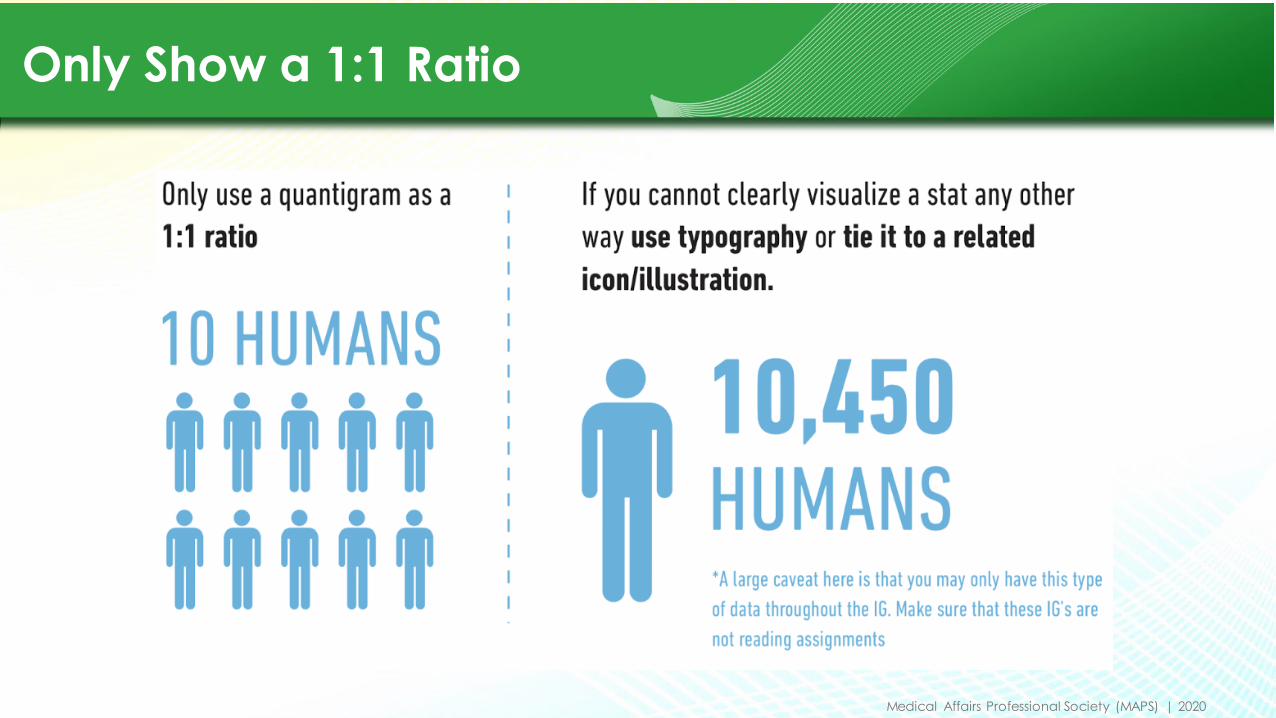
Only Show a 1:1 Ratio
Medical Affairs Professional Society (MAPS) | 2020
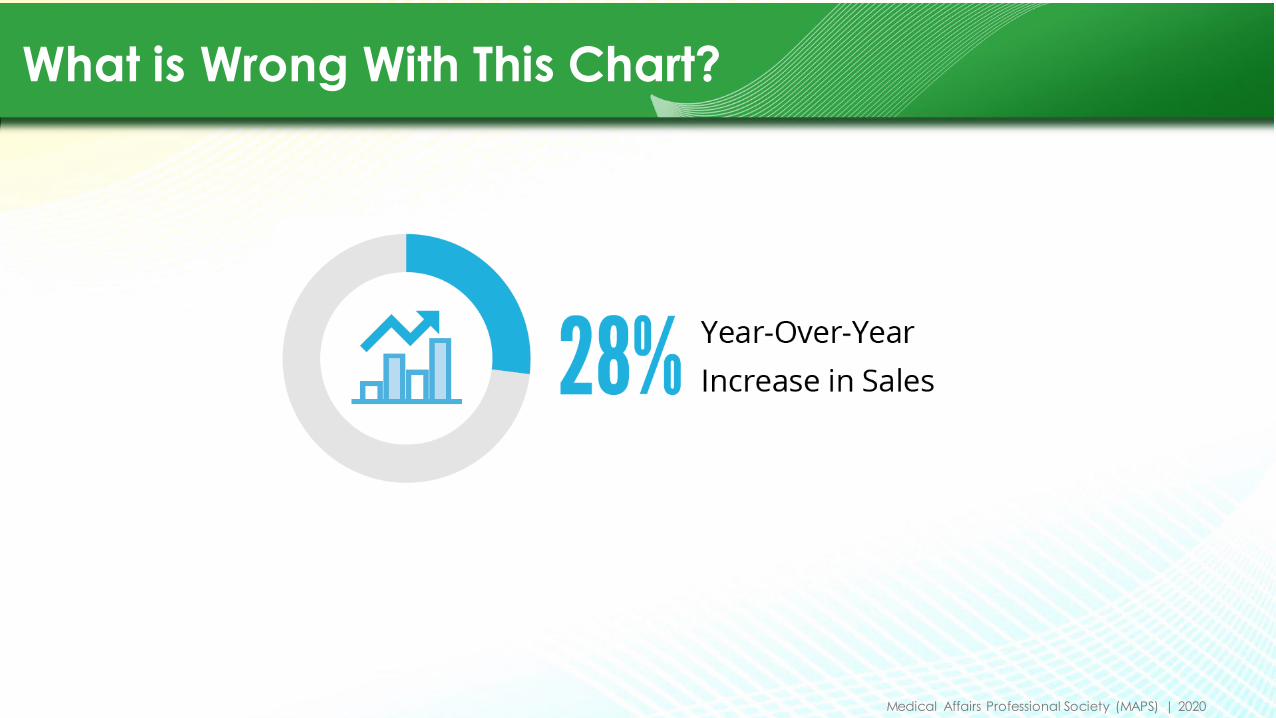
What is Wrong With This Chart?

Medical Affairs Professional Society (MAPS) | 2020
Don’t Always Indulge in Pie

Medical Affairs Professional Society (MAPS) | 2020
Thank you!Questions?
Amy Balliett
CEO, Founder, Author
Killer Visual Strategies
USA