communication theoretic data analytics
TRANSCRIPT

IEEE JOURNAL ON SELECTED AREAS IN COMMUNICATIONS, VOL. 33, NO. 4, APRIL 2015 663
Communication Theoretic Data AnalyticsKwang-Cheng Chen, Fellow, IEEE, Shao-Lun Huang, Lizhong Zheng, and H. Vincent Poor, Fellow, IEEE
Abstract—Widespread use of the Internet and social networksinvokes the generation of big data, which is proving to be usefulin a number of applications. To deal with explosively growingamounts of data, data analytics has emerged as a critical technol-ogy related to computing, signal processing, and information net-working. In this paper, a formalism is considered in which data aremodeled as a generalized social network and communication the-ory and information theory are thereby extended to data analytics.First, the creation of an equalizer to optimize information transferbetween two data variables is considered, and financial data areused to demonstrate the advantages of this approach. Then, aninformation coupling approach based on information geometry isapplied for dimensionality reduction, with a pattern recognitionexample to illustrate the effectiveness of this formalism. Theseinitial trials suggest the potential of communication theoretic dataanalytics for a wide range of applications.
Index Terms—Big data, social networks, data analysis, commu-nication theory, information theory, information coupling, equal-ization, information fusion, data mining, knowledge discovery,information centric processing.
I. INTRODUCTION
W ITH the explosive growth of Internet and mobile com-munications, (big) data analytics has emerged as a
critical technology, adopting techniques such as machine learn-ing, graphical models, etc., to mine desirable information fora wide array of information and communication technologyapplications [1]–[6]. Data mining or knowledge discovery indatabases (KDD) has been used as a synonym for analyticson electronic data. To achieve the purpose of data analytics,there are several major steps: (i) based on the selection of dataset(s), pre-processing of the data for effective or easy compu-tation, (ii) processing of data or data mining, likely adoptingtechniques from statistical inference and artificial intelligence,and (iii) post-processing to appropriately interpret results of
Manuscript received July 14, 2014; revised September 18, 2014 andDecember 15, 2014; accepted December 24, 2014. Date of publication January16, 2015; date of current version April 17, 2015. This work was supported inpart by the U.S. Air Force under Grant AOARD-14-4053, by the U.S. ArmyResearch Office under MURI Grant W911NF-11-1-0036, by the U.S. NationalScience Foundation under Grants CCF-1216476 and CCF-1420575, and bythe Ministry of Science and Technology under grant MOST 103-2221-E-002-022-MY3.
K.-C. Chen is with the Graduate Institute of Communication Engineering,National Taiwan University, Taipei 10617, Taiwan (e-mail: [email protected]).
S.-L. Huang is with the Graduate Institute of Communication Engineering,National Taiwan University, Taipei 10617, Taiwan, and also with the Depart-ment of Electrical Engineering and Computer Science, Massachusetts Instituteof Technology, Cambridge, MA 02139 USA (e-mail: [email protected]).
L. Zheng is with the Department of Electrical Engineering and ComputerScience, Massachusetts Institute of Technology, Cambridge, MA 02139 USA(e-mail: [email protected]).
H. V. Poor is with the Department of Electrical Engineering, PrincetonUniversity, Princeton, NJ 08544 USA (e-mail: [email protected]).
Color versions of one or more of the figures in this paper are available onlineat http://ieeexplore.ieee.org.
Digital Object Identifier 10.1109/JSAC.2015.2393471
data analytics as knowledge. Knowledge discovery aims ateither verification of user hypotheses or prediction of futurepatterns from data/observations. Statistical methodologies dealwith uncertain or nondeterministic reasoning and thus models,and are the focus of this paper. Machine learning and artifi-cial intelligence are useful to analyze data, e.g., [2], [3], [7],typically via regression and/or classification. With advances insupervised and unsupervised learning, inferring the structureof knowledge, such as inferring Bayesian network structurefrom data, is one of the most useful information technologies[8]. In recent decades, considerable research effort has beendevoted to various aspects of data mining and data analysis,but effective data analytics are still needed to address theexplosively growing amount of data resulting from Internet,mobile, and social networks.
A core technological direction in data analytics lies inprocessing high-dimensional data to obtain low-dimensionalinformation via computational reduction algorithms, namely,by nonlinear approaches [9], [10], compressive sensing [11],or tensor geometric analysis [12]. In spite of remarkableachievements, with the exponential growth in data volume,it is very desirable to develop more effective approaches todeal with existing challenges including effective algorithmsof scalable computational complexity, outlier detection andprediction, etc. Furthermore, modern wireless communicationsystems and networks to support mobile Internet and Internetof Things (IoT) applications require effective transport ofinformation while appropriate data analytics enable spectralefficiency via proper context-aware computation [13]. Thetechnological challenge for data analytics due to very largenumbers of devices and data volume remains on the list of themost necessary avenues of inquiry. At this time, state-of-the-artdata analytics primarily deal with data processing throughcomputational models and techniques, such as deep learning[14]. There lack efforts to examine the mechanism of datageneration [15] and subsequent relationships among data,which motivates the investigation of data analytics in this paperby leveraging communication theory and information theory.
As indicated in [16] and other works, relationships amongdata can be viewed as a type of generalized social network.The data variables can be treated as nodes in a network andtheir corresponding relationships can be considered to be linksgoverned by random variables (or random processes by consid-ering a time index). Such scenarios are particularly relevant fortoday’s interactive Internet data from/related to social networks,social media, collective behavior from crowds, and sensed datacollected from sensors in cyber-physical systems (CPS) or IoT.Therefore, with the aid of this generalized social network con-cept, we propose a new communication theoretic methodologyof information-centric processing for (big) data analytics in
0733-8716 © 2015 IEEE. Personal use is permitted, but republication/redistribution requires IEEE permission.See http://www.ieee.org/publications_standards/publications/rights/index.html for more information.

664 IEEE JOURNAL ON SELECTED AREAS IN COMMUNICATIONS, VOL. 33, NO. 4, APRIL 2015
this paper. Furthermore, by generalizing the scenario from acommunication link into a communication network, we mayuse ideas from network information theory and informationgeometry to develop a novel technology known as informa-tion coupling [37], which suggests a new information-centricapproach to extraction of low-dimensional information fromhigh-dimensional data based on information transfer. Thesetechnological opportunities describe a complete communica-tion theoretic view of data analytics.
The rest of this paper is organized as follows. Section IIpresents our modeling of data into a generalized social networkand its resemblance to typical communication system models.Section III describes the setting of our proposed communicationtheoretic data analytics to more effectively process the data, us-ing financial data to illustrate the processing methodology withcomparisons to well-known techniques. Related literature is re-viewed to better explain our proposed methodology. Section IVbriefly introduces the rationale from information geometry andthe principle of information coupling to realize dimensionalityreduction, with an image pattern recognition example to showthe effectiveness of this new idea based on network informationtheory. Finally, we make concluding remarks in Section V, withsuggested open problems to fully understand and to most effec-tively revisit data mining and knowledge discovery in (big) dataanalytics. In addition to its potential for creating new methodsfor data analytics, this new application scenario also creates anew dimension for communication and information theory.
II. SOCIAL NETWORK MODELING OF DATA
As noted in [16], entities (e.g., data) with relationships can beviewed as social networks, and thus social network analysis andstatistical communication theory share commonalities in manycases. For data analytics, it is common to face a situation inwhich we have two related variables, say X and Y , possiblymodeled as random variables. If a time index is involved, saythe variables are observed or sampled in sequence, these twovariables are actually two random processes. Consequently,each sequence of data drawn from a variable is a sample path ofthe random process. An intuitive way of examining the relation-ship between the two processes is to compute the correlationcoefficient between these two sampled data sequences.
For big data problems in an Internet setting, we are oftenfacing a substantial number of variables up to thousands or evenmillions in order, and therefore must rely on machine learningto predict or otherwise to make inferences from data. One of thekey problems is to identify low-dimensional information fromhigh-dimensional data, as a key issue of knowledge discovery.Recently, another vision, known as small data, has emerged tomore precisely deal with variables of data on a human scale[17]. Generally speaking, in data analytics, whether addressingbig data or small data, effective and precise inference from datais always the fundamental challenge. An approach differentfrom machine learning arises by extracting embedded informa-tion from data. More precisely, for example, we may identifythe information flowing from variable X to variable Y just as ina typical point-to-point digital communication system.
Fig. 1. Graphical model of network variables for a large data set.
Unfortunately, real world problems are much more compli-cated than a single communication link, and there are manymore variables involved. Fig. 1 depicts the social networkstructure of a large data set through realization of graphicalmodels and Bayesian networks, while each node (i.e., variable)represents a data variable (actually a vector of data) and eachlink represents the relationship and causality between two datavariables. Such relationships between data variables usuallyexhibit uncertainty due to the nature of data or imperfect ob-servations, and thus require probabilistic modeling. Even morechallenging, such causal relationships among large numbersof variables may not be known, and thus a challenge is todetermine or to learn the knowledge discovery structure [6],[19], [20].
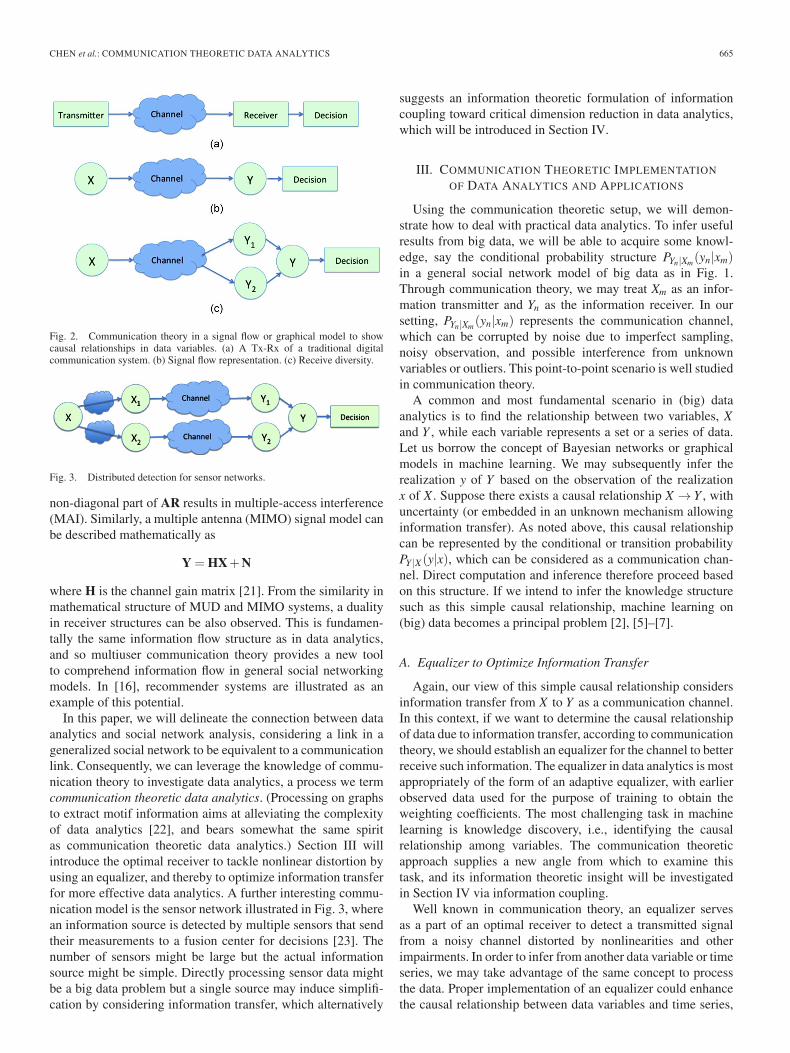
The social network analysis of data can be performed indifferent ways, such as using graphical models with machinelearning techniques [2], [16]. However, as noted, such widelyapplied methodologies focus on data processing and inference,rather than considering information transfer. Communicationscan be generally viewed as transmission of information fromone location to another location as illustrated in Fig. 2(a). Wemay further use signal flow of random variables to abstractlyportray such a system as in Fig. 2(b). The channel as a linkbetween random variables X and Y , can be characterized by theconditional probability distribution PY |X (y|x). When a channelinvolves multiple intermediate variables relating X and Y , thisresults in receive diversity as shown in Fig. 2(c).
More advanced communication theory, namely, multiple ac-cess communication, has been developed in recent decades andmay be useful for Internet data analytics. Multiuser detection(MUD), though commonly connected with code division multi-ple access (CDMA) communications, generally represents situ-ations in which multiple user signals (no need to be orthogonal)are simultaneously transmitted and then detected over the samefrequency band [18]. In such situations, the signal model can bedescribed as
Y = (AR)X+N
where X is the transmitted signal vector; Y is the receivedsignal vector embedded in noise N; R denotes the correlationmatrix among signals used by transmitter-receiver pairs andA is a diagonal matrix containing received amplitudes. The
CHEN et al.: COMMUNICATION THEORETIC DATA ANALYTICS 665
Fig. 2. Communication theory in a signal flow or graphical model to showcausal relationships in data variables. (a) A Tx-Rx of a traditional digitalcommunication system. (b) Signal flow representation. (c) Receive diversity.
Fig. 3. Distributed detection for sensor networks.
non-diagonal part of AR results in multiple-access interference(MAI). Similarly, a multiple antenna (MIMO) signal model canbe described mathematically as
Y = HX+N
where H is the channel gain matrix [21]. From the similarity inmathematical structure of MUD and MIMO systems, a dualityin receiver structures can be also observed. This is fundamen-tally the same information flow structure as in data analytics,and so multiuser communication theory provides a new toolto comprehend information flow in general social networkingmodels. In [16], recommender systems are illustrated as anexample of this potential.
In this paper, we will delineate the connection between dataanalytics and social network analysis, considering a link in ageneralized social network to be equivalent to a communicationlink. Consequently, we can leverage the knowledge of commu-nication theory to investigate data analytics, a process we termcommunication theoretic data analytics. (Processing on graphsto extract motif information aims at alleviating the complexityof data analytics [22], and bears somewhat the same spiritas communication theoretic data analytics.) Section III willintroduce the optimal receiver to tackle nonlinear distortion byusing an equalizer, and thereby to optimize information transferfor more effective data analytics. A further interesting commu-nication model is the sensor network illustrated in Fig. 3, wherean information source is detected by multiple sensors that sendtheir measurements to a fusion center for decisions [23]. Thenumber of sensors might be large but the actual informationsource might be simple. Directly processing sensor data mightbe a big data problem but a single source may induce simplifi-cation by considering information transfer, which alternatively
suggests an information theoretic formulation of informationcoupling toward critical dimension reduction in data analytics,which will be introduced in Section IV.
III. COMMUNICATION THEORETIC IMPLEMENTATION
OF DATA ANALYTICS AND APPLICATIONS
Using the communication theoretic setup, we will demon-strate how to deal with practical data analytics. To infer usefulresults from big data, we will be able to acquire some knowl-edge, say the conditional probability structure PYn|Xm(yn|xm)in a general social network model of big data as in Fig. 1.Through communication theory, we may treat Xm as an infor-mation transmitter and Yn as the information receiver. In oursetting, PYn|Xm(yn|xm) represents the communication channel,which can be corrupted by noise due to imperfect sampling,noisy observation, and possible interference from unknownvariables or outliers. This point-to-point scenario is well studiedin communication theory.
A common and most fundamental scenario in (big) dataanalytics is to find the relationship between two variables, Xand Y , while each variable represents a set or a series of data.Let us borrow the concept of Bayesian networks or graphicalmodels in machine learning. We may subsequently infer therealization y of Y based on the observation of the realizationx of X . Suppose there exists a causal relationship X → Y , withuncertainty (or embedded in an unknown mechanism allowinginformation transfer). As noted above, this causal relationshipcan be represented by the conditional or transition probabilityPY |X (y|x), which can be considered as a communication chan-nel. Direct computation and inference therefore proceed basedon this structure. If we intend to infer the knowledge structuresuch as this simple causal relationship, machine learning on(big) data becomes a principal problem [2], [5]–[7].
A. Equalizer to Optimize Information Transfer
Again, our view of this simple causal relationship considersinformation transfer from X to Y as a communication channel.In this context, if we want to determine the causal relationshipof data due to information transfer, according to communicationtheory, we should establish an equalizer for the channel to betterreceive such information. The equalizer in data analytics is mostappropriately of the form of an adaptive equalizer, with earlierobserved data used for the purpose of training to obtain theweighting coefficients. The most challenging task in machinelearning is knowledge discovery, i.e., identifying the causalrelationship among variables. The communication theoreticapproach supplies a new angle from which to examine thistask, and its information theoretic insight will be investigatedin Section IV via information coupling.
Well known in communication theory, an equalizer servesas a part of an optimal receiver to detect a transmitted signalfrom a noisy channel distorted by nonlinearities and otherimpairments. In order to infer from another data variable or timeseries, we may take advantage of the same concept to processthe data. Proper implementation of an equalizer could enhancethe causal relationship between data variables and time series,
666 IEEE JOURNAL ON SELECTED AREAS IN COMMUNICATIONS, VOL. 33, NO. 4, APRIL 2015
and thus allow better judgement or utilization of the causalrelationship. This is one core issue in knowledge discovery ofdata analytics. In big data analytics, this knowledge problemhas a very large number of variables. As in Fig. 1, we focuson the problem of identifying the causal relationships betweenthe set of variables X1,X2, · · · ,XM and the set of variablesY1,Y2, · · · ,YN , specified by appropriate weights. This is identicalto the following multiple access communication problem:
(X1,X2, . . . ,XM)[hi j]M×N = (Y1,Y2, . . . ,YN)T (1)
where [hi j] =H is analogous to the channel matrix. This knowl-edge discovery problem in data analytics is thus equivalent toa blind channel estimation/identification problem in multipleaccess communication. Since a feedback channel may notexist in general, this is a blind problem. However, for onlineprocessing, equivalent feedback might not be impossible, whichwe leave as an open issue. We start from some simple cases toillustrate this idea.
• Information diversity: A variable X may influence anumber of variables, say Y1,Y2, · · · ,YN , which is a formof information diversity. To identify a causal relationshipbetween X and Yn, this is precisely a multi-channel esti-mation problem such as arises in wireless communication.Since feedback in causal data relationships is generally im-possible, such a class of problems falls under the categoryof blind multi-channel estimation/identification [24], [25].
• Information fusion: Another class to consider is thecausal relationship from many data variables to influencea single data variable, say X1,X2, · · · ,XM to Y . This cor-responds to multi-input-single-output channel estimationor identification, which is a rather overlooked subject.However, another similar problem, source separation, hasbeen well studied.
B. Applications to Inference on Financial Time Series
A useful way to demonstrate our analytical methodology is toconsider financial time series data, which has been well studiedin the literature. The purpose is to demonstrate the predictionof stock prices from other factors. In this example, we aretrying to predict the stock price of Taiwan SemiconductorManufacturing Corp. (TSMC), which is the world’s largestcontract chip fabrication company. To demonstrate informationtransfer and thus communication theoretic data analytics, weconsider two factors, which appear to be somewhat indirectlyrelated to stock prices in Taiwan but are potentially influential:the exchange rate between U.S. dollars (USD) and New TaiwanDollars (NTD, the local currency in Taiwan), and the NASDAQindex which primarily consists of high-tech stocks in the USA.
Let the time series of the exchange rate between USD andNTD be X1[n], n = 0,1, . . . and the time series of the NASDAQindex be X2[n], n = 0,1, . . .. The time series for the stock priceof TSMC is Y [n], n = 0,1, . . .. Now, both X1[n] and X2[n]may influence Y [n]. This classical problem has been typicallyhandled by multivariate time series analysis, which serves as abenchmark without introducing more advanced techniques.
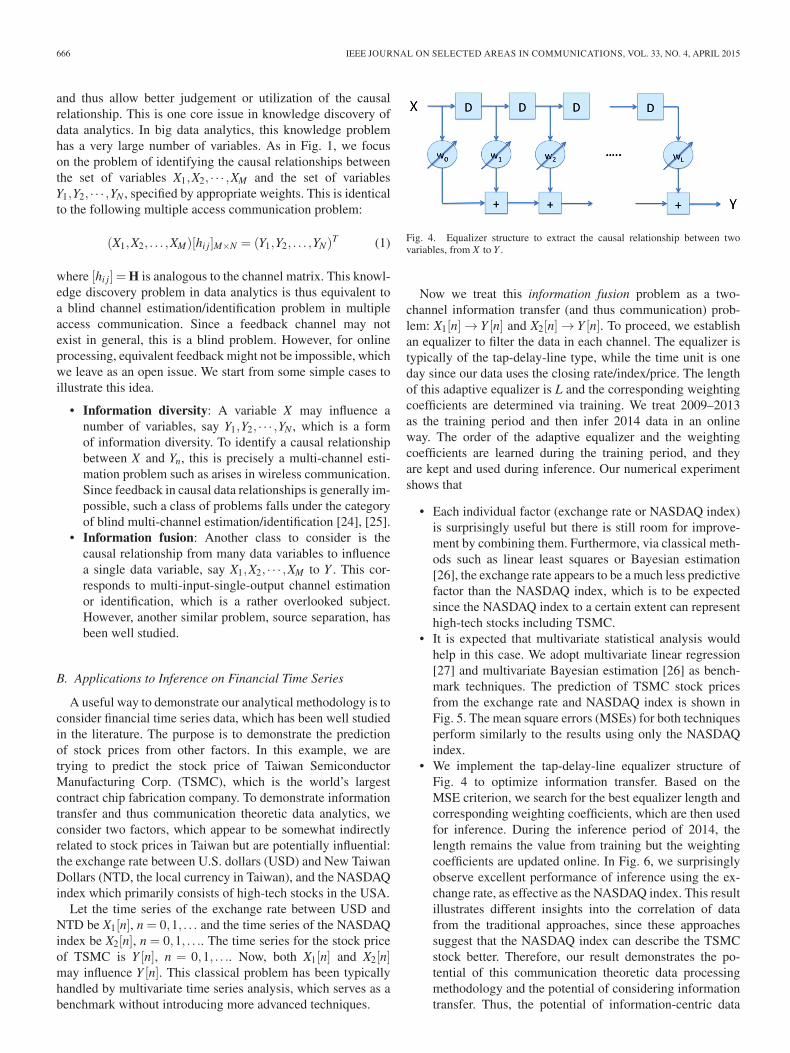
Fig. 4. Equalizer structure to extract the causal relationship between twovariables, from X to Y .
Now we treat this information fusion problem as a two-channel information transfer (and thus communication) prob-lem: X1[n] → Y [n] and X2[n] → Y [n]. To proceed, we establishan equalizer to filter the data in each channel. The equalizer istypically of the tap-delay-line type, while the time unit is oneday since our data uses the closing rate/index/price. The lengthof this adaptive equalizer is L and the corresponding weightingcoefficients are determined via training. We treat 2009–2013as the training period and then infer 2014 data in an onlineway. The order of the adaptive equalizer and the weightingcoefficients are learned during the training period, and theyare kept and used during inference. Our numerical experimentshows that
• Each individual factor (exchange rate or NASDAQ index)is surprisingly useful but there is still room for improve-ment by combining them. Furthermore, via classical meth-ods such as linear least squares or Bayesian estimation[26], the exchange rate appears to be a much less predictivefactor than the NASDAQ index, which is to be expectedsince the NASDAQ index to a certain extent can representhigh-tech stocks including TSMC.
• It is expected that multivariate statistical analysis wouldhelp in this case. We adopt multivariate linear regression[27] and multivariate Bayesian estimation [26] as bench-mark techniques. The prediction of TSMC stock pricesfrom the exchange rate and NASDAQ index is shown inFig. 5. The mean square errors (MSEs) for both techniquesperform similarly to the results using only the NASDAQindex.
• We implement the tap-delay-line equalizer structure ofFig. 4 to optimize information transfer. Based on theMSE criterion, we search for the best equalizer length andcorresponding weighting coefficients, which are then usedfor inference. During the inference period of 2014, thelength remains the value from training but the weightingcoefficients are updated online. In Fig. 6, we surprisinglyobserve excellent performance of inference using the ex-change rate, as effective as the NASDAQ index. This resultillustrates different insights into the correlation of datafrom the traditional approaches, since these approachessuggest that the NASDAQ index can describe the TSMCstock better. Therefore, our result demonstrates the po-tential of this communication theoretic data processingmethodology and the potential of considering informationtransfer. Thus, the potential of information-centric data

CHEN et al.: COMMUNICATION THEORETIC DATA ANALYTICS 667
Fig. 5. Prediction of TSMC stock price by (a) multivariate linear regression, and (b) multivariate Bayesian estimation, where blue dots denote actual prices andred crosses denote prices inferred from the exchange rate and NASDAQ index.
Fig. 6. Communication theoretic data analytics using an equalizer to optimizeinformation transfer from (a) the exchange rate, and (b) the NASDAQ index tothe TSMC stock price.
processing over conventional machine learning is worthfurther study.
• Similar to diversity combining in digital communicationsystems, information combining in communication theo-retic data analytics potentially further improves the per-formance of inference. Maximal ratio combining (MRC)is well known to be optimal for diversity combining basedon signal-to-interference-plus-noise ratio (SINR). Using asimilar concept as equation (15), we develop MRC infor-mation combining to weight equalized channels inverselyproportional to the MSE in the training period. Such weights
Fig. 7. Inference via MRC information combining two equalized data pro-cessing channels, where the length of the equalizer for the exchange rate is16 (days) and the length of the equalizer for the NASDAQ index is 61 (around3 months).
in MRC information combining can be updated online.Fig. 7 depicts the prediction results (red crosses) and truevalues (blue dots). We calculate the mean square error andfind even better performance than using only the exchangerate. The MSE can be lower than those of multivariatelinear regression and multivariate Bayesian estimation.
In Appendix A, we develop the following rules of thumbfor communication theoretic data analytics, while subjectto further enhancements.
Problem: To infer Y based on X1,X2, . . . ,XN .
Procedure:
1) Use an equalizer (i.e., optimal receiver) implementationto identify causal relationships among data variables,X1 → Y,X2 → Y, . . . ,XN → Y , with the correspondingMSEs according to the training dataset(s).
2) Select Nc data variables to transfer sufficient information(or sufficiently small MSE errors in training) to identifythe structure of knowledge by keeping the length andcoefficients of the equalizer, or by online update of co-efficients.
3) Conduct MRC information fusion of these Nc data vari-ables as in Fig. 12 to make inferences.
Remark 1: The conjecture that this communication the-oretic data analytics approach delivers more desirable

668 IEEE JOURNAL ON SELECTED AREAS IN COMMUNICATIONS, VOL. 33, NO. 4, APRIL 2015
performance comes from optimizing information transfer andavoiding cross-interference among data variables (similar tomultiple access interference in multiuser communication),while existing multivariate statistical analysis or statisticallearning multiplexes all data variables together to result inmultiple access interference in data analytics. Furthermore, foreach data variable, a selected equalizer length with coefficientsis used, then information is combined with other data variables,to allow better matching to extract information in this com-munication theoretic data analytics approach. Each equalizer isdesignated to match a specific data variable, while multivariateanalysis usually deals with a common fixed depth of observeddata in processing for all data variables. More observations maynot bring in more relevant information but rather additionalnoise/interference. Although recent research suggests a dualitybetween time series and network graphs [28], [29], information-centric processing of data suggested by communication theorysupplies a unique and generally applicable view of inference,even though its extension to more complicated network graph-ical relationships among data is still open. Note that duringthe training period, the computational complexity is high, how-ever, the computation load is rather minor in the inferencestage.
Remark 2: Applying information theoretic data analyticssuch as mutual information and information divergence beyondcorrelation have been proposed in the literature, e.g., [30],[31]. However, such efforts have not systematically appliedinformation-centric processing techniques based on communi-cation systems as suggested in this paper. In the mean time,though we have illustrated only one-hop network graphicalinference, these methods may be applied further for data clean-ing, data filtering, identification of important data variables forinference, and identification of causal relationships among datavariables to support knowledge discovery in data analytics. Tofuse heterogeneous information, fuzzy logic [30] or Markovlogic [31] is usually employed. In the proposed approach,information combining of different-depth information transferalternatively serves the purpose in an effective way, while timeseries data mining typically considers similarity measured interms of distance [32].
At this point, we cannot conclude that communication the-oretic data analytics are better than multivariate analysis andother machine learning techniques, as many advanced tech-niques such as Kalman filtering [33], graphical models [34],or role discovery [35] that are somewhat similar to our pro-posed approach have not been considered in our comparison.However, via the above example, the communication theoreticdata analytical approach indeed demonstrates its potential,particularly as a way of fusing information, while it seemsmore difficult to achieve a similar purpose by pure multivariateanalysis. Some remaining open problems for communicationtheoretic data analytics are
• How to measure the information transfer from each vari-able Xi → Y , i = 1,2, . . ..
• How to determine a sufficient amount of informationtransfer? And thereby, how to determine which variablesshould be considered in data analytics.
A more realistic but complicated scenario involves informa-tion fusion and information diversity at the same time, whichis a multiuser detection or MIMO problem. Due to spacelimitations, it is not possible to explore this idea here, in spiteof its potential applicability to different problems, such asrecommender systems etc. Some open issues include:
• Joint prediction of Y1,Y2, . . . ,YN from X1,X2, . . . ,XM , andassociated techniques to effectively solve this problem,such as sub-space approaches etc.,
• Optimal MUD has NP-hard complexity, leading to subop-timal receivers such as the de-correlating receiver. Com-parisons of such structures to multivariate time seriesanalysis, mathematically and numerically, are of interest.
IV. INFORMATION COUPLING
Thus far, we have intuitively viewed communication theo-retic data analytics as being centered on information transferamong different data variables, and then applied receiver tech-niques to enhance data analytics. This suggests that the amountof information in the data is in fact far less than the amountof (big) data. The methodology in Section III deals with anumber of data variables to effectively execute information pro-cessing analogously to communication systems and multiusercommunications. The remaining challenge is to identify low-dimensional information structure from high-dimensional (raw)data, and to better construct intuition about communicationtheoretic data analytics from information theory. In this section,we aim to apply the recently developed information coupling[37] to achieve this purpose, and also provide informationtheoretic insights to information-centric data processing.
A. Introduction to Information Coupling
From the analog between communication networks and dataanalytics, intuition suggests the need for information-centricprocessing in addition to data processing for not only optimiz-ing communication systems/networks but also mining impor-tant information from (big) data. The conventional studies ofinformation processing are limited to data processing, therebyfocusing on representing information as bits, and transmitting,storing, and reconstructing these bits reliably. To see this,let us consider a random variable with M possible values{1,2, . . . ,M}. If we know its value reliably, then we can de-scribe this knowledge with a single integer, and then furtherprocess the data with this known value. On the other hand,if the value is not deterministically acquirable, then we needto describe our knowledge with an M-dimensional distributionPM(m), which requires M−1 real numbers to describe. There-fore, the data processing task has to be performed in the spaceof probability distributions.
When we move towards information-centric processing,the general way to describe information processing relies on theconditional distribution of the message, conditioned on all theobservations, at each node of the network, e.g., PYn|Xm in Fig. 1.Conventional information theoretic approaches working on thedistribution spaces in communication and data processing aremostly based on coded transmission, in which the desired

CHEN et al.: COMMUNICATION THEORETIC DATA ANALYTICS 669
messages are often quite large, which results in the extremelyhigh dimensionality of the belief vectors. This is in fact one ofthe main difficulties of shifting the data processing from datacentric to information centric. It turns out that this difficultycomes from the fact that the distribution space itself is not aflat vector space, but is a rather complicated manifold. Amari’swork [36] on information geometry provides a tool to study thisspace, but the analysis can be quite involved in many cases. Inthis section, we propose a framework that allows us to greatlysimplify this challenge. In particular, we turn our focus to lowrate information contained in the data, which is significantfor describing the data. We call such problems informationcoupling problems [37], [38].
To formulate this problem mathematically, let us considera point-to-point communication scenario, where a signal X istransmitted through a channel with the transition probabilityWY |X , which can be viewed as a |Y | × |X | matrix, to generatean output Y . In the conventional communication systems, weconsider encoding a message U into the signal vector X , toform a Markov relation U → X → Y , from which, an efficientcoding scheme aims to design both the distribution PU andthe conditional distributions PX |U=u to maximize the mutualinformation I(U ;Y ), which corresponds to the communica-tion rate. Such optimization problems in general do not haveanalytical solutions, and require numerical methods such asthe Blahut–Arimoto algorithm to find the optimal value. Moreimportantly, when we allow coded transmissions, i.e., to replaceX and Y by n independent and identically distributed (i.i.d.)copies of the pair, it is not clear a priori that the optimizingsolution would have any structure. Although Shannon provideda separate proof for the point-to-point case that the optimizationof the multi-letter problem over PXn|U should also have ani.i.d. structure, failure to generalize this proof to multi-terminalproblems remains the biggest obstacle to solving networkcapacity and subsequently design algorithms. In contrast, theinformation coupling deals with the maximization of the sameobjective function I(U ;Y ), but with an extra constraint thatthe information encoded in X , measured by I(U ;X) is small.With a slight strengthening this constraint can be reduced tothe condition that all the conditional distributions PX |U (·|u),for a u, are close to the marginal distribution PX . We refer thereader to [37] for the details of this strengthening. With thisextra constraint, the linear information coupling problem for thepoint-to-point channel can be formulated as
maxU→X→Y
1n
I(U ;Y ), (2)
subject to :1n
I(U ;X)≤ δ,
1n‖PX |U=u −PX‖2 = O(δ), ∀u, (3)
where δ is assumed to be small.It turns out that the local constraint (3) in (2) that assumes all
conditional distributions are close to the marginal distribution,plays the critical role of reducing the manifold structure intoa linear vector space. In addition, the optimization problem,regardless of the dimensionality, can always be solved analyt-
ically with essentially the same routine. In order to show howthe local constraint helps to simplify the problem, we first notethat given the conditional distributions PX |U=u are closed to PX
for all u in terms of δ, the mutual information I(U ;X) can beapproximated up to the first order as
I(U ;X) = δ ·∑u
PU (u) · ‖ψu‖2 +o(δ) (4)
where ψu is the perturbation vector with the entries ψu(x) =(PX |U=u(x)−PX (x))/
√δ ·PX (x), for all x. This local approx-
imation results from the first order Taylor expansion of theKullback–Leibler (K–L) divergence D(PX |U=u‖PX ) betweenPX |U=u and PX with respect to (w.r.t.) δ. In addition, with thisapproximation technique, we can similarly express the mutualinformation at the receiver end as
I(U ;Y ) = δ ·∑u
PU (u) · ‖ψu‖2 +o(δ) (5)
where ψu(y) = (PY |U=u(y)−PY (y))/√
δ ·PY (y). Now, note thatU → X → Y forms a Markov relation, therefore both PY |U=uand PY , viewed as vectors, are the output vectors of the channeltransition matrix WY |X with the input vectors PX |U=u and PX .This implies that the vector ψu is the output vector of a linearmap B with ψu as the input vector, where
BΔ=[√
PY−1]
WY |X[√
PX]
(6)
and [√
PX ] and [√
PY ] denote diagonal matrices with diag-onal entries PX (x) and PY (y). This linear map B is calledthe divergence transition matrix (DTM) as it carried the K–Ldivergence metric from the input distribution space to the outputdistribution space.
We shall point out here that with this local approximationtechnique, both the input and output probability distributionspaces are linearized as Euclidean spaces by the tangent planesaround the input and the output distributions PX and PY . Hence,we can define the coordinate system in both distribution spaces,such as the inner product and orthonormal basis, as in the con-ventional Euclidean spaces. Under such a coordinate system,the mutual information I(U ;X) becomes the Euclidean metricof the perturbation vector ψu averaged over different values ofu. Similarly, the mutual information I(U ;Y ) can also be viewedas the Euclidean metric of the perturbation vector B ·ψu at theoutput space. Hence, the optimization problem of maximizingthe mutual information I(U ;Y ) is turned into the followinglinear algebra problem:
max . ∑u
PU (u) · ‖B ·ψu‖2
subject to : ∑u
PU (u) · ‖ψu‖2 = 1. (7)
In particular, U can without loss of the optimality be designedas a uniform binary random variable, and the goal of (7) is tofind the input perturbation vector ψu that provides the largestoutput image B ·ψu through the linear map B. The solution ofthis problem then relies on the singular value decomposition ofB, and the optimal ψu corresponds to the singular vector of B
670 IEEE JOURNAL ON SELECTED AREAS IN COMMUNICATIONS, VOL. 33, NO. 4, APRIL 2015
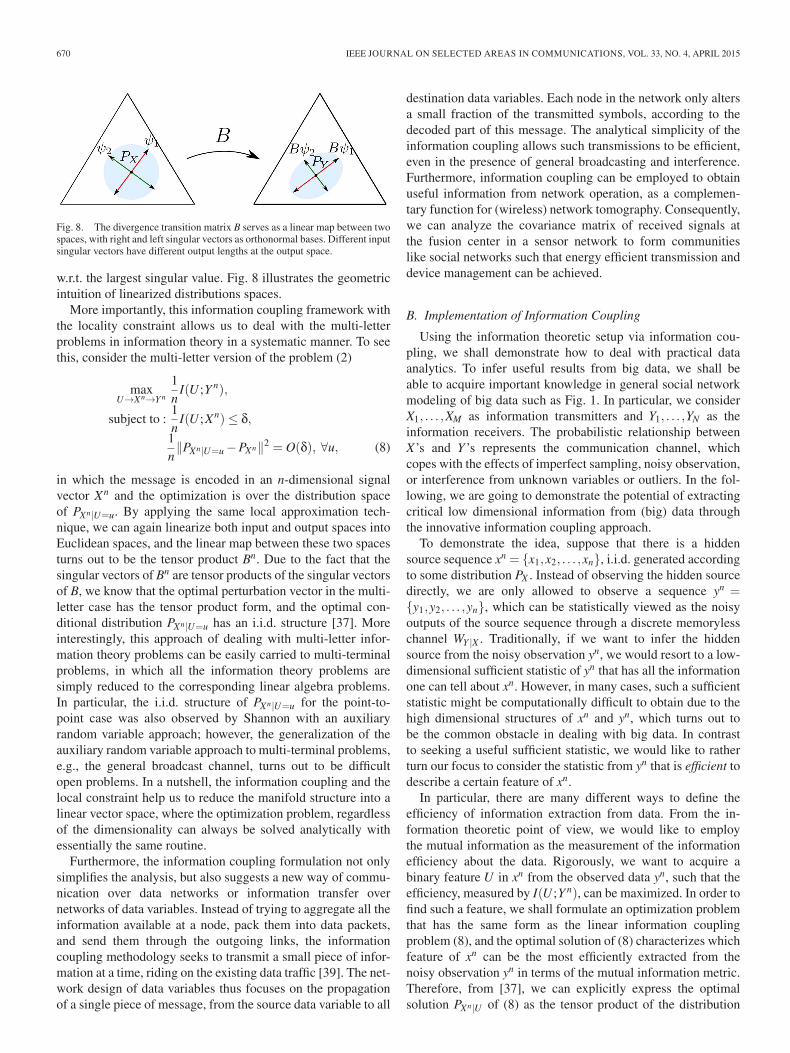
Fig. 8. The divergence transition matrix B serves as a linear map between twospaces, with right and left singular vectors as orthonormal bases. Different inputsingular vectors have different output lengths at the output space.
w.r.t. the largest singular value. Fig. 8 illustrates the geometricintuition of linearized distributions spaces.
More importantly, this information coupling framework withthe locality constraint allows us to deal with the multi-letterproblems in information theory in a systematic manner. To seethis, consider the multi-letter version of the problem (2)
maxU→Xn→Y n
1n
I(U ;Y n),
subject to :1n
I(U ;Xn)≤ δ,1n‖PXn|U=u −PXn‖2 = O(δ), ∀u, (8)
in which the message is encoded in an n-dimensional signalvector Xn and the optimization is over the distribution spaceof PXn|U=u. By applying the same local approximation tech-nique, we can again linearize both input and output spaces intoEuclidean spaces, and the linear map between these two spacesturns out to be the tensor product Bn. Due to the fact that thesingular vectors of Bn are tensor products of the singular vectorsof B, we know that the optimal perturbation vector in the multi-letter case has the tensor product form, and the optimal con-ditional distribution PXn|U=u has an i.i.d. structure [37]. Moreinterestingly, this approach of dealing with multi-letter infor-mation theory problems can be easily carried to multi-terminalproblems, in which all the information theory problems aresimply reduced to the corresponding linear algebra problems.In particular, the i.i.d. structure of PXn|U=u for the point-to-point case was also observed by Shannon with an auxiliaryrandom variable approach; however, the generalization of theauxiliary random variable approach to multi-terminal problems,e.g., the general broadcast channel, turns out to be difficultopen problems. In a nutshell, the information coupling and thelocal constraint help us to reduce the manifold structure into alinear vector space, where the optimization problem, regardlessof the dimensionality can always be solved analytically withessentially the same routine.
Furthermore, the information coupling formulation not onlysimplifies the analysis, but also suggests a new way of commu-nication over data networks or information transfer overnetworks of data variables. Instead of trying to aggregate all theinformation available at a node, pack them into data packets,and send them through the outgoing links, the informationcoupling methodology seeks to transmit a small piece of infor-mation at a time, riding on the existing data traffic [39]. The net-work design of data variables thus focuses on the propagationof a single piece of message, from the source data variable to all
destination data variables. Each node in the network only altersa small fraction of the transmitted symbols, according to thedecoded part of this message. The analytical simplicity of theinformation coupling allows such transmissions to be efficient,even in the presence of general broadcasting and interference.Furthermore, information coupling can be employed to obtainuseful information from network operation, as a complemen-tary function for (wireless) network tomography. Consequently,we can analyze the covariance matrix of received signals atthe fusion center in a sensor network to form communitieslike social networks such that energy efficient transmission anddevice management can be achieved.
B. Implementation of Information Coupling
Using the information theoretic setup via information cou-pling, we shall demonstrate how to deal with practical dataanalytics. To infer useful results from big data, we shall beable to acquire important knowledge in general social networkmodeling of big data such as Fig. 1. In particular, we considerX1, . . . ,XM as information transmitters and Y1, . . . ,YN as theinformation receivers. The probabilistic relationship betweenX’s and Y ’s represents the communication channel, whichcopes with the effects of imperfect sampling, noisy observation,or interference from unknown variables or outliers. In the fol-lowing, we are going to demonstrate the potential of extractingcritical low dimensional information from (big) data throughthe innovative information coupling approach.
To demonstrate the idea, suppose that there is a hiddensource sequence xn = {x1,x2, . . . ,xn}, i.i.d. generated accordingto some distribution PX . Instead of observing the hidden sourcedirectly, we are only allowed to observe a sequence yn ={y1,y2, . . . ,yn}, which can be statistically viewed as the noisyoutputs of the source sequence through a discrete memorylesschannel WY |X . Traditionally, if we want to infer the hiddensource from the noisy observation yn, we would resort to a low-dimensional sufficient statistic of yn that has all the informationone can tell about xn. However, in many cases, such a sufficientstatistic might be computationally difficult to obtain due to thehigh dimensional structures of xn and yn, which turns out tobe the common obstacle in dealing with big data. In contrastto seeking a useful sufficient statistic, we would like to ratherturn our focus to consider the statistic from yn that is efficient todescribe a certain feature of xn.
In particular, there are many different ways to define theefficiency of information extraction from data. From the in-formation theoretic point of view, we would like to employthe mutual information as the measurement of the informationefficiency about the data. Rigorously, we want to acquire abinary feature U in xn from the observed data yn, such that theefficiency, measured by I(U ;Y n), can be maximized. In order tofind such a feature, we shall formulate an optimization problemthat has the same form as the linear information couplingproblem (8), and the optimal solution of (8) characterizes whichfeature of xn can be the most efficiently extracted from thenoisy observation yn in terms of the mutual information metric.Therefore, from [37], we can explicitly express the optimalsolution PXn|U of (8) as the tensor product of the distribution
CHEN et al.: COMMUNICATION THEORETIC DATA ANALYTICS 671
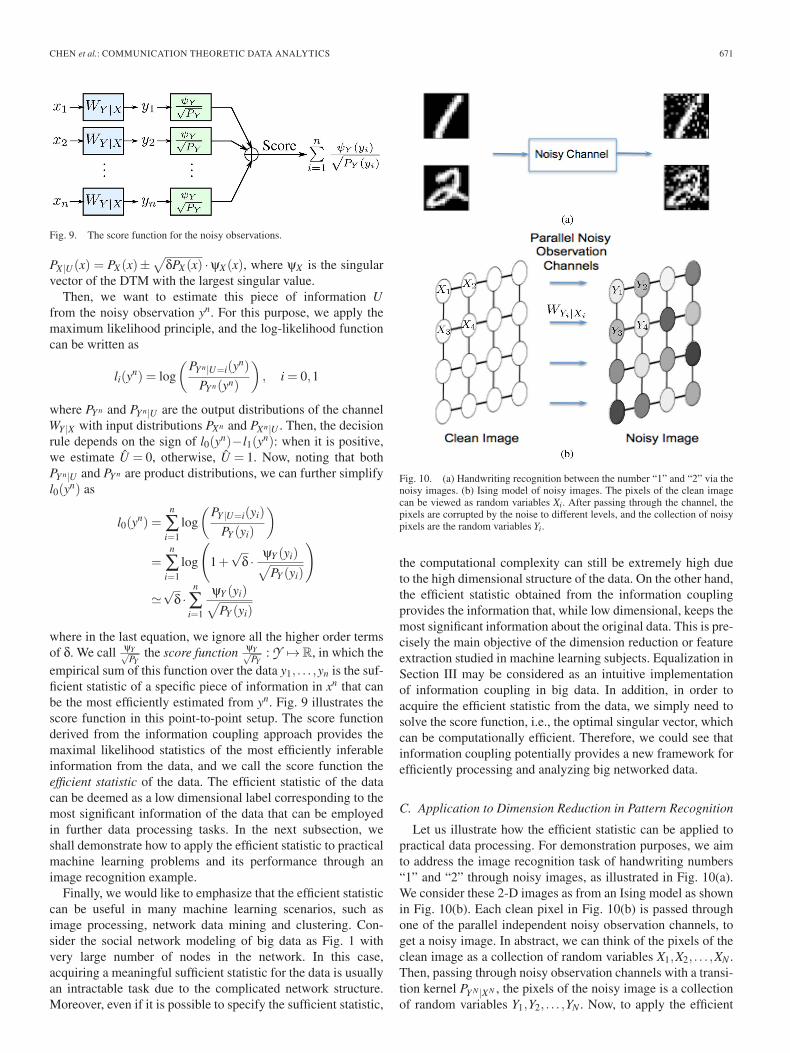
Fig. 9. The score function for the noisy observations.
PX |U (x) = PX (x)±√
δPX (x) ·ψX (x), where ψX is the singularvector of the DTM with the largest singular value.
Then, we want to estimate this piece of information Ufrom the noisy observation yn. For this purpose, we apply themaximum likelihood principle, and the log-likelihood functioncan be written as
li(yn) = log
(PY n|U=i(y
n)
PY n(yn)
), i = 0,1
where PY n and PY n|U are the output distributions of the channelWY |X with input distributions PXn and PXn|U . Then, the decisionrule depends on the sign of l0(yn)−l1(yn): when it is positive,we estimate U = 0, otherwise, U = 1. Now, noting that bothPY n|U and PY n are product distributions, we can further simplifyl0(yn) as
l0(yn) =
n
∑i=1
log
(PY |U=i(yi)
PY (yi)
)
=n
∑i=1
log
(1+
√δ · ψY (yi)√
PY (yi)
)
�√
δ ·n
∑i=1
ψY (yi)√PY (yi)
where in the last equation, we ignore all the higher order termsof δ. We call ψY√
PYthe score function ψY√
PY: Y �→R, in which the
empirical sum of this function over the data y1, . . . ,yn is the suf-ficient statistic of a specific piece of information in xn that canbe the most efficiently estimated from yn. Fig. 9 illustrates thescore function in this point-to-point setup. The score functionderived from the information coupling approach provides themaximal likelihood statistics of the most efficiently inferableinformation from the data, and we call the score function theefficient statistic of the data. The efficient statistic of the datacan be deemed as a low dimensional label corresponding to themost significant information of the data that can be employedin further data processing tasks. In the next subsection, weshall demonstrate how to apply the efficient statistic to practicalmachine learning problems and its performance through animage recognition example.
Finally, we would like to emphasize that the efficient statisticcan be useful in many machine learning scenarios, such asimage processing, network data mining and clustering. Con-sider the social network modeling of big data as Fig. 1 withvery large number of nodes in the network. In this case,acquiring a meaningful sufficient statistic for the data is usuallyan intractable task due to the complicated network structure.Moreover, even if it is possible to specify the sufficient statistic,
Fig. 10. (a) Handwriting recognition between the number “1” and “2” via thenoisy images. (b) Ising model of noisy images. The pixels of the clean imagecan be viewed as random variables Xi. After passing through the channel, thepixels are corrupted by the noise to different levels, and the collection of noisypixels are the random variables Yi.
the computational complexity can still be extremely high dueto the high dimensional structure of the data. On the other hand,the efficient statistic obtained from the information couplingprovides the information that, while low dimensional, keeps themost significant information about the original data. This is pre-cisely the main objective of the dimension reduction or featureextraction studied in machine learning subjects. Equalization inSection III may be considered as an intuitive implementationof information coupling in big data. In addition, in order toacquire the efficient statistic from the data, we simply need tosolve the score function, i.e., the optimal singular vector, whichcan be computationally efficient. Therefore, we could see thatinformation coupling potentially provides a new framework forefficiently processing and analyzing big networked data.
C. Application to Dimension Reduction in Pattern Recognition
Let us illustrate how the efficient statistic can be applied topractical data processing. For demonstration purposes, we aimto address the image recognition task of handwriting numbers“1” and “2” through noisy images, as illustrated in Fig. 10(a).We consider these 2-D images as from an Ising model as shownin Fig. 10(b). Each clean pixel in Fig. 10(b) is passed throughone of the parallel independent noisy observation channels, toget a noisy image. In abstract, we can think of the pixels of theclean image as a collection of random variables X1,X2, . . . ,XN .Then, passing through noisy observation channels with a transi-tion kernel PY N |XN , the pixels of the noisy image is a collectionof random variables Y1,Y2, . . . ,YN . Now, to apply the efficient
672 IEEE JOURNAL ON SELECTED AREAS IN COMMUNICATIONS, VOL. 33, NO. 4, APRIL 2015
statistic to acquire the most significant feature, we shall inprinciple go through the following procedures:
1) To determine the divergence transition matrix B, we shalldetermine the distributions PXN and PY N as well as thetransition kernel PY N |XN . The distributions PXN and PY N
can be learned from the empirical distribution of theimages viewed as N-dimensional vectors. In addition,we design the transition kernel PY N |XN in this imagerecognition example.
2) Solve the singular value decomposition of B and deter-mine the optimal left singular vector ψ of B. Note that ψhas the dimensionality |Y |N .
3) The efficient statistic is then specified by the score func-tion ψ(yN)/PY N (yN) of the data yN = {y1, . . . ,yN}, whichcan be obtained by the yN-th entry of the vector ψY ,divided by PY N (yN).
Now, let us demonstrate the application of this procedure toa practical image recognition problem. Here, we employ theMNIST Database [40] of handwritten digits as the test images,where each image is of size 19 × 19 pixels and each pixelvalue is scaled to have one of four values as in Fig. 10(a).In particular, as shown in Fig. 10(a), we have a mixture ofimages of handwritten digits 1 and 2, and we assume that wecan observe the noisy version of these images. Our goal is toseparate these noisy images with respect to different digits bycomputing the score of these images with our algorithm andordering them.
To this end, we view the (clean) images as generated fromthe Ising model, in which each pixel corresponds to the nodesXi in the Ising model. Then, we pass each pixel in the imagesindependently through a discrete memoryless channel withtransition matrix
⎡⎢⎣
1−2e 2e e e2
e 1−3e 2e e4
e 0 1−4e e4
0 e e 1− e
⎤⎥⎦ . (9)
Here, the transition matrix is chosen merely to facilitate oursimulation, and e is the parameter measuring the noise level ofthe channel. After passing clean pixels through the channel, weobserve the noisy version of these images, where each noisypixel corresponds to Yi in this setup. Clearly, the empirical jointinput and output distributions can be obtained by the statisticsof the images. Then, we can apply our algorithm to computethe score for each noisy image, and then order these scores toseparate images with respect to different digits.
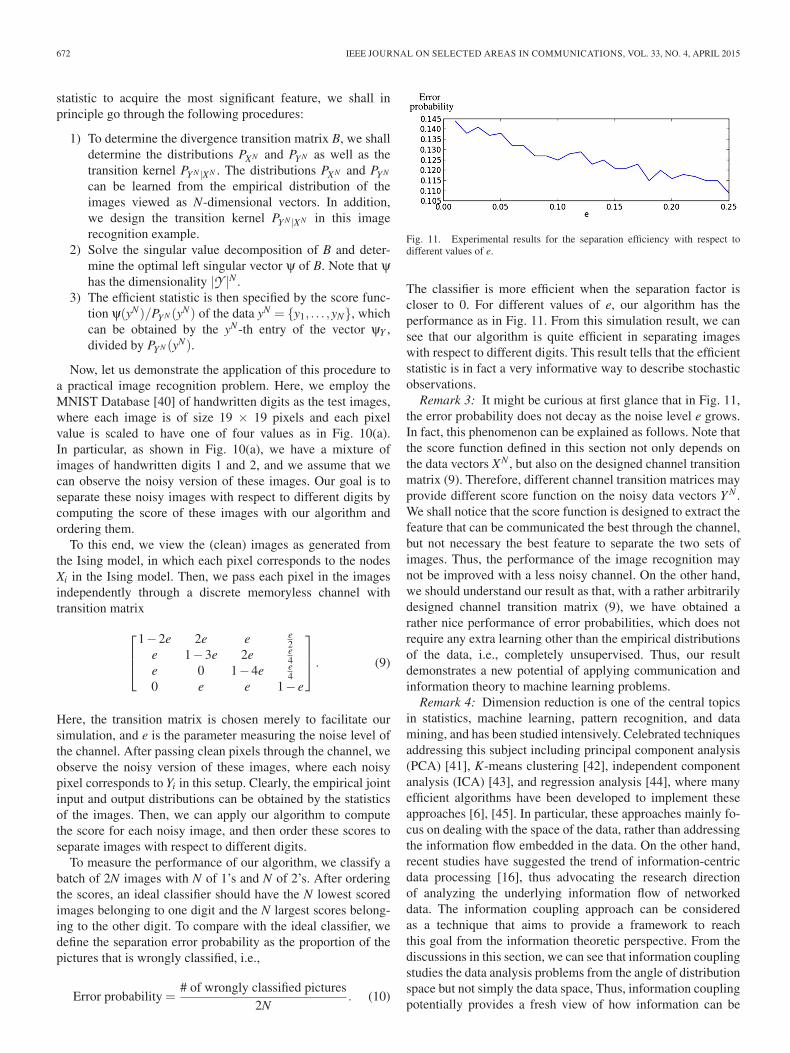
To measure the performance of our algorithm, we classify abatch of 2N images with N of 1’s and N of 2’s. After orderingthe scores, an ideal classifier should have the N lowest scoredimages belonging to one digit and the N largest scores belong-ing to the other digit. To compare with the ideal classifier, wedefine the separation error probability as the proportion of thepictures that is wrongly classified, i.e.,
Error probability =# of wrongly classified pictures
2N. (10)
Fig. 11. Experimental results for the separation efficiency with respect todifferent values of e.
The classifier is more efficient when the separation factor iscloser to 0. For different values of e, our algorithm has theperformance as in Fig. 11. From this simulation result, we cansee that our algorithm is quite efficient in separating imageswith respect to different digits. This result tells that the efficientstatistic is in fact a very informative way to describe stochasticobservations.
Remark 3: It might be curious at first glance that in Fig. 11,the error probability does not decay as the noise level e grows.In fact, this phenomenon can be explained as follows. Note thatthe score function defined in this section not only depends onthe data vectors XN , but also on the designed channel transitionmatrix (9). Therefore, different channel transition matrices mayprovide different score function on the noisy data vectors Y N .We shall notice that the score function is designed to extract thefeature that can be communicated the best through the channel,but not necessary the best feature to separate the two sets ofimages. Thus, the performance of the image recognition maynot be improved with a less noisy channel. On the other hand,we should understand our result as that, with a rather arbitrarilydesigned channel transition matrix (9), we have obtained arather nice performance of error probabilities, which does notrequire any extra learning other than the empirical distributionsof the data, i.e., completely unsupervised. Thus, our resultdemonstrates a new potential of applying communication andinformation theory to machine learning problems.
Remark 4: Dimension reduction is one of the central topicsin statistics, machine learning, pattern recognition, and datamining, and has been studied intensively. Celebrated techniquesaddressing this subject including principal component analysis(PCA) [41], K-means clustering [42], independent componentanalysis (ICA) [43], and regression analysis [44], where manyefficient algorithms have been developed to implement theseapproaches [6], [45]. In particular, these approaches mainly fo-cus on dealing with the space of the data, rather than addressingthe information flow embedded in the data. On the other hand,recent studies have suggested the trend of information-centricdata processing [16], thus advocating the research directionof analyzing the underlying information flow of networkeddata. The information coupling approach can be consideredas a technique that aims to provide a framework to reachthis goal from the information theoretic perspective. From thediscussions in this section, we can see that information couplingstudies the data analysis problems from the angle of distributionspace but not simply the data space, Thus, information couplingpotentially provides a fresh view of how information can be
CHEN et al.: COMMUNICATION THEORETIC DATA ANALYTICS 673
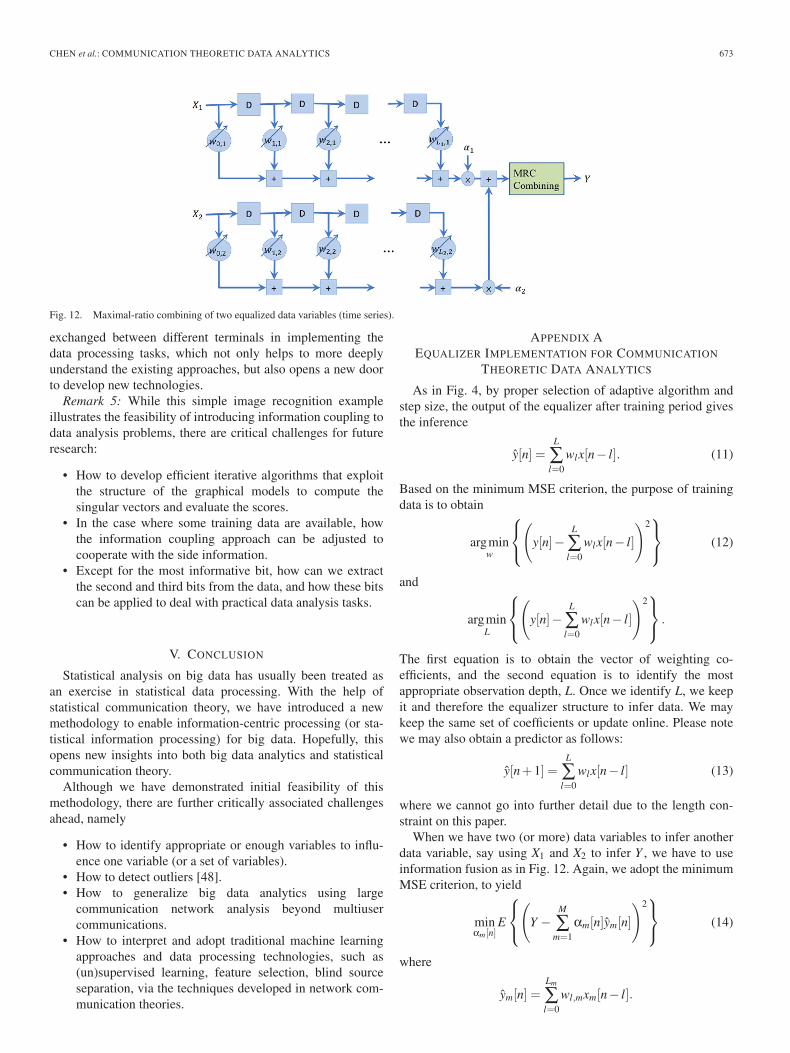
Fig. 12. Maximal-ratio combining of two equalized data variables (time series).
exchanged between different terminals in implementing thedata processing tasks, which not only helps to more deeplyunderstand the existing approaches, but also opens a new doorto develop new technologies.
Remark 5: While this simple image recognition exampleillustrates the feasibility of introducing information coupling todata analysis problems, there are critical challenges for futureresearch:
• How to develop efficient iterative algorithms that exploitthe structure of the graphical models to compute thesingular vectors and evaluate the scores.
• In the case where some training data are available, howthe information coupling approach can be adjusted tocooperate with the side information.
• Except for the most informative bit, how can we extractthe second and third bits from the data, and how these bitscan be applied to deal with practical data analysis tasks.
V. CONCLUSION
Statistical analysis on big data has usually been treated asan exercise in statistical data processing. With the help ofstatistical communication theory, we have introduced a newmethodology to enable information-centric processing (or sta-tistical information processing) for big data. Hopefully, thisopens new insights into both big data analytics and statisticalcommunication theory.
Although we have demonstrated initial feasibility of thismethodology, there are further critically associated challengesahead, namely
• How to identify appropriate or enough variables to influ-ence one variable (or a set of variables).
• How to detect outliers [48].• How to generalize big data analytics using large
communication network analysis beyond multiusercommunications.
• How to interpret and adopt traditional machine learningapproaches and data processing technologies, such as(un)supervised learning, feature selection, blind sourceseparation, via the techniques developed in network com-munication theories.
APPENDIX AEQUALIZER IMPLEMENTATION FOR COMMUNICATION
THEORETIC DATA ANALYTICS
As in Fig. 4, by proper selection of adaptive algorithm andstep size, the output of the equalizer after training period givesthe inference
y[n] =L
∑l=0
wlx[n− l]. (11)
Based on the minimum MSE criterion, the purpose of trainingdata is to obtain
argminw
⎧⎨⎩(
y[n]−L
∑l=0
wlx[n− l]
)2⎫⎬⎭ (12)
and
argminL
⎧⎨⎩(
y[n]−L
∑l=0
wlx[n− l]
)2⎫⎬⎭ .
The first equation is to obtain the vector of weighting co-efficients, and the second equation is to identify the mostappropriate observation depth, L. Once we identify L, we keepit and therefore the equalizer structure to infer data. We maykeep the same set of coefficients or update online. Please notewe may also obtain a predictor as follows:
y[n+1] =L
∑l=0
wlx[n− l] (13)
where we cannot go into further detail due to the length con-straint on this paper.
When we have two (or more) data variables to infer anotherdata variable, say using X1 and X2 to infer Y , we have to useinformation fusion as in Fig. 12. Again, we adopt the minimumMSE criterion, to yield
minαm[n]
E
⎧⎨⎩(
Y −M
∑m=1
αm[n]ym[n]
)2⎫⎬⎭ (14)
where
ym[n] =Lm
∑l=0
wl,mxm[n− l].

674 IEEE JOURNAL ON SELECTED AREAS IN COMMUNICATIONS, VOL. 33, NO. 4, APRIL 2015
Necessary conditions for this minimization gives the solutionfor αm[n]. The consequent estimator is therefore
y[n] =M
∑m=1
αm[n]ym[n] =M
∑m=1
αm[n]Lm
∑l=0
wl,mxm[n− l] (15)
which is defined as the maximal ratio combining of equalizedmultivariate regression of different optimal observation lengthsLm, m = 1, . . . ,M. This design realizes the idea of maximizinginformation flow between data variables or time series. For easeof implementation, we may set αm[n] = αm, or we may adoptselective combining and equal-gain combining.
Remark 6: A conjecture to explain why we intend to equal-ize data of a certain length Lm, instead of the entire data set, isthat earlier components in the time series may introduce verynoisy information, like interference or noise in multiuser com-munication systems or simply weakly correlated informationafter a large time separation. Such lengths Lm, m = 1, . . . . ,M,for data variables X1, . . . ,XM , represent the span/range of usefuldata for inference. Of course, based on the MSE, we mayfurther select useful data variables among X1, . . . ,XM . Similarconcepts are not rare in machine learning, for example, toidentify support vectors in support vector machines (SVMs).What we are doing here is more effective implementation byproperly selecting data variables, range of observations, and fi-nally weighting coefficients in each equalizer, for multivariate-regression leveraging the optimization of information transferbetween relational data variables.
ACKNOWLEDGMENT
The authors thank Jia-Pei Lu of National Taiwan University,and Fabián Kozynski of the Massachusetts Institute of Technol-ogy for their programming of the numerical examples.
REFERENCES
[1] X. Wu, X. Zhu, G. Q. Wu, and W. Ding, “Data mining with big data,”IEEE Trans. Knowl. Data Eng., vol. 26, no. 1, pp. 97–107, Jan. 2014.
[2] M. J. Wainwright and M. I. Jordan, “Graphical models, exponential fam-ilies, variational inference,” Found. Trends Mach. Learn., vol. 1, no. 1/2,pp. 1–305, Jan. 2008.
[3] J. Han and M. Kamber, Data Mining: Concepts and Techniques, 2nd ed.San Mateo, CA, USA: Morgan Kaufmann, 2006.
[4] U. Fayyad, G. Piatetsky-Shapiro, and R. Smyth, “From data mining toknowledge discovery in databases,” AI Mag., vol. 17, no. 3, pp. 37–54,1996.
[5] F. V. Jensen and T. D. Nielsen, Bayesian Networks and Decision Graphs,2nd ed. New York, NY, USA: Springer-Verlag, 2007.
[6] D. Koller and N. Friedman, Probabilistic Graphical Models: Principlesand Techniques. Cambridge, MA, USA: MIT Press, 2009.
[7] T. Hastie, R. Tibshirani, and J. Friedman, The Elements of StatisticalLearning, 2nd ed. New York, NY, USA: Springer-Verlag, 2009.
[8] R. Silva, R. Scheines, C. Glymour, and P. Spirtes, “Learning the structureof linear latent variable models,” J. Mach. Learn. Res., vol. 7, pp. 191–246, Dec. 2006.
[9] J. B. Tenenbaum, V. de Silva, and J. C. Langford, “A global geometricframework for nonlinear dimensionality reduction,” Science, vol. 290,no. 5500, pp. 2319–2323, Dec. 22, 2000.
[10] S. T. Roweis and L. K. Saul, “Nonlinear dimensionality reduction bylocally linear embedding,” Science, vol. 290, no. 5500, pp. 2323–2326,Dec. 22, 2000.
[11] S. Ji, Y. Xue, and L. Carin, “Bayesian compressive sensing,” IEEE Trans.Signal Process., vol. 56, no. 6, pp. 2346–2356, Jun. 2008.
[12] T. G. Kolda and B. W. Bader, “Tensor decomposition and applications,”SIAM Rev., vol. 51, no. 3, pp. 455–500, 2009.
[13] S. C. Lin and K. C. Chen, “Improving spectrum efficiency via in-networkcomputations in cognitive radio sensor networks,” IEEE Trans. WirelessCommun., vol. 13, no. 3, pp. 1222–1234, Mar. 2014.
[14] X.-W. Chen and A. Lin, “Big data deep learning: Challenges and perspec-tives,” IEEE Access, vol. 2, pp. 514–525, 2014.
[15] W. Tan, M. B. Blake, I. Saleh, and S. Dustdar, “Social-network-sourcedbig data analytics,” IEEE Internet Comput., vol. 17, no. 5, pp. 62–69,Sep./Oct. 2013.
[16] K. C. Chen, M. Chiang, and H. V. Poor, “From technological networks tosocial networks,” IEEE J. Sel. Areas Commun., vol. 31, no. 9, pp. 548–572, Sep. 2013.
[17] D. Estrin, “Small data where n = me,” Commun. ACM, vol. 57, no. 4,pp. 32–34, Apr. 2014.
[18] S. Verdú, Multiuser Detection. Cambridge, U.K.: Cambridge Univ.Press, 1998.
[19] M. Koivisto and K. Sood, “Exact Bayesian structure discovery in Bayesiannetworks,” J. Mach. Learn. Res., vol. 5, pp. 549–573, May 2004.
[20] Z. Wang and L. Chan, “Learning causal relations in multivariate timeseries data,” ACM Trans. Intell. Syst. Technol., vol. 3, no. 4, p. 76,Sep. 2012.
[21] G. Stuber et al., “Broadband MIMO-OFDM wireless communications,”IEEE J. Sel. Areas Commun., vol. 92, no. 2, pp. 271–294, Feb. 2004.
[22] A. Sandryhalia and J. M. F. Moura, “Big data analysis with signal pro-cessing on graphs,” IEEE Signal Process. Mag., vol. 31, no. 5, pp. 80–90,Sep. 2014.
[23] R. S. Blum, S. A. Kassam, and H. V. Poor, “Distributed detectionwith multiple sensors: Part II,” Proc. IEEE, vol. 85, no. 1, pp. 64–79,Jan. 1997.
[24] L. Tong and S. Perreau, “Multichannel blind identification: From subspaceto maximum likelihood methods,” Proc. IEEE, vol. 86, no. 10, pp. 1951–1968, Oct. 1998.
[25] C. Yu, L. Xie, and Y. C. Soh, “Blind channel and source estimationin networked systems,” IEEE Trans. Signal Process., vol. 62, no. 17,pp. 4611–4626, Sep. 2014.
[26] S. M. Kay, Fundamentals of Statistical Signal Processing: EstimationTheory. Englewood Cliffs, NJ, USA: Prentice-Hall, 1993.
[27] A. D. Rencher and W. F. Christensen, Methods of Multivariate Analysis.Hoboken, NJ, USA: Wiley, 2012.
[28] L. Lacasa, B. Luque, F. Baillesteros, J. Luque, and J. A. Nuno, “Fromtime series to complex networks: The visible graph,” Proc. Nat. Acad.Sci., vol. 105, no. 13, pp. 4932–4975, Apr. 1, 2008.
[29] A. S. L. O. Campanharo, M. M. Irmak Sirer, R. Dean Malmgren,F. M. Ramos, and L. A. N. Amara, “Duality between time series andnetworks,” PLoS ONE, vol. 6, no. 8, p. e23378, Aug. 2011.
[30] M. Last, Y. Klein, and A. Kandel, “Knowledge discovery in time seriesdatabases,” IEEE Trans. Syst., Man, Cybern. B, Cybern., vol. 31, no. 1,pp. 160–169, Feb. 2001.
[31] I. S. Dhillon, S. Mallela, and D. S. Modha, “Information-theoretical co-clustering,” in Proc. ACM SIGKDD, 2003, pp. 89–98.
[32] P. Esling and C. Agon, “Time-series data mining,” ACM Comput. Survey,vol. 45, no. 1, p. 12, Nov. 2012.
[33] A. C. Harvey and R. G. Pierse, “Estimating missing observations in eco-nomic time series,” J. Amer. Statist. Assoc., vol. 79, no. 385, pp. 125–131,Mar. 1984.
[34] D. Barber and A. T. Cemgil, “Graphical models in time series,” IEEESignal Process. Mag., vol. 27, no. 6, pp. 18–28, Nov. 2010.
[35] R. A. Rossi and N. K. Ahmed, “Role discovery in networks,” IEEE Trans.Knowl. Eng., 2014, to be published.
[36] S.-I. Amari and H. Nagaoka, Methods of Information Geometry.London, U.K.: Oxford Univ. Press, 2000.
[37] S.-L. Huang and L. Zheng, “Linear information coupling problems,” inProc. IEEE Int. Symp. Inf. Theory, Jul. 2012, pp. 1029–1033.
[38] S. Borade and L. Zheng, “Euclidean information theory,” in Proc. IEEEInt. Zurich Seminars Commun., Mar. 2008, pp. 14–17.
[39] S.-L. Huang, C. Suh, and L. Zheng, “Euclidean information theory ofnetworks,” in Proc. IEEE Int. Symp. Inf. Theory, Jul. 2013, pp. 794–798.
[40] MNIST Handwritten Digit Database. [Online]. Available: http://yann.lecun.com/exdb/mnist/
[41] I. T. Jolliffe, Principal Component Analysis. New York, NY, USA:Springer-Verlag, 1986.
[42] C. Ding and X. He, “K-means clustering via principal componentanalysis,” in Proc. 21st ICML, New York, NY, USA, 2004, pp. 29–36.
[43] A. Hyvarinen, J. Karhunen, and E. Oja, Independent Component Analysis.New York, NY, USA: Wiley, 2001.
[44] D. A. Freedman, Statistical Models: Theory and Practice. Cambridge,U.K.: Cambridge Univ. Press, 2005.
[45] R. E. Kalman, “A new approach to linear filtering and prediction prob-lems,” J. Fluids Eng., vol. 82, no. 1, pp. 35–45, Mar. 1960.

CHEN et al.: COMMUNICATION THEORETIC DATA ANALYTICS 675
[46] A. P. Dempster, N. M. Laird, and D. B. Rubin, “Maximum likelihood fromincomplete data via the EM algorithm,” J. R. Statist. Soc., vol. 39, no. 1,pp. 1–38, 1977.
[47] M. Singh and M. Valtorta, “Construction of Bayesian network structuresfrom data: A brief survey and an efficient algorithm,” Int. J. Approx.Reason., vol. 12, no. 2, pp. 111–131, Feb. 1995.
[48] A. Tajer, V. V. Veeravalli, and H. V. Poor, “Outlying sequence detectionin large data sets,” IEEE Signal Process. Mag., vol. 31, no. 5, pp. 44–56,Sep. 2014.
Kwang-Cheng Chen (M’89–SM’94–F’07) receivedthe B.S. degree from National Taiwan University,Taipei, Taiwan, in 1983 and the M.S. and Ph.D.degrees from the University of Maryland, CollegePark, MD, USA, in 1987 and 1989, all in electricalengineering. From 1987 to 1998, he was with SSE,COMSAT, IBM Thomas J. Watson Research Center,and National Tsing Hua University, working on mo-bile communications and networks. Since 1998, hehas been with National Taiwan University, where isthe Distinguished Professor and Associate Dean for
academic affairs at the College of Electrical Engineering and Computer Sci-ence. His recent research interests include wireless communications, networkscience, and data analytics. He has been actively involved in the organizationof various IEEE conferences as General/TPC/Chair/Co-Chair and has servedin editorships with a few IEEE journals. He also actively participates in andhas contributed essential technology to various IEEE 802, Bluetooth, and LTEand LTE-A wireless standards. He was a recipient of a number of awards,such as the 2011 IEEE COMSOC WTC Recognition Award, 2014 IEEEJack Neubauer Memorial Award, and 2014 IEEE COMSOC AP OutstandingPaper Award.
Shao-Lun Huang received the B.S. degree (withhonors) from National Taiwan University, Taipei,Taiwan, in 2008 and the M.S. and Ph.D. degreesfrom the Massachusetts Institute of Technology,Cambridge, MA, USA, in 2010 and 2013, respec-tively. Since 2013, he has been working jointly atthe Department of Electrical Engineering, NationalTaiwan University, and the Department of ElectricalEngineering and Computer Science, MassachusettsInstitute of Technology, where he is currently aPostdoctoral Researcher. His research interests in-
clude communication theory, information theory, machine learning, and socialnetworks.
Lizhong Zheng received the B.S. and M.S. degreesfrom Tsinghua University, Beijing, China, in 1994and 1997, respectively, and the Ph.D. degree fromthe University of California, Berkeley, CA, USA, in2002. Since 2002, he has been with the Departmentof Electrical Engineering and Computer Sciences,Massachusetts Institute of Technology, Cambridge,MA, USA, where he is currently a Professorof electrical engineering and computer sciences.His research interests include information theory,wireless communications, and statistical inference.
He was a recipient of the IEEE Information Theory Society Paper Award in2003, the NSF CAREER Award in 2004, and the AFOSR Young InvestigatorAward in 2007.
H. Vincent Poor (S’72–M’77–SM’82–F’87) re-ceived the Ph.D. degree in electrical engineeringand computer science from Princeton University,Princeton, NJ, USA, in 1977. From 1977 until 1990,he was on the faculty of the University of Illinoisat Urbana-Champaign. Since 1990, he has been onthe faculty at Princeton University, where he is theMichael Henry Strater University Professor of Elec-trical Engineering and Dean of the School of Engi-neering and Applied Science. His research interestsare in the areas of information theory, statistical
signal processing and stochastic analysis, and their applications in wirelessnetworks and related fields, including social networks and smart grid. Amonghis publications in these areas are the recent books Principles of CognitiveRadio (Cambridge Univ. Press, 2013) and Mechanisms and Games for DynamicSpectrum Allocation (Cambridge Univ. Press, 2014).
Dr. Poor is a member of the National Academy of Engineering and theNational Academy of Sciences and a foreign member of Academia Europaeaand the Royal Society. He is also a fellow of the American Academy of Artsand Sciences, the Royal Academy of Engineering (U.K.), and the Royal Societyof Edinburgh. He was a recipient of the Marconi and Armstrong Awards ofthe IEEE Communications Society in 2007 and 2009, respectively. Recentrecognition of his work includes the 2014 URSI Booker Gold Medal andhonorary doctorates from Aalborg University, Aalto University, the Hong KongUniversity of Science and Technology, and the University of Edinburgh.