community attitudes to biotechnology report on food and agriculture applications · ·...
TRANSCRIPT

COMMUNITY ATTITUDES TO BIOTECHNOLOGY REPORT ON FOOD AND AGRICULTURE
APPLICATIONS
Prepared for Biotechnology Australia Eureka Project 4001

TABLE OF CONTENTS
Research context 1
Research design 3
Research findings 6 Overall awareness and perceptions of biotechnology in the area of food and agriculture 7 Awareness and perceptions of GM food crops 21 Awareness and perceptions of biotechnology (non-GM) food crops 39 Awareness and perceptions of GM non-food crops 43
Conclusions 50

BIOTECHNOLOGY AUSTRALIA COMMUNITY PERCEPTIONS OF BIOTECHNOLOGY
JUNE 2007 | PAGE 1
RESEARCH CONTEXT
Biotechnology Australia
Biotechnology Australia is a multi-departmental Australian Government agency responsible for
managing, with its partners, the National Biotechnology Strategy (NBS) and coordinating non-
regulatory biotechnology issues for the Australian Government. Biotechnology Australia’s goal
is to ensure Australia captures the benefits arising from the medical, agricultural and
environmental application of biotechnology, while protecting the safety of people and the
environment.
Importance of community attitudes
Community attitudes are a crucial issue in the development of the Australian biotechnology
sector. If Australians are not in favour of certain applications of biotechnology, efforts made by
scientists on research and development will be constricted, and a host of potential benefits in
fields ranging from medicine to food to textiles are likely to be lost. There is a need to
understand the underlying drivers of community acceptance of biotechnology and ways in
which public rejection of biotechnology may be minimised - both to inform the public about
biotechnology and to inform scientists of the public’s needs and concerns
The nature of community attitudes
Research has shown that it is no longer sufficient to ask broad questions relating to attitudes
towards, or acceptance of, biotechnology per se, as these measures vary markedly for different
applications of biotechnology and gene technology. Issues that may be taken into account
when evaluating an application are:
Potential harm to humans, animals or the environment
1 This section outlines the background
to the project, and specifies our understanding of the research
objectives

BIOTECHNOLOGY AUSTRALIA COMMUNITY PERCEPTIONS OF BIOTECHNOLOGY
JUNE 2007 | PAGE 2
Regulation and control of the process of development
Scope of benefits: humanity, scientific career advancement, or corporate profit
Potential for unforeseen outcomes to occur
Trade-offs may occur among these factors. For instance, harm to animals may be acceptable
to some if the application can save human lives, but not if it only is for corporate profit.
The need for research
This research represents the fifth wave of Biotechnology Australia’s ongoing attitudinal
research. As such, it is an opportunity to identify and understand any new issues that have
arisen, as well as any changes in community attitudes and their drivers, since 2005. The
increased understanding of social drivers of attitudes regarding biotechnology will be used to
identify differences in the various audiences and stakeholders. Finally, the research will enable
the success of some aspects of the Public Awareness Program to be measured.
The enhanced understanding of community attitudes and concerns that will result from this
research will be used to guide the further development of the Public Awareness Program. It
will uncover any significant changes, new problem areas and priority targets in terms of public
attitudes to be addressed. It will also provide information on the most effective means by
which information can be imparted, and guidance in terms of the conduct of further community
consultations.
Research objectives
Overall, the aim of this project was to update and further develop understanding of the
community’s awareness of, attitudes towards and concerns about different applications of
biotechnology, and the ways in which these drive community acceptance. In addition, research
aimed to understand community aspirations for biotechnology, information sources, and the
success of current public information and awareness strategies.

BIOTECHNOLOGY AUSTRALIA COMMUNITY PERCEPTIONS OF BIOTECHNOLOGY
JUNE 2007 | PAGE 3
RESEARCH DESIGN
To meet these objectives, a multi-stage quantitative-qualitative methodology was undertaken,
as illustrated in the following diagram.
A multi-stage research program
Initially, a brief literature review was conducted to ensure that Eureka was fully aware of any
new developments in the area of biotechnology. Following this, a phase of exploratory
2 In this section, details of our
proposed research design are provided, as well as our rationale for
using this methodology
Exploratory qualitative research
Questionnaire design and pre-piloting
Quantitative survey
Explanatory qualitative research
Reporting of findings and strategic recommendations
Review of recent research and literature
Exploratory qualitative research
Questionnaire design and pre-piloting
Quantitative survey
Explanatory qualitative research
Reporting of findings and strategic recommendations
Review of recent research and literature
BIOTECHNOLOGY AUSTRALIA COMMUNITY PERCEPTIONS OF BIOTECHNOLOGY
JUNE 2007 | PAGE 4
qualitative research was conducted in order to identify issues, attitudes, motivations and
behaviours which may have arisen since the last wave of the research. Quantitative research
was then carried out to measure the incidence of awareness, perceptions and attitudes relating
to biotechnology. This phase utilised a split sample CATI/ online methodology. Finally, an
explanatory phase of qualitative research was conducted in order to investigate and explain in
detail the findings from the survey.
Sample
Exploratory qualitative phase
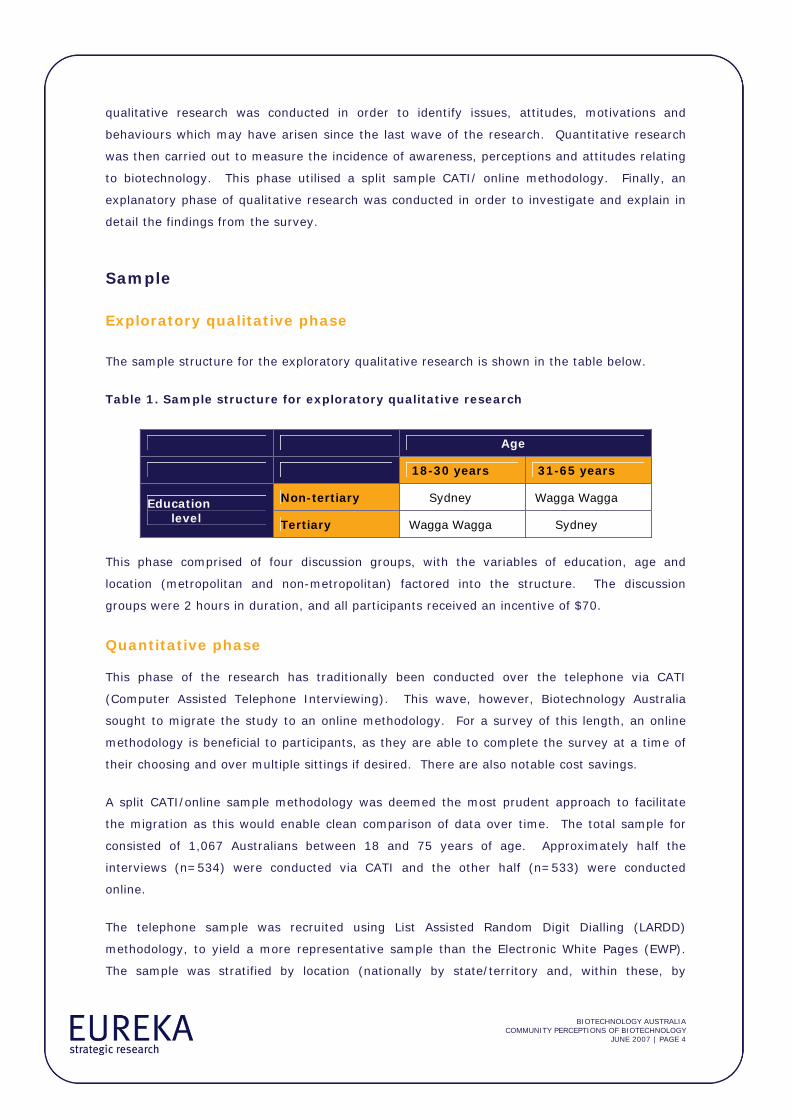
The sample structure for the exploratory qualitative research is shown in the table below.
Table 1. Sample structure for exploratory qualitative research
Age
18-30 years 31-65 years
Non-tertiary Sydney Wagga Wagga Education level Tertiary Wagga Wagga Sydney
This phase comprised of four discussion groups, with the variables of education, age and
location (metropolitan and non-metropolitan) factored into the structure. The discussion
groups were 2 hours in duration, and all participants received an incentive of $70.
Quantitative phase
This phase of the research has traditionally been conducted over the telephone via CATI
(Computer Assisted Telephone Interviewing). This wave, however, Biotechnology Australia
sought to migrate the study to an online methodology. For a survey of this length, an online
methodology is beneficial to participants, as they are able to complete the survey at a time of
their choosing and over multiple sittings if desired. There are also notable cost savings.
A split CATI/online sample methodology was deemed the most prudent approach to facilitate
the migration as this would enable clean comparison of data over time. The total sample for
consisted of 1,067 Australians between 18 and 75 years of age. Approximately half the
interviews (n=534) were conducted via CATI and the other half (n=533) were conducted
online.
The telephone sample was recruited using List Assisted Random Digit Dialling (LARDD)
methodology, to yield a more representative sample than the Electronic White Pages (EWP).
The sample was stratified by location (nationally by state/territory and, within these, by

BIOTECHNOLOGY AUSTRALIA COMMUNITY PERCEPTIONS OF BIOTECHNOLOGY
JUNE 2007 | PAGE 5
rural/regional/metropolitan areas) in such a way that the sample was in proportion to the
population. In addition, within each location stratum, broad age and gender quotas were
applied, again proportional to the population. Sampling methods employing a disproportionate
chance of selection were used to deal with groups who were known to be less inclined to do
surveys or more difficult to contact (e.g. males and younger persons) in order to be
representative. Importantly, this approach mirrors the approach of the previous wave of
research, thus ensuring comparability. The questionnaire averaged 29 minutes duration.
For the online methodology, samples were sourced from an online panel, that is, individuals
who have opted to receive email invitations to participate in surveys from our fieldwork
supplier. Stratification and quota sampling occurred as per the telephone methodology.
Explanatory qualitative phase
The sample structure for the explanatory qualitative phase was based on two main variables,
location and level of support, and is presented below. In the recruitment process, participants
were required to rate their attitude towards the use of gene technology in today’s society on a
scale of 0 to 10 (where 0 is completely opposed and 10 is fully supportive). Once again, the
duration of the groups was 2 hours, and a $70 incentive was provided.
Table 2. Sample structure for explanatory qualitative research
Location
Bathurst Sydney (City) Hurstville
Low 31-65 years 18-30 years 31-65 years Level of support Medium 18-30 years 31-65 years 18-30 years
High 18-30 years 18-30 years 31-65 years
In the following chapter, results from the qualitative and quantitative phases are combined and
presented together for each issue.

BIOTECHNOLOGY AUSTRALIA COMMUNITY PERCEPTIONS OF BIOTECHNOLOGY
JUNE 2007 | PAGE 6
RESEARCH FINDINGS
This section details the findings from the quantitative and qualitative phases of research
pertaining to food and agricultural applications of biotechnology. Where it would assist the
reader to understand the research findings, verbatim quotations from research participants
have been included to illustrate the range of views typically expressed.
The findings cover overall awareness and perceptions of biotechnology in the area of food and
agricultural, as well those specifically relating to the use of genetic modification in food and
non-food crops, biotechnology in the production of food from plants. There is also an
examination of the response to media stories relating to the roles of genes in human behaviour.
The following points are relevant to the interpretation of the quantitative findings:
Data from telephone interviews (not online) has been used for this wave’s analysis, in order
to ensure methodologically consistent data are compared over time. Previous waves of
research were conducted over the telephone.
Significant trends over time are denoted with a circle (increase) or box (decrease)
A number of questionnaire changes were made to meet the needs of stakeholders involved
in the research. Comparisons over time are therefore only possible for some questions.
One important change was that definitions of biotechnology, gene technology and genetic
modification were provided at the commencement of the survey questionnaire and before
each of the later group discussions. This was done at the request of stakeholders, to avoid
any ambiguity in meaning when using these terms.
3 This section presents the findings for community attitudes and perceptions of food and agricultural applications
of biotechnology

BIOTECHNOLOGY AUSTRALIA COMMUNITY PERCEPTIONS OF BIOTECHNOLOGY
JUNE 2007 | PAGE 7
Overall awareness and perceptions of biotechnology in the area of food and agriculture
Knowledge and awareness of technology terminology
Participants in the survey were asked to indicate their self-assessed level of awareness and
knowledge of six technologies: genetic modification, gene technology, biotechnology, stem cell
research, cloning and IVF. Results for the current wave are shown in Figure 1 and results
comparing the current wave with Wave 4 are shown in Figure 2.
Figure 1. Understanding of technology terminology
5950
35 3522 18
32 47
5158
57 60
8 413
721 22
0
20
40
60
80
100
IVF Cloning Geneticmodification
Stem cellresearch
Genetechnology
Biotechnology
%
You know enough about it that you could explain it to a friend You have heard of it, but know very little or nothing about
You have not heard of it Don't know
Base: all CATI (n=534)
Participants’ self-assessed level of knowledge was highest for IVF, with 59% indicating that
they could explain the technology to a friend. One in two participants (50%) indicated an
equivalent level of knowledge for cloning, while just over one in three (35%) did so for genetic
modification and stem cell research. The technologies that participants felt least
knowledgeable about were gene technology and biotechnology. Twenty-two percent and 18%
signified that they could explain these technologies to a friend respectively.
Awareness of all technologies was high. More than nine in ten participants noted that they had
at least heard of cloning, IVF and stem cell research. Awareness of genetic modification, gene
technology and biotechnology was slightly lower, at 87%, 79% and 78% respectively.

BIOTECHNOLOGY AUSTRALIA COMMUNITY PERCEPTIONS OF BIOTECHNOLOGY
JUNE 2007 | PAGE 8
Analysis1 was conducted on the relationship between demographic and psychographic
variables, and knowledge of technology terminology. Table 3 below summarises the subgroups
found to be significantly more likely to indicate being able to explain a technology to a friend.
In sum, those who felt comfortable with new technologies expressed greater technology
knowledge than those who did not feel comfortable, those participants who were university
educated had greater self-assessed knowledge than those who were not, and finally, males
were more likely to indicate being able to explain technologies to a friend than females.
Table 3. Predictors of knowledge of terminology
More likely to be able to explain to a friend
Item Subgroup % Total for item %
Genetic modification 44 35 Stem cell research 42 35 Gene technology 32 22
Technophiles (new technologies excite me more than they concern me) Biotechnology 28 18
Technophiles (technological change happens too fast for me to keep up with it)
Cloning 64 50
Cloning 60 50 Genetic modification 48 35 Stem cell research 45 35 Gene technology 31 22
University educated
Biotechnology 27 18
Cloning 55 50 Stem cell research 41 35 Gene technology 26 22
Males
Biotechnology 26 18
The question on terminology was asked in the same way in 2005 for three of these
technologies: cloning, stem cell research and biotechnology. Comparative results over time for
these technologies are presented in Figure 2 below. Results indicate that there have been no
significant improvements in self-assessed knowledge of these technologies over time.
1 Pearson Chi square tests were conducted to test the significance of the relationship between variables. This test compares the actual frequencies of the cross tabulation to the frequencies we would expect if there was no relationship between the variables. Those relationships that have a probability of being due to chance that are less than 5% are described as being statistically significant.

BIOTECHNOLOGY AUSTRALIA COMMUNITY PERCEPTIONS OF BIOTECHNOLOGY
JUNE 2007 | PAGE 9
Figure 2. Understanding of technology terminology - trends over time
5036
18 18
44 47
58 58
65 60
2 4 6 717 22
54
35
0
20
40
60
80
100
2005 2007 2005* 2007 2005 2007
Cloning Stem cell research Biotechnology
%
You know enough about it that you could explain it to a friend You have heard of it, but know very little or nothing aboutYou have not heard of it
Base: all CATI 2005 (n=1,068) 2007 (n=534)* 2005 Use of stem cells
Perceptions of technologies
Participants in the survey were subsequently asked whether they believed each of the same
technologies was likely to improve our way of life in the future, have no effect or make things
worse. The results are illustrated in Figure 3.

BIOTECHNOLOGY AUSTRALIA COMMUNITY PERCEPTIONS OF BIOTECHNOLOGY
JUNE 2007 | PAGE 10
Figure 3. Perceived future impact of technologies on our way of life
8773 68
45
28
2
56
9
11
5
108
2948
612
18 17 13
0
20
40
60
80
100
Stem cellresearch
Genetechnology
Biotechnology Geneticmodification
Cloning
%
Don't know
Make things worse
Have no effect
Improve our way of lifein the future
Base: all CATI (n=534)
Of all technologies, participants were most likely to predict that stem cell research would have
a positive future impact on our way of life. Indeed, almost nine in ten (87%) indicated that it
would improve our way of life, while only 5% felt that it would make things worse. Predictions
for gene technology and biotechnology were positive from the majority of participants, with
73% and 68% respectively signifying that these technologies would improve our way of life,
and only a small number (10% and 8% respectively) predicting things being made worse.
Positive future perceptions drop markedly for genetic modification (45%) and cloning (28%),
while negative future perceptions increase correspondingly (29% and 48%).
Participants were least able to respond to this question in relation to biotechnology and genetic
modification. Just under one in five (18% and 17% respectively) provided a ‘don’t know’
response.
Analysis2 was conducted on the relationship between demographic and psychographic
variables, and positive perceptions of technologies. Table 4 below summarises the subgroups
found to be significantly more likely to view technologies improving our way of life in the
future. In sum, those who feel more comfortable with new technologies had more positive
outlooks for technologies in the future than others, males had more positive perceptions of
cloning and genetic modification than females, females had more positive perceptions of IVF
2 Pearson Chi square tests were conducted using a significance criterion of p<.05

BIOTECHNOLOGY AUSTRALIA COMMUNITY PERCEPTIONS OF BIOTECHNOLOGY
JUNE 2007 | PAGE 11
than males, and lastly, those who are university educated and those aged 18-30 were more
likely than others to predict that cloning will have a positive impact on our future way of life.
Table 4. Predictors of positive perceptions of technologies
Will improve our way of life in the future
Item Subgroup % Total for item %
Biotechnology 77 68 Gene technology 82 73 Genetic modification 61 45 Cloning 34 28 Stem cell research 94 87
‘Technophiles’ (new technologies excite me more than they concern me)
IVF 88 83
Cloning 33 28 Males
Genetic modification 52 45
Females IVF 86 83 University educated Cloning 34 28 18-30 Cloning 39 28
Figure 4 below presents the results over time for the applicable items in this question.
Figure 4. Perceived future impact of technologies on our way of life – trends over time
82 87
6068
1928
22
56
11
11
75
7
8
5848
9 6
2818 13 13
0
20
40
60
80
100
2005* 2007 2005 2007 2005 2007
(n=1,000) (n=498) (n=880) (n=415) (n=1,044) n=515)
Stem cell research Biotechnology Cloning
%
Improve our way of life in the future Have no effect Make things worse Don't know
Base: those aware CATI* 2005 Use of stem cells
There were significant increases in the proportion indicating that stem cell research,
biotechnology and cloning will improve our way of life in the future. The proportion rose from

BIOTECHNOLOGY AUSTRALIA COMMUNITY PERCEPTIONS OF BIOTECHNOLOGY
JUNE 2007 | PAGE 12
82% to 87% for stem cell research, from 60% to 68% for biotechnology, and from 19% to
28% for cloning.
Support for gene technology in food and agriculture
Survey participants indicated their overall support for the use of gene technology in the area of
food and agriculture by providing a rating out of 10, where 0 indicated that they were
‘completely against it’ and 10 indicated that they were ‘fully supportive’. The frequency
distribution chart (Figure 5) below presents the results from this wave, alongside those from
Wave 4.
Figure 5. Overall support for the use of gene technology in food and agriculture applications today
11
3
6
108
23
10
12
8
3
68
4 4
6 5
22
11
14
9
3
12
0
5
10
15
20
25
30
0 1 2 3 4 5 6 7 8 9 10
%
2005 (mean=4.9) 2007 (mean =5.5)
Base: All CATI, 2005 n=1,068, 2007 n=534
As indicated in the legend of the chart, there was a significant increase since last wave in the
mean rating of support for the use of food and agriculture in its applications today. The
average rating given by participants in the current wave was 5.5 out of 10, while the average
rating given in 2005 was 4.9.
There was a notable increase in the proportion of participants rating themselves ‘fully
supportive’ of gene technology in food and agricultural applications, from 6% in 2005 to 12% in
BIOTECHNOLOGY AUSTRALIA COMMUNITY PERCEPTIONS OF BIOTECHNOLOGY
JUNE 2007 | PAGE 13
2007. There was a corresponding decline in the proportion of participants giving a support
rating of 5 or lower. Only 8% of participants noted that they were ‘completely against it’.
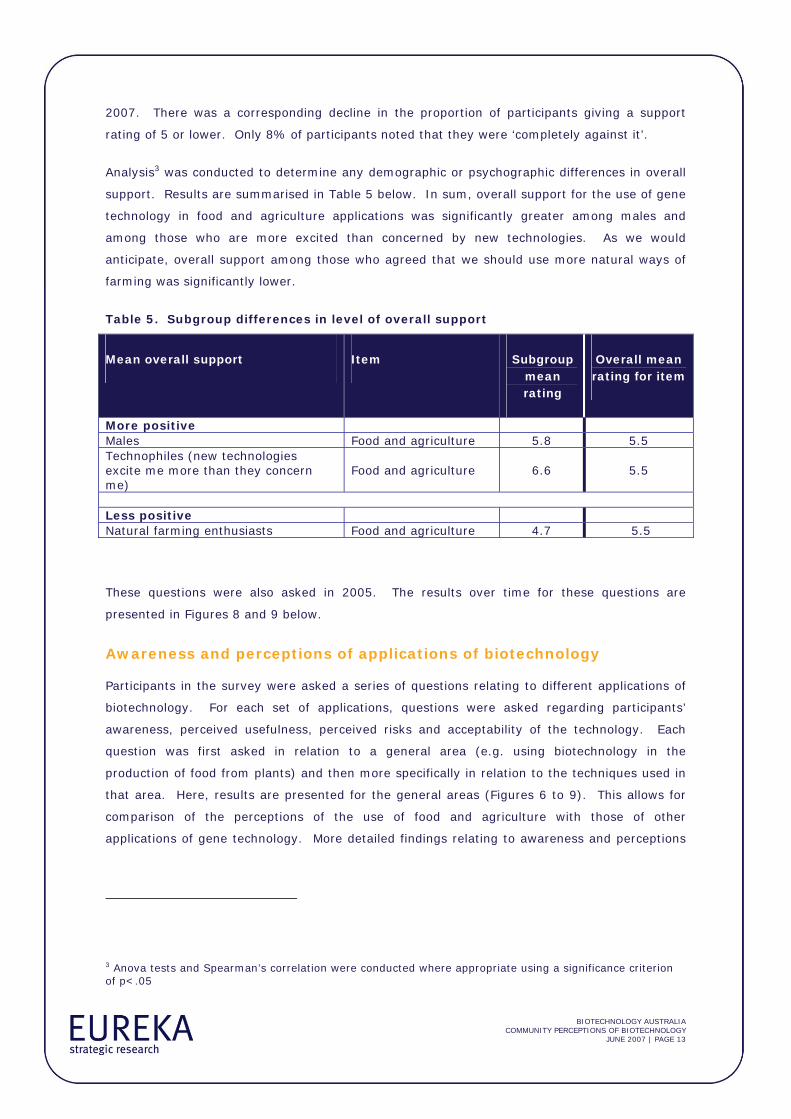
Analysis3 was conducted to determine any demographic or psychographic differences in overall
support. Results are summarised in Table 5 below. In sum, overall support for the use of gene
technology in food and agriculture applications was significantly greater among males and
among those who are more excited than concerned by new technologies. As we would
anticipate, overall support among those who agreed that we should use more natural ways of
farming was significantly lower.
Table 5. Subgroup differences in level of overall support
Mean overall support Item Subgroup mean rating
Overall mean rating for item
More positive Males Food and agriculture 5.8 5.5 Technophiles (new technologies excite me more than they concern me)
Food and agriculture 6.6 5.5
Less positive Natural farming enthusiasts Food and agriculture 4.7 5.5
These questions were also asked in 2005. The results over time for these questions are
presented in Figures 8 and 9 below.
Awareness and perceptions of applications of biotechnology
Participants in the survey were asked a series of questions relating to different applications of
biotechnology. For each set of applications, questions were asked regarding participants’
awareness, perceived usefulness, perceived risks and acceptability of the technology. Each
question was first asked in relation to a general area (e.g. using biotechnology in the
production of food from plants) and then more specifically in relation to the techniques used in
that area. Here, results are presented for the general areas (Figures 6 to 9). This allows for
comparison of the perceptions of the use of food and agriculture with those of other
applications of gene technology. More detailed findings relating to awareness and perceptions
3 Anova tests and Spearman’s correlation were conducted where appropriate using a significance criterion of p<.05

BIOTECHNOLOGY AUSTRALIA COMMUNITY PERCEPTIONS OF BIOTECHNOLOGY
JUNE 2007 | PAGE 14
of GM food crops, awareness and perceptions of biotechnology (non-GM) food crops, and
awareness and perceptions of GM non-food crops are provided in the following sections.
Figure 6. Awareness of general applications
9585
74 70 6855
515
24 30 3143
2 2 1
0
20
40
60
80
100
Using stem cellsto conduct
medicalresearch andtreat disease
(n=267)
Modifying thegenes of plantsto produce food
(n=266)
Usingbiotechnology inthe production offood from plants
(n=254)
Using genetechnology to
producemedicines(n=256)
Using genetechnology in
humantransplants
(n=285)
Modifying thegenes of plantsto produce non-
food crops(n=274)
% Don't knowNoYes
Base: rotated questions CATI
The majority of participants were aware of all applications of biotechnology. Awareness of
modifying plant genes to produce food was high, at 85%, and awareness was higher only for
stem cells (95%). Almost three out of every four participants were aware of biotechnology in
food production (74%), an awareness level just higher than the two other health and medical
applications (70% for use of gene technology in medicine production and 68% for use of gene
technology in human transplants). Awareness of modifying plant genes to produce non food
crops was somewhat lower at just over one in two (55%).
A summary of demographic and psychographic differences4 in awareness of applications is
presented in Table 6. In sum, there was significantly higher awareness of GM food crops and
GM non-food crops among males, but significantly higher awareness of use of gene technology
in human transplants among females.
4 Pearson Chi square tests were conducted using a significance criterion of p<.05

BIOTECHNOLOGY AUSTRALIA COMMUNITY PERCEPTIONS OF BIOTECHNOLOGY
JUNE 2007 | PAGE 15
Table 6. Subgroup differences in awareness of applications
Awareness Item Subgroup % Total for item %
GM food crops 91 85 Males GM non-food
crops 66 55
Females Human transplants
73 68
Figure 7. Perceived usefulness of general applications
96 96 9183 83
70
2 3 712 13
21
2 1 2 5 4 8
0
20
40
60
80
100
Using genetechnology to
producemedicines(n=256)
Using stem cellsto conduct
medicalresearch andtreat disease
(n=267)
Using genetechnology in
humantransplants
(n=285)
Usingbiotechnology inthe production offood from plants
(n=254)
Modifying thegenes of plantsto produce food
(n=266)
Modifying thegenes of plantsto produce non-
food crops(n=274)
% Don't knowNoYes
Base: rotated questions CATI
There were high levels of perceived utility for the three food and agriculture applications of
biotechnology. Just over eight in ten (83%) indicated that using biotechnology in the
production of plants from food and modifying plant genes to produce food were useful, while
slightly fewer (70%) indicated that modifying plant genes to produce non-food crops was
useful. Levels of perceived utility were lower for these applications than for each of the health
and medicine applications of biotechnology.

BIOTECHNOLOGY AUSTRALIA COMMUNITY PERCEPTIONS OF BIOTECHNOLOGY
JUNE 2007 | PAGE 16
As demonstrated in Table 7 below, an analysis5 of subgroup differences established that
‘technophiles’ (those who agree that technologies excite more than concern them) were
significantly more likely to perceive a number of applications as useful. In addition, males were
significantly more likely to see use of gene technology to produce medicines as useful.
Table 7. Subgroup differences in perceived usefulness of applications
Perceived usefulness Item Subgroup % Total for item %
GM food crops 92 83 GM non-food crops
83 70
Human transplants
99 91
Technophiles (new technologies excite me more than they concern me)
Medicines 100 96 Males Medicines 99 96
Figure 8. Perceived risk of general applications
54 48 47 44 42 37
42 46 48 50 53 59
5 6 5 6 5 4
0
20
40
60
80
100
Modifying thegenes ofplants to
produce food(n=266)
Usingbiotechnology
in theproduction of
food fromplants (n=254)
Using genetechnology in
humantransplants
(n=285)
Using genetechnology to
producemedicines(n=256)
Modifying thegenes ofplants to
produce non-food crops
(n=274)
Using stemcells toconductmedical
research andtreat disease
(n=267)
% Don't knowNoYes
Base: rotated questions CATI
There were fairly high levels of perceived risk for all applications of biotechnology, together
with high levels of perceived utility. The proportion of participants rating applications as ‘risky’
5 Pearson Chi square tests were conducted using a significance criterion of p<.05
BIOTECHNOLOGY AUSTRALIA COMMUNITY PERCEPTIONS OF BIOTECHNOLOGY
JUNE 2007 | PAGE 17
ranged from 37%, for the use of stem cells to conduct medical research and treat disease, to
54%, for modifying the genes of plants to produce food. Among food and agriculture
applications, GM non-food crops were perceived to be least risky, at 42%.
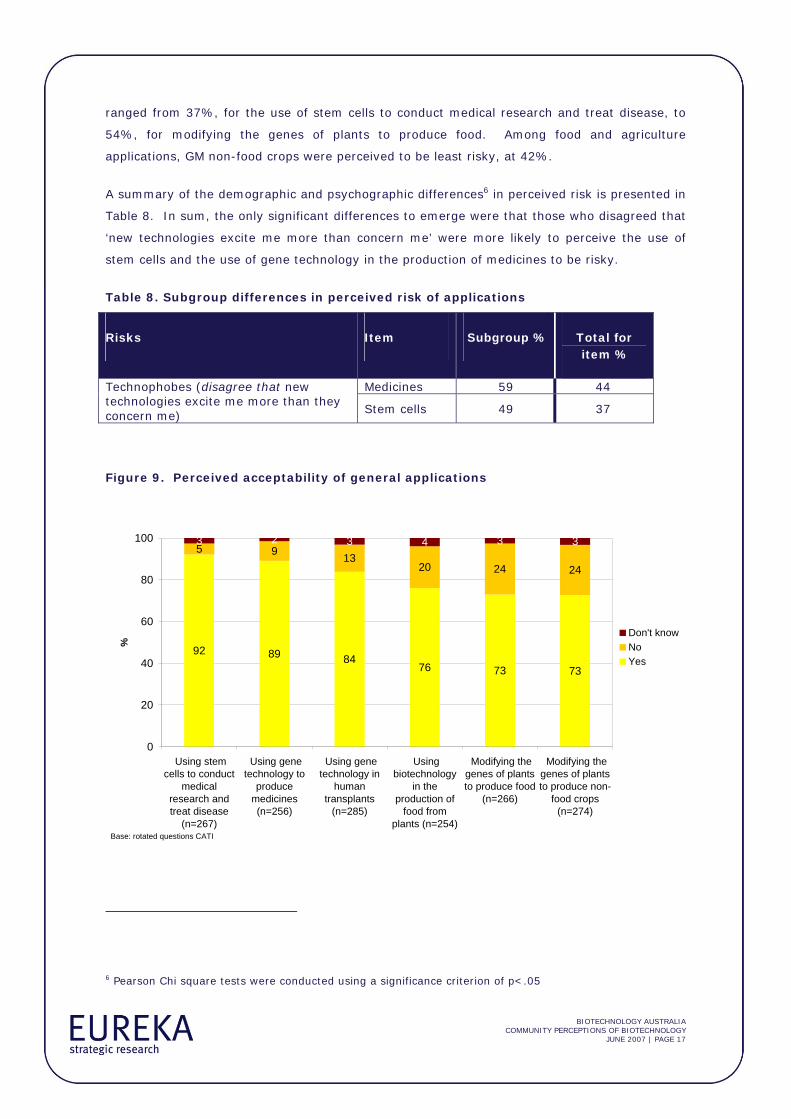
A summary of the demographic and psychographic differences6 in perceived risk is presented in
Table 8. In sum, the only significant differences to emerge were that those who disagreed that
‘new technologies excite me more than concern me’ were more likely to perceive the use of
stem cells and the use of gene technology in the production of medicines to be risky.
Table 8. Subgroup differences in perceived risk of applications
Risks Item Subgroup % Total for item %
Medicines 59 44 Technophobes (disagree that new technologies excite me more than they concern me) Stem cells 49 37
Figure 9. Perceived acceptability of general applications
92 89 8476 73 73
5 9 1320 24 24
3 2 3 4 3 3
0
20
40
60
80
100
Using stemcells to conduct
medicalresearch andtreat disease
(n=267)
Using genetechnology to
producemedicines(n=256)
Using genetechnology in
humantransplants
(n=285)
Usingbiotechnology
in theproduction of
food fromplants (n=254)
Modifying thegenes of plantsto produce food
(n=266)
Modifying thegenes of plantsto produce non-
food crops(n=274)
%
Don't knowNoYes
Base: rotated questions CATI
6 Pearson Chi square tests were conducted using a significance criterion of p<.05

BIOTECHNOLOGY AUSTRALIA COMMUNITY PERCEPTIONS OF BIOTECHNOLOGY
JUNE 2007 | PAGE 18
Results for perceived acceptability of applications follow a similar pattern to those for perceived
utility, with food and agricultural applications receiving fewer ‘acceptable’ ratings than health
and medical applications. Perceived acceptability was fairly high across all applications.
As indicated in Table 9 below, the only significant predictor7 of perceived acceptance of
technologies was attitude towards new technologies. ‘Technophiles’ were significantly more
accepting of all applications.
Table 9. Subgroup differences in perceived acceptability of applications
Acceptance Item Subgroup % Total for item %
GM food crops 84 73 GM non-food crops 91 73 Biotechnology in the production of food from plants
89 76
Medicines 94 89 Stem cells 98 92
Technophiles (new technologies excite me more than they concern me)
Human transplants 93 84
Qualitative findings
Group discussions shed some light on why, in general, agricultural applications of biotechnology
received less support than medical applications..
The purpose of biotechnology in agriculture – and of GM crops in particular – was perceived
by many to be commercial, and as bringing benefit to large producers and big businesses
rather than to consumers, farmers or society generally. By contrast, the purpose of
biotechnology in the medical realm was perceived to be altruistic and humanitarian, and as
benefiting society as a whole.
The changes that are made to plant characteristics through genetic modification were
commonly said to be cosmetic – in other words, changing the outward appearance of the
product for the purpose of increasing sales, with little benefit for consumers or farmers.
Many people expressed concern about the level of control that can be exercised over GM
crops, particularly once they are released from the laboratory into the environment. The
risks of widespread planting of GM crops were thought by some to be high, potentially
7 Pearson Chi square tests were conducted using a significance criterion of p<.05

BIOTECHNOLOGY AUSTRALIA COMMUNITY PERCEPTIONS OF BIOTECHNOLOGY
JUNE 2007 | PAGE 19
affecting all members of society through “contamination of the food chain.” In addition, the
process of introducing GM crops was believed to be irreversible. Some commented that GM
plant strains were more virulent than, and therefore likely to take over, natural varieties.
Some participants described feeling powerless to influence how biotechnology is used in
agriculture, with many believing that the information they receive about food-production
processes is insufficient and that food labelling requirements are inadequate. This is linked
to the misconception that GM products are widely available on supermarket shelves. As a
result, these participants believed they were unable to exercise choice as consumers.
Of the three areas of application with an agricultural focus, the use of biotechnology in the
production of food from plants was regarded as the most acceptable – largely because it was
believed to include comparatively ‘natural’ methods like selective breeding. However,
participants generally had very limited understanding of what ‘biotechnology’ might mean in
this context, beyond a general notion of the ‘natural’ (i.e. selective breeding) and the
‘unnatural’ (i.e. genetic modification).
While survey results indicated very similar levels of acceptability in relation to GM food and
non-food crops, it was clear from the group discussions that many were uncertain about what
types of non-food crops might be grown, and did not automatically associate these with (for
example) textiles, fuels or plastics. As a result of this uncertainty, participants initially
regarded GM food crops (with which people are more familiar) as more acceptable than non-
food crops. However, after being told of the possible uses for GM non-food crops – particularly
those with an environmental benefit – there was much greater support for their use.
The following quotes are typical of group discussion feedback on biotechnology in food and
agriculture:
I think if there’s a benefit, like if it’s going to feed the third world or make wheat that grows in the desert, then that’s acceptable. If it’s because you want to copyright your genes and only have certain growers paying you money to get the seed, if it’s about money, then it’s not acceptable to me.
I’m happy if it’s to help out with global warming or something like that, or with medicine, or research to make food more drought resistant or store resistant or bug-resistant if there’s some particular species of frog that’s eating crops … because I don’t want it to be used for cosmetic use – to make things look better, but not any real benefit.
I think the one that people are most scared of is the food thing, because it reaches the greatest number of people, and we don’t know what effects it’s going to have. It might cause cancer…we don’t want to [get in the situation where] we can’t change it. Once the damage is done, the damage is done.

BIOTECHNOLOGY AUSTRALIA COMMUNITY PERCEPTIONS OF BIOTECHNOLOGY
JUNE 2007 | PAGE 20
General attitudes towards the use of gene technology in food and agriculture
Participants in the survey were asked to indicate their level of agreement to several statements
concerning the use of gene technology in food and agriculture. Participants stated if they
agreed or disagreed with a particular statement, and whether it was at a strong or mild level.
Participants could also indicate neutrality. The results are shown in Figure 10 below.
Figure 10. Attitudes towards gene technology in food and agriculture
1945 6 10 19% 0%
2028 9 15 27% 1%
1822 13 13 30% 4%
1422 17 12 33% 2%
1916 16 28 21% 0%
1310 18 37 21% 0%
100 80 60 40 20 0 20 40 60 80 100
Genetic modification in agriculture is mostly for the benefitof commercial companies
Plant, animal characteristics should only be changedthrough traditional breeding methods
Australian farms need GM organisms to stay financiallyviable
Australian farms need to be free of GM organisms to stayfinancially viable
Commercial use of genetic modification and its productsshould be stopped
R&D into genetic modification should be stopped
Disagreement strong mild
Agreementmild strong Neutral
Don't know
The majority of participants (55%) expressed agreement that genetic modification in
agriculture was mostly for the benefit of commercial companies, with more than a third (37%)
agreeing strongly.
There was a nett positive response to the view that plant and animal characteristics should only
be changed through traditional breeding methods, with 44% agreeing and 35% disagreeing.
There were no clear views regarding the economic impact of gene technology on farms. Just
under three in ten (29%) agreed that Australian farms need GM organisms to stay financially
viable, but an almost equal number (26%) agreed that Australian farms need to be free of GM
organisms to stay financially viable. There were also similar levels of disagreement to both
these statements (36% and 40% respectively).
There were few who argued against the commercial use of genetic modification and its
products, and research into genetic modification. Twenty-four percent and 16% agreed with
these statements respectively

BIOTECHNOLOGY AUSTRALIA COMMUNITY PERCEPTIONS OF BIOTECHNOLOGY
JUNE 2007 | PAGE 21
Awareness and perceptions of GM food crops
This section presents the detailed findings for perceptions of the use of genetic modification in
food crops. Participants were asked their opinions on the general application, as well as
specific examples of modification of genes, such as by introducing the genes of; a plant of the
same species, a plant of a different species, a bacterium, and an animal. Figures 11 to 14
show the results over time for awareness, perceived usefulness, perceived risk and perceived
acceptability of these forms of genetic modification. This is followed by a discussion of the
qualitative feedback regarding the genetic modification of plants to produce food.
Awareness
Figure 11. Awareness of GM food crops
85
66 65
4126
15
33 33
5673
1 2 3 1
0
20
40
60
80
100
Modifying thegenes of plantsto produce food
... by introducingthe genes of a
plant of the samespecies
... by introducingthe genes of a
plant of adifferent species
... by introducingthe genes of a
bacterium
... by introducingthe genes of an
animal
%
Don't knowNoYes
Base: rotated question CATI (n=266)
Awareness of the general application was high, at close to nine in ten (85%). This reduced,
however, once participants were provided with details about the technique. Awareness of
modification via introduction of genes of a plant of the same species and via introduction of
genes of a different plant species was similar, at 66% and 65% respectively. There was
another marked decline in awareness for the application involving introduction of the genes of a
bacterium. Awareness was notably lower again for the application involving the introduction of
animal genes, at just over one in four (26%).

BIOTECHNOLOGY AUSTRALIA COMMUNITY PERCEPTIONS OF BIOTECHNOLOGY
JUNE 2007 | PAGE 22
Perceived usefulness
Figure 12. Perceived usefulness of GM food crops
83 8573
53
29
13 920
36
57
4 5 8 11 14
0
20
40
60
80
100
Modifying thegenes of plantsto produce food
... by introducingthe genes of a
plant of the samespecies
... by introducingthe genes of a
plant of adifferent species
... by introducingthe genes of a
bacterium
... by introducingthe genes of an
animal
%
Don't knowNoYes
Base: rotated question CATI (n=266)
Perceived usefulness of the general application and of the application involving introduction of
same plant species genes was high, at over eight in ten (83% and 85% respectively). Positive
perceptions declined steadily, however, as the relationship between the plant and the
secondary organism weakened. Thus, perceived utility for the introduction of different plant
species genes was 73%, and this dropped again for the introduction of bacterium genes (53%)
and finally to the introduction of animal genes (29%).

BIOTECHNOLOGY AUSTRALIA COMMUNITY PERCEPTIONS OF BIOTECHNOLOGY
JUNE 2007 | PAGE 23
Perceived risk
Figure 13. Perceived risk of the use of GM crops
54
73 70
52
29
42
21 24
43
66
5 6 5 5 5
0
20
40
60
80
100
Modifying thegenes of plants to
produce food
... by introducingthe genes of an
animal
... by introducingthe genes of a
bacterium
... by introducingthe genes of a
plant of a differentspecies
... by introducingthe genes of a
plant of the samespecies
%
Don't knowNoYes
Base: rotated question CATI (n=266)
There were fairly high levels of perceived risk across all applications. Just over one in two
(54%) felt that the general application was risky. This rose to almost three in four (73%) for
the application involving the introduction of genes of an animal, and was similar for the
application involving introduction of bacterium genes. There was substantially lower perceived
risk, however, for applications involving close species or same species modification (52% and
29% respectively).
Indeed, perceptions of the risks posed by GM food crops were the focus of much group
discussion. As noted earlier, there were some with strong concerns that GM crops could ‘take
over’ the environment, crowding out natural plant varieties and making (more expensive)
organic or non-GM foods hard to find. With many people wishing to buy (or at least wishing to
have the option to buy) organic/non-GM where possible, it was feared that this scenario would
stifle consumer choice. Additionally, the introduction of GM crops was said to be irreversible, a
notion that was of concern for many people.
The difference is once you’ve got the GM crops in place, they can naturally be cross-pollinated with non-GM crops, and you get GM crops spreading because they’re stronger and natural selection takes their own course.
It’s getting to the point where we don’t get a choice, with breads and chips; everything’s got chemicals and preservatives. It’s affecting our children. We

BIOTECHNOLOGY AUSTRALIA COMMUNITY PERCEPTIONS OF BIOTECHNOLOGY
JUNE 2007 | PAGE 24
don’t have a choice, we make our food from fresh produce, which will be impossible to get if they do that.
Once these changes are made, there’s no going back. You can’t change your mind.
Health risks were also raised by many participants as a reason for exercising caution in allowing
GM crops to be grown. These people argued that there is not enough evidence to show that
GM crops are completely safe in all circumstances, and that research would need to be carried
out over many years. With potentially all members of the population ingesting GM foods, it
was regarded as very important that the safety of GM foods is unequivocally established.
With modification of genes in plants and things, you could be bringing in all sorts of diseases that we don’t know about, and things that we haven’t really trialled for a number of years. It might take generations before something happens.
Only time and research can dispel any concerns.
Perceived acceptability
Figure 14. Perceived acceptability of the use of GM crops
7384
65
3927
2412
33
5568
3 3 2 7 5
0
20
40
60
80
100
Modifying thegenes of plantsto produce food
... by introducingthe genes of a
plant of the samespecies
... by introducingthe genes of a
plant of adifferent species
... by introducingthe genes of a
bacterium
... by introducingthe genes of an
animal
%
Don't knowNoYes
Base: rotated question CATI (n=266)
Perceived acceptability followed a similar trend to perceived usefulness, with positive
perceptions increasing as the relationship between the plant and the secondary organism
strengthened. Perceived acceptability was at its highest for the application involving the

BIOTECHNOLOGY AUSTRALIA COMMUNITY PERCEPTIONS OF BIOTECHNOLOGY
JUNE 2007 | PAGE 25
introduction of the genes of a plant of the same species, at more than eight in ten (84%). This
declined steadily until its lowest point of 27% for the application involving the introduction of
animal genes.
Group discussion participants were asked for their views on the difference between internal,
close-family and inter-species genetic modification (analogous to the survey question reported
above). Generally speaking, inter-species genetic modification was regarded as much more
‘unnatural’ – and therefore to be done cautiously or not at all - than internal and close-family
GM. This appeared to be the case even for those people who were otherwise strongly
supportive of gene technology and its application in agriculture.
Figure 15 below presents the results over time for the four key questions on awareness,
perceived usefulness, perceived risk and perceived acceptability.
Figure 15. GM food crops: trends over time
7685
64
8371
5448
73
2315
30
1323
4247
24
16 4 6 5 5 3
0
20
40
60
80
100
2005 2007 2005 2007 2005 2007 2005 2007
Awareness Useful Risky Acceptable
% Don't know
No
Yes
Base: rotated questions CATI 2005 (n=537) 2007 (n=266)
7685
64
8371
5448
73
2315
30
1323
4247
24
16 4 6 5 5 3
0
20
40
60
80
100
2005 2007 2005 2007 2005 2007 2005 2007
Awareness Useful Risky Acceptable
% Don't know
No
Yes
Base: rotated questions CATI 2005 (n=537) 2007 (n=266)
There have been substantial significant increases in awareness and positive perceptions of GM
food crops since 2005. Awareness rose from 76% in 2005 to 85% in 2007, perceived utility
rose from 64% to 83%, perceived risk dropped from 71% to 54% and perceived acceptability
rose from 48% to 73%. These results are noteworthy for the size of the movements.
Group discussion results indicate that much of the increase in the acceptability of GM food
crops over time is explained by greater familiarity with the notion of GM plants. In fact, some
people regard the widespread use of GM crops as a fait accompli, and therefore no longer worth
objecting to. As well, the lack of negative publicity relating to GM crops has led to a relaxation

BIOTECHNOLOGY AUSTRALIA COMMUNITY PERCEPTIONS OF BIOTECHNOLOGY
JUNE 2007 | PAGE 26
of anxiety about the risks that they pose. In other words, since there appear to have been
little or no negative consequences of planting and eating GM food crops, there is less concern
about the risks that they pose for the future.
Perceived acceptability of GM food crops under certain conditions
Those survey participants who indicated that GM food crops were ‘unacceptable’ were asked
whether or not they would find GM food crops acceptable under certain conditions. Responses
to this question are presented in Figure 16 below.
Figure 16. Acceptability of GM food crops if…
38 32 32 31
8
60 66 62 65
89
2 2 6 5 3
0
20
40
60
80
100
If the food waslabelled asgeneticallymodified, in
accordance withfood regulations
If the food wascertified as safeby a government
regulator
If it wasdeveloped by a
governmentfunded research
body
If it wasdeveloped by an
Australiancompany
If it wasdeveloped by acompany based
overseas
% Don't knowNoYes
Base: those who said GM food crops unacceptable, CATI (n=65)
The majority of participants who indicated that GM food crops were ‘unacceptable’ were not
swayed by further information regarding labelling, certification, or the source of the food. The
most positive impact on perceptions was found when participants were informed that the food
would be labelled as genetically modified, in accordance with food regulations. In this instance,
just under two in five (38%) stated that GM food crops would be acceptable under this
condition. Just over three in ten participants were positively influenced by information on
certification by a government regulator (32%), by information on development by a
government research body (32%) and by information on development by an Australian
company. Of these participants, development by an overseas company had the least positive
impact on perceptions (8%).
Labelling of food containing GM content was an important issue for group discussion
participants. As reported earlier, there is a widespread belief that Australians are currently

BIOTECHNOLOGY AUSTRALIA COMMUNITY PERCEPTIONS OF BIOTECHNOLOGY
JUNE 2007 | PAGE 27
unknowingly eating GM foods, because such foods are not labelled properly. As a result, some
people felt they were being misled into eating GM foods that they didn’t want to. For many,
however, it was the in principle desire for consumer choice that was important, rather than the
desire to actively avoid GM products.
It’s the only voice that consumers have really. It’s what you buy.
There was talk about labelling the fruit and vegetables and I was waiting for it. It never happened.
I think that if they weren’t labelling it people would be a lot more sceptical about it. I think if information is out there in the open then people who are more sceptical about it can make their own informed decision. But for those who don’t really mind, [label it] so that they don’t have this really negative connotation about it to begin with.
Group discussion participants were not necessarily convinced that government certification of a
GM crop or food would guarantee its safety or benefit. Instead, a number of people suggested
that more faith might be placed in the CSIRO’s assessment.
Participants were also asked whether the country where GM crops are developed is an
important consideration. While most people favoured supporting Australian companies in
principle, the country of origin was not deemed to be a significant factor in assessing whether a
crop was acceptable. However, they were more sceptical about GM crops developed in a
country where regulatory systems were perceived to be more lax, for fear that the crop might
be unsafe.

BIOTECHNOLOGY AUSTRALIA COMMUNITY PERCEPTIONS OF BIOTECHNOLOGY
JUNE 2007 | PAGE 28
Attitudes towards objectives of GM food crops
Survey participants were presented with a series of objectives of GM food crops and were asked
their views on their perceived value. Results are presented in Figure 17 below.
Figure 17. Perceived value of objectives of GM food crops
6958 52
45 4434 29 25
1825
2734
2832
31 33
5 5 8 1013
1719 19
8 11 11 11 14 17 17 21
1 1 1 1 1 1 3 2
0
20
40
60
80
100
..to makeplants
droughtresistant
..to makethe foodhealthier
..to makethe plants
pestresistant
..to makethe plants
frostresistant
..to makethe foodcheaper
..to makethe food
lastlonger
..to makethe plantsherbicidetolerant
..to makethe plants
maturemore
quickly
%
Dont knowNot at all valuableNot very valuableSomewhat valuableVery valuable
Base: those who said GM food crops unacceptable, CATI (n=65)
The majority of participants indicated they perceived some value in all objectives. The
objective perceived to be most valuable was drought resistance, with just over two-thirds
(69%) rating this objective as very valuable. This was followed by making the food healthier
(58% very valuable) and making the plants pest resistant (52% very valuable).
At the other end of the scale, the objective perceived to be least valuable was the accelerated
maturation of plants, with one in four (25%) viewing this as very valuable and just over one in
five (21%) rating it as not at all valuable. Herbicide tolerance and making the food last longer
were seen to be the next least valuable objectives. These objectives were rated as very
valuable by 29% and 34% respectively, and as not at all valuable by 17% of participants.
Drought resistance was regarded as the most important objective of those put to the group
discussions, with pest resistance also regarded as very valuable. There was widespread
agreement that any solutions to environmental problems that biotechnology can provide are
worthwhile. Many of these objectives were characterised as man-made solutions to man-made
problems. In addition, drought resistance, pest resistance and frost resistance were all seen as
minimising the risk of adverse events, with farmers and consumers the likely beneficiaries.

BIOTECHNOLOGY AUSTRALIA COMMUNITY PERCEPTIONS OF BIOTECHNOLOGY
JUNE 2007 | PAGE 29
We live in an environment that’s changing, and perhaps we have to look at modifying crops for them to still be produced. Because our environment’s changing. Things need to be made more drought resistant. We have to be open to these genetically modified things.
I don’t want my food modified for any of those reasons. Nature’s taken care of things in the past. The only thing maybe is drought resistance because of climate change and lack of water.
If the pests are going to affect the crops and everything, if it is affected by the pests it mightn’t be as healthy. Then maybe being pest resistant is important for having a healthy plant.
Meanwhile, some other objectives were regarded as generating commercial advantage for big
business, but being of less apparent benefit for farmers, consumers and society. For instance,
making food last longer and making plants mature more quickly were interpreted by many as
being ultimately for the benefit of corporations (i.e. supermarket chains and agricultural
companies) rather than producers and consumers, who would benefit marginally if at all.
However, rural groups appeared to understand better the benefits of growing crops that mature
more quickly.
You'd hope that there'd be other benefits that people would be inventing or producing GM that'd go to the general public, for example more food for costs, but large companies don't invest for decades of confidential research and pay farmers large amounts of money to run tests without expecting a return.
Group discussion participants were supportive of making food healthier in principle, but did not
readily appreciate what health benefits might accrue from eating GM crops. Some people
construed herbicide tolerance as meaning that more chemicals would be used on these plants,
and expressed unease about this objective (this reflects wider disapproval of the use of
chemicals in agriculture, particularly among people in metropolitan areas). Others did not
appear to understand what this ‘herbicide tolerance’ meant or implied.
One perceived objective of GM food crops that was raised many group discussion participants
was to improve the look and feel of fruit and vegetables, rather than to impart plants with more
important characteristics. This view was linked to the common perception that GM foods are
widely prevalent, and that fresh food looks ‘unnaturally’ attractive compared with the past. The
following comments were typical:
I remember as a kid you used to get a pear and it tasted like a pear. Now it tastes like chalk.

BIOTECHNOLOGY AUSTRALIA COMMUNITY PERCEPTIONS OF BIOTECHNOLOGY
JUNE 2007 | PAGE 30
Tomatoes I know have definitely been genetically modified. Now they look beautiful, but there’s no flavour.
Some participants also raised the notion of genetically modifying crops so that they don’t bear
seeds – so that farmers need to continue purchasing seed from patent-holders.
Group discussions held in rural locations tended to understand the potential benefits of GM
crops for farmers and rural communities more readily than their metropolitan counterparts.
Nevertheless, these groups also emphasised the need to encourage healthy markets so that
farmers were given a fair deal.
Knowledge of GM crops and foods
Participants’ general knowledge of GM crops and foods was examined by a series of ‘true or
false’ questions. Four statements regarding the prevalence of GM foods and crops were
presented to participants, who were required to indicate whether or not each statement was
true. The same four statements were presented to participants in the 2005 wave of research.
Results for both waves are presented in Figure 18 below. The correct response to each of
these statements is displayed in red at the foot of the item.
Figure 18. Knowledge of GM crops and foods
46 46
26 2542 49
34 41
42 48
65 71 3333
4748
12 7 9 4
25 18 1911
0
20
40
60
80
100
2005 2007 2005 2007 2005 2007 2005 2007
Most of the processedfoods in Australian
supermarkets contain GMingredients
Most of the fresh fruit andvegetables grown in
Australia are GM
Most of the cotton grown inAustralia is GM
Most of the vegetable oilsproduced in Australia are
made from GM crops
%
True False Don't know
Base: 2005 all (n=1118), 2007 all CATI (n=534)
FALSE FALSE TRUE FALSE
There have been significant improvements in knowledge since last wave for three of the four
statements: the proportion of participants who correctly indicated that most of the processed
foods in Australian supermarkets contain GM ingredients is ‘false’ rose from 42% to 48%; the

BIOTECHNOLOGY AUSTRALIA COMMUNITY PERCEPTIONS OF BIOTECHNOLOGY
JUNE 2007 | PAGE 31
proportion of participants who correctly indicated that most of the fresh fruit and vegetables
grown in Australia is ‘false’ rose from 65% to 71%, and the proportion of participants who
correctly indicated that most of the cotton grown in Australia is GM is ‘true’ rose from 42% to
49%.
Knowledge declined this wave, however, for the final statement regarding the GM status of
vegetable oils. A higher proportion of participants incorrectly indicated that this statement was
‘true’ (up from 34% to 41%).
Improvements in knowledge aside, there remain widespread misconceptions regarding
genetically modified crops and foods.
Results from group discussions indicate that, as in the 2005 wave of this research, there is a
widespread perception that GM foods, in particular GM fruit and vegetables, are prevalent
(although not necessarily dominant – as asked in the quantitative survey) in Australia’s food
supply.
Survey participants were asked whether or not they thought that commercial GM crops were
allowed to be grown in their state of residence. Those who indicated affirmatively were then
asked to state what type of crops they thought these were. This question was asked as an
unprompted question. Results for these questions are presented in Figures 19 to 20 below.
Please note that the sample sizes for Tasmania and Northern Territory are very low and should
therefore be interpreted with caution.

BIOTECHNOLOGY AUSTRALIA COMMUNITY PERCEPTIONS OF BIOTECHNOLOGY
JUNE 2007 | PAGE 32
Figure 19. Awareness of GM crop growth in Australia
Are GM crops grown commercially in your state?
40 45 44 40 39 3829 28
1715 20
1631
1324 29
43 40 3643
31
49 47 44
0
20
40
60
80
100
Total(n=1118)
NSW(n=376)
SA(n=90)
VIC(n=269)
TAS*(n=36)
QLD(n=218)
NT*(n=17)
WA(n=112)
State of residence
%
Dont know
No
Yes
Base: All COMBINED, n=1118
More than four in ten (43%) participants were unable to answer this question, an indication of
the low levels of awareness. The ‘don’t know’ responses reached a high of 49% in Queensland.
Among those who did respond to this question, participants were more likely to believe that GM
crops were grown in their own state than not (40% indicated yes and 17% indicated no). The
proportion of ‘yes’ responses were fairly similar across states, including in NSW and QLD, where
GM cotton is grown commercially.

BIOTECHNOLOGY AUSTRALIA COMMUNITY PERCEPTIONS OF BIOTECHNOLOGY
JUNE 2007 | PAGE 33
Figure 20. Perceived GM crops grown commercially in own state
28 29
36
9
44
1821
1713
18
24
2
29
2
13
58
5 4 45 5 47
24
73 3 43 2
11
3 2 31
45 4 3
12
4 3 36
2
30
25
16
335
3
0
20
40
60
Total (n=505) NSW (n=180) VIC (n=121) QLD (n=98) SA* (n=45) WA* (n=40)
%
Canola Wheat Cotton Corn Tomatoes Soya Sugar/Sugarcane Grapes Other fruit Other veg
B All COMBINED
Across most states, GM canola was the most commonly cited crop. The exception was in
Queensland, where instead, GM cotton was the most commonly cited crop. Three of these
states coincided with those in which GM canola trials are taking place: NSW, Victoria and South
Australia.
GM wheat was the next most commonly cited crop, followed by GM cotton. The highest
proportion of mentions came from NSW (24%) and Queensland (29%), the states in which it is
grown. However, it should be noted that participants were somewhat ‘primed’ about GM
cotton, having previously answered the ‘true/false’ question on GM cotton growth in Australia.
The suggestions of corn, tomatoes, grapes, other fruit and other vegetables are indicative of
the misconceptions regarding genetic modification of fruit and vegetables. Group discussion
participants were equally mistaken, with people in rural areas mentioning a large number of
crops they believed are grown in NSW (watermelon, corn, cotton, silver beet, wheat, and rice).
Rural and metropolitan groups alike had very limited knowledge of the moratoria in place, with
agricultural workers and people living outside regional centres the exception. No participants
could recall any media coverage of the moratoria or related issues.
There was a general agreement in most groups that farmers should be consulted and have a
major role in decisions on which GM crops are allowed under what conditions.
All survey participants were asked whether or not they would support the commercial growth of
GM crops in their own state. Those who responded negatively (or were unsure) were asked if
they would support the growth of GM crops under certain positive conditions, while those who

BIOTECHNOLOGY AUSTRALIA COMMUNITY PERCEPTIONS OF BIOTECHNOLOGY
JUNE 2007 | PAGE 34
responded affirmatively (or were unsure) were asked if they would still support the growth of
GM crops under certain negative conditions. Figures 21 to 24 present these results.
Figure 21. Support for growing GM crops in own state
50
31
18
0
20
40
60
80
100
Valid Percent
Total (n=1118)
%Yes No Don't know
Base: All COMBINED
One in two participants (50%) indicated that they would be in favour of growing GM crops in
their own state. Just over three in ten (31%) indicated that they would not be in favour of
growing GM crops, while the remainder (18%) said that they were unsure.
Figure 22. Support for growing GM crops under positive conditions
30
34
59
0 20 40 60 80
There was evidence that manyfarmers wanted to plant Genetically
Modified crops
There was evidence that it wouldenhance Australias economic
competitiveness
The crops passed stringentregulations pertaining to health and
the environment
% In favour if...Base: Not in favour or dk (n=555)COMBINED data

BIOTECHNOLOGY AUSTRALIA COMMUNITY PERCEPTIONS OF BIOTECHNOLOGY
JUNE 2007 | PAGE 35
The majority (59%) of those who did not respond positively to the growth of GM crops in their
own state would sway their opinion if the crops passed stringent regulations pertaining to
health and the environment. Combining the results from this question and the previous
question, 80% of participants would be in favour of growing GM crops in their own state if the
crops passed stringent regulations pertaining to health and the environment.
Just over one third (34%) of participants would change their opinion if growing GM crops
enhanced Australia’s economic competitiveness, while three in ten (30%) would do so if there
was evidence that many farmers wanted to plant GM crops.
Figure 23. Support for growing GM crops under negative conditions
12
16
33
0 20 40 60 80
The health and the environmentalimpacts of the crops could not be
established
There was evidence that it woulddiminish Australias economic
competitiveness
There was evidence that very fewfarmers wanted to plant Genetically
Modified crops
% In favour if...Base: In favour or dk (n=767)COMBINED data
These conditions were presented to participants who responded affirmatively to the growth of
GM crops in their own state, or who were unsure. Only a minority of participants would remain
in favour of growing GM crops if the health and environmental impacts of the crops could not
be established (12% remain in favour), or if there was evidence that it would diminish
Australia’s economic competitiveness (16%) or if there was evidence that few farmers wanted
to plant genetically modified crops (33%). These figures translate to 8%, 11% and 22% of the
total sample.

BIOTECHNOLOGY AUSTRALIA COMMUNITY PERCEPTIONS OF BIOTECHNOLOGY
JUNE 2007 | PAGE 36
Figure 24. Support for GM crop growth in own state: by state of residence
50 55 53 50 50 50 47 44
31 2724 33 34 39 41
36
18 18 2317 16 11 12
20
0
20
40
60
80
100
Total(n=1118)
NSW(n=376)
WA(n=112)
QLD(n=218)
SA (n=90)
TAS*(n=36)
NT*(n=17)
VIC(n=269)
State of residence
%
Dont know
No
Yes
Base: All COMBINED* Caution, low base
Support for the growth of GM crops was fairly similar across states, ranging from 55% in NSW
to 44% in Victoria.
GM food products
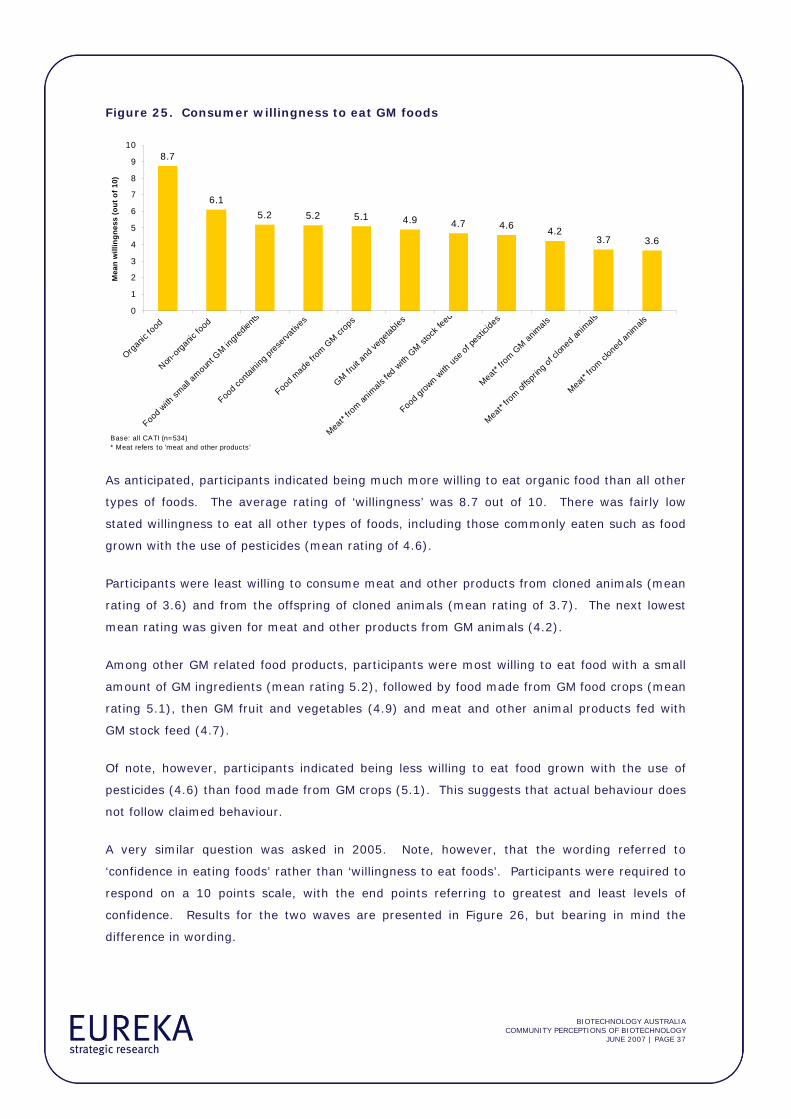
Survey participants were asked to state their willingness to eat a range of different types of
food, including food products derived from cloned animals, GM food products, as well as foods
currently commonly eaten. They rated their willingness on a scale from 0 to 10, where 10
indicated the greatest level of willingness and 0 indicated the greatest level of hesitation. The
results are displayed in Figure 25.
BIOTECHNOLOGY AUSTRALIA COMMUNITY PERCEPTIONS OF BIOTECHNOLOGY
JUNE 2007 | PAGE 37
Figure 25. Consumer willingness to eat GM foods
8.7
6.15.2 5.2 5.1 4.9 4.7 4.6 4.2
3.7 3.6
0
1
2
3
4
5
6
7
8
9
10
Organic
food
Non-o
rganic
food
Food w
ith sm
all amoun
t GM in
gredients
Food c
ontaining prese
rvativ
es
Food m
ade from G
M crops
GM fruit a
nd ve
getables
Meat*
from an
imals
fed w
ith G
M stoc
k feed
Food grow
n with
use o
f pes
ticides
Meat* fro
m GM an
imals
Meat*
from of
fsprin
g of c
loned a
nimals
Meat*
from cl
oned anim
als
Mea
n w
illin
gnes
s (o
ut o
f 10)
Base: all CATI (n=534)* Meat refers to 'meat and other products'
As anticipated, participants indicated being much more willing to eat organic food than all other
types of foods. The average rating of ‘willingness’ was 8.7 out of 10. There was fairly low
stated willingness to eat all other types of foods, including those commonly eaten such as food
grown with the use of pesticides (mean rating of 4.6).
Participants were least willing to consume meat and other products from cloned animals (mean
rating of 3.6) and from the offspring of cloned animals (mean rating of 3.7). The next lowest
mean rating was given for meat and other products from GM animals (4.2).
Among other GM related food products, participants were most willing to eat food with a small
amount of GM ingredients (mean rating 5.2), followed by food made from GM food crops (mean
rating 5.1), then GM fruit and vegetables (4.9) and meat and other animal products fed with
GM stock feed (4.7).
Of note, however, participants indicated being less willing to eat food grown with the use of
pesticides (4.6) than food made from GM crops (5.1). This suggests that actual behaviour does
not follow claimed behaviour.
A very similar question was asked in 2005. Note, however, that the wording referred to
‘confidence in eating foods’ rather than ‘willingness to eat foods’. Participants were required to
respond on a 10 points scale, with the end points referring to greatest and least levels of
confidence. Results for the two waves are presented in Figure 26, but bearing in mind the
difference in wording.

BIOTECHNOLOGY AUSTRALIA COMMUNITY PERCEPTIONS OF BIOTECHNOLOGY
JUNE 2007 | PAGE 38
Figure 26. Consumer willingness to consume foods: trends over time
8.3
5.7
3.9
5.1
4.0 3.84.2
3.3
8.7
6.1
5.2 5.2 4.9 4.7 4.6 4.2
0
1
2
3
4
5
6
7
8
9
10
Organic food Non organicfood
Food thatcontains a
small amountof GM
ingredients*
Foodcontaining
preservatives
GM fruit &vegetables
Meat & otherproducts fromanimals fed
with GM stockfeed*
Food grownwith the use of
pesticides
Meat & otherproducts fromGM animals*
Mea
n ra
ting
(out
of 1
0)
2005 (confidence to eat foods) 2007 (willingness to eat foods)
Base: all CATI 2005 (n=1,068) 2007 (n=534)*2005 questions referred to 'meat' instead of 'meat and other products'Question changed in 2007 from ‘confidence’ to ‘willingness’ to eat products
An examination of the non-GM and cloning related items provides a baseline comparison from
which to work. Results indicate no difference between results for food containing preservatives
and a significant increase of 0.4 for organic food, non-organic food and food grown with the use
of pesticides. There have been much larger increases, however, for the GM and cloning related
items, an indication that there has been an increase in willingness to eat these items. The
largest gain was seen for food containing a small amount of GM ingredients, with the mean
rating rising from 3.9 to 5.2. The mean for the remaining items each increased by 0.9: up
from 4.0 to 4.9 for GM fruit and vegetables; up from 3.8 to 4.7 for meat and other products
from animals fed with GM stock, and up from 3.3 to 4.2 for meat and other products from GM
animals.
Group discussion participants described food from GM plants and artificial chemicals and
flavours as equally unnatural and to be avoided if possible. However, many people
acknowledged that they probably ate GM foods regularly (with GM foods believed to be more
widespread than in reality), and that they would probably continue to do so. In fact, some
participants preferred not to know too much about what they were consuming, thinking that
they would be disturbed by the information. The phrase “ignorance is bliss” was used in
several groups to describe this sentiment. Rural groups appeared to be less concerned than
metropolitan groups about food grown using chemicals and fertilisers, which are in general use
and considered to be safe. Interestingly, some group discussion participants said that they
would prefer to eat GM fruit and vegetables to heavily processed foods free of GM content,
which were seen by these participants as even less ‘natural’.

BIOTECHNOLOGY AUSTRALIA COMMUNITY PERCEPTIONS OF BIOTECHNOLOGY
JUNE 2007 | PAGE 39
Group discussions revealed much greater concerns about GM animal products, with many
participants wary about eating meat from GM and cloned animals. For some, GM meat was
regarded as ‘a bridge too far’; these people reported seeking out organic meat wherever
possible. Many referred to Dolly the Sheep, and subsequent attempts to clone farm animals, as
evidence that cloning techniques are not refined enough to produce healthy animals (and
healthy meat).
There was some disagreement within group discussions about whether meat from GM animals
or meat from cloned animals is safer.
My understanding is that to clone any animal you have to get a cell from that creature and it produces exactly the same, theoretically, set of genes. You're not modifying the genes; you're just taking them and saying I want an exact copy. Whereas genetic modification, you're taking the gene, and modifying it. So that to me is a little bit scarier than cloning.
A minority of participants were unconcerned about eating GM meat, saying that they trusted
that government would not allow unsafe meat to be sold to consumers.
Awareness and perceptions of biotechnology (non-GM) food crops
Participants were asked their opinions about the use of biotechnology in the production of food
from plants. They were asked about their awareness, perceived usefulness, perceived risk and
acceptability of using biotechnology in this context. They were then asked their views on using
biotechnology to assist in conventional breeding and by changing the genes of a plant without
introducing new DNA. This section was newly introduced to the survey this wave. Results for
these questions are presented in Figures 27 to 30 below.

BIOTECHNOLOGY AUSTRALIA COMMUNITY PERCEPTIONS OF BIOTECHNOLOGY
JUNE 2007 | PAGE 40
Awareness
Figure 27. Awareness of biotechnology (non-GM) food crops
7459
46
24
3852
2 3 1
0
20
40
60
80
100
Using biotechnology in theproduction of food from
plants
... to assist in conventionalbreeding
... by changing the genes ofa plant without introducing
new DNA
%
Don't knowNoYes
Base: rotated question CATI (n=254)
7459
46
24
3852
2 3 1
0
20
40
60
80
100
Using biotechnology in theproduction of food from
plants
... to assist in conventionalbreeding
... by changing the genes ofa plant without introducing
new DNA
%
Don't knowNoYes
Base: rotated question CATI (n=254)
Almost three in four (74%) participants were aware of the use biotechnology in the production
of food from plants. Awareness, however, declined when prompted with specific details about
the technique. Awareness of the application to assist in conventional breeding was 59%, while
awareness of the application involving changing the genes of a plant without introducing new
DNA was just under one in two (46%).
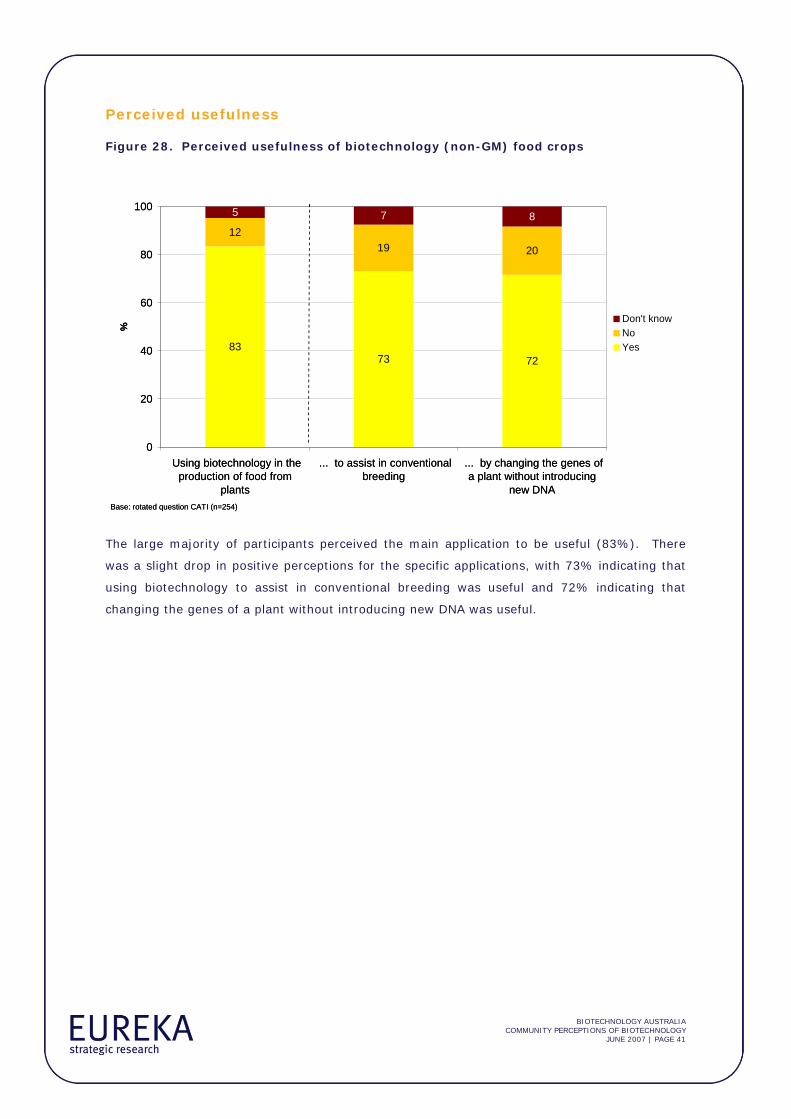
BIOTECHNOLOGY AUSTRALIA COMMUNITY PERCEPTIONS OF BIOTECHNOLOGY
JUNE 2007 | PAGE 41
Perceived usefulness
Figure 28. Perceived usefulness of biotechnology (non-GM) food crops
8373 72
1219 20
5 7 8
0
20
40
60
80
100
Using biotechnology in theproduction of food from
plants
... to assist in conventionalbreeding
... by changing the genes ofa plant without introducing
new DNA
%
Don't knowNoYes
Base: rotated question CATI (n=254)
8373 72
1219 20
5 7 8
0
20
40
60
80
100
Using biotechnology in theproduction of food from
plants
... to assist in conventionalbreeding
... by changing the genes ofa plant without introducing
new DNA
%
Don't knowNoYes
Base: rotated question CATI (n=254)
The large majority of participants perceived the main application to be useful (83%). There
was a slight drop in positive perceptions for the specific applications, with 73% indicating that
using biotechnology to assist in conventional breeding was useful and 72% indicating that
changing the genes of a plant without introducing new DNA was useful.
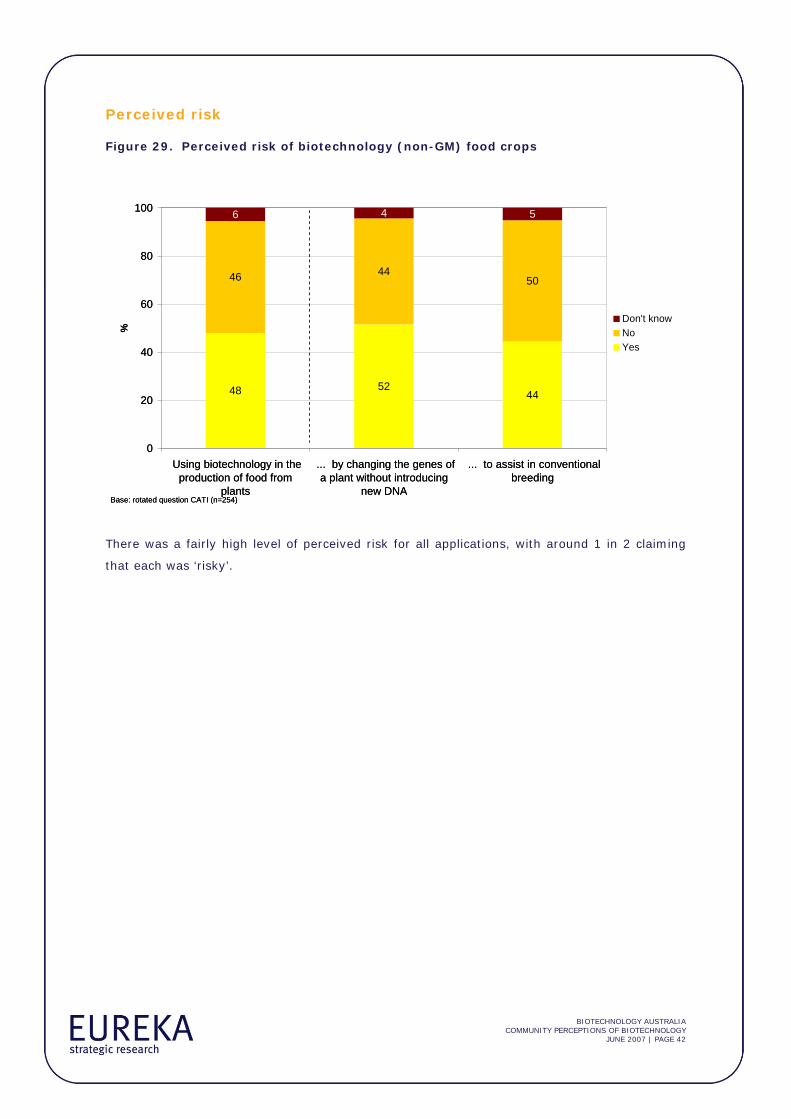
BIOTECHNOLOGY AUSTRALIA COMMUNITY PERCEPTIONS OF BIOTECHNOLOGY
JUNE 2007 | PAGE 42
Perceived risk
Figure 29. Perceived risk of biotechnology (non-GM) food crops
48 5244
46 4450
6 4 5
0
20
40
60
80
100
Using biotechnology in theproduction of food from
plants
... by changing the genes ofa plant without introducing
new DNA
... to assist in conventionalbreeding
%
Don't knowNoYes
Base: rotated question CATI (n=254)
48 5244
46 4450
6 4 5
0
20
40
60
80
100
Using biotechnology in theproduction of food from
plants
... by changing the genes ofa plant without introducing
new DNA
... to assist in conventionalbreeding
%
Don't knowNoYes
Base: rotated question CATI (n=254)
There was a fairly high level of perceived risk for all applications, with around 1 in 2 claiming
that each was ‘risky’.

BIOTECHNOLOGY AUSTRALIA COMMUNITY PERCEPTIONS OF BIOTECHNOLOGY
JUNE 2007 | PAGE 43
Perceived acceptability
Figure 30. Perceived acceptability of biotechnology (non-GM) food crops
7669 68
20 29 27
4 2 5
0
20
40
60
80
100
Using biotechnology in theproduction of food from
plants
... by changing the genes ofa plant without introducing
new DNA
... to assist in conventionalbreeding
%
Don't knowNoYes
Base: rotated question CATI (n=254)
7669 68
20 29 27
4 2 5
0
20
40
60
80
100
Using biotechnology in theproduction of food from
plants
... by changing the genes ofa plant without introducing
new DNA
... to assist in conventionalbreeding
%
Don't knowNoYes
Base: rotated question CATI (n=254)
The majority (76%) of participants perceived the use of biotechnology in the production of food
from plants to be acceptable. There was a slight reduction in positive perceptions for the two
specific applications, with just over two in three participants claiming each was acceptable.
Among group discussion participants, there was very little understanding of the nature of
biotechnology in agriculture without genetic modification. As noted earlier, there was a general
perception of the ‘natural’ (e.g. selective breeding) and the ‘unnatural’ (e.g. genetic
modification and cloning), but beyond this there was little notion of the techniques or objectives
in question. For this reason, some participants regard biotechnology (in its broadest sense) as
more natural than genetic modification, and therefore preferable.
Awareness and perceptions of GM non-food crops
Participants were asked their views on modifying the genes of plants to produce non-food
crops. Once again they were asked about their awareness, perceived usefulness, perceived risk
and perceived acceptability of the use of gene technology in this context. They were then
asked their views on modifying the genes of plants to produce non-food crops to produce fuels,
to produce clothing and other textiles and to produce plastics. This section was newly
introduced to the survey this wave. Results for these questions are presented in Figures 31 to
34 below.

BIOTECHNOLOGY AUSTRALIA COMMUNITY PERCEPTIONS OF BIOTECHNOLOGY
JUNE 2007 | PAGE 44
Awareness
Figure 31. Awareness of GM non-food crops
55 53 50
19
43 46 49
79
1 1 1 1
0
20
40
60
80
100
Modifying the genesof plants to produce
non-food crops
... to produce fuels ... to produceclothing and other
textiles
... to produce plastics
%
Don't knowNoYes
Base: rotated question CATI (n=274)
55 53 50
19
43 46 49
79
1 1 1 1
0
20
40
60
80
100
Modifying the genesof plants to produce
non-food crops
... to produce fuels ... to produceclothing and other
textiles
... to produce plastics
%
Don't knowNoYes
Base: rotated question CATI (n=274)
Just over one in two participants (55%) were aware of modifying the genes of plants to
produce non-food crops. Awareness was fairly similar for the application when used to produce
fuels (53%) and when used to produce clothing and other textiles (50%). Awareness was
lowest for the use of the application to produce plastics, at less than one in five (19%).

BIOTECHNOLOGY AUSTRALIA COMMUNITY PERCEPTIONS OF BIOTECHNOLOGY
JUNE 2007 | PAGE 45
Perceived usefulness
Figure 32. Perceived usefulness of GM non-food crops
70
89 84
62
21
8 14
32
8 3 3 6
0
20
40
60
80
100
Modifying the genesof plants to produce
non-food crops
... to produce fuels ... to produce clothingand other textiles
... to produce plastics
%
Don't knowNoYes
Base: rotated question CATI (n=274)
Seven in ten participants (70%) perceived that modifying the genes of plants to produce non-
food crops was useful. When prompted with specific applications, perceived utility was higher
for the production of fuels (89%) and for the production of clothing and other textiles (84%),
but lower for the production of plastics (62%).

BIOTECHNOLOGY AUSTRALIA COMMUNITY PERCEPTIONS OF BIOTECHNOLOGY
JUNE 2007 | PAGE 46
Perceived risk
Figure 33. Perceived risk of GM non-food crops
42 4736 36
5349
61 61
5 4 3 4
0
20
40
60
80
100
Modifying the genesof plants to produce
non-food crops
... to produceplastics
... to produceclothing and other
textiles
... to produce fuels
%
Don't knowNoYes
Base: rotated question CATI (n=274)
There were fairly high levels of risk associated with the use of biotechnology to produce non-
food crops, although less so than for the other food and agriculture applications. Forty-two
percent of participants indicated that the general application was ‘risky’. This was slightly
higher (47%) when for the purpose of producing plastics, but slightly lower when for the
purpose of producing clothing and textiles (36%) and for producing fuels (36%).

BIOTECHNOLOGY AUSTRALIA COMMUNITY PERCEPTIONS OF BIOTECHNOLOGY
JUNE 2007 | PAGE 47
Perceived acceptability
Figure 34. Perceived acceptability of GM non-food crops
7385 81
64
2413 17
34
3 2 2 3
0
20
40
60
80
100
Modifying the genesof plants to produce
non-food crops
... to produce fuels ... to produceclothing and other
textiles
... to produceplastics
%
Don't knowNoYes
Base: rotated question CATI (n=274)
7385 81
64
2413 17
34
3 2 2 3
0
20
40
60
80
100
Modifying the genesof plants to produce
non-food crops
... to produce fuels ... to produceclothing and other
textiles
... to produceplastics
%
Don't knowNoYes
Base: rotated question CATI (n=274)
Perceived acceptability of GM non-food crop applications followed a very similar trend to
perceived utility of GM non-food applications. Positive perceptions were higher for the specific
applications associated with fuel production (85%) and clothing production (81%) than for the
main application (73%), which in turn was higher than positive perceptions associated with the
production of plastics (64%).
Many group discussion participants were initially unsure of what kinds of non-food crops might
be genetically modified, and for what purposes. In the absence of further information, some
were hesitant to support growing such crops.
However, once it was revealed what kinds of crops might be grown – i.e. for textiles, fuels and
plastics – participants were much more supportive. In fact, the imperative to protect the
environment was generally believed to override any other concerns, meaning that GM fuel
crops (in particular) and GM crops for producing plastics were regarded positively.
You can be positive about gene modification in one area, but you don’t have to be positive about it another area. So I’m more positive about it affecting these kinds of areas, then I would be about food. I’d obviously look at it in a more positive light, but it doesn’t mean I’m going to eat GM food over organic food.

BIOTECHNOLOGY AUSTRALIA COMMUNITY PERCEPTIONS OF BIOTECHNOLOGY
JUNE 2007 | PAGE 48
There were slight apprehensions about GM cotton, which participants did not associate with
water savings or drought resistance. Instead, they questioned why cotton would be genetically
modified, believing the Australian cotton industry to be in good shape.
Perceptions of objectives of biotechnology
Survey participants were presented with a series of broader objectives of biotechnology and
were asked to rate the value of each of these objectives. Figure 35 below presents this data.
Figure 35. Perceived value of broader objectives of biotechnology
38
63
66
71
74
77
81
84
86
86
33
23
20
19
17
19
14
13
11
10
15
7
6
4
4
2
2
1
1
2
11
6
5
3
4
1
2
2
2
1
2
1
3
3
1
1
1
1
0
1
0 20 40 60 80 100
Lower plastic product cost
Lower petrol cost
Address declining biodiversity/extinction plants & animals
Combat salinity
Help address climate change
(Non-gene tech') to enablefarmers use less pesticides
Reduce fossil fuel consumption
Encourage development moreenviron' friendly vehicle fuels
Clean up pollution
Recycle water more effectively
%
Very valuable Somewhat valuable Not very valuable Not at all valuable Dont know
Base: All CATI, n=534
As we would anticipate, there was very high perceived value for all objectives, with the
exception of lowering the cost of plastics. Indeed, more than eight in ten participants rated
each of these objectives as either very valuable or somewhat valuable. Objectives that were
seen to be particularly valuable were water recycling (86% very valuable), cleaning up pollution
(86% very valuable) and the development of more environmentally friendly fuels (84% very
valuable).
At the other end of the scale, lowering the cost of plastic products was rated as very valuable
by just 38%.
Group discussion feedback indicated strong support for the use of biotechnology in addressing
environmental problems. The most pressing problems for participants were generally those
relating to climate change and water shortages. Indeed, some people regarded such initiatives
as the most valuable aspect of biotechnology.

BIOTECHNOLOGY AUSTRALIA COMMUNITY PERCEPTIONS OF BIOTECHNOLOGY
JUNE 2007 | PAGE 49
I think I’m more interested in the things that preserve the earth, than I am in preserving individual lives to be honest, because that’s the future generation. As we get more and more into this thing where we’re curing diseases…we all look at human life as such a precious thing, the earth is a lot more precious and has been around a lot longer.

BIOTECHNOLOGY AUSTRALIA COMMUNITY PERCEPTIONS OF BIOTECHNOLOGY
JUNE 2007 | PAGE 50
CONCLUSIONS
Biotechnology in food and agriculture
Survey results indicate significant increases in both awareness of and support for GM food
crops since 2005. As in previous research on these issues, attitudes towards biotechnology in
food and agriculture are on balance less positive than attitudes towards biotechnology in health
and medicine. Many tend to associate GM crops with commercial objectives – although when
prompted (and sometimes spontaneously), people voice strong support for the development of
GM crops that could contribute to humanitarian or environmental objectives (the most
prominent example being drought resistant crops). Indeed, qualitative and quantitative
participants alike regarded environmental objectives as very valuable in the development of
gene technology and GM plants.
A minority remains strongly opposed to GM food crops in particular. Their resistance is
associated with a number of attitudes and beliefs, including a belief in natural (non-
industrialised) farming practices; opposition to big business and the globalisation of commercial
agriculture; environmental opposition to the release of unnaturally modified organisms into the
ecosystem; health concerns about genetic modification in the food chain, and discomfort with
science and new technology generally. Opposition to genetic modification is much stronger
where animal products are involved – including among those not overly concerned about GM
plants.
As in 2005, there is a widespread misconception that GM foods are widely prevalent in our food
supply – as well as an associated assumption and concern that GM products are not labelled as
they should be, and that consumers are being misled into buying GM inadvertently. There is
also very low awareness of the moratoria that are currently in place, preventing the commercial
production of GM crops. Many consumers are more troubled over what they see as a lack of
informed choice than over the prospect of ingesting GM food, which they believe is already
4 This section presents the conclusions
of the research

BIOTECHNOLOGY AUSTRALIA COMMUNITY PERCEPTIONS OF BIOTECHNOLOGY
JUNE 2007 | PAGE 51
commonplace. Stated willingness to eat genetically modified products is low, particularly for
meat and other animal products.
Nevertheless, stated willingness to eat foods commonly eaten, such as food with preservatives
and food made with the use of pesticides, is equally as low as willingness to eat non-animal
related GM products. Therefore it would seem that stated concerns are somewhat inflated and
that actual behaviour will not necessarily follow claimed intent.
Compared to food crops, awareness of understanding of GM non-food crops is much lower,
although there is more in-principle support for non-food crops due to lower perceived risks to
human health in the long term. Support is especially strong for GM biofuel crops, with people
readily associating such crops with the looming fuel crisis and the need to combat global
warming. However, some research participants expressed caution on this issue, arguing that
care (and perhaps GM) would be needed to avoid displacing food crops from prime land.
There is low understanding of the use of non-GM techniques in agriculture, with the majority
unsure what such techniques would entail. Many assume that the techniques would be more
‘natural’ and therefore preferable to genetic modification.
Broadly speaking, it appears that people have become more familiar with biotechnology and
gene technology over the last two years. There is no reason to suppose that the trend towards
greater acceptance will not continue, as these technologies become a more normal part of
everyday life. There is no great public appetite for detailed factual information about how
things are done; rather, people are more interested in learning about the potential benefits of
technology.

BIOTECHNOLOGY AUSTRALIA COMMUNITY PERCEPTIONS OF BIOTECHNOLOGY
JUNE 2007