community college survey of student engagement - austin
TRANSCRIPT

page 1 - 14JUN13
* The comparison group and cohort columns on this page INCLUDE your college.
Community College Survey of Student Engagement - Austin Community College (2013 Administration)
2013 Benchmark Scores Report - Main Survey
Comparison Group: Extra-Large Colleges in the 2013 Cohort*
Breakout by Enrollment Status
[Unweighted]
Your College Ex-Large Colleges 2013 Cohort
Benchmark Breakout Group Score Score Difference Score Difference
Active and Collaborative Learning Less than full-time 44.2 46.5 -2.3 46.4 -2.2
Full-time 54.9 55.2 -0.3 55.6 -0.7
Student Effort Less than full-time 43.8 46.6 -2.8 47.0 -3.2
Full-time 55.2 54.3 0.9 54.6 0.5
Academic Challenge Less than full-time 45.8 46.9 -1.1 46.4 -0.6
Full-time 55.7 55.4 0.3 55.0 0.7
Student-Faculty Interaction Less than full-time 46.5 45.8 0.7 47.1 -0.6
Full-time 56.5 53.5 3.1 55.1 1.4
Support for Learners Less than full-time 47.4 47.3 0.1 48.5 -1.1
Full-time 51.9 51.6 0.3 53.1 -1.3

Community College Survey of Student EngagementAustin Community College (2013 Administration)
2013 Benchmark Bar Chart - Main SurveyComparison Group: Extra-Large Colleges in the 2013 Cohort*
Breakout by Enrollment Status[Unweighted]
Active and Collaborative Learning (ACTCOLL)
14JUN13
* The comparison group and cohort bars on this page INCLUDE your college.
Your College
Ex-Large Colleges
2013 Cohort
44.2 46.5 46.454.9 55.2 55.6
0.0
20.0
40.0
60.0
80.0
100.0
LessThan
Full-Time
Full-Time

If a row contains less than 50 respondents (please see Frequency Distribution that follows), interpret the comparison results cautiously.
** T-test: 2-tailed page 3 - 14JUN13
* The comparison group and cohort columns on this page EXCLUDE your college.
Community College Survey of Student Engagement - Austin Community College (2013 Administration)
2013 Benchmark Means Report - Main Survey
Comparison Group: Extra-Large Colleges in the 2013 Cohort*
Breakout by Enrollment Status
[Unweighted]
Active and Collaborative Learning (ACTCOLL)
YourCollege Ex-Large Colleges 2013 Cohort
Item Variable Breakout Group Mean MeanEffectSize** Mean
EffectSize**
Item 4: In your experiences at this college during the current school year, about how often have you done each of the following?
1 = Never, 2 = Sometimes, 3 = Often, 4 = Very often
4a. Asked questions in class or contributed toclass discussions [ACTCOLL]
CLQUEST Less than full-time 2.77 2.85 2.89
Full-time 2.99 2.94 3.00
4b. Made a class presentation [ACTCOLL] CLPRESEN Less than full-time 1.90 2.06 1.99
Full-time 2.28 2.38 2.31
4f. Worked with other students on projects duringclass [ACTCOLL]
CLASSGRP Less than full-time 2.42 2.45 2.44
Full-time 2.51 2.60 2.61
4g. Worked with classmates outside of class toprepare class assignments [ACTCOLL]
OCCGRP Less than full-time 1.92 1.83 1.81
Full-time 2.10 2.08 2.08
4h. Tutored or taught other students (paid orvoluntary) [ACTCOLL]
TUTOR Less than full-time 1.32 1.32 1.32
Full-time 1.56 1.47 1.48
4i. Participated in a community-based project as apart of a regular course [ACTCOLL]
COMMPROJ Less than full-time 1.20 1.27 1.27
Full-time 1.30 1.41 1.42
4r. Discussed ideas from your readings or classeswith others outside of class (students, familymembers, co-workers, etc.) [ACTCOLL]
OOCIDEAS Less than full-time 2.46 2.53 2.52
Full-time 2.72 2.63 2.63

page 4 - 14JUN13
* The comparison group and cohort columns on this page EXCLUDE your college.
Community College Survey of Student Engagement - Austin Community College (2013 Administration)
2013 Benchmark Frequency Distributions - Main Survey
Comparison Group: Extra-Large Colleges in the 2013 Cohort*
Breakout by Enrollment Status: Less Than Full-Time Students
[Unweighted]
Active and Collaborative Learning (ACTCOLL)
Your College Ex-Large Colleges 2013 Cohort
Item Variable Responses Count Percent Count Percent Count Percent
Item 4: In your experiences at this college during the current school year, about how often have you done each of the following?
4a. Asked questions in class or contributedto class discussions [ACTCOLL]
CLQUEST Never 21 5.1 1,035 3.5 3,817 3.0
Sometimes 162 39.2 10,335 35.1 43,311 33.6
Often 121 29.3 10,054 34.2 44,986 34.8
Very often 109 26.4 7,990 27.2 36,979 28.6
Total 413 100.0 29,414 100.0 129,093 100.0
4b. Made a class presentation [ACTCOLL] CLPRESEN Never 168 40.6 9,203 31.4 43,929 34.2
Sometimes 143 34.5 11,648 39.8 51,008 39.7
Often 79 19.1 6,012 20.5 24,088 18.7
Very often 24 5.8 2,434 8.3 9,513 7.4
Total 414 100.0 29,297 100.0 128,538 100.0
4f. Worked with other students on projectsduring class [ACTCOLL]
CLASSGRP Never 60 14.6 4,314 14.8 19,171 15.0
Sometimes 172 42.0 11,352 39.0 50,479 39.5
Often 122 29.8 9,329 32.1 40,112 31.4
Very often 56 13.7 4,086 14.1 17,904 14.0
Total 410 100.0 29,081 100.0 127,666 100.0
4g. Worked with classmates outside of classto prepare class assignments [ACTCOLL]
OCCGRP Never 146 35.4 12,444 42.7 57,070 44.6
Sometimes 177 43.0 10,811 37.1 45,617 35.6
Often 65 15.8 4,249 14.6 18,016 14.1
Very often 24 5.8 1,670 5.7 7,362 5.7
Total 412 100.0 29,174 100.0 128,065 100.0
4h. Tutored or taught other students (paid orvoluntary) [ACTCOLL]
TUTOR Never 318 76.4 22,380 76.5 98,485 76.7
Sometimes 69 16.6 5,005 17.1 21,573 16.8
Often 22 5.3 1,225 4.2 5,501 4.3
Very often 7 1.7 635 2.2 2,776 2.2
Total 416 100.0 29,245 100.0 128,335 100.0
4i. Participated in a community-based projectas a part of a regular course [ACTCOLL]
COMMPROJ Never 353 85.3 23,328 80.2 102,644 80.4
Sometimes 43 10.4 4,111 14.1 17,792 13.9
Often 14 3.4 1,153 4.0 5,037 3.9
Very often 4 1.0 481 1.7 2,225 1.7
Total 414 100.0 29,073 100.0 127,698 100.0
4r. Discussed ideas from your readings orclasses with others outside of class(students, family members, co-workers, etc.)[ACTCOLL]
OOCIDEAS Never 67 16.2 4,114 14.1 18,470 14.4
Sometimes 166 40.2 11,022 37.8 48,770 38.0
Often 104 25.2 8,524 29.2 37,387 29.2
Very often 76 18.4 5,530 18.9 23,579 18.4
Total 413 100.0 29,190 100.0 128,206 100.0

page 5 - 14JUN13
* The comparison group and cohort columns on this page EXCLUDE your college.
Community College Survey of Student Engagement - Austin Community College (2013 Administration)
2013 Benchmark Frequency Distributions - Main Survey
Comparison Group: Extra-Large Colleges in the 2013 Cohort*
Breakout by Enrollment Status: Full-Time Students
[Unweighted]
Active and Collaborative Learning (ACTCOLL)
Your College Ex-Large Colleges 2013 Cohort
Item Variable Responses Count Percent Count Percent Count Percent
Item 4: In your experiences at this college during the current school year, about how often have you done each of the following?
4a. Asked questions in class or contributedto class discussions [ACTCOLL]
CLQUEST Never 15 2.8 1,446 2.4 6,426 2.0
Sometimes 164 30.1 18,861 31.8 96,223 29.3
Often 179 32.9 20,642 34.8 117,346 35.7
Very often 186 34.2 18,316 30.9 108,803 33.1
Total 544 100.0 59,265 100.0 328,798 100.0
4b. Made a class presentation [ACTCOLL] CLPRESEN Never 102 18.9 9,550 16.2 59,962 18.3
Sometimes 248 45.8 25,260 42.8 142,868 43.6
Often 126 23.3 16,678 28.2 86,917 26.5
Very often 65 12.0 7,597 12.9 37,912 11.6
Total 541 100.0 59,085 100.0 327,659 100.0
4f. Worked with other students on projectsduring class [ACTCOLL]
CLASSGRP Never 68 12.7 4,853 8.3 26,790 8.2
Sometimes 219 40.8 23,165 39.5 126,897 39.0
Often 160 29.8 21,025 35.8 117,187 36.0
Very often 90 16.8 9,629 16.4 54,586 16.8
Total 537 100.0 58,672 100.0 325,460 100.0
4g. Worked with classmates outside of classto prepare class assignments [ACTCOLL]
OCCGRP Never 146 27.2 17,377 29.5 97,487 29.9
Sometimes 238 44.3 24,638 41.9 134,202 41.1
Often 106 19.7 11,726 19.9 65,751 20.1
Very often 47 8.8 5,074 8.6 28,935 8.9
Total 537 100.0 58,815 100.0 326,375 100.0
4h. Tutored or taught other students (paid orvoluntary) [ACTCOLL]
TUTOR Never 335 62.2 39,489 67.0 217,561 66.5
Sometimes 132 24.5 13,246 22.5 74,924 22.9
Often 48 8.9 4,060 6.9 22,503 6.9
Very often 24 4.5 2,129 3.6 12,062 3.7
Total 539 100.0 58,924 100.0 327,050 100.0
4i. Participated in a community-based projectas a part of a regular course [ACTCOLL]
COMMPROJ Never 416 77.2 41,808 71.2 230,029 70.6
Sometimes 95 17.6 11,458 19.5 65,635 20.2
Often 17 3.2 3,719 6.3 20,397 6.3
Very often 11 2.0 1,693 2.9 9,611 3.0
Total 539 100.0 58,678 100.0 325,672 100.0
4r. Discussed ideas from your readings orclasses with others outside of class(students, family members, co-workers, etc.)[ACTCOLL]
OOCIDEAS Never 47 8.6 6,342 10.8 35,343 10.8
Sometimes 200 36.8 21,784 37.0 120,222 36.8
Often 154 28.3 18,021 30.6 102,111 31.2
Very often 143 26.3 12,726 21.6 69,264 21.2
Total 544 100.0 58,873 100.0 326,940 100.0

Community College Survey of Student EngagementAustin Community College (2013 Administration)
2013 Benchmark Bar Chart - Main SurveyComparison Group: Extra-Large Colleges in the 2013 Cohort*
Breakout by Enrollment Status[Unweighted]
Student Effort (STUEFF)
14JUN13
* The comparison group and cohort bars on this page INCLUDE your college.
Your College
Ex-Large Colleges
2013 Cohort
43.8 46.6 47.055.2 54.3 54.6
0.0
20.0
40.0
60.0
80.0
100.0
LessThan
Full-Time
Full-Time
If a row contains less than 50 respondents (please see Frequency Distribution that follows), interpret the comparison results cautiously.
** T-test: 2-tailed page 7 - 14JUN13
* The comparison group and cohort columns on this page EXCLUDE your college.
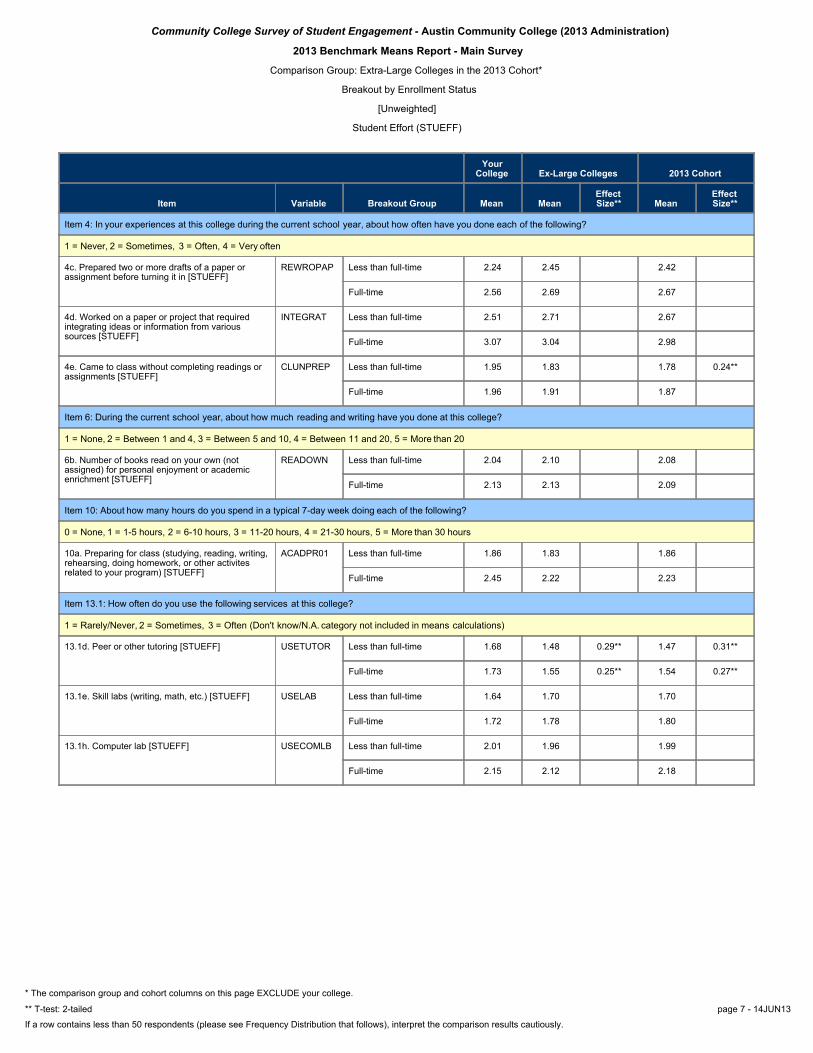
Community College Survey of Student Engagement - Austin Community College (2013 Administration)
2013 Benchmark Means Report - Main Survey
Comparison Group: Extra-Large Colleges in the 2013 Cohort*
Breakout by Enrollment Status
[Unweighted]
Student Effort (STUEFF)
YourCollege Ex-Large Colleges 2013 Cohort
Item Variable Breakout Group Mean MeanEffectSize** Mean
EffectSize**
Item 4: In your experiences at this college during the current school year, about how often have you done each of the following?
1 = Never, 2 = Sometimes, 3 = Often, 4 = Very often
4c. Prepared two or more drafts of a paper orassignment before turning it in [STUEFF]
REWROPAP Less than full-time 2.24 2.45 2.42
Full-time 2.56 2.69 2.67
4d. Worked on a paper or project that requiredintegrating ideas or information from varioussources [STUEFF]
INTEGRAT Less than full-time 2.51 2.71 2.67
Full-time 3.07 3.04 2.98
4e. Came to class without completing readings orassignments [STUEFF]
CLUNPREP Less than full-time 1.95 1.83 1.78 0.24**
Full-time 1.96 1.91 1.87
Item 6: During the current school year, about how much reading and writing have you done at this college?
1 = None, 2 = Between 1 and 4, 3 = Between 5 and 10, 4 = Between 11 and 20, 5 = More than 20
6b. Number of books read on your own (notassigned) for personal enjoyment or academicenrichment [STUEFF]
READOWN Less than full-time 2.04 2.10 2.08
Full-time 2.13 2.13 2.09
Item 10: About how many hours do you spend in a typical 7-day week doing each of the following?
0 = None, 1 = 1-5 hours, 2 = 6-10 hours, 3 = 11-20 hours, 4 = 21-30 hours, 5 = More than 30 hours
10a. Preparing for class (studying, reading, writing,rehearsing, doing homework, or other activitesrelated to your program) [STUEFF]
ACADPR01 Less than full-time 1.86 1.83 1.86
Full-time 2.45 2.22 2.23
Item 13.1: How often do you use the following services at this college?
1 = Rarely/Never, 2 = Sometimes, 3 = Often (Don't know/N.A. category not included in means calculations)
13.1d. Peer or other tutoring [STUEFF] USETUTOR Less than full-time 1.68 1.48 0.29** 1.47 0.31**
Full-time 1.73 1.55 0.25** 1.54 0.27**
13.1e. Skill labs (writing, math, etc.) [STUEFF] USELAB Less than full-time 1.64 1.70 1.70
Full-time 1.72 1.78 1.80
13.1h. Computer lab [STUEFF] USECOMLB Less than full-time 2.01 1.96 1.99
Full-time 2.15 2.12 2.18

page 8 - 14JUN13
* The comparison group and cohort columns on this page EXCLUDE your college.
Community College Survey of Student Engagement - Austin Community College (2013 Administration)
2013 Benchmark Frequency Distributions - Main Survey
Comparison Group: Extra-Large Colleges in the 2013 Cohort*
Breakout by Enrollment Status: Less Than Full-Time Students
[Unweighted]
Student Effort (STUEFF)
Your College Ex-Large Colleges 2013 Cohort
Item Variable Responses Count Percent Count Percent Count Percent
Item 4: In your experiences at this college during the current school year, about how often have you done each of the following?
4c. Prepared two or more drafts of a paperor assignment before turning it in [STUEFF]
REWROPAP Never 126 30.5 6,661 22.8 30,317 23.7
Sometimes 122 29.5 8,489 29.1 37,448 29.3
Often 103 24.9 8,409 28.8 36,677 28.7
Very often 62 15.0 5,625 19.3 23,554 18.4
Total 413 100.0 29,184 100.0 127,996 100.0
4d. Worked on a paper or project thatrequired integrating ideas or informationfrom various sources [STUEFF]
INTEGRAT Never 71 17.1 3,660 12.6 16,920 13.2
Sometimes 130 31.4 8,090 27.7 37,139 29.0
Often 142 34.3 10,582 36.3 45,821 35.8
Very often 71 17.1 6,828 23.4 28,147 22.0
Total 414 100.0 29,160 100.0 128,027 100.0
4e. Came to class without completingreadings or assignments [STUEFF]
CLUNPREP Never 102 24.7 9,846 33.8 47,186 36.9
Sometimes 245 59.3 15,518 53.2 65,683 51.4
Often 49 11.9 2,776 9.5 10,896 8.5
Very often 17 4.1 1,012 3.5 4,083 3.2
Total 413 100.0 29,152 100.0 127,848 100.0
Item 6: During the current school year, about how much reading and writing have you done at this college?
6b. Number of books read on your own (notassigned) for personal enjoyment oracademic enrichment [STUEFF]
READOWN None 126 31.0 8,025 27.8 37,127 29.2
1 to 4 198 48.8 14,087 48.7 60,122 47.3
5 to 10 42 10.3 4,065 14.1 17,727 13.9
11 to 20 18 4.4 1,431 4.9 6,459 5.1
More than 20 22 5.4 1,309 4.5 5,753 4.5
Total 406 100.0 28,917 100.0 127,188 100.0
Item 10: About how many hours do you spend in a typical 7-day week doing each of the following?
10a. Preparing for class (studying, reading,writing, rehearsing, doing homework, orother activites related to your program)[STUEFF]
ACADPR01 None 7 1.7 472 1.6 2,195 1.7
1-5 hours 188 46.2 12,974 44.9 55,853 44.0
6-10 hours 104 25.6 8,930 30.9 38,863 30.6
11-20 hours 80 19.7 4,494 15.6 20,500 16.1
21-30 hours 21 5.2 1,336 4.6 6,402 5.0
More than 30 hours 7 1.7 659 2.3 3,143 2.5
Total 407 100.0 28,865 100.0 126,956 100.0
Item 13.1: How often do you use the following services at this college?
13.1d. Peer or other tutoring [STUEFF] USETUTOR Don't know/N.A. 71 17.5 7,343 26.5 32,765 26.8
Rarely/Never 167 41.2 12,798 46.1 56,723 46.4
Sometimes 106 26.2 5,346 19.3 23,107 18.9
Often 61 15.1 2,253 8.1 9,609 7.9
Total 405 100.0 27,740 100.0 122,204 100.0
page 9 - 14JUN13
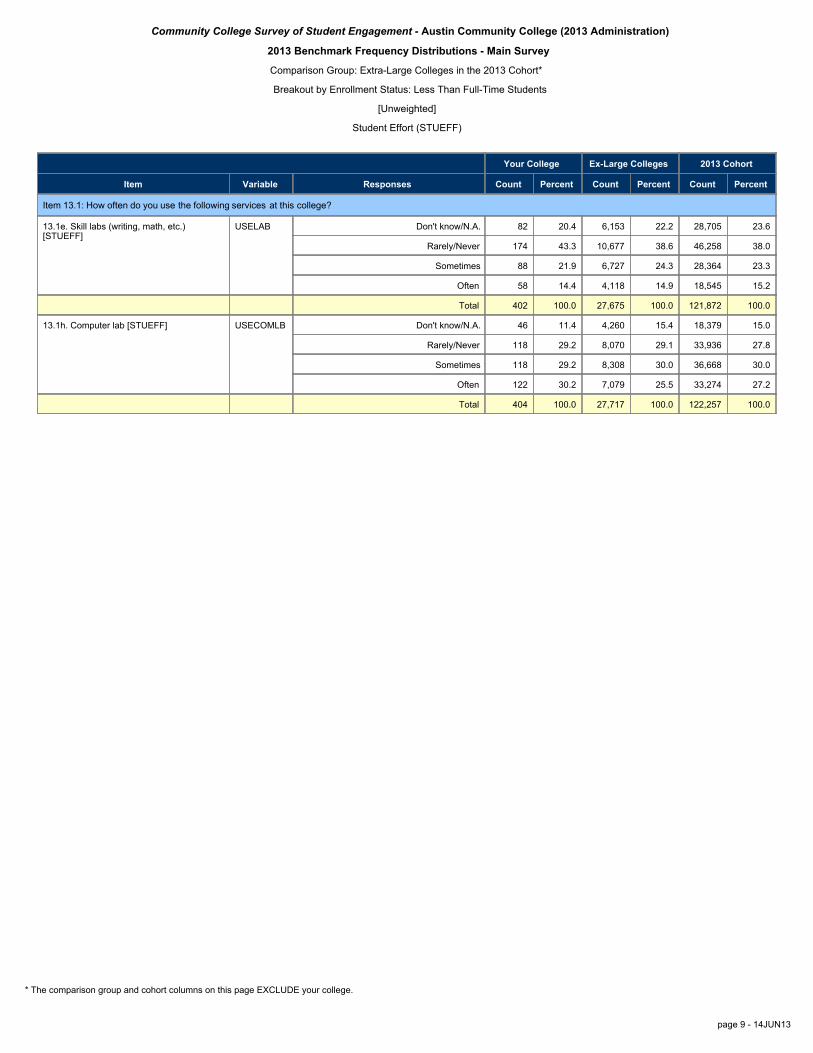
* The comparison group and cohort columns on this page EXCLUDE your college.
Community College Survey of Student Engagement - Austin Community College (2013 Administration)
2013 Benchmark Frequency Distributions - Main Survey
Comparison Group: Extra-Large Colleges in the 2013 Cohort*
Breakout by Enrollment Status: Less Than Full-Time Students
[Unweighted]
Student Effort (STUEFF)
Your College Ex-Large Colleges 2013 Cohort
Item Variable Responses Count Percent Count Percent Count Percent
Item 13.1: How often do you use the following services at this college?
13.1e. Skill labs (writing, math, etc.)[STUEFF]
USELAB Don't know/N.A. 82 20.4 6,153 22.2 28,705 23.6
Rarely/Never 174 43.3 10,677 38.6 46,258 38.0
Sometimes 88 21.9 6,727 24.3 28,364 23.3
Often 58 14.4 4,118 14.9 18,545 15.2
Total 402 100.0 27,675 100.0 121,872 100.0
13.1h. Computer lab [STUEFF] USECOMLB Don't know/N.A. 46 11.4 4,260 15.4 18,379 15.0
Rarely/Never 118 29.2 8,070 29.1 33,936 27.8
Sometimes 118 29.2 8,308 30.0 36,668 30.0
Often 122 30.2 7,079 25.5 33,274 27.2
Total 404 100.0 27,717 100.0 122,257 100.0

page 10 - 14JUN13
* The comparison group and cohort columns on this page EXCLUDE your college.
Community College Survey of Student Engagement - Austin Community College (2013 Administration)
2013 Benchmark Frequency Distributions - Main Survey
Comparison Group: Extra-Large Colleges in the 2013 Cohort*
Breakout by Enrollment Status: Full-Time Students
[Unweighted]
Student Effort (STUEFF)
Your College Ex-Large Colleges 2013 Cohort
Item Variable Responses Count Percent Count Percent Count Percent
Item 4: In your experiences at this college during the current school year, about how often have you done each of the following?
4c. Prepared two or more drafts of a paperor assignment before turning it in [STUEFF]
REWROPAP Never 91 16.9 8,036 13.7 46,327 14.2
Sometimes 171 31.8 16,826 28.6 95,504 29.3
Often 160 29.7 19,068 32.4 104,617 32.0
Very often 116 21.6 14,879 25.3 79,979 24.5
Total 538 100.0 58,809 100.0 326,427 100.0
4d. Worked on a paper or project thatrequired integrating ideas or informationfrom various sources [STUEFF]
INTEGRAT Never 14 2.6 2,475 4.2 15,891 4.9
Sometimes 127 23.5 12,859 21.8 76,488 23.4
Often 209 38.6 23,532 40.0 131,288 40.2
Very often 191 35.3 19,990 34.0 103,172 31.6
Total 541 100.0 58,856 100.0 326,839 100.0
4e. Came to class without completingreadings or assignments [STUEFF]
CLUNPREP Never 142 26.4 16,673 28.4 100,282 30.8
Sometimes 304 56.5 33,243 56.6 181,107 55.6
Often 66 12.3 6,242 10.6 31,762 9.7
Very often 26 4.8 2,544 4.3 12,861 3.9
Total 538 100.0 58,702 100.0 326,012 100.0
Item 6: During the current school year, about how much reading and writing have you done at this college?
6b. Number of books read on your own (notassigned) for personal enjoyment oracademic enrichment [STUEFF]
READOWN None 136 25.4 15,927 27.2 96,572 29.7
1 to 4 269 50.3 28,056 47.9 150,617 46.3
5 to 10 79 14.8 8,431 14.4 44,493 13.7
11 to 20 25 4.7 3,169 5.4 17,315 5.3
More than 20 26 4.9 2,942 5.0 16,079 4.9
Total 535 100.0 58,525 100.0 325,076 100.0
Item 10: About how many hours do you spend in a typical 7-day week doing each of the following?
10a. Preparing for class (studying, reading,writing, rehearsing, doing homework, orother activites related to your program)[STUEFF]
ACADPR01 None 2 0.4 631 1.1 3,815 1.2
1-5 hours 123 23.0 18,802 32.2 104,805 32.3
6-10 hours 168 31.5 17,466 29.9 95,506 29.5
11-20 hours 148 27.7 13,070 22.4 70,706 21.8
21-30 hours 58 10.9 5,357 9.2 30,843 9.5
More than 30 hours 35 6.6 3,044 5.2 18,504 5.7
Total 534 100.0 58,370 100.0 324,179 100.0
Item 13.1: How often do you use the following services at this college?
13.1d. Peer or other tutoring [STUEFF] USETUTOR Don't know/N.A. 83 15.7 11,908 21.1 66,979 21.3
Rarely/Never 215 40.8 25,839 45.8 145,558 46.3
Sometimes 133 25.2 12,851 22.8 69,890 22.3
Often 96 18.2 5,816 10.3 31,679 10.1
Total 527 100.0 56,414 100.0 314,106 100.0

page 11 - 14JUN13
* The comparison group and cohort columns on this page EXCLUDE your college.
Community College Survey of Student Engagement - Austin Community College (2013 Administration)
2013 Benchmark Frequency Distributions - Main Survey
Comparison Group: Extra-Large Colleges in the 2013 Cohort*
Breakout by Enrollment Status: Full-Time Students
[Unweighted]
Student Effort (STUEFF)
Your College Ex-Large Colleges 2013 Cohort
Item Variable Responses Count Percent Count Percent Count Percent
Item 13.1: How often do you use the following services at this college?
13.1e. Skill labs (writing, math, etc.)[STUEFF]
USELAB Don't know/N.A. 99 18.9 10,014 17.8 56,903 18.2
Rarely/Never 215 41.1 20,771 36.8 112,235 35.8
Sometimes 111 21.2 15,187 26.9 82,944 26.5
Often 98 18.7 10,404 18.5 61,233 19.5
Total 523 100.0 56,376 100.0 313,315 100.0
13.1h. Computer lab [STUEFF] USECOMLB Don't know/N.A. 53 10.1 5,642 10.0 27,768 8.8
Rarely/Never 127 24.1 13,539 24.0 67,716 21.6
Sometimes 147 27.9 17,567 31.1 99,403 31.7
Often 200 38.0 19,686 34.9 118,944 37.9
Total 527 100.0 56,434 100.0 313,831 100.0

Community College Survey of Student EngagementAustin Community College (2013 Administration)
2013 Benchmark Bar Chart - Main SurveyComparison Group: Extra-Large Colleges in the 2013 Cohort*
Breakout by Enrollment Status[Unweighted]
Academic Challenge (ACCHALL)
14JUN13
* The comparison group and cohort bars on this page INCLUDE your college.
Your College
Ex-Large Colleges
2013 Cohort
45.8 46.9 46.455.7 55.4 55.0
0.0
20.0
40.0
60.0
80.0
100.0
LessThan
Full-Time
Full-Time

If a row contains less than 50 respondents (please see Frequency Distribution that follows), interpret the comparison results cautiously.
** T-test: 2-tailed page 13 - 14JUN13
* The comparison group and cohort columns on this page EXCLUDE your college.
Community College Survey of Student Engagement - Austin Community College (2013 Administration)
2013 Benchmark Means Report - Main Survey
Comparison Group: Extra-Large Colleges in the 2013 Cohort*
Breakout by Enrollment Status
[Unweighted]
Academic Challenge (ACCHALL)
YourCollege Ex-Large Colleges 2013 Cohort
Item Variable Breakout Group Mean MeanEffectSize** Mean
EffectSize**
Item 4: In your experiences at this college during the current school year, about how often have you done each of the following?
1 = Never, 2 = Sometimes, 3 = Often, 4 = Very often
4p. Worked harder than you thought you could tomeet an instructor's standards or expectations[ACCHALL]
WORKHARD Less than full-time 2.40 2.54 2.55
Full-time 2.73 2.69 2.71
Item 5: During the current school year, how much has your coursework at this college emphasized the following mental activities?
1 = Very little, 2 = Some, 3 = Quite a bit, 4 = Very much
5b. Analyzing the basic elements of an idea,experience, or theory [ACCHALL]
ANALYZE Less than full-time 2.98 2.89 2.86
Full-time 3.06 3.03 2.98
5c. Synthesizing and organizing ideas, information,or experiences in new ways [ACCHALL]
SYNTHESZ Less than full-time 2.80 2.75 2.73
Full-time 2.90 2.89 2.86
5d. Making judgments about the value orsoundness of information, arguments, or methods[ACCHALL]
EVALUATE Less than full-time 2.59 2.57 2.54
Full-time 2.77 2.76 2.72
5e. Applying theories or concepts to practicalproblems or in new situations [ACCHALL]
APPLYING Less than full-time 2.69 2.67 2.65
Full-time 2.91 2.83 2.82
5f. Using information you have read or heard toperform a new skill [ACCHALL]
PERFORM Less than full-time 2.69 2.77 2.77
Full-time 2.92 2.90 2.93
Item 6: During the current school year, about how much reading and writing have you done at this college?
1 = None, 2 = Between 1 and 4, 3 = Between 5 and 10, 4 = Between 11 and 20, 5 = More than 20
6a. Number of assigned textbooks, manuals,books, or book-length packs of course readings[ACCHALL]
READASGN Less than full-time 2.62 2.75 2.74
Full-time 2.99 3.12 3.14
6c. Number of written papers or reports of anylength [ACCHALL]
WRITEANY Less than full-time 2.59 2.72 2.69
Full-time 3.19 3.23 3.18
Item 7
1 = Extremely easy ... 7 = Extremely challenging
7. Mark the response that best represents theextent to which your examinations during thecurrent school year have challenged you to doyour best work at this college [ACCHALL]
EXAMS Less than full-time 4.95 4.89 4.95
Full-time 4.93 4.96 5.03
Item 9: How much does this college emphasize each of the following?
1 = Very little, 2 = Some, 3 = Quite a bit, 4 = Very much
9a. Encouraging you to spend significant amountsof time studying [ACCHALL]
ENVSCHOL Less than full-time 2.91 2.99 2.99
Full-time 3.11 3.09 3.10

page 14 - 14JUN13
* The comparison group and cohort columns on this page EXCLUDE your college.
Community College Survey of Student Engagement - Austin Community College (2013 Administration)
2013 Benchmark Frequency Distributions - Main Survey
Comparison Group: Extra-Large Colleges in the 2013 Cohort*
Breakout by Enrollment Status: Less Than Full-Time Students
[Unweighted]
Academic Challenge (ACCHALL)
Your College Ex-Large Colleges 2013 Cohort
Item Variable Responses Count Percent Count Percent Count Percent
Item 4: In your experiences at this college during the current school year, about how often have you done each of the following?
4p. Worked harder than you thought youcould to meet an instructor's standards orexpectations [ACCHALL]
WORKHARD Never 64 15.6 3,332 11.4 14,105 11.0
Sometimes 166 40.4 11,243 38.6 48,966 38.3
Often 132 32.1 9,991 34.3 44,512 34.8
Very often 49 11.9 4,564 15.7 20,244 15.8
Total 411 100.0 29,130 100.0 127,827 100.0
Item 5: During the current school year, how much has your coursework at this college emphasized the following mental activities?
5b. Analyzing the basic elements of an idea,experience, or theory [ACCHALL]
ANALYZE Very little 16 3.9 1,481 5.1 6,769 5.3
Some 97 23.4 7,727 26.5 35,324 27.6
Quite a bit 179 43.2 12,358 42.4 54,601 42.6
Very much 122 29.5 7,606 26.1 31,348 24.5
Total 414 100.0 29,172 100.0 128,042 100.0
5c. Synthesizing and organizing ideas,information, or experiences in new ways[ACCHALL]
SYNTHESZ Very little 25 6.0 2,251 7.8 9,946 7.8
Some 126 30.4 9,130 31.5 41,533 32.6
Quite a bit 168 40.6 11,170 38.5 48,709 38.2
Very much 95 22.9 6,450 22.2 27,283 21.4
Total 414 100.0 29,001 100.0 127,471 100.0
5d. Making judgments about the value orsoundness of information, arguments, ormethods [ACCHALL]
EVALUATE Very little 53 12.8 3,942 13.6 17,859 14.0
Some 142 34.2 9,910 34.1 45,316 35.5
Quite a bit 141 34.0 9,791 33.7 42,212 33.1
Very much 79 19.0 5,424 18.7 22,223 17.4
Total 415 100.0 29,067 100.0 127,610 100.0
5e. Applying theories or concepts to practicalproblems or in new situations [ACCHALL]
APPLYING Very little 39 9.4 3,146 10.8 13,784 10.8
Some 138 33.3 9,553 32.8 43,207 33.8
Quite a bit 149 36.0 10,276 35.3 45,058 35.2
Very much 88 21.3 6,141 21.1 25,828 20.2
Total 414 100.0 29,116 100.0 127,877 100.0
5f. Using information you have read or heardto perform a new skill [ACCHALL]
PERFORM Very little 46 11.1 2,869 9.8 12,021 9.4
Some 133 32.0 8,483 29.0 38,114 29.7
Quite a bit 141 33.9 10,434 35.7 45,786 35.7
Very much 96 23.1 7,442 25.5 32,445 25.3
Total 416 100.0 29,228 100.0 128,366 100.0

page 15 - 14JUN13
* The comparison group and cohort columns on this page EXCLUDE your college.
Community College Survey of Student Engagement - Austin Community College (2013 Administration)
2013 Benchmark Frequency Distributions - Main Survey
Comparison Group: Extra-Large Colleges in the 2013 Cohort*
Breakout by Enrollment Status: Less Than Full-Time Students
[Unweighted]
Academic Challenge (ACCHALL)
Your College Ex-Large Colleges 2013 Cohort
Item Variable Responses Count Percent Count Percent Count Percent
Item 6: During the current school year, about how much reading and writing have you done at this college?
6a. Number of assigned textbooks, manuals,books, or book-length packs of coursereadings [ACCHALL]
READASGN None 23 5.7 1,000 3.5 4,581 3.6
1 to 4 206 50.6 14,104 48.7 62,830 49.4
5 to 10 107 26.3 7,628 26.4 32,730 25.7
11 to 20 44 10.8 3,562 12.3 15,190 11.9
More than 20 27 6.6 2,653 9.2 11,924 9.4
Total 407 100.0 28,947 100.0 127,255 100.0
6c. Number of written papers or reports ofany length [ACCHALL]
WRITEANY None 62 15.3 3,320 11.5 16,245 12.8
1 to 4 143 35.2 10,156 35.1 44,855 35.3
5 to 10 123 30.3 8,905 30.8 37,777 29.7
11 to 20 57 14.0 4,489 15.5 18,971 14.9
More than 20 21 5.2 2,050 7.1 9,289 7.3
Total 406 100.0 28,920 100.0 127,137 100.0
Item 7
7. Mark the response that best representsthe extent to which your examinations duringthe current school year have challenged youto do your best work at this college[ACCHALL]
EXAMS (1) Extremely easy 6 1.5 316 1.1 1,376 1.1
(2) 7 1.8 624 2.3 2,669 2.2
(3) 24 6.1 1,909 6.9 7,835 6.4
(4) 95 24.1 7,067 25.5 29,778 24.4
(5) 138 35.0 9,299 33.6 40,455 33.2
(6) 79 20.1 5,949 21.5 26,906 22.1
(7) Extremely challenging 45 11.4 2,550 9.2 12,791 10.5
Total 394 100.0 27,714 100.0 121,810 100.0
Item 9: How much does this college emphasize each of the following?
9a. Encouraging you to spend significantamounts of time studying [ACCHALL]
ENVSCHOL Very little 20 4.9 1,312 4.5 5,519 4.3
Some 105 25.7 6,658 23.0 28,698 22.6
Quite a bit 177 43.3 12,055 41.7 54,039 42.5
Very much 107 26.2 8,866 30.7 38,792 30.5
Total 409 100.0 28,891 100.0 127,048 100.0

page 16 - 14JUN13
* The comparison group and cohort columns on this page EXCLUDE your college.
Community College Survey of Student Engagement - Austin Community College (2013 Administration)
2013 Benchmark Frequency Distributions - Main Survey
Comparison Group: Extra-Large Colleges in the 2013 Cohort*
Breakout by Enrollment Status: Full-Time Students
[Unweighted]
Academic Challenge (ACCHALL)
Your College Ex-Large Colleges 2013 Cohort
Item Variable Responses Count Percent Count Percent Count Percent
Item 4: In your experiences at this college during the current school year, about how often have you done each of the following?
4p. Worked harder than you thought youcould to meet an instructor's standards orexpectations [ACCHALL]
WORKHARD Never 47 8.7 4,620 7.9 23,999 7.4
Sometimes 168 31.1 20,435 34.8 113,735 34.9
Often 208 38.5 22,096 37.6 123,073 37.7
Very often 117 21.7 11,631 19.8 65,485 20.1
Total 540 100.0 58,782 100.0 326,292 100.0
Item 5: During the current school year, how much has your coursework at this college emphasized the following mental activities?
5b. Analyzing the basic elements of an idea,experience, or theory [ACCHALL]
ANALYZE Very little 12 2.2 1,657 2.8 10,413 3.2
Some 112 20.8 13,111 22.3 79,090 24.2
Quite a bit 247 45.9 25,805 43.8 143,758 44.0
Very much 167 31.0 18,281 31.1 93,567 28.6
Total 538 100.0 58,854 100.0 326,828 100.0
5c. Synthesizing and organizing ideas,information, or experiences in new ways[ACCHALL]
SYNTHESZ Very little 26 4.8 2,992 5.1 16,544 5.1
Some 142 26.4 16,176 27.6 95,574 29.4
Quite a bit 230 42.8 23,595 40.3 131,027 40.3
Very much 139 25.9 15,802 27.0 82,282 25.3
Total 537 100.0 58,565 100.0 325,427 100.0
5d. Making judgments about the value orsoundness of information, arguments, ormethods [ACCHALL]
EVALUATE Very little 48 8.9 5,024 8.6 28,381 8.7
Some 161 29.8 18,070 30.8 106,247 32.6
Quite a bit 200 37.0 21,628 36.9 119,366 36.6
Very much 131 24.3 13,931 23.8 71,892 22.1
Total 540 100.0 58,653 100.0 325,886 100.0
5e. Applying theories or concepts to practicalproblems or in new situations [ACCHALL]
APPLYING Very little 35 6.5 4,127 7.0 22,653 6.9
Some 140 25.9 17,252 29.4 97,524 29.9
Quite a bit 204 37.8 21,931 37.3 122,820 37.6
Very much 161 29.8 15,416 26.3 83,314 25.5
Total 540 100.0 58,726 100.0 326,311 100.0
5f. Using information you have read or heardto perform a new skill [ACCHALL]
PERFORM Very little 39 7.2 4,056 6.9 19,867 6.1
Some 137 25.4 15,431 26.2 84,685 25.9
Quite a bit 190 35.2 21,539 36.5 121,758 37.2
Very much 174 32.2 17,910 30.4 101,108 30.9
Total 540 100.0 58,936 100.0 327,418 100.0

page 17 - 14JUN13
* The comparison group and cohort columns on this page EXCLUDE your college.
Community College Survey of Student Engagement - Austin Community College (2013 Administration)
2013 Benchmark Frequency Distributions - Main Survey
Comparison Group: Extra-Large Colleges in the 2013 Cohort*
Breakout by Enrollment Status: Full-Time Students
[Unweighted]
Academic Challenge (ACCHALL)
Your College Ex-Large Colleges 2013 Cohort
Item Variable Responses Count Percent Count Percent Count Percent
Item 6: During the current school year, about how much reading and writing have you done at this college?
6a. Number of assigned textbooks, manuals,books, or book-length packs of coursereadings [ACCHALL]
READASGN None 10 1.9 957 1.6 5,355 1.6
1 to 4 189 35.3 17,451 29.8 95,568 29.4
5 to 10 182 34.0 21,508 36.7 119,748 36.8
11 to 20 103 19.3 10,698 18.3 58,447 18.0
More than 20 51 9.5 7,961 13.6 45,986 14.1
Total 535 100.0 58,575 100.0 325,104 100.0
6c. Number of written papers or reports ofany length [ACCHALL]
WRITEANY None 25 4.7 1,813 3.1 12,832 3.9
1 to 4 117 21.9 13,639 23.3 79,982 24.6
5 to 10 193 36.1 20,724 35.4 112,041 34.5
11 to 20 131 24.5 14,062 24.0 74,987 23.1
More than 20 69 12.9 8,258 14.1 45,033 13.9
Total 535 100.0 58,496 100.0 324,875 100.0
Item 7
7. Mark the response that best representsthe extent to which your examinations duringthe current school year have challenged youto do your best work at this college[ACCHALL]
EXAMS (1) Extremely easy 4 0.8 431 0.8 2,299 0.7
(2) 18 3.5 1,050 1.9 5,329 1.7
(3) 28 5.5 3,236 5.7 16,483 5.3
(4) 106 20.7 13,426 23.9 71,559 22.8
(5) 191 37.3 20,420 36.3 111,452 35.5
(6) 133 26.0 12,809 22.8 74,489 23.7
(7) Extremely challenging 32 6.3 4,911 8.7 32,327 10.3
Total 512 100.0 56,283 100.0 313,938 100.0
Item 9: How much does this college emphasize each of the following?
9a. Encouraging you to spend significantamounts of time studying [ACCHALL]
ENVSCHOL Very little 12 2.2 2,187 3.7 10,961 3.4
Some 109 20.3 11,270 19.3 62,011 19.1
Quite a bit 223 41.6 24,233 41.4 135,885 41.8
Very much 192 35.8 20,823 35.6 116,108 35.7
Total 536 100.0 58,513 100.0 324,965 100.0

Community College Survey of Student EngagementAustin Community College (2013 Administration)
2013 Benchmark Bar Chart - Main SurveyComparison Group: Extra-Large Colleges in the 2013 Cohort*
Breakout by Enrollment Status[Unweighted]
Student-Faculty Interaction (STUFAC)
14JUN13
* The comparison group and cohort bars on this page INCLUDE your college.
Your College
Ex-Large Colleges
2013 Cohort
46.5 45.8 47.156.5 53.5 55.1
0.0
20.0
40.0
60.0
80.0
100.0
LessThan
Full-Time
Full-Time

If a row contains less than 50 respondents (please see Frequency Distribution that follows), interpret the comparison results cautiously.
** T-test: 2-tailed page 19 - 14JUN13
* The comparison group and cohort columns on this page EXCLUDE your college.
Community College Survey of Student Engagement - Austin Community College (2013 Administration)
2013 Benchmark Means Report - Main Survey
Comparison Group: Extra-Large Colleges in the 2013 Cohort*
Breakout by Enrollment Status
[Unweighted]
Student-Faculty Interaction (STUFAC)
YourCollege Ex-Large Colleges 2013 Cohort
Item Variable Breakout Group Mean MeanEffectSize** Mean
EffectSize**
Item 4: In your experiences at this college during the current school year, about how often have you done each of the following?
1 = Never, 2 = Sometimes, 3 = Often, 4 = Very often
4k. Used e-mail to communicate with an instructor[STUFAC]
EMAIL Less than full-time 2.73 2.75 2.74
Full-time 3.05 3.00 3.00
4l. Discussed grades or assignments with aninstructor [STUFAC]
FACGRADE Less than full-time 2.47 2.50 2.52
Full-time 2.71 2.67 2.71
4m. Talked about career plans with an instructor oradvisor [STUFAC]
FACPLANS Less than full-time 1.96 1.94 1.98
Full-time 2.24 2.17 2.25
4n. Discussed ideas from your readings or classeswith instructors outside of class [STUFAC]
FACIDEAS Less than full-time 1.74 1.68 1.70
Full-time 2.00 1.85 1.88
4o. Received prompt feedback (written or oral)from instructors on your performance [STUFAC]
FACFEED Less than full-time 2.81 2.65 2.68
Full-time 2.92 2.74 0.20** 2.76
4q. Worked with instructors on activities other thancoursework [STUFAC]
FACOTH Less than full-time 1.29 1.36 1.37
Full-time 1.46 1.50 1.54

page 20 - 14JUN13
* The comparison group and cohort columns on this page EXCLUDE your college.
Community College Survey of Student Engagement - Austin Community College (2013 Administration)
2013 Benchmark Frequency Distributions - Main Survey
Comparison Group: Extra-Large Colleges in the 2013 Cohort*
Breakout by Enrollment Status: Less Than Full-Time Students
[Unweighted]
Student-Faculty Interaction (STUFAC)
Your College Ex-Large Colleges 2013 Cohort
Item Variable Responses Count Percent Count Percent Count Percent
Item 4: In your experiences at this college during the current school year, about how often have you done each of the following?
4k. Used e-mail to communicate with aninstructor [STUFAC]
EMAIL Never 35 8.6 2,658 9.1 12,302 9.6
Sometimes 151 37.0 9,700 33.3 42,363 33.1
Often 113 27.7 8,990 30.9 39,380 30.8
Very often 109 26.7 7,790 26.7 33,818 26.4
Total 408 100.0 29,138 100.0 127,863 100.0
4l. Discussed grades or assignments with aninstructor [STUFAC]
FACGRADE Never 47 11.4 3,243 11.1 13,110 10.2
Sometimes 190 46.0 12,703 43.5 55,902 43.7
Often 109 26.4 8,497 29.1 38,154 29.8
Very often 67 16.2 4,731 16.2 20,844 16.3
Total 413 100.0 29,174 100.0 128,010 100.0
4m. Talked about career plans with aninstructor or advisor [STUFAC]
FACPLANS Never 142 34.2 10,149 34.9 41,647 32.6
Sometimes 174 41.9 12,589 43.2 56,215 44.0
Often 72 17.3 4,388 15.1 20,757 16.2
Very often 27 6.5 1,993 6.8 9,138 7.2
Total 415 100.0 29,119 100.0 127,757 100.0
4n. Discussed ideas from your readings orclasses with instructors outside of class[STUFAC]
FACIDEAS Never 198 48.1 14,823 51.0 63,398 49.7
Sometimes 148 35.9 9,947 34.2 44,956 35.3
Often 41 10.0 3,079 10.6 13,689 10.7
Very often 25 6.1 1,196 4.1 5,457 4.3
Total 412 100.0 29,045 100.0 127,500 100.0
4o. Received prompt feedback (written ororal) from instructors on your performance[STUFAC]
FACFEED Never 29 7.1 2,797 9.6 11,094 8.7
Sometimes 117 28.5 10,065 34.6 43,775 34.3
Often 165 40.2 10,803 37.1 48,456 37.9
Very often 99 24.1 5,458 18.7 24,461 19.1
Total 410 100.0 29,123 100.0 127,786 100.0
4q. Worked with instructors on activitiesother than coursework [STUFAC]
FACOTH Never 327 80.1 21,384 74.1 93,057 73.4
Sometimes 54 13.2 5,126 17.8 23,175 18.3
Often 17 4.2 1,674 5.8 7,638 6.0
Very often 10 2.5 666 2.3 2,890 2.3
Total 408 100.0 28,850 100.0 126,760 100.0

page 21 - 14JUN13
* The comparison group and cohort columns on this page EXCLUDE your college.
Community College Survey of Student Engagement - Austin Community College (2013 Administration)
2013 Benchmark Frequency Distributions - Main Survey
Comparison Group: Extra-Large Colleges in the 2013 Cohort*
Breakout by Enrollment Status: Full-Time Students
[Unweighted]
Student-Faculty Interaction (STUFAC)
Your College Ex-Large Colleges 2013 Cohort
Item Variable Responses Count Percent Count Percent Count Percent
Item 4: In your experiences at this college during the current school year, about how often have you done each of the following?
4k. Used e-mail to communicate with aninstructor [STUFAC]
EMAIL Never 14 2.6 2,540 4.3 15,848 4.9
Sometimes 140 25.8 15,607 26.6 84,958 26.0
Often 194 35.8 19,850 33.8 109,162 33.5
Very often 194 35.8 20,771 35.3 116,283 35.6
Total 542 100.0 58,768 100.0 326,251 100.0
4l. Discussed grades or assignments with aninstructor [STUFAC]
FACGRADE Never 42 7.8 4,429 7.5 20,641 6.3
Sometimes 198 36.7 23,081 39.2 125,142 38.3
Often 175 32.4 18,856 32.0 109,446 33.5
Very often 125 23.1 12,468 21.2 71,439 21.9
Total 540 100.0 58,834 100.0 326,668 100.0
4m. Talked about career plans with aninstructor or advisor [STUFAC]
FACPLANS Never 117 21.7 14,580 24.8 70,561 21.7
Sometimes 243 45.0 25,974 44.3 143,679 44.1
Often 116 21.5 11,846 20.2 72,460 22.2
Very often 64 11.9 6,276 10.7 39,168 12.0
Total 540 100.0 58,676 100.0 325,868 100.0
4n. Discussed ideas from your readings orclasses with instructors outside of class[STUFAC]
FACIDEAS Never 181 33.4 24,186 41.3 126,868 39.0
Sometimes 229 42.3 22,606 38.6 130,914 40.2
Often 85 15.7 8,133 13.9 46,980 14.4
Very often 47 8.7 3,684 6.3 20,715 6.4
Total 542 100.0 58,609 100.0 325,477 100.0
4o. Received prompt feedback (written ororal) from instructors on your performance[STUFAC]
FACFEED Never 25 4.6 3,754 6.4 18,760 5.8
Sometimes 136 25.1 19,530 33.3 107,732 33.1
Often 238 44.0 23,388 39.9 132,114 40.5
Very often 142 26.2 12,007 20.5 67,327 20.7
Total 541 100.0 58,679 100.0 325,933 100.0
4q. Worked with instructors on activitiesother than coursework [STUFAC]
FACOTH Never 359 67.2 38,040 65.3 201,910 62.4
Sometimes 122 22.8 13,360 22.9 81,066 25.0
Often 34 6.4 4,883 8.4 28,936 8.9
Very often 19 3.6 2,009 3.4 11,821 3.7
Total 534 100.0 58,292 100.0 323,733 100.0

Community College Survey of Student EngagementAustin Community College (2013 Administration)
2013 Benchmark Bar Chart - Main SurveyComparison Group: Extra-Large Colleges in the 2013 Cohort*
Breakout by Enrollment Status[Unweighted]
Support for Learners (SUPPORT)
14JUN13
* The comparison group and cohort bars on this page INCLUDE your college.
Your College
Ex-Large Colleges
2013 Cohort
47.4 47.3 48.5 51.9 51.6 53.1
0.0
20.0
40.0
60.0
80.0
100.0
LessThan
Full-Time
Full-Time

If a row contains less than 50 respondents (please see Frequency Distribution that follows), interpret the comparison results cautiously.
** T-test: 2-tailed page 23 - 14JUN13
* The comparison group and cohort columns on this page EXCLUDE your college.
Community College Survey of Student Engagement - Austin Community College (2013 Administration)
2013 Benchmark Means Report - Main Survey
Comparison Group: Extra-Large Colleges in the 2013 Cohort*
Breakout by Enrollment Status
[Unweighted]
Support for Learners (SUPPORT)
YourCollege Ex-Large Colleges 2013 Cohort
Item Variable Breakout Group Mean MeanEffectSize** Mean
EffectSize**
Item 9: How much does this college emphasize each of the following?
1 = Very little, 2 = Some, 3 = Quite a bit, 4 = Very much
9b. Providing the support you need to help yousucceed at this college [SUPPORT]
ENVSUPRT Less than full-time 2.98 2.95 2.98
Full-time 3.15 3.02 3.06
9c. Encouraging contact among students fromdifferent economic, social, and racial or ethnicbackgrounds [SUPPORT]
ENVDIVRS Less than full-time 2.53 2.57 2.53
Full-time 2.65 2.66 2.63
9d. Helping you cope with your non-academicresponsibilities (work, family, etc.) [SUPPORT]
ENVNACAD Less than full-time 1.91 1.93 1.94
Full-time 1.99 2.01 2.05
9e. Providing the support you need to thrivesocially [SUPPORT]
ENVSOCAL Less than full-time 2.08 2.14 2.15
Full-time 2.15 2.24 2.28
9f. Providing the financial support you need toafford your education [SUPPORT]
FINSUPP Less than full-time 2.38 2.43 2.48
Full-time 2.61 2.65 2.72
Item 13.1: How often do you use the following services at this college?
1 = Rarely/Never, 2 = Sometimes, 3 = Often (Don't know/N.A. category not included in means calculations)
13.1a. Academic advising/planning [SUPPORT] USEACAD Less than full-time 1.80 1.71 1.75
Full-time 1.88 1.81 1.86
13.1b. Career counseling [SUPPORT] USECACOU Less than full-time 1.52 1.43 1.42
Full-time 1.49 1.47 1.47

page 24 - 14JUN13
* The comparison group and cohort columns on this page EXCLUDE your college.
Community College Survey of Student Engagement - Austin Community College (2013 Administration)
2013 Benchmark Frequency Distributions - Main Survey
Comparison Group: Extra-Large Colleges in the 2013 Cohort*
Breakout by Enrollment Status: Less Than Full-Time Students
[Unweighted]
Support for Learners (SUPPORT)
Your College Ex-Large Colleges 2013 Cohort
Item Variable Responses Count Percent Count Percent Count Percent
Item 9: How much does this college emphasize each of the following?
9b. Providing the support you need to helpyou succeed at this college [SUPPORT]
ENVSUPRT Very little 20 4.9 1,641 5.7 6,667 5.3
Some 95 23.2 6,872 23.8 28,911 22.8
Quite a bit 167 40.8 11,643 40.4 51,900 40.9
Very much 127 31.1 8,673 30.1 39,325 31.0
Total 409 100.0 28,829 100.0 126,803 100.0
9c. Encouraging contact among studentsfrom different economic, social, and racial orethnic backgrounds [SUPPORT]
ENVDIVRS Very little 75 18.4 4,993 17.4 22,904 18.1
Some 133 32.7 8,828 30.7 40,083 31.8
Quite a bit 106 26.0 8,452 29.4 36,920 29.3
Very much 93 22.9 6,442 22.4 26,299 20.8
Total 407 100.0 28,715 100.0 126,206 100.0
9d. Helping you cope with yournon-academic responsibilities (work, family,etc.) [SUPPORT]
ENVNACAD Very little 171 42.0 12,057 42.0 51,734 41.0
Some 138 33.9 9,251 32.3 41,497 32.9
Quite a bit 62 15.2 4,743 16.5 21,025 16.7
Very much 36 8.8 2,629 9.2 11,876 9.4
Total 407 100.0 28,680 100.0 126,132 100.0
9e. Providing the support you need to thrivesocially [SUPPORT]
ENVSOCAL Very little 126 30.9 8,360 29.3 36,262 28.9
Some 161 39.5 10,848 38.0 48,013 38.3
Quite a bit 83 20.3 6,301 22.1 27,676 22.1
Very much 38 9.3 3,028 10.6 13,538 10.8
Total 408 100.0 28,537 100.0 125,489 100.0
9f. Providing the financial support you needto afford your education [SUPPORT]
FINSUPP Very little 109 26.7 7,669 26.8 31,191 24.8
Some 118 28.9 7,559 26.5 32,981 26.2
Quite a bit 97 23.8 6,862 24.0 31,601 25.1
Very much 84 20.6 6,481 22.7 29,924 23.8
Total 408 100.0 28,571 100.0 125,697 100.0
Item 13.1: How often do you use the following services at this college?
13.1a. Academic advising/planning[SUPPORT]
USEACAD Don't know/N.A. 23 5.6 2,523 9.0 11,089 8.9
Rarely/Never 143 34.8 10,654 37.8 44,091 35.5
Sometimes 179 43.6 11,704 41.5 53,181 42.8
Often 66 16.1 3,302 11.7 15,766 12.7
Total 411 100.0 28,183 100.0 124,127 100.0
13.1b. Career counseling [SUPPORT] USECACOU Don't know/N.A. 70 17.0 5,711 20.4 26,787 21.7
Rarely/Never 199 48.4 14,312 51.0 62,742 50.8
Sometimes 108 26.3 6,389 22.8 27,180 22.0
Often 34 8.3 1,634 5.8 6,735 5.5
Total 411 100.0 28,046 100.0 123,444 100.0

page 25 - 14JUN13
* The comparison group and cohort columns on this page EXCLUDE your college.
Community College Survey of Student Engagement - Austin Community College (2013 Administration)
2013 Benchmark Frequency Distributions - Main Survey
Comparison Group: Extra-Large Colleges in the 2013 Cohort*
Breakout by Enrollment Status: Full-Time Students
[Unweighted]
Support for Learners (SUPPORT)
Your College Ex-Large Colleges 2013 Cohort
Item Variable Responses Count Percent Count Percent Count Percent
Item 9: How much does this college emphasize each of the following?
9b. Providing the support you need to helpyou succeed at this college [SUPPORT]
ENVSUPRT Very little 14 2.6 2,892 5.0 14,276 4.4
Some 95 17.7 12,633 21.6 66,047 20.4
Quite a bit 223 41.6 23,080 39.5 129,722 40.0
Very much 204 38.1 19,818 33.9 114,408 35.3
Total 536 100.0 58,423 100.0 324,453 100.0
9c. Encouraging contact among studentsfrom different economic, social, and racial orethnic backgrounds [SUPPORT]
ENVDIVRS Very little 72 13.5 9,033 15.5 50,815 15.7
Some 179 33.5 16,572 28.4 96,959 30.0
Quite a bit 147 27.5 17,702 30.4 97,409 30.1
Very much 136 25.5 14,955 25.7 78,371 24.2
Total 534 100.0 58,262 100.0 323,554 100.0
9d. Helping you cope with yournon-academic responsibilities (work, family,etc.) [SUPPORT]
ENVNACAD Very little 208 39.2 22,372 38.4 117,051 36.2
Some 167 31.5 19,205 33.0 110,226 34.1
Quite a bit 107 20.2 10,408 17.9 60,487 18.7
Very much 49 9.2 6,278 10.8 35,880 11.1
Total 531 100.0 58,263 100.0 323,644 100.0
9e. Providing the support you need to thrivesocially [SUPPORT]
ENVSOCAL Very little 147 27.8 14,767 25.5 76,336 23.7
Some 216 40.8 21,842 37.7 122,608 38.0
Quite a bit 105 19.8 13,918 24.0 80,582 25.0
Very much 61 11.5 7,444 12.8 42,816 13.3
Total 529 100.0 57,971 100.0 322,342 100.0
9f. Providing the financial support you needto afford your education [SUPPORT]
FINSUPP Very little 104 19.6 11,642 20.0 55,139 17.1
Some 133 25.1 13,968 24.0 77,940 24.1
Quite a bit 158 29.8 15,435 26.6 91,042 28.2
Very much 135 25.5 17,071 29.4 99,029 30.6
Total 530 100.0 58,116 100.0 323,150 100.0
Item 13.1: How often do you use the following services at this college?
13.1a. Academic advising/planning[SUPPORT]
USEACAD Don't know/N.A. 19 3.6 3,262 5.7 17,392 5.5
Rarely/Never 166 31.5 19,111 33.3 97,471 30.6
Sometimes 238 45.2 25,954 45.3 148,473 46.6
Often 104 19.7 9,001 15.7 55,044 17.3
Total 527 100.0 57,328 100.0 318,380 100.0
13.1b. Career counseling [SUPPORT] USECACOU Don't know/N.A. 89 16.8 10,031 17.6 57,309 18.1
Rarely/Never 266 50.3 28,867 50.6 160,667 50.7
Sometimes 131 24.8 14,035 24.6 76,674 24.2
Often 43 8.1 4,080 7.2 22,090 7.0
Total 529 100.0 57,013 100.0 316,740 100.0