community development financial institutions
TRANSCRIPT
Community Development Financial Institutions
A Publication of the CDFI Data Project
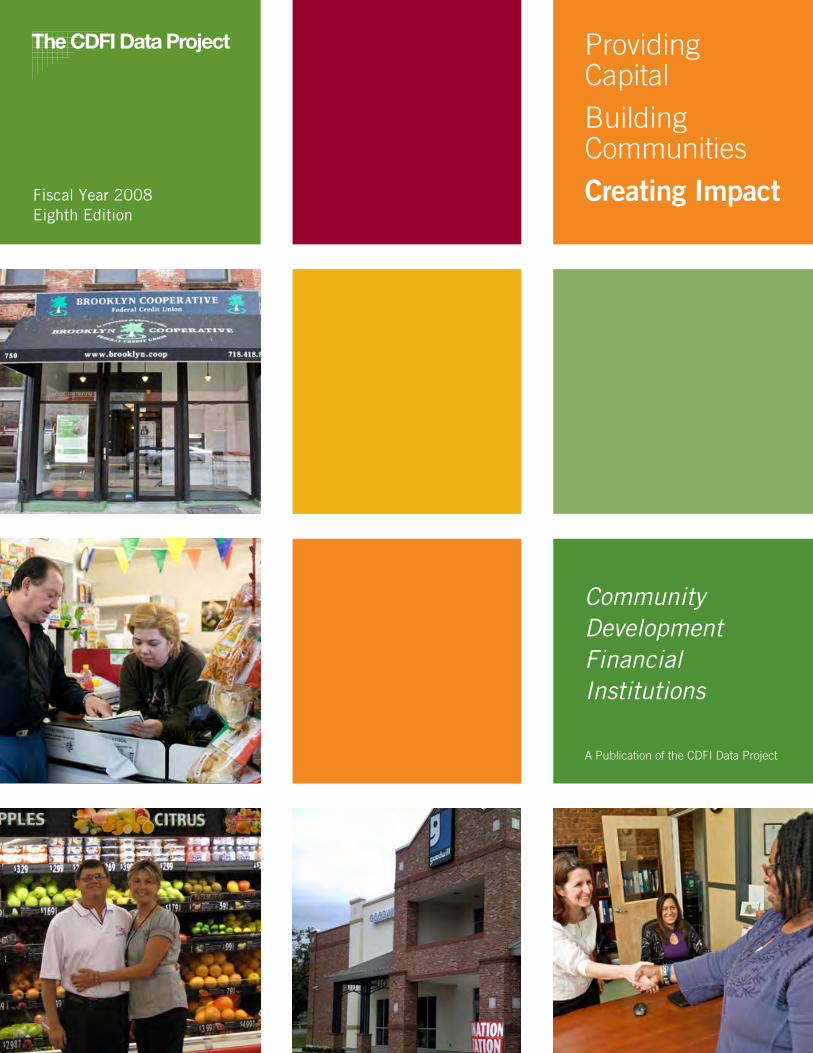
Fiscal Year 2008 Eighth Edition
Providing Capital
Building Communities
Creating Impact
This report is a product of the CDFI Data Project (CDP)—an industry collaborative that produces data about community development financial institutions (CDFIs).
The goal of the CDP is to ensure access to and use of data to improve practice and attract resources to the CDFI field. This issue of Community Development Financial Institutions: Providing Capital, Building Communities, Creating Impact analyzes fiscal year 2008 data collected through the CDP from 495 CDFIs.
The writers would like to thank the CDP Advisory Committee for its assistance and editorial guidance in this publication.
Mark Pinsky (Chair)Opportunity Finance Network
Kerwin Tesdell (Vice Chair)Community Development Venture Capital Alliance
Elaine EdgcombAspen Institute
Connie EvansAssociation for Enterprise Opportunity
Linda DavenportCoalition of Community Development Financial Institutions
Saurabh NarainNational Community Investment Fund
Clifford RosenthalNational Federation of Community Development Credit Unions
This publication and associated research were funded by the John D. and Catherine T. MacArthur Foundation. We thank them for their support but acknowledge that the findings and conclusions presented in this report are those of the author(s) alone, and do not necessarily reflect the opinions of these organizations.
CDFI Data Project Advisory Committee
Aspen Institute
National Federation of Community Development Credit Unions
National Community Investment Fund
Opportunity Finance Network
Written by the CDP Publication Committee
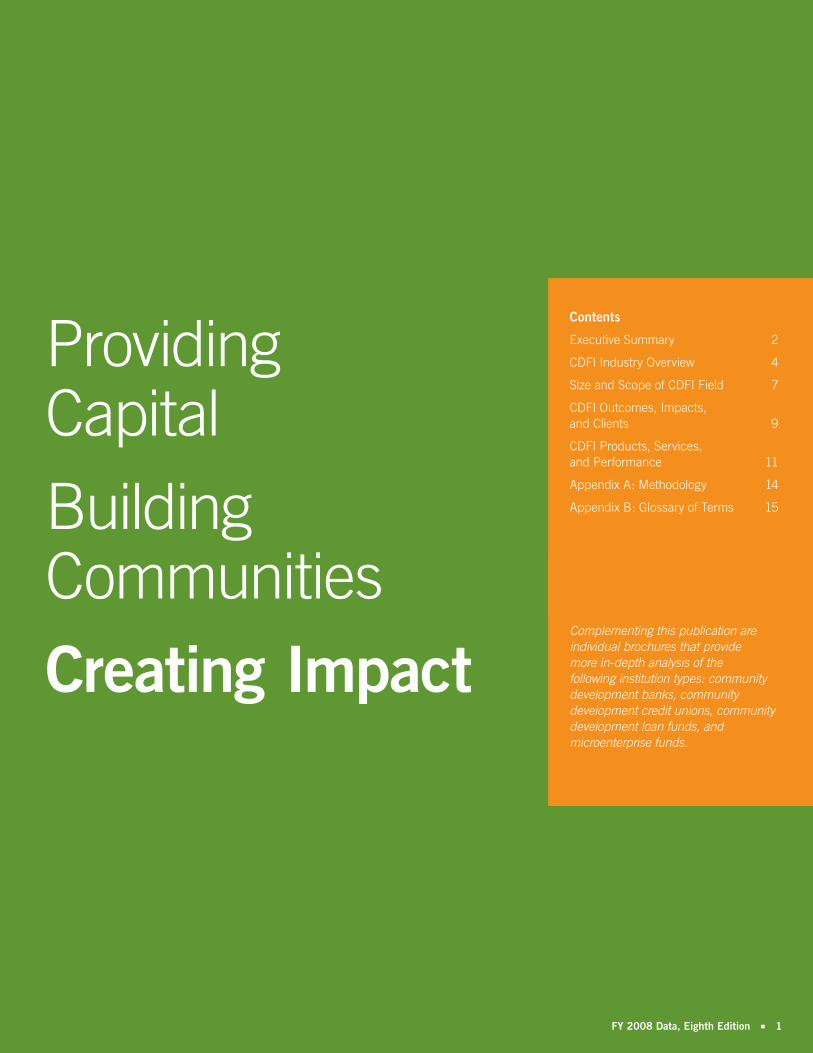
Contents
Executive Summary 2
CDFI Industry Overview 4
Size and Scope of CDFI Field 7
CDFI Outcomes, Impacts, and Clients 9
CDFI Products, Services, and Performance 11
Appendix A: Methodology 14
Appendix B: Glossary of Terms 15
Complementing this publication are individual brochures that provide more in-depth analysis of the following institution types: community development banks, community development credit unions, community development loan funds, and microenterprise funds.
Providing Capital
Building Communities
Creating Impact
FY 2008 Data, Eighth Edition n 1
Executive Summary
1 US Department of Labor, Bureau of Labor Statistics.2 Mortgage Bankers Association’s (MBA) National Delinquency Survey.3 Mortgage Bankers Association’s (MBA) National Delinquency Survey.4 Federal Deposit Insurance Corporation (FDIC) Quarterly Banking Profile5 Federal Deposit Insurance Corporation, December 2008.6 The CAGR is the rate at which an investment would have grown annually if it grew at a steady rate. We use the CAGR
rather than the actual annual growth to demonstrate trends in the data.
The year 2008 was a period of continued economic decline. The national unemployment rate rose from 5.0% in the fourth quarter of 2007 to 7.4% in the fourth quarter of 2008.1
The percentage of loans in the foreclosure process was 3.30%, 126 basis points higher than the end of fourth quarter 2007.2 The delinquency rate for loans on one-to-four-unit mortgages rose to a seasonally adjusted rate of 7.88%, up 206 basis points from fourth quarter 2007.3 The percentage of FDIC-insured institutions’ loans and leases 30 or more days past due was 4.94%, with the 90-day plus nonaccrual rate at its highest level since 1992.4 One out of every three FDIC-insured institutions reported a net loss in the fourth quarter.
The national economic downturn affected CDFI operations and lending in 2008, with delinquencies and charge-offs up from previous years; still, CDFIs ended the year in a strong position, with growth in assets and portfolios.
This study, which includes fiscal year (FY) 2008 data from 495 CDFIs, demonstrates the following:
CDFIs invested $5.53 billion in FY 2008 to create economic opportunity in the form of new jobs, affordable housing units, community facilities, and financial services to low-income and low-wealth people.
In FY 2008, CDFIs
financed and assisted businesses and •microenterprises that created or main-tained 35,624 jobs;
financed the construction or renovation •of 60,205 units of affordable housing;
provided 16,405 responsible mortgages •to first-time and other homebuyers.
CDFIs serve markets throughout the United States that are not adequately served by conventional financial markets. Such cus-tomers often cannot meet conventional financial institutions’ strict collateral or other underwriting requirements. This has been found to be even more true since the eco-nomic downturn and convential financial institutions’ pull back of lending throughout the country. Federal Reserve Chairman Ben S. Bernanke in a speech delivered at the Global Financial Literacy Summit, Washington, D.C. June 17, 2009 said, “Even as the capacity of CDFIs has become more constrained, economic conditions and pullbacks by mainstream lenders have increased the demands being placed on these organizations to provide credit and services.”
CDFIs help their customers build credit and join the economic mainstream. CDFIs have an impressive track record of prudently financing what conventional financial insti-tutions consider to be high-risk individuals and communities. CDFIs are adept at man-aging risks through a combination of solid capital structures and loan loss reserves, close monitoring of portfolios, and provision of technical assistance. In 2008, CDFIs in this study had a net charge-off rate of 0.75%, which compares favorably to the net charge-off rate of 1.28%5 for all insured financial institutions. Delinquency rates are also relatively low: CDFI banks and loan funds had 90 day plus delinquency rates of 0.4% and 4.4%, respectively; credit unions, which measure delinquency at 60 days rather than 90 days, had a 60-day delin-quency rate of 2.3%.
CDFIs continued to grow individually and as an industry in spite of changes in the market. The 495 CDFIs in this study held more than $29.4 billion in assets and $20.4 billion in direct financing out-standing as of fiscal year-end (FYE) 2008. For the 353 CDFIs for which we have five years of data, financing outstanding grew at a compound annual growth rate (CAGR) of 11% per year.6
2 n FY 2008 Data, Eighth Edition
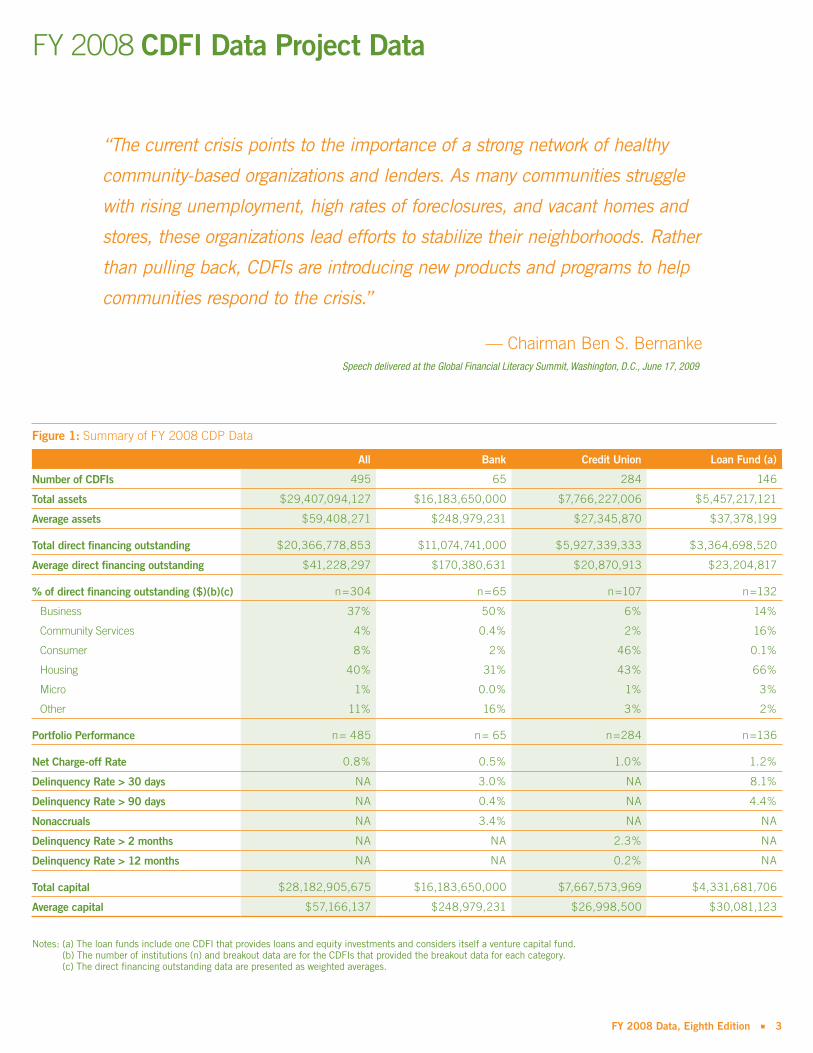
Figure 1: Summary of FY 2008 CDP Data
All Bank Credit Union Loan Fund (a)
Number of CDFIs 495 65 284 146
Total assets $29,407,094,127 $16,183,650,000 $7,766,227,006 $5,457,217,121
Average assets $59,408,271 $248,979,231 $27,345,870 $37,378,199
Total direct financing outstanding $20,366,778,853 $11,074,741,000 $5,927,339,333 $3,364,698,520
Average direct financing outstanding $41,228,297 $170,380,631 $20,870,913 $23,204,817
% of direct financing outstanding ($)(b)(c) n=304 n=65 n=107 n=132
Business 37% 50% 6% 14%
Community Services 4% 0.4% 2% 16%
Consumer 8% 2% 46% 0.1%
Housing 40% 31% 43% 66%
Micro 1% 0.0% 1% 3%
Other 11% 16% 3% 2%
Portfolio Performance n= 485 n= 65 n=284 n=136
Net Charge-off Rate 0.8% 0.5% 1.0% 1.2%
Delinquency Rate > 30 days NA 3.0% NA 8.1%
Delinquency Rate > 90 days NA 0.4% NA 4.4%
Nonaccruals NA 3.4% NA NA
Delinquency Rate > 2 months NA NA 2.3% NA
Delinquency Rate > 12 months NA NA 0.2% NA
Total capital $28,182,905,675 $16,183,650,000 $7,667,573,969 $4,331,681,706
Average capital $57,166,137 $248,979,231 $26,998,500 $30,081,123
Notes: (a) The loan funds include one CDFI that provides loans and equity investments and considers itself a venture capital fund. (b) The number of institutions (n) and breakout data are for the CDFIs that provided the breakout data for each category. (c) The direct financing outstanding data are presented as weighted averages.
FY 2008 CDFI Data Project Data
“The current crisis points to the importance of a strong network of healthy
community-based organizations and lenders. As many communities struggle
with rising unemployment, high rates of foreclosures, and vacant homes and
stores, these organizations lead efforts to stabilize their neighborhoods. Rather
than pulling back, CDFIs are introducing new products and programs to help
communities respond to the crisis.”
— Chairman Ben S. BernankeSpeech delivered at the Global Financial Literacy Summit, Washington, D.C., June 17, 2009
FY 2008 Data, Eighth Edition n 3
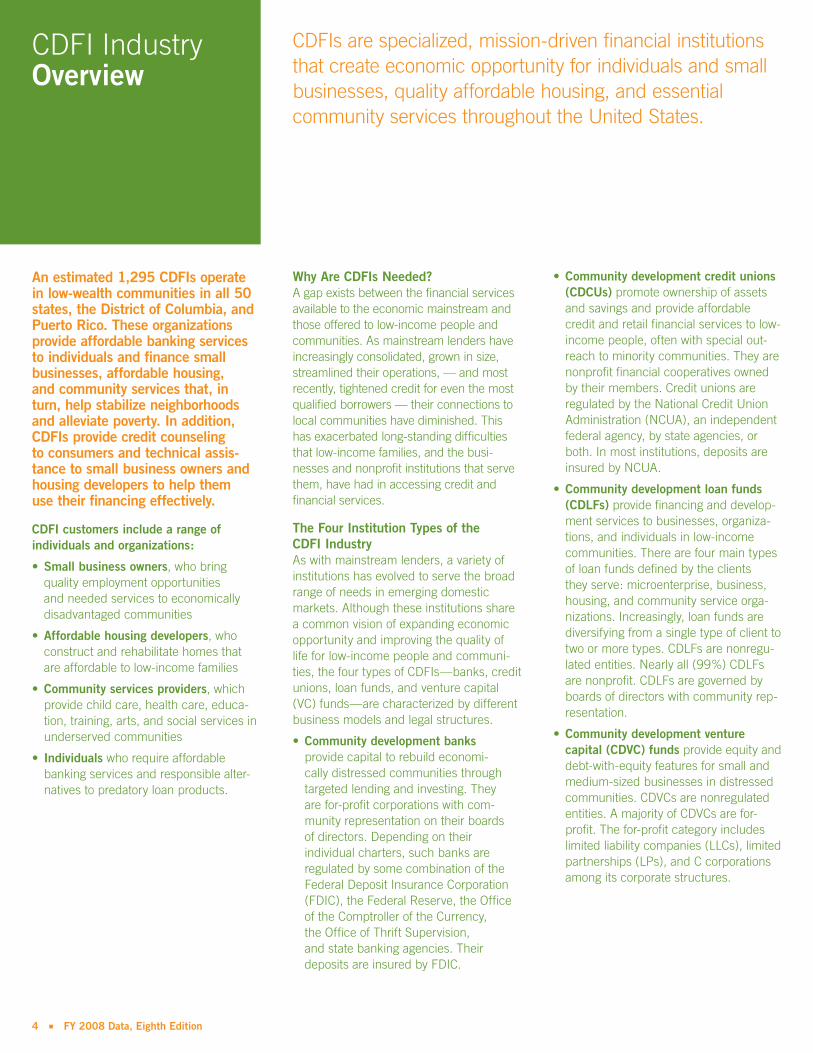
CDFI Industry Overview
CDFIs are specialized, mission-driven financial institutions that create economic opportunity for individuals and small businesses, quality affordable housing, and essential community services throughout the United States.
An estimated 1,295 CDFIs operate in low-wealth communities in all 50 states, the District of Columbia, and Puerto Rico. These organizations provide affordable banking services to individuals and finance small businesses, affordable housing, and community services that, in turn, help stabilize neighborhoods and alleviate poverty. In addition, CDFIs provide credit counseling to consumers and technical assis-tance to small business owners and housing developers to help them use their financing effectively.
CDFI customers include a range of individuals and organizations:
Small business owners• , who bring quality employment opportunities and needed services to economically disadvantaged communities
Affordable housing developers• , who construct and rehabilitate homes that are affordable to low-income families
Community services providers• , which provide child care, health care, educa-tion, training, arts, and social services in underserved communities
Individuals• who require affordable banking services and responsible alter-natives to predatory loan products.
Why Are CDFIs Needed?A gap exists between the financial services available to the economic mainstream and those offered to low-income people and communities. As mainstream lenders have increasingly consolidated, grown in size, streamlined their operations, — and most recently, tightened credit for even the most qualified borrowers — their connections to local communities have diminished. This has exacerbated long-standing difficulties that low-income families, and the busi-nesses and nonprofit institutions that serve them, have had in accessing credit and financial services.
The Four Institution Types of the CDFI IndustryAs with mainstream lenders, a variety of institutions has evolved to serve the broad range of needs in emerging domestic markets. Although these institutions share a common vision of expanding economic opportunity and improving the quality of life for low-income people and communi-ties, the four types of CDFIs—banks, credit unions, loan funds, and venture capital (VC) funds—are characterized by different business models and legal structures.
Community development banks• provide capital to rebuild economi-cally distressed communities through targeted lending and investing. They are for-profit corporations with com-munity representation on their boards of directors. Depending on their individual charters, such banks are regulated by some combination of the Federal Deposit Insurance Corporation (FDIC), the Federal Reserve, the Office of the Comptroller of the Currency, the Office of Thrift Supervision, and state banking agencies. Their deposits are insured by FDIC.
Community development credit unions •(CDCUs) promote ownership of assets and savings and provide affordable credit and retail financial services to low-income people, often with special out-reach to minority communities. They are nonprofit financial cooperatives owned by their members. Credit unions are regulated by the National Credit Union Administration (NCUA), an independent federal agency, by state agencies, or both. In most institutions, deposits are insured by NCUA.
Community development loan funds •(CDLFs) provide financing and develop-ment services to businesses, organiza-tions, and individuals in low-income communities. There are four main types of loan funds defined by the clients they serve: microenterprise, business, housing, and community service orga-nizations. Increasingly, loan funds are diversifying from a single type of client to two or more types. CDLFs are nonregu-lated entities. Nearly all (99%) CDLFs are nonprofit. CDLFs are governed by boards of directors with community rep-resentation.
Community development venture •capital (CDVC) funds provide equity and debt-with-equity features for small and medium-sized businesses in distressed communities. CDVCs are nonregulated entities. A majority of CDVCs are for-profit. The for-profit category includes limited liability companies (LLCs), limited partnerships (LPs), and C corporations among its corporate structures.
4 n FY 2008 Data, Eighth Edition
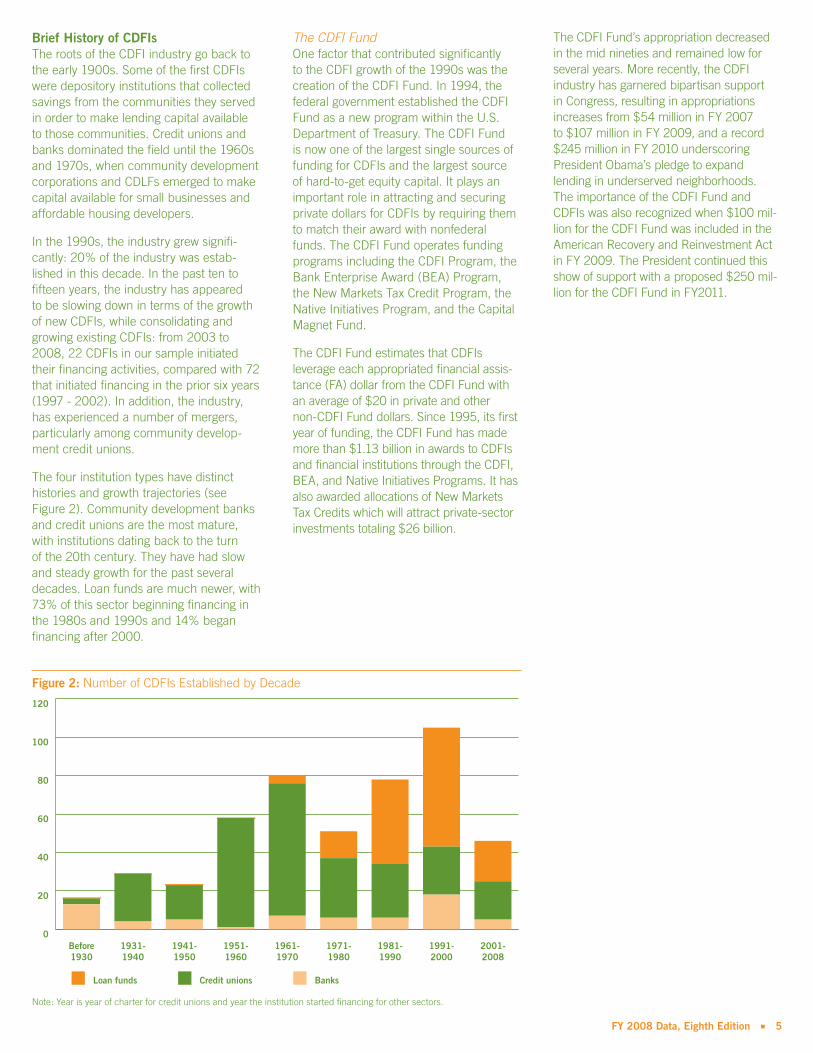
Brief History of CDFIsThe roots of the CDFI industry go back to the early 1900s. Some of the first CDFIs were depository institutions that collected savings from the communities they served in order to make lending capital available to those communities. Credit unions and banks dominated the field until the 1960s and 1970s, when community development corporations and CDLFs emerged to make capital available for small businesses and affordable housing developers.
In the 1990s, the industry grew signifi-cantly: 20% of the industry was estab-lished in this decade. In the past ten to fifteen years, the industry has appeared to be slowing down in terms of the growth of new CDFIs, while consolidating and growing existing CDFIs: from 2003 to 2008, 22 CDFIs in our sample initiated their financing activities, compared with 72 that initiated financing in the prior six years (1997 - 2002). In addition, the industry, has experienced a number of mergers, particularly among community develop-ment credit unions.
The four institution types have distinct histories and growth trajectories (see Figure 2). Community development banks and credit unions are the most mature, with institutions dating back to the turn of the 20th century. They have had slow and steady growth for the past several decades. Loan funds are much newer, with 73% of this sector beginning financing in the 1980s and 1990s and 14% began financing after 2000.
The CDFI Fund One factor that contributed significantly to the CDFI growth of the 1990s was the creation of the CDFI Fund. In 1994, the federal government established the CDFI Fund as a new program within the U.S. Department of Treasury. The CDFI Fund is now one of the largest single sources of funding for CDFIs and the largest source of hard-to-get equity capital. It plays an important role in attracting and securing private dollars for CDFIs by requiring them to match their award with nonfederal funds. The CDFI Fund operates funding programs including the CDFI Program, the Bank Enterprise Award (BEA) Program, the New Markets Tax Credit Program, the Native Initiatives Program, and the Capital Magnet Fund.
The CDFI Fund estimates that CDFIs leverage each appropriated financial assis-tance (FA) dollar from the CDFI Fund with an average of $20 in private and other non-CDFI Fund dollars. Since 1995, its first year of funding, the CDFI Fund has made more than $1.13 billion in awards to CDFIs and financial institutions through the CDFI, BEA, and Native Initiatives Programs. It has also awarded allocations of New Markets Tax Credits which will attract private-sector investments totaling $26 billion.
The CDFI Fund’s appropriation decreased in the mid nineties and remained low for several years. More recently, the CDFI industry has garnered bipartisan support in Congress, resulting in appropriations increases from $54 million in FY 2007 to $107 million in FY 2009, and a record $245 million in FY 2010 underscoring President Obama’s pledge to expand lending in underserved neighborhoods. The importance of the CDFI Fund and CDFIs was also recognized when $100 mil-lion for the CDFI Fund was included in the American Recovery and Reinvestment Act in FY 2009. The President continued this show of support with a proposed $250 mil-lion for the CDFI Fund in FY2011.
0
20
40
60
80
100
120Loan funds
Credit unions
Banks
2001-2008
1991-2000
1981-1990
1971-1980
1961-1970
1951-1960
1941-1950
1931-1940
Before1930
Loan funds Credit unions Banks
Figure 2: Number of CDFIs Established by Decade
Note: Year is year of charter for credit unions and year the institution started financing for other sectors.
FY 2008 Data, Eighth Edition n 5

Community Reinvestment ActIn addition to the CDFI Fund, the federal government strengthened provisions and enforcement of the Community Reinvestment Act (CRA) during the 1990s.7 In particular, the 1995 CRA regulations, which classified loans and investments in CDFIs as qualifying CRA activity, led to an increase in those activities. These regulations have led to the growth of banks as a critical source of capital for CDFIs. While some have implied that the thirty-year-old CRA is responsible for the 2007 mortgage meltdown, there has been a great deal of high level support for the Act. Federal Reserve Governor Elizabeth A. Duke said on February 24, 2009, “One widely held misperception is that CRA is only about mortgage lending to low- and moderate-income borrowers in lower-income neighborhoods. As a former community banker, I know that CRA’s
impact is just as important in meeting the needs of small farms and businesses and, as such, it serves as a valuable catalyst for job creation in both urban and rural areas across the country.“
Native CDFIsA range of CDFIs has emerged to serve the needs of Native populations. Serving these communities entails unique challenges because of the concentration of poverty in reservation-based economies and the exis-tence of independent tribal governments, among other reasons. As of June 30, 2010 there were 57 certified Native CDFIs, up from nine in 2001. Of those CDFIs, 41 are loan funds, eight are credit unions, six are banks (including one depository institu-tion holding company); the institution type of two is unknown.8 There are also many emerging Native CDFIs that are not yet certified. Unlike the growth of the CDFI
industry, in which the first CDFIs were depositories, the Native CDFI sector began primarily with loan funds, followed by credit unions.
The CDFI Fund has helped this segment of the industry grow by providing targeted funding for Native CDFIs. Since 2002, the CDFI Fund has made 213 awards totaling $42.6 million through its various funding programs benefiting Native communities. In addition, the CDFI Fund has awarded over $8.5 million in contracts to orga-nizations that provide capacity-building and financial services training programs focused on Native communities.
7 The Community Reinvestment Act of 1977 places responsibilities on depository institutions to lend to, invest in, and serve all of the communities in which they receive deposits from customers.
8 CDFI Fund;
Broadway Federal Bank (Broadway Federal) has a long history of commitment to reinvestment in the community. Programs that promote the economic revitalization and growth of communities and the markets we serve are a priority. Economic assistance from Broadway Federal has helped improve neighborhoods, provide seed money for small business owners, and enable countless numbers of people to purchase their first home. One example of this support was providing a $600,000 line of credit facility and $160,000 overdraft protection for payroll for New Designs Charter School, one of the fastest growing charter schools in southern California.
Founded in 2002, New Designs Charter School is a Los Angeles Unified School Dis-trict approved charter school located in the heart of the Crenshaw District in Los Angeles, CA. From the commencement of operations, New Designs has been an academic forerun-ner in the community, securing national rec-ognition for its high test scores and innovative educational programs. The school continues to make strides in academics, community outreach, and the overall enrichment of the families that it serves. The credit facilities from Broadway Federal allowed New Designs to:
purchase equipment, computers and •textbooks
increase student enrollment from 300-600 •students in the 6th –11th grade
cover payroll•
better manage cash-flow gaps caused by •fluctuations in student enrollments and state funding cycles, and
accommodate the year long academic and •enrichment activities of the school
Broadway Federal proudly celebrates its 64-year history as the oldest African-American managed community savings bank west of the Mississippi River. The bank provides financial products and services to primarily African-American and Hispanic residents in Los Angeles County. As a CDFI, the bank provides a unique set of primary products including savings and checking accounts, and single and multi-family residential, commercial real estate and small business loans, with specific expertise in funding churches, non-profits and charter schools. Each year, on average 70% of the number of loans and 72% of the dollar volume of loans go to support the financial needs of underserved minority populations.
Charter School Financing Los Angeles, CA
Featuring Broadway Federal Bank
6 n FY 2008 Data, Eighth Edition
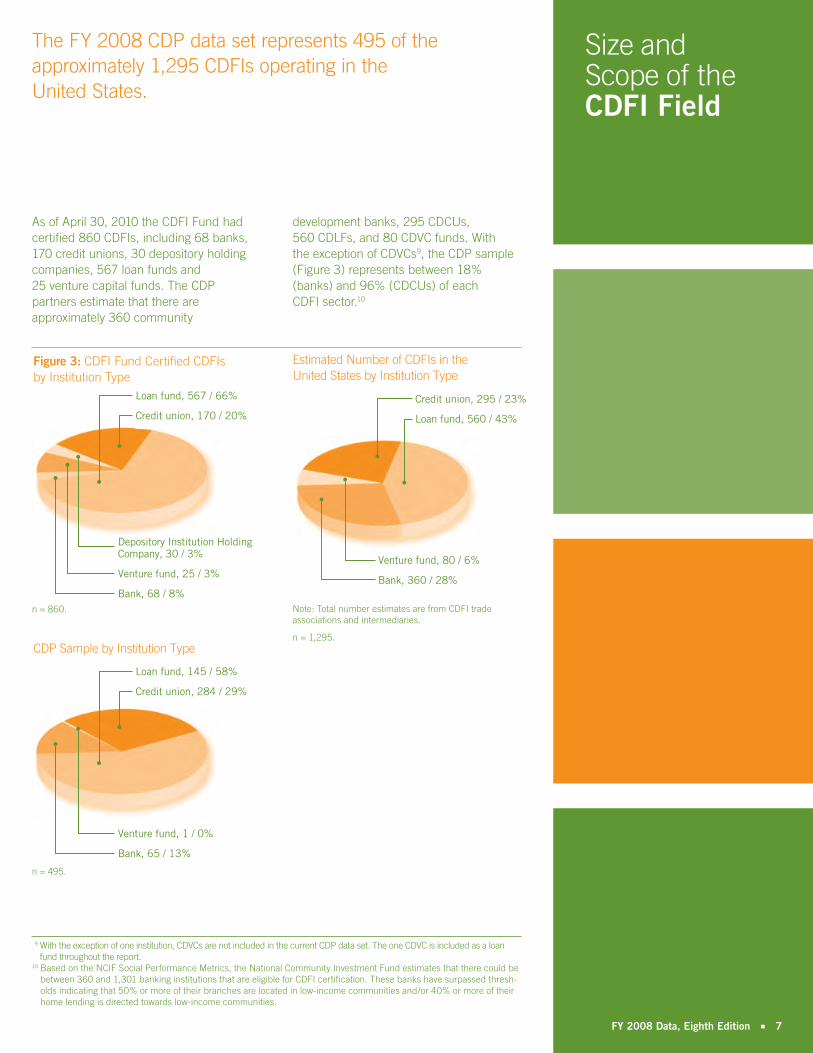
As of April 30, 2010 the CDFI Fund had certified 860 CDFIs, including 68 banks, 170 credit unions, 30 depository holding companies, 567 loan funds and 25 venture capital funds. The CDP partners estimate that there are approximately 360 community
development banks, 295 CDCUs, 560 CDLFs, and 80 CDVC funds. With the exception of CDVCs9, the CDP sample (Figure 3) represents between 18% (banks) and 96% (CDCUs) of each CDFI sector.10
9 With the exception of one institution, CDVCs are not included in the current CDP data set. The one CDVC is included as a loan fund throughout the report.
10 Based on the NCIF Social Performance Metrics, the National Community Investment Fund estimates that there could be between 360 and 1,301 banking institutions that are eligible for CDFI certification. These banks have surpassed thresh-olds indicating that 50% or more of their branches are located in low-income communities and/or 40% or more of their home lending is directed towards low-income communities.
Size and Scope of the CDFI Field
The FY 2008 CDP data set represents 495 of the approximately 1,295 CDFIs operating in the United States.
Figure 3: CDFI Fund Certified CDFIs by Institution Type
Loan fund, 567 / 66%
Credit union, 170 / 20%
Depository Institution Holding Company, 30 / 3%
Venture fund, 25 / 3%
Bank, 68 / 8%n = 860.
CDP Sample by Institution Type
Loan fund, 145 / 58%
Credit union, 284 / 29%
Venture fund, 1 / 0%
Bank, 65 / 13%
n = 495.
Estimated Number of CDFIs in the United States by Institution Type
Note: Total number estimates are from CDFI trade associations and intermediaries.
Credit union, 295 / 23%
Loan fund, 560 / 43%
Venture fund, 80 / 6%
Bank, 360 / 28%
n = 1,295.
FY 2008 Data, Eighth Edition n 7
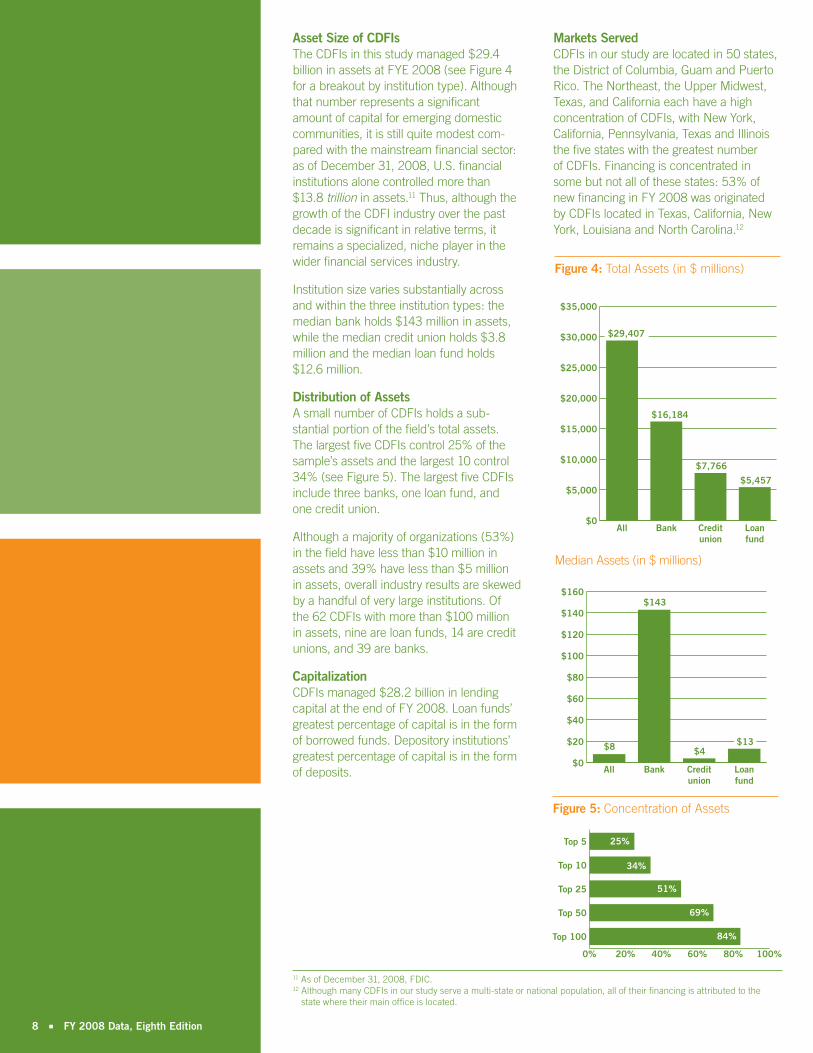
Asset Size of CDFIsThe CDFIs in this study managed $29.4 billion in assets at FYE 2008 (see Figure 4 for a breakout by institution type). Although that number represents a significant amount of capital for emerging domestic communities, it is still quite modest com-pared with the mainstream financial sector: as of December 31, 2008, U.S. financial institutions alone controlled more than $13.8 trillion in assets.11 Thus, although the growth of the CDFI industry over the past decade is significant in relative terms, it remains a specialized, niche player in the wider financial services industry.
Institution size varies substantially across and within the three institution types: the median bank holds $143 million in assets, while the median credit union holds $3.8 million and the median loan fund holds $12.6 million.
Distribution of Assets A small number of CDFIs holds a sub-stantial portion of the field’s total assets. The largest five CDFIs control 25% of the sample’s assets and the largest 10 control 34% (see Figure 5). The largest five CDFIs include three banks, one loan fund, and one credit union.
Although a majority of organizations (53%) in the field have less than $10 million in assets and 39% have less than $5 million in assets, overall industry results are skewed by a handful of very large institutions. Of the 62 CDFIs with more than $100 million in assets, nine are loan funds, 14 are credit unions, and 39 are banks.
Capitalization CDFIs managed $28.2 billion in lending capital at the end of FY 2008. Loan funds’ greatest percentage of capital is in the form of borrowed funds. Depository institutions’ greatest percentage of capital is in the form of deposits.
Markets Served CDFIs in our study are located in 50 states, the District of Columbia, Guam and Puerto Rico. The Northeast, the Upper Midwest, Texas, and California each have a high concentration of CDFIs, with New York, California, Pennsylvania, Texas and Illinois the five states with the greatest number of CDFIs. Financing is concentrated in some but not all of these states: 53% of new financing in FY 2008 was originated by CDFIs located in Texas, California, New York, Louisiana and North Carolina.12
11 As of December 31, 2008, FDIC.12 Although many CDFIs in our study serve a multi-state or national population, all of their financing is attributed to the
state where their main office is located.
$0
$5,000
$10,000
$15,000
$20,000
$25,000
$30,000
$35,000
Loanfund
Creditunion
BankAll
$29,407
$16,184
$7,766
$5,457
Figure 4: Total Assets (in $ millions)
$0
$20
$40
$60
$80
$100
$120
$140
$160
Loanfund
Creditunion
BankAll
$8 $4$13
$143
Median Assets (in $ millions)
Figure 5: Concentration of Assets
0% 20% 40% 60% 80% 100%
Top 100
Top 50
Top 25
Top 10
Top 5 25%
34%
51%
69%
84%
8 n FY 2008 Data, Eighth Edition
CDFI Outcomes
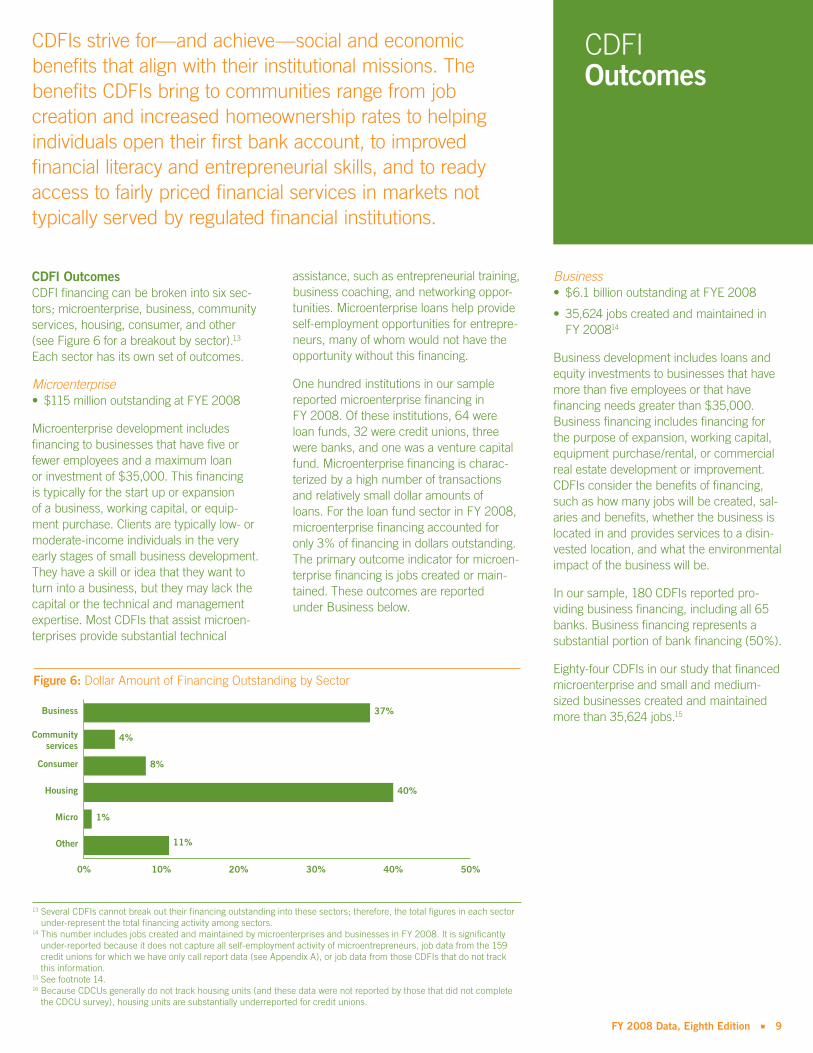
CDFI OutcomesCDFI financing can be broken into six sec-tors; microenterprise, business, community services, housing, consumer, and other (see Figure 6 for a breakout by sector).13 Each sector has its own set of outcomes.
Microenterprise$115 million outstanding at FYE 2008•
Microenterprise development includes financing to businesses that have five or fewer employees and a maximum loan or investment of $35,000. This financing is typically for the start up or expansion of a business, working capital, or equip-ment purchase. Clients are typically low- or moderate-income individuals in the very early stages of small business development. They have a skill or idea that they want to turn into a business, but they may lack the capital or the technical and management expertise. Most CDFIs that assist microen-terprises provide substantial technical
assistance, such as entrepreneurial training, business coaching, and networking oppor-tunities. Microenterprise loans help provide self-employment opportunities for entrepre-neurs, many of whom would not have the opportunity without this financing.
One hundred institutions in our sample reported microenterprise financing in FY 2008. Of these institutions, 64 were loan funds, 32 were credit unions, three were banks, and one was a venture capital fund. Microenterprise financing is charac-terized by a high number of transactions and relatively small dollar amounts of loans. For the loan fund sector in FY 2008, microenterprise financing accounted for only 3% of financing in dollars outstanding. The primary outcome indicator for microen-terprise financing is jobs created or main-tained. These outcomes are reported under Business below.
Business $6.1 billion outstanding at FYE 2008•
35,624 jobs created and maintained in •FY 200814
Business development includes loans and equity investments to businesses that have more than five employees or that have financing needs greater than $35,000. Business financing includes financing for the purpose of expansion, working capital, equipment purchase/rental, or commercial real estate development or improvement. CDFIs consider the benefits of financing, such as how many jobs will be created, sal-aries and benefits, whether the business is located in and provides services to a disin-vested location, and what the environmental impact of the business will be.
In our sample, 180 CDFIs reported pro-viding business financing, including all 65 banks. Business financing represents a substantial portion of bank financing (50%).
Eighty-four CDFIs in our study that financed microenterprise and small and medium-sized businesses created and maintained more than 35,624 jobs.15
CDFIs strive for—and achieve—social and economic benefits that align with their institutional missions. The benefits CDFIs bring to communities range from job creation and increased homeownership rates to helping individuals open their first bank account, to improved financial literacy and entrepreneurial skills, and to ready access to fairly priced financial services in markets not typically served by regulated financial institutions.
0% 10% 20% 30% 40% 50%
Other
Micro
Housing
Consumer
Communityservices
Business 37%
4%
8%
40%
1%
11%
13%
Figure 6: Dollar Amount of Financing Outstanding by Sector
13 Several CDFIs cannot break out their financing outstanding into these sectors; therefore, the total figures in each sector under-represent the total financing activity among sectors.
14 This number includes jobs created and maintained by microenterprises and businesses in FY 2008. It is significantly under-reported because it does not capture all self-employment activity of microentrepreneurs, job data from the 159 credit unions for which we have only call report data (see Appendix A), or job data from those CDFIs that do not track this information.
15 See footnote 14.16 Because CDCUs generally do not track housing units (and these data were not reported by those that did not complete
the CDCU survey), housing units are substantially underreported for credit unions.
FY 2008 Data, Eighth Edition n 9
Housing $6.6 billion outstanding at FYE 2008•
60,205 housing units assisted in •FY 200816
16,405 mortgages financed in FY 2008•
Housing financing among CDFIs includes two subcategories: financing to housing developers and direct mortgage lending to low-income individuals. CDFIs make loans to housing developers for predevelop-ment, acquisition, construction, renovation, working capital, and mortgages. These loans support the development of rental housing, service-enriched housing, tran-sitional housing, and residential housing. With a rapidly shrinking supply of afford-able housing to low-income families in both the rental and ownership markets, this effort addresses a critical need in many communities. Eighty-eight CDFIs reported facilitating the construction or renovation of 60,205 units of affordable housing in 2008, with 97% of the activity reported by loan funds. These affordable housing units typically provide for monthly payments that are less than 30% of a household’s monthly income thereby enabling low-income indi-viduals to own or rent quality housing while preserving sufficient income to pay for other critical needs.
CDFIs also provide loans to low-income families who cannot qualify for a mortgage from the mainstream financial sector. One hundred and fifty two CDFIs reported pro-viding 16,405 mortgages in FY 2008. Many CDFIs providing direct mortgage financing also offer homeownership counseling or other services.
Housing financing accounts for 40% of the sample’s total dollar amount of financing outstanding. Banks, credit unions, and loan funds all provide substantial amounts of housing financing. Of the top 10 CDFIs to report financing outstanding for housing, six were banks, three were loan funds, and one was a credit union. Credit unions pri-marily provide mortgage loans to individuals and loan funds primarily provide loans to housing developers.
Community Services$609 million outstanding at FYE 2008•
CDFIs supply financing to community services—human and social service agen-cies, advocacy organizations, cultural facilities, religious organizations, health care providers, child care centers, and education providers—that offer critical and much-needed services to low-income people and communities. Many community services CDFIs have one or more niche markets in which they operate. This expertise enables them to provide critical advice on issues affecting the particular industry. Their bor-rowers, primarily nonprofit organizations, often require some form of technical assis-tance, such as cash flow forecasting or assistance in securing other funds.
Seventy-seven CDFIs in our sample reported providing community services financing, with a large majority (62) being loan funds. Community services financing accounted for 4% of all CDFI financing outstanding in FY 2008. Many CDFIs are also using the CDFI Fund’s New Markets Tax Credit Program to finance charter schools and other community facilities; this financing is not included in these numbers.
Consumer $1.3 billion outstanding at FYE 2008•
Consumer finance includes all personal loans for health, education, emergency, debt-consolidation, transportation, and other consumer purposes. In many low-income communities, such services are provided not by mainstream lenders but by institutions that specialize in check cashing, payday lending, and wire transfers at predatory rates. CDFIs also provide nonfinancial consumer services, such as financial literacy training or programs that encourage savings.
Almost all of the credit unions (85%) and banks (95%) as well as eleven loan funds reported providing consumer financing. Similar to microenterprise financing, con-sumer financing is characterized by a high number of transactions and relatively small dollar amounts of loans. The consumer financing sector accounts for only 8% of the dollar amount of transactions. Many of these loans are to people who have not previously had a relationship with a financial institution and who do not have a credit history.
16 Because CDCUs generally do not track housing units (and these data were not reported from those that did not complete the CDCU survey), housing units are substantially underreported for credit unions. 10 n FY 2008 Data, Eighth Edition
CDFI Products, Services, and Performance
17 Net loan loss rate is the net charge-offs during FY 2008/total loans outstanding at FYE 2008.
Most CDFIs have strong market knowledge and long-term relation-ships with clients, which help them develop the right mix of products for their markets.
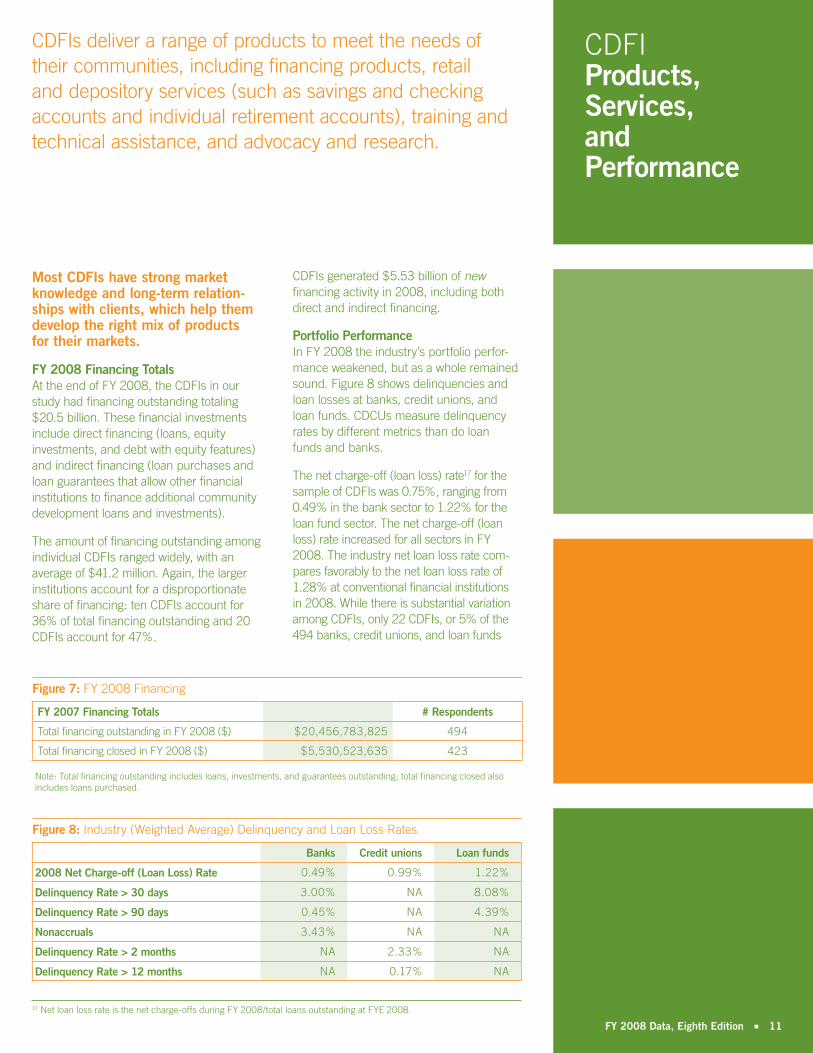
FY 2008 Financing TotalsAt the end of FY 2008, the CDFIs in our study had financing outstanding totaling $20.5 billion. These financial investments include direct financing (loans, equity investments, and debt with equity features) and indirect financing (loan purchases and loan guarantees that allow other financial institutions to finance additional community development loans and investments).
The amount of financing outstanding among individual CDFIs ranged widely, with an average of $41.2 million. Again, the larger institutions account for a disproportionate share of financing: ten CDFIs account for 36% of total financing outstanding and 20 CDFIs account for 47%.
CDFIs generated $5.53 billion of new financing activity in 2008, including both direct and indirect financing.
Portfolio PerformanceIn FY 2008 the industry’s portfolio perfor-mance weakened, but as a whole remained sound. Figure 8 shows delinquencies and loan losses at banks, credit unions, and loan funds. CDCUs measure delinquency rates by different metrics than do loan funds and banks.
The net charge-off (loan loss) rate17 for the sample of CDFIs was 0.75%, ranging from 0.49% in the bank sector to 1.22% for the loan fund sector. The net charge-off (loan loss) rate increased for all sectors in FY 2008. The industry net loan loss rate com-pares favorably to the net loan loss rate of 1.28% at conventional financial institutions in 2008. While there is substantial variation among CDFIs, only 22 CDFIs, or 5% of the 494 banks, credit unions, and loan funds
CDFIs deliver a range of products to meet the needs of their communities, including financing products, retail and depository services (such as savings and checking accounts and individual retirement accounts), training and technical assistance, and advocacy and research.
Figure 7: FY 2008 Financing
FY 2007 Financing Totals # Respondents
Total financing outstanding in FY 2008 ($) $20,456,783,825 494
Total financing closed in FY 2008 ($) $5,530,523,635 423
Note: Total financing outstanding includes loans, investments, and guarantees outstanding; total financing closed also includes loans purchased.
Figure 8: Industry (Weighted Average) Delinquency and Loan Loss Rates
Banks Credit unions Loan funds
2008 Net Charge-off (Loan Loss) Rate 0.49% 0.99% 1.22%
Delinquency Rate > 30 days 3.00% NA 8.08%
Delinquency Rate > 90 days 0.45% NA 4.39%
Nonaccruals 3.43% NA NA
Delinquency Rate > 2 months NA 2.33% NA
Delinquency Rate > 12 months NA 0.17% NA
FY 2008 Data, Eighth Edition n 11

that reported these data, had net loan loss rates greater than 10%. This was the same rate as FY 2007. Figure 9 shows how the loss rate for the overall industry declined from 2003 through 2005, increased slightly in 2006 and jumped in 2007 and 2008.
After years of declining or remaining some-what steady, the delinquency rates for loan funds increased in 2006 and 2007 fol-lowed by a sharper increase in 2008 while credit unions remained steady in 2006 but increased in 2007 and 2008 (see Figure 10).
CDFI delinquency rates are higher than their net charge-off rates. CDFIs are able to manage these delinquencies through tech-nical assistance and frequent contact and monitoring of their borrowers. CDFIs also keep adequate loan loss reserves and equity bases to further protect their investors.
Retail Financial ServicesBanks and credit unions mobilize savings and provide access to credit. These institu-tions offer a broad range of products, such as savings accounts, checking accounts, certificates of deposit, and IRAs, as well as client services, such as automated teller machine (ATM) access, check cashing, bill payment, and direct deposit. They also provide asset building products such as individual development accounts (IDAs), which use a mix of financial education, peer support, and matching funds to promote savings among low-income customers that can be used to invest in homeownership, small business development, or education.
Alternatives to payday loans—high-interest short-term loans secured by the bor-rower’s next paycheck—are important products offered by CDCUs. Although many customers view these depositories as being just like any other financial institu-tion, the difference lies in the customer base and the communities served.
Figure 9: Net Loan Loss Rates, 2000–2008
0.40%
0.60%
0.80%
1.00%
200820072006200520042003200220012000
0.91%
0.71% 0.71% 0.70%
0.55% 0.55%
0.75%
0.44% 0.46%
0.0%
0.5%
1.0%
1.5%
2.0%
2.5%
3.0%
3.5%
4.0%
4.5%
5.0%
2008200720062005
Loan fundsCredit unions
1.7%1.7%2.0%
2.4%
2.9%3.3%
4.4%
2.3%
Figure 10: Credit Union and Loan Fund Delinquency Rates, 2005–2008
12 n FY 2008 Data, Eighth Edition

18 The CAGR is the rate at which an investment would have grown annually if it grew at a steady rate. We use the CAGR rather than the actual annual growth rate to demonstrate trends in the data.
CDFI Growth from 2004 to 2008CDFIs experienced growth in each of the past five years. For the CDFIs for which we have five years of data, their combined assets grew at a compound annual growth rate (CAGR)18 of 10% between 2004 and 2008 (353 CDFIs); for those for which we have five years of financing outstanding data (348 CDFIs), combined financing outstanding grew at a CAGR of 11% for the sample as a whole. See Figure 11.
CAGRs varied significantly among CDFIs. Eleven percent of the sample experienced CAGRs in financing outstanding from 2004 to 2008 of greater than 25% (see Figure 12). Twenty-six percent of the sample expe-rienced declines in financing outstanding. This results from having repayments or charge-offs in their portfolio during the five-year period greater than the amount of new financing closed.
Anthony is a single father. He didn’t think home purchase was within his reach in high-priced Santa Fe.
That was before he was introduced to Homewise.
In September 2008, Anthony met with a Homewise Home Purchase Advisor and they discussed how Homewise could help him achieve his dream of owning a home. After attending a Financial literacy class, much to his surprise Anthony learned that he was buyer ready, which meant he was able to start look-ing for a home immediately.
Anthony was eligible for an affordable home under the Santa Fe County Affordable Housing Ordinance. With his Homewise realtor, he went to a Rancho Viejo subdivision where there was a 3 bedroom, 2 bath home in his price range that was perfect for him and his daughters.
Anthony went under contract for the home in March. He was still unsure about his finances, however although his savings and debt were at acceptable levels, Homewise helped him work on debt reduction and savings plans and during the months while his home was being built he was able to increase his savings from
$8,000 to $11,000, reduce his debt, and in-crease his credit score by more than 10 points.
When his home was completed in July 2009, Anthony was comfortable with his financial pic-ture and his new housing payment. His family loves their new home and neighborhood.
The mission of Homewise is to help working New Mexicans become successful homeown-ers in order to achieve financial security, strengthen families and increase the economic and social vitality of their communities. Home-wise was founded in 1986. Since its founding, Homewise has:
• helped over 2,200 people purchase homes
• helped over 1,540 people keep their homes
• trained and counseled more than 7,000 people toward successful homeownership
• built over 420 affordable, energy conserving and water efficient homes.
Housing Financing Santa Fe, NM
Featuring Homewise
Figure 11: CDFI Industry Growth from 2004 to 2008
Mill
ions
of
$
0
5,000
10,000
15,000
20,000
25,000
20082007200620052004
Financing outstandingAssets
10% CAGR
11% CAGR
Note: Chart includes 353 CDFIs for which we have five years of asset data and 348 for which we have financing outstanding data.
Compound annual growthrates of financing outstanding
0%
10%
20%
30%
40%
25+%15-25%5-15%0-5%<0%
% o
f C
DFI
s
26%
18%
31%
14%11%
Figure 12: CDFI Growth Distribution, 2004 to 2008
FY 2008 Data, Eighth Edition n 13

As partners in the CDP, four national trade associations and intermediaries—Aspen Institute, National Community Investment Fund (NCIF), National Federation of Community Development Credit Unions (NFCDCU), and Opportunity Finance Network. worked together as the Data Collection and Cleaning Committee to collect data across the types of CDFIs.
Each data collector was responsible for collecting CDP data from its member or constituent CDFIs. Opportunity Finance Network acted as project manager, consoli-dating all of the data collected.
The Data Collection and Cleaning Committee defined common data points and definitions across the various institution types and developed data-cleaning proto-cols that all data collectors were required to follow. Opportunity Finance Network, as data consolidator, also applied financial formulas during data consolidation to per-form further quality assurance. Each trade association was responsible for designing its own survey instruments for distribution to its constituent CDFIs. The instruments were based on consensus language that defined cross-sector data points, as well as on language appropriate for individual CDFI sectors.
Overall, the CDP sent out 577 surveys for FY 2008 and compiled data for 495 CDFIs, a response rate of 86%. This data set rep-resents one of the most significant samples of CDFI data in the field; nonetheless, it rep-resents only a subset of the CDFI industry.
Each CDFI reported information based on its own fiscal year. All banks and credit unions have December 31 fiscal year ends; many nonregulated CDFIs have different fiscal year ends.
Not all questions were relevant to all CDFIs and thus were not answered by every insti-tution. In addition, some CDFIs were unable to answer some of the survey questions. As a result, the number of responses to indi-vidual questions is frequently less than the total sample size and is noted accordingly.
Use of Public Data for Depository InstitutionsThe CDP sent surveys to 293 CDCUs for The CDP sent the FY 2008 survey to 284 CDCUs and 65 community develop-ment banks. The survey requested data on organizational characteristics, financial position, products and services, and com-munity development outputs as of the end of FY 2008.
A total of 115 credit unions (40%) sent back completed questionnaires. For 169 nonresponding credit unions, financial data were obtained from regulatory “call reports” prepared by all federally insured U.S. credit unions. Data on nonfinancial fields were unavailable for nonrespondents. Consequently, when a survey question sought information provided on the call report, those data were obtained for all 284 CDCUs. For requested data unique to the survey (and not available on the call report), this report presents only the numbers drawn from the respondents. The sample size in such cases is limited to the 115 institutions that responded.
A total of 17 banks sent back completed surveys. For the 48 non-responding banks, publicly available data were obtained from the FDIC Web site for a limited number of data points.
Appendix A: Methodology
14 n FY 2008 Data, Eighth Edition
Staffing and Governancefull-time equivalents (FTEs): Includes full- and part-time employees
of the organization and volunteers who fill regular staff positions.
Excludes temporary staff and professional services conducted outside
of the office by third parties, such as accounting, bookkeeping,
and legal counsel. One FTE is at least a 35-hour workweek.
Capital Available for Financing total lending/investing pool or capital available for financing: Includes
all capital for lending and investing held by a CDFI as of FYE 2008. This
lending/investing pool includes only capital shown on the statement of
financial position as received—it does not include capital commitments,
grants receivable for capital, or undrawn funds, with the exception
of the venture fund sector (which includes committed capital).
total lending/investing pool: borrowed funds + deposits
+ shares + nonmember deposits + secondary capital +
equity equivalent investments + equity capital
borrowed funds: > Loans payable related to financing. Also referred to as
debt capital or investor capital. Funds lent to a CDFI from a third party
that the CDFI will relend or reinvest in the communities it serves.
deposits: > Funds placed in a depository institution by
individuals or organizations, typically earning interest
and insured by government agencies.
shares: > A deposit made in a credit union that confers
ownership rights in the credit union on the depositor.
nonmember deposits: > Funds placed in a credit union by
individuals or organizations that are not members of the credit
union. Nonmember deposits do not confer ownership rights
in the credit union to the depositor and are typically limited
to a small percentage of a credit union’s total deposits.
secondary capital: > A specific type of capital used only by low-income-
designated credit unions. It is defined by the NCUA as having several
key characteristics: uninsured, subordinate to all other claims, minimum
maturity of five years, and not redeemable prior to maturity.
equity equivalent investments (EQ2s): > Unsecured debt that has
some of the same advantages as equity because it is subordinate
to all other debt and carries a rolling term, the investor has a limited
right to accelerate payment, and interest is not tied to income.
The investing bank also receives advantageous CRA credit.
equity capital: > Also referred to as net assets dedicated to
lending by nonprofit loan funds and as equity by credit
unions, banks, and venture funds. It is the amount of equity
at the CDFI that is available for lending or investing.
Capital Sourcesnondepository financial institutions: Includes all financial
institutions that are not banks, thrifts, or credit unions, including
mutual funds, insurance companies, and finance companies.
Sectors Servedbusiness: Financing to for-profit and nonprofit businesses with more
than five employees or in an amount greater than $35,000 for the
purpose of start up, expansion, working capital, equipment purchase/
rental, or commercial real estate development or improvement.
community services: Financing to community service organizations
such as human and social service agencies, advocacy organizations,
cultural and religious organizations, health care providers, and
child care and education providers. Uses include acquisition,
construction, renovation, leasehold improvement, and expansion
loans, as well as working capital loans and lines of credit.
consumer financial services: All personal loans (secured and
unsecured) to individuals for health, education, emergency, debt
consolidation, and consumer purposes. In general, personal loans
for business are classified as microenterprise or business; personal
loans for home improvement or repair are classified as housing.
housing: Financing to housing developers for predevelopment, acquisition,
construction, renovation, lines of credit, working capital, and mortgage
loans to support the development of rental housing, service-enriched
housing, transitional housing, or residential housing. Includes loans
to individuals to support homeownership and home improvement.
microenterprise: Financing to for-profit and nonprofit businesses with
five or fewer employees (including proprietor) and with a maximum
loan/investment of $35,000. This financing may be for the purpose
of start up, expansion, working capital, equipment purchase/
rental, or commercial real estate development or improvement.
other: Any activities not covered in the sectors defined
here (includes financing to other CDFIs).
Financing Outstandingdebt-with-equity features: Includes convertible debt, as well
as debt with warrants, participation agreements, royalties, or
any other feature that links the investment’s rate of return to the
performance of the company that received the investment.
equity investments: Investments made in for-profit companies in which the CDFI receives an ownership interest in the equity (stock) of the company.
loan loss reserves: Funds set aside in the form of cash reserves or
through accounting-based accrual reserves that serve as a cushion
to protect an organization against potential future losses. Loan loss
reserves typically show up as a contra-asset on the balance sheet.
guarantees: Includes guarantees or letters of credit provided to enhance the
creditworthiness of a borrower receiving a loan from a third-party lender.
total loan losses: The net amount charged off. Losses are reported after
default, foreclosure, and liquidation and are the net of any recovered
assets. If any amount is reclaimed in the current fiscal year on loans/
investments that were written off in previous years, that amount is
subtracted from the amount written off in the current fiscal year.
Appendix B: Glossary of Terms
FY 2008 Data, Eighth Edition n 15

total loans outstanding: The number of loans for which principal was outstanding
as of the last day of the fiscal year. These loans may have originated during
the fiscal year or in a previous year. This number includes any loans that have
been restructured, but not those loans that have been written off.
Clients Served and Outcomeshousing units created: Includes new construction, units projected to be constructed, or
complete rehabilitation of existing housing units that were previously unoccupied.
housing units renovated or preserved: Renovated includes units that have been renovated or are
projected to be renovated. Preserved includes mark-to-market and similarly preserved units.
jobs assisted: jobs created + jobs maintained
jobs created: The change in the number of jobs at a microenterprise or business financed
between two fiscal years (i.e., the net job change). When calculating the number of
jobs at the microenterprise or business, only permanent FTE jobs are counted.
jobs maintained: Total number of employees at a microenterprise or
business financed at the time a given loan or investment closed.
low-income: A customer who has an annual income, adjusted for family size, of not
more than 80% of the area median family income for metropolitan areas, or the
greater of (1) 80% of the area median family income or (2) 80% of the statewide
nonmetropolitan area median family income for nonmetropolitan areas.
16 n FY 2008 Data, Eighth Edition

Notes
FY 2008 Data, Eighth Edition n 17
The CDFI Data ProjectThe CDFI Data Project (CDP) is an industry collaborative that produces data about CDFIs. The goal of the CDP is to ensure access and use of data to improve practice and attract resources to the CDFI field. The CDP collected FY 2008 data on 495 CDFIs. The data set includes approximately 40 data points on operations, financing, capitalization, and impact. Supported bythe John D. and Catherine T. MacArthur Foundation, this initiative convenes leading organizations in the CDFI industry.
Partner Organizations> Aspen Institute
www.fieldus.orgNational nonprofit that disseminates best practices and educates policymakers, funders, and others about microenterprise
> Association for Enterprise Opportunitywww.microenterpriseworks.orgNational member-based trade association of more than 500 microenterprise development programs
> Coalition of Community Development Financial Institutionswww.cdfi.orgLead organization in the United States that promotes the work of CDFIs
> Community Development Venture Capital Alliancewww.cdvca.orgCertified CDFI intermediary that serves community development venture capital funds through training, financing, consulting, research, and advocacy
> National Community Investment Fundwww.ncif.orgCertified CDFI that channels equity, debt, and information to locally owned banks, thrifts, and selected credit unions with a primary purpose of community development
> National Federation of Community Development Credit Unionswww.cdcu.coopCertified CDFI intermediary that serves more than 200 low-income credit unions across the United States
> Opportunity Finance Networkwww.opportunityfinance.netThe leading network of private financial intermediaries with a proven expertise in lending prudently and productively in unconventional markets often overlooked by conventional financial institutions.
For more information on the CDFI Data Project, contact any of the partner organizations or Jumana Poonawala of Opportunity Finance Network at [email protected] (215.320.4316).
Community Development Banks
Providing Capital
Building Communities
Creating ImpactFiscal Year 2008

This depository function not only allows community development banks to meet a wider range of individual financial needs, but also enables them to leverage scarce equity capital with deposits to generate significantly higher levels of lending in their communities. Moreover, deposits allow banks to operate with relatively modest levels of subsidy, enhancing both autonomy and financial sustainability.
Sixty-five community development banks participated in the FY 2008 CDP data collec-tion. The following summary draws primarily from CDP data and is further supported with transaction level data reported by the National Community Investment Fund’s (NCIF) investee banks.
Unfortunately, 2008 was a difficult year for CDFI banks. While not involved in the same risky lending behavior of larger financial insti-tutions, CDFI banks are located in and serve economically disadvantaged communities. These neighborhoods are some of the first to be impacted during recessions, which leads to borrowers that are unable to repay the loans made by CDFI banks. As the asset quality problems continue within this sector, it is important to note that CDFI banks have a track record of developing strong relation-ships with their borrowers and they use these relationships to work with borrowers to help them stay current and avoid foreclosure or default.
While times were difficult during FY 2008, CDFI banks continued to lend, providing access to financial products and services that are essential to the development of economically disadvantaged communities. Together the bank respondents represent total deposits of $12.4 billion, and $11.1 billion in loans outstanding including $5.5 billion in small business loans and $3.4 bil-lion housing loans. The mission focus and financial strength of CDFI banks has allowed them to improve low-income communities while positively changing both local residents’ and outside investors’ perception of the com-munities in which they operate.
Size and ScopeAs of year-end 2008, the CDFI Fund had certified 65 community development banks as CDFIs. As Figure 1 illustrates, the bulk of these banks and thrifts are concentrated in the eastern half of the United States.
During 2008, the median CDFI bank operated 77% of its branches in low- and moderate-income communities, compared to a median of 14% for all banks.1 With the vast majority of branches located in low- and moderate- income communities, CDFI banks provide the residents of distressed com-munities the sustainable banking products and services that are a necessary alternative to the irresponsible and predatory financial service providers that are ubiquitous in these neighborhoods. Of the CDFI banks, 60% are
defined by the FDIC as Minority Depository Institutions, indicating that these banks are minority-owned or are focused on serving the needs of a minority community.2
It is commonly recognized that there are significantly more community development banks in the country than those that are certified by the CDFI Fund. The National Community Investment Fund (NCIF) has created a series of Social Performance Metrics3 to identify those banks which are not certified as a CDFI, but whose primary purpose is providing financial services to low to moderate income communities. Analyzing these community development banking insti-tutions, or CDBIs, along with the CDFI banks will further the understanding of the commu-nity development banking field.
The sixty-five community development banks that participated in the CDP in FY 2008 had combined assets of $16.2 billion and median assets of $142.6 million. These 65 banks constitute 55% of the total assets of all CDFIs in the CDP data set, despite making up only 13.1% of the total number of institutions.
Figure 2 provides the distribution of the banks according to asset size and shows that 33.8% of the banks are in the $60 million to $150 million asset range. On December 31, 2008, the 65 CDFI banks had $11.1 billion in total loans outstanding.
1 Low to moderate income community is defined as a census tract with a median household income that is less than 80% of the relevant statistical area, an unem-ployment rate that is 1.5 times the national average or a poverty rate greater than 20%.
2 For more information on the FDIC Minority Depository Institution Program, please visit www.fdic.gov/ regula-tions/resources/minority/index.html
3 For more information on the NCIF Social Performance Metrics, along with a searchable database of all banks, please visit www.ncif.org.
Like all CDFIs, community development banks provide capital to low-income borrowers and communities through targeted lending. As depository institutions, however, community development banks, along with community development credit unions, are able to offer federally insured deposits.
1
4
52
2
32
2
3
3
12
1
1
1
7
2
1
1
21
2
1
11
1
2
1
Figure 1: Geographic Distribution of 65 Certified CDFI banks

Bank CapitalizationA community development bank typically leverages equity with federally insured deposits (mostly from individuals and local small business) in the form of sav-ings accounts, checking accounts, and certificates of deposit. The 65 CDP banks reported a total of $1.4 billion in total share-holder’s equity, averaging $21.2 million per institution. During 2008 the CDFI banks were able to leverage that capital almost 9 times to raise $12.4 billion in deposit funding. This leveraging allows CDFI banks to maximize the community development impact of each dollar of investor support.
Financing Activity and Financial PerformanceCommunity development banks are subject to the same safety and soundness regula-tions as other banks. However, because of their experience and knowledge of the com-munity, they are also able to provide prod-ucts and services that mainstream banks find too risky or too costly. For example, many community development banks lend to small entrepreneurs who acquire multifamily residential properties to renovate for sale or lease. Similarly, community development banks lend to churches and other faith-based and nonprofit institutions that play active roles in the community.
Community development banks have a mission to provide financial products and services to low-income communities and borrowers. There is a misconception that a focus on economically distressed communi-ties is risky or unprofitable; the track record of CDFI banks proves otherwise. While operating in a difficult economic climate, the majority of the CDFI banks remained profit-able in FY 2008. Forty-two of the 65 CDP subset banks were profitable during the year, and the combined net income for the CDFI bank sector was $22.2 million.
Moreover, this solid financial return does not come at the expense of high risk. According to data available from the Federal Deposit Insurance Corporation, the average com-munity development bank in the CDP subset had a non-current loans4 to total loans ratio
Liberty Bank and Trust Company (Liberty) finances a wide variety of community services and job-creating projects in low income communities throughout the Gulf South.
Recently, Liberty utilized the New Markets Tax Credit (NMTC) program to help finance the transformation of a former supermarket in New Orleans into the workforce development center and administrative offices of Goodwill Industries of Southeastern Louisiana, Inc.
Goodwill Industries of Southeastern Louisiana, Inc., is a 62-year old affiliate of the international Goodwill organization, which is North America’s largest nonprofit provider of employment and training services for people with disabilities and other barriers to employment. Goodwill operates in 23 parishes in Southeastern Louisiana and funds much of its activties through 12 retail stores, including a Goodwill store that was developed as a part of this project. The new facility opened in December 2009 and the event was a homecoming four years in the making. Hurricane Katrina catastrophically damaged Goodwill’s former site located less than a mile from its new space.
The new 23,000 square foot Goodwill workforce development center is outfitted with five training classrooms, three conference
rooms, and state of the art learning tools that will help train citizens with disabilities and other employment barriers. The remaining space houses administration offices, warehouse operations, and an adjacent retail store and donation center. The new building also has an additional 30,000 square feet of second floor office space available to lease to non-profits.
Liberty is a certified CDFI bank founded in 1972. The bank currently serves six metropolitan areas in six states, including Baton Rouge and New Orleans, Louisiana; Jackson, Mississippi; Houston, Texas; Kansas City, Kansas and Missouri; and Detroit, Michigan. Liberty’s mission is to provide cost-effective delivery of high quality, innovative, customer driven financial products and services to diverse markets with a focus on disadvantaged minority communities that have traditionally been underserved. Concurrent with the bank’s mission, Liberty balances its status as a catalyst for economic and community development with generating fair returns to shareholders and being an excellent corporate citizen.
Community Services Financing New Orleans, LA
Featuring Liberty Bank and Trust Company
Total Cap Available
for Lending
Equity $1,379,784,000
$16,183,650,000
Figure 3: Leverage at the 65 CDFI Banks
Figure 2: FY 2008 Asset Size Distribution of 65 CDP Banks
Asset Category Number of Banks
Average Asset Size
Median Asset Size
Below $60 million 12 $35,225,583 $32,217,000
$60 million to $150 million 22 $98,405,955 $92,323,000
$150 million to $250 million 11 $195,258,364 $201,285,000
$250 million and above 20 $572,408,500 $368,874,000
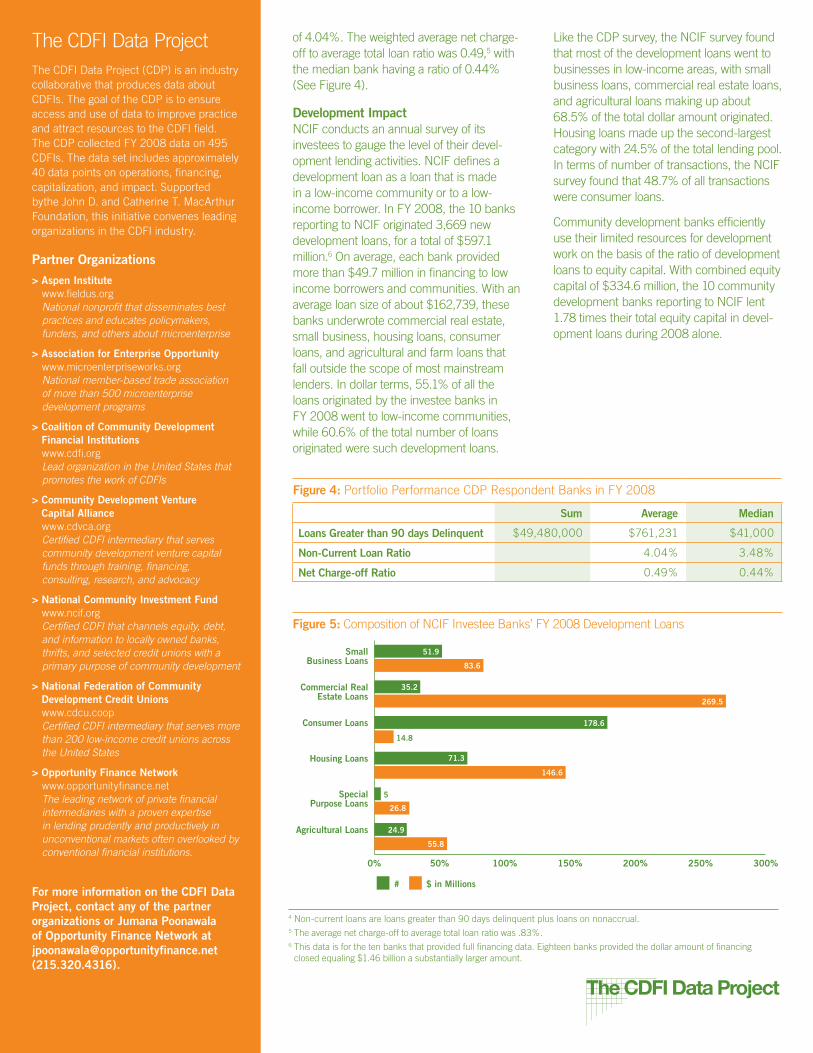
of 4.04%. The weighted average net charge-off to average total loan ratio was 0.49,5 with the median bank having a ratio of 0.44% (See Figure 4).
Development ImpactNCIF conducts an annual survey of its investees to gauge the level of their devel-opment lending activities. NCIF defines a development loan as a loan that is made in a low-income community or to a low-income borrower. In FY 2008, the 10 banks reporting to NCIF originated 3,669 new development loans, for a total of $597.1 million.6 On average, each bank provided more than $49.7 million in financing to low income borrowers and communities. With an average loan size of about $162,739, these banks underwrote commercial real estate, small business, housing loans, consumer loans, and agricultural and farm loans that fall outside the scope of most mainstream lenders. In dollar terms, 55.1% of all the loans originated by the investee banks in FY 2008 went to low-income communities, while 60.6% of the total number of loans originated were such development loans.
Like the CDP survey, the NCIF survey found that most of the development loans went to businesses in low-income areas, with small business loans, commercial real estate loans, and agricultural loans making up about 68.5% of the total dollar amount originated. Housing loans made up the second-largest category with 24.5% of the total lending pool. In terms of number of transactions, the NCIF survey found that 48.7% of all transactions were consumer loans.
Community development banks efficiently use their limited resources for development work on the basis of the ratio of development loans to equity capital. With combined equity capital of $334.6 million, the 10 community development banks reporting to NCIF lent 1.78 times their total equity capital in devel-opment loans during 2008 alone.
Figure 5: Composition of NCIF Investee Banks’ FY 2008 Development Loans
0% 50% 100% 150% 200% 250% 300%
$#
Agricultural Loans
SpecialPurpose Loans
Housing Loans
Consumer Loans
Commercial RealEstate Loans
SmallBusiness Loans
$ in Millions#
5
26.8
24.9
55.8
71.3
146.6
14.8
269.5
35.2
51.9
83.6
178.6
The CDFI Data ProjectThe CDFI Data Project (CDP) is an industry collaborative that produces data about CDFIs. The goal of the CDP is to ensure access and use of data to improve practice and attract resources to the CDFI field. The CDP collected FY 2008 data on 495 CDFIs. The data set includes approximately 40 data points on operations, financing, capitalization, and impact. Supported bythe John D. and Catherine T. MacArthur Foundation, this initiative convenes leading organizations in the CDFI industry.
Partner Organizations> Aspen Institute
www.fieldus.orgNational nonprofit that disseminates best practices and educates policymakers, funders, and others about microenterprise
> Association for Enterprise Opportunitywww.microenterpriseworks.orgNational member-based trade association of more than 500 microenterprise development programs
> Coalition of Community Development Financial Institutionswww.cdfi.orgLead organization in the United States that promotes the work of CDFIs
> Community Development Venture Capital Alliancewww.cdvca.orgCertified CDFI intermediary that serves community development venture capital funds through training, financing, consulting, research, and advocacy
> National Community Investment Fundwww.ncif.orgCertified CDFI that channels equity, debt, and information to locally owned banks, thrifts, and selected credit unions with a primary purpose of community development
> National Federation of Community Development Credit Unionswww.cdcu.coopCertified CDFI intermediary that serves more than 200 low-income credit unions across the United States
> Opportunity Finance Networkwww.opportunityfinance.netThe leading network of private financial intermediaries with a proven expertise in lending prudently and productively in unconventional markets often overlooked by conventional financial institutions.
For more information on the CDFI Data Project, contact any of the partner organizations or Jumana Poonawala of Opportunity Finance Network at [email protected] (215.320.4316).
Figure 4: Portfolio Performance CDP Respondent Banks in FY 2008
Sum Average Median
Loans Greater than 90 days Delinquent $49,480,000 $761,231 $41,000
Non-Current Loan Ratio 4.04% 3.48%
Net Charge-off Ratio 0.49% 0.44%
4 Non-current loans are loans greater than 90 days delinquent plus loans on nonaccrual.5 The average net charge-off to average total loan ratio was .83%.6 This data is for the ten banks that provided full financing data. Eighteen banks provided the dollar amount of financing
closed equaling $1.46 billion a substantially larger amount.
Community Development Credit Unions
Providing Capital
Building Communities
Creating ImpactFiscal Year 2008
Despite operating in challenging economic environments, the CDCU sector as a whole experienced growth in assets in 2008. Some of this growth is attributable to the shift in depositors from banks to credit unions in the face of tightening of credit at mainstream financial institutions. 2008 was a challenging year for CDCU self-sufficiency as the economic crisis and fees associated with losses at the corporate credit union level were felt throughout the industry. Still, CDCUs remained competitive with overall performance indicators comparable to those of mainstream credit unions. Assets of CDCUs continued to grow and net worth increased by 2.13%. Total loans for CDCUs grew, including business and real estate loans. Membership grew at 4%, a higher rate than in 2007 and higher than the 2008 mainstream credit union rate of 1.6%.
Demographics
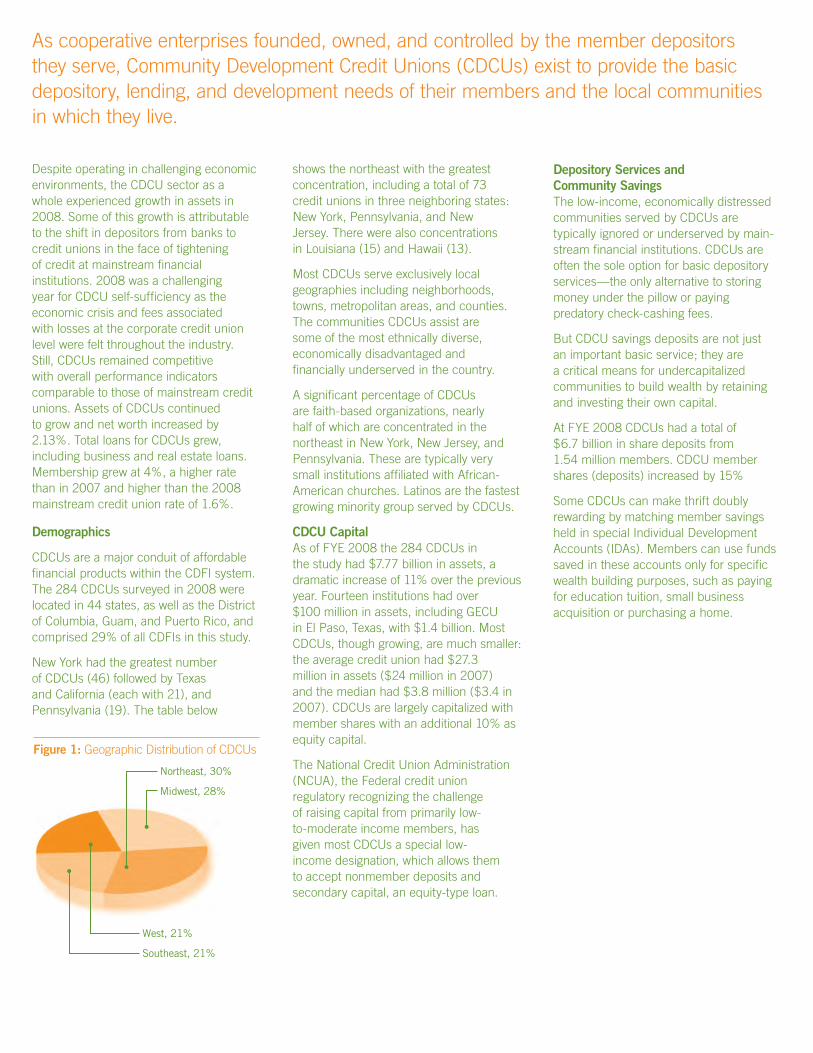
CDCUs are a major conduit of affordable financial products within the CDFI system. The 284 CDCUs surveyed in 2008 were located in 44 states, as well as the District of Columbia, Guam, and Puerto Rico, and comprised 29% of all CDFIs in this study.
New York had the greatest number of CDCUs (46) followed by Texas and California (each with 21), and Pennsylvania (19). The table below
shows the northeast with the greatest concentration, including a total of 73 credit unions in three neighboring states: New York, Pennsylvania, and New Jersey. There were also concentrations in Louisiana (15) and Hawaii (13).
Most CDCUs serve exclusively local geographies including neighborhoods, towns, metropolitan areas, and counties. The communities CDCUs assist are some of the most ethnically diverse, economically disadvantaged and financially underserved in the country.
A significant percentage of CDCUs are faith-based organizations, nearly half of which are concentrated in the northeast in New York, New Jersey, and Pennsylvania. These are typically very small institutions affiliated with African-American churches. Latinos are the fastest growing minority group served by CDCUs.
CDCU CapitalAs of FYE 2008 the 284 CDCUs in the study had $7.77 billion in assets, a dramatic increase of 11% over the previous year. Fourteen institutions had over $100 million in assets, including GECU in El Paso, Texas, with $1.4 billion. Most CDCUs, though growing, are much smaller: the average credit union had $27.3 million in assets ($24 million in 2007) and the median had $3.8 million ($3.4 in 2007). CDCUs are largely capitalized with member shares with an additional 10% as equity capital.
The National Credit Union Administration (NCUA), the Federal credit union regulatory recognizing the challenge of raising capital from primarily low-to-moderate income members, has given most CDCUs a special low-income designation, which allows them to accept nonmember deposits and secondary capital, an equity-type loan.
Depository Services and Community SavingsThe low-income, economically distressed communities served by CDCUs are typically ignored or underserved by main-stream financial institutions. CDCUs are often the sole option for basic depository services—the only alternative to storing money under the pillow or paying predatory check-cashing fees.
But CDCU savings deposits are not just an important basic service; they are a critical means for undercapitalized communities to build wealth by retaining and investing their own capital.
At FYE 2008 CDCUs had a total of $6.7 billion in share deposits from 1.54 million members. CDCU member shares (deposits) increased by 15%
Some CDCUs can make thrift doubly rewarding by matching member savings held in special Individual Development Accounts (IDAs). Members can use funds saved in these accounts only for specific wealth building purposes, such as paying for education tuition, small business acquisition or purchasing a home.
As cooperative enterprises founded, owned, and controlled by the member depositors they serve, Community Development Credit Unions (CDCUs) exist to provide the basic depository, lending, and development needs of their members and the local communities in which they live.
Figure 1: Geographic Distribution of CDCUs
Northeast, 30%
Midwest, 28%
West, 21%
Southeast, 21%
Lending
Just as CDCUs perform a vital depositoryfunction, they also make available criticallending services in areas not adequatelyserved by mainstream institutions. As of FYE 2008, CDCUs had loans outstanding worth $5.9 billion, an 11% increase over FY 2007. The median CDCU had loans outstanding worth $2.34 million ($2.1 million in 2007). Despite the mortgage crisis, CDCUs granted $2.7 billion in loans in 2008, an increase of 10% from the previous year. Loans outstanding in 2008 included $2.3 billion in vehicle loans and $2.5 billion in housing loans.1 Autos are often essential for local residents to find work and get to a job, while housing pur-chase, construction, and rehab increase local real estate values and leverage investment in the long-term economic well-being of the community.
Borrower economic conditions and demand for loans in low-income commu-nities require CDCUs to specialize in small loans. These loans have profit margins thatmainstream financial institutions generallyperceive to be too low, leaving predatorylenders as the only other option. In fact, many CDCU consumer loans satisfied a need that may otherwise have been met by payday lenders, rent-to-own stores, pawnshops, and other predatory lenders, some of which charge interest rates as high as 700% annually.
Personal development or consumer loans, typically for essential everyday expenses such as car repair, education, and medical bills, best characterize this type of small, low profit margin loan. The average size of a personal loan outstanding was small by mainstream or even CDFI financial industry standards. Another common use of personal consumer loans is to finance microenterprise activity.
In addition to personal development loans, CDCUs have also instituted loan programs to specifically combat predatory payday loans. These loans are critical to the economic regeneration of low-income communities. A critical service provided by CDCUs is financial counseling and training. The majority of CDCUs provided consumer credit, business, or homebuyer counseling.
Financial Performance
One reason mainstream financial institu-tions have withdrawn from economically distressed communities is their discomfort with the typical low-income borrower’s risk profile. CDCUs have to be flexible, creative, and knowledgeable about their markets to meet the challenge of serving people of modest means and often little financial experience. While portfolio per-formance ratios are comparable to the mainstream, not surprisingly, delinquen-cies increased in 2008. As of FYE 2008,
1 The housing financing outstanding amount includes CDFIs that were unable to provide the breakouts of financing out-standing in the full CDFI Data Project dataset.
These have been banner years for Brooklyn Cooperative Feder-al Credit Union (Brooklyn Cooperative), New York City’s fastest growing community development credit union.
Over the past year and a half, Brooklyn Cooperative’s assets have grown more than 34% to $10.4 million in June 2010; the value of its loan portfolio has jumped 36% to $7.2 million. The credit union is owned by its more than 6,500 members, low-income and working-class people who live, work, or worship in Bushwick and Bedford-Stuyvesant, two of New York City’s poorest neighborhoods where more than one in three adults live below the federally determined poverty line.
Brooklyn Cooperative provides a wide range of services in a market where only eight bank branches serve a quarter mil-lion residents: 1) saving and loan products, including saving and checking accounts with Visa Check Cards and online banking, as well as consumer, micro-enterprise, and housing loans; 2) development services such as financial literacy workshops, microenterprise technical assistance, homeownership counseling, and foreclo-
sure prevention counseling; and 3) free tax preparation for low-income individuals.
Recognizing Brooklyn Cooperative’s contribution to the small business sector, New York City Mayor Michael Bloomberg selected the credit union as the setting for the City’s launch of a new small busi-ness lending initiative, the Capital Access Program. Brooklyn Cooperative is one of only five New York City financial institutions selected to participate in the program.
Brooklyn Cooperative small business mem-ber Luis Guevara, whose loan is supported by the Capital Access Program, explained: “Thanks to Brooklyn Coop, our business is still alive and hopefully this season it will get busy again and we will make it through this difficult period.”
Consumer Financing and Services Brooklyn, NY
Featuring Brooklyn Cooperative Federal Credit Union
CDCUs’ aggregate delinquency as a per-cent of aggregate loans outstanding was 2.3% up from 2.0% at FYE 2007. This rate was higher than the 1.37% for all federally insured credit unions, though the percentage increase for CDCUs was lower.
The rise in delinquencies, while not a surprise, was another indicator of the challenges faced by CDCUs in managing lending to economically distressed areas. The loan loss rate in FY 2008 was 1.0%, up from .76% in FY 2007; the FY 2008 loan loss rate for all federally insured credit unions was 0.84%. Still CDCUs, particu-larly faith-based institutions, have a high rate of success in recovering delinquent loans because they have traditionally exercised a greater level of patience and forbearance as a result of an especially close and personalized relationship with their members.
The primary purpose of CDCUs will always be to serve economically distressed com-munities and populations. That purpose is not incompatible with sound business practices and profitability. CDCUs do not pull up stakes when the economic going gets more difficult; rather, they continue to operate on tight margins in areas suffering from low capital availability and underin-vestment.
Most CDCUs are historically self-sufficient in generating their income. Non-operating income, generally consisting of commu-nity development grants and donations, contributes only a small portion of total income, and the majority of CDCUs relies solely on operating income. In 2008, how-ever, corporate credit union stabilization requirements impacted CDCU return on assets as it did the industry as a whole.
Although CDCUs have strong and sup-portive lending models, many of the com-munities they serve are experiencing highunemployment and foreclosures. At thesame time many CDCUs have experiencedan increase in demand for loan productsand ancillary support services. CDCUs willcontinue to balance the dual pressuresof maintaining high levels of service whilemaintaining strong balance sheets
The CDFI Data ProjectThe CDFI Data Project (CDP) is an industry collaborative that produces data about CDFIs. The goal of the CDP is to ensure access and use of data to improve practice and attract resources to the CDFI field. The CDP collected FY 2008 data on 495 CDFIs. The data set includes approximately 40 data points on operations, financing, capitalization, and impact. Supported bythe John D. and Catherine T. MacArthur Foundation, this initiative convenes leading organizations in the CDFI industry.
Partner Organizations> Aspen Institute
www.fieldus.orgNational nonprofit that disseminates best practices and educates policymakers, funders, and others about microenterprise
> Association for Enterprise Opportunitywww.microenterpriseworks.orgNational member-based trade association of more than 500 microenterprise development programs
> Coalition of Community Development Financial Institutionswww.cdfi.orgLead organization in the United States that promotes the work of CDFIs
> Community Development Venture Capital Alliancewww.cdvca.orgCertified CDFI intermediary that serves community development venture capital funds through training, financing, consulting, research, and advocacy
> National Community Investment Fundwww.ncif.orgCertified CDFI that channels equity, debt, and information to locally owned banks, thrifts, and selected credit unions with a primary purpose of community development
> National Federation of Community Development Credit Unionswww.cdcu.coopCertified CDFI intermediary that serves more than 200 low-income credit unions across the United States
> Opportunity Finance Networkwww.opportunityfinance.netThe leading network of private financial intermediaries with a proven expertise in lending prudently and productively in unconventional markets often overlooked by conventional financial institutions.
For more information on the CDFI Data Project, contact any of the partner organizations or Jumana Poonawala of Opportunity Finance Network at [email protected] (215.320.4316).
Providing Capital
Building Communities
Creating ImpactFiscal Year 2008
Community Development Loan Funds
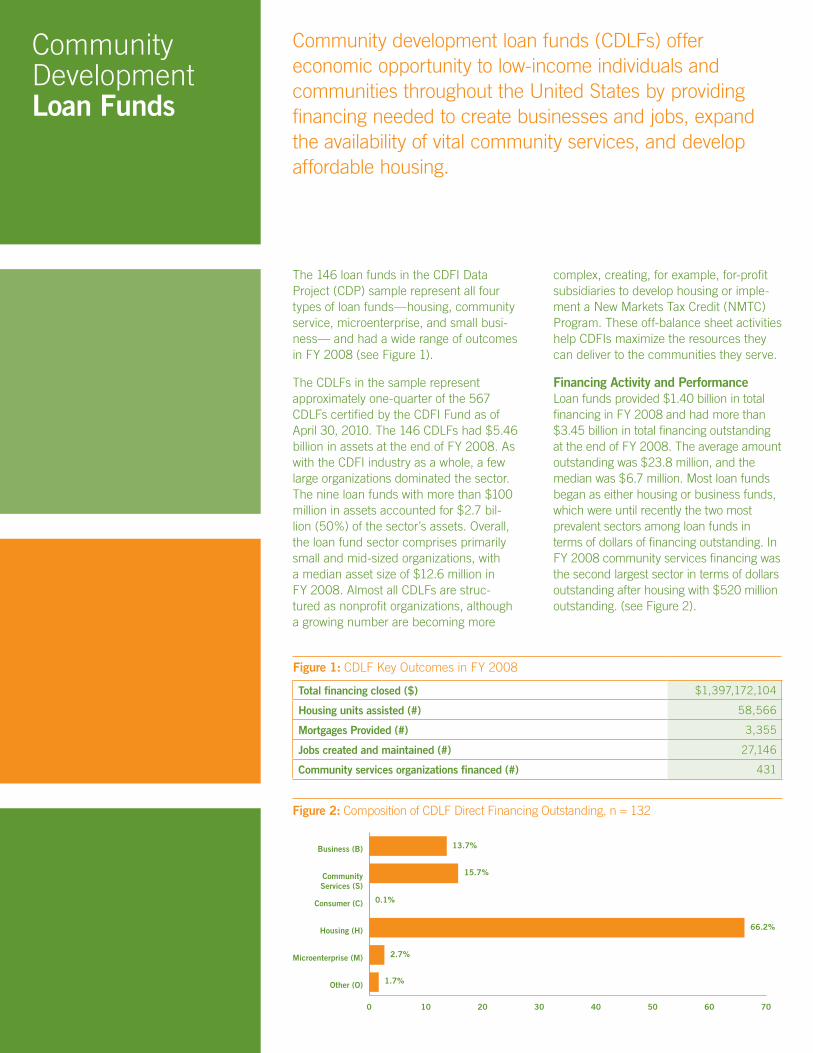
The 146 loan funds in the CDFI Data Project (CDP) sample represent all four types of loan funds—housing, community service, microenterprise, and small busi-ness— and had a wide range of outcomes in FY 2008 (see Figure 1).
The CDLFs in the sample represent approximately one-quarter of the 567 CDLFs certified by the CDFI Fund as of April 30, 2010. The 146 CDLFs had $5.46 billion in assets at the end of FY 2008. As with the CDFI industry as a whole, a few large organizations dominated the sector. The nine loan funds with more than $100 million in assets accounted for $2.7 bil-lion (50%) of the sector’s assets. Overall, the loan fund sector comprises primarily small and mid-sized organizations, with a median asset size of $12.6 million in FY 2008. Almost all CDLFs are struc-tured as nonprofit organizations, although a growing number are becoming more
complex, creating, for example, for-profit subsidiaries to develop housing or imple-ment a New Markets Tax Credit (NMTC) Program. These off-balance sheet activities help CDFIs maximize the resources they can deliver to the communities they serve.
Financing Activity and PerformanceLoan funds provided $1.40 billion in total financing in FY 2008 and had more than $3.45 billion in total financing outstanding at the end of FY 2008. The average amount outstanding was $23.8 million, and the median was $6.7 million. Most loan funds began as either housing or business funds, which were until recently the two most prevalent sectors among loan funds in terms of dollars of financing outstanding. In FY 2008 community services financing was the second largest sector in terms of dollars outstanding after housing with $520 million outstanding. (see Figure 2).
Community Development Loan Funds
Community development loan funds (CDLFs) offer economic opportunity to low-income individuals and communities throughout the United States by providing financing needed to create businesses and jobs, expand the availability of vital community services, and develop affordable housing.
0 10 20 30 40 50 60 70
Other (O)
Microenterprise (M)
Housing (H)
Consumer (C)
CommunityServices (S)
Business (B)
0.1%
66.2%
2.7%
15.7%
1.7%
13.7%
Figure 2: Composition of CDLF Direct Financing Outstanding, n = 132
Figure 1: CDLF Key Outcomes in FY 2008
Total financing closed ($) $1,397,172,104
Housing units assisted (#) 58,566
Mortgages Provided (#) 3,355
Jobs created and maintained (#) 27,146
Community services organizations financed (#) 431

A majority (66%) of the loan funds’ direct financing outstanding is in the housing sector. Housing loans to nonprofit and for-profit developers for affordable rental housing, for-sale homes, and transitional housing make up a core niche of loan funds. Loan funds provide financing where banks will not or, in some cases, assume a subordinate position that enables a bank to participate in what would otherwise be a too risky deal. Some CDLFs make million dollar loans to affordable housing developers, while others make small predevelopment loans of under $100,000. In FY 2008 the median loan size CDFIs made to housing organizations was $237,307. More CDLFs that in the past were primarily microenter-prise or small business lenders are now starting to make small housing loans to organizations. In addition, many loan funds provide loans to individuals for home pur-chase and repair: in FY 2008, 46 of the 80 CDLFs that provided housing financing made housing loans directly to individuals.
A number of loan funds provide loans to community service organizations to enhance the services available in low-income communities. These cli-ents, such as child care centers, social service agencies, and charter schools, often lack sources of capital, knowledge about financing, and collateral. Sixty-two loan funds provided community service financing, with ten providing primarily com-munity service financing and 17 directing at least one-third of their financing to community service organizations. CDLFs had $520 million in financing outstanding to community service organizations at FYE 2008 and closed $240 million in loans and investments in FY 2008.
Portfolio Performance and Managing RiskLoan funds are adept at managing risk in their markets. They do so by keeping adequate loan loss reserves and equity capital to protect investors from potential losses. Loan funds also manage their risk by knowing their clients, frequently moni-toring their portfolio, and offering substan-
tial training and technical assistance both before and after the loan closing. Even so, the trouble in the economy and credit markets greatly affected portfolio perfor-mance in FY 2008. Delinquencies greater than 90 days were 4.4%, up from 3.3% in FY 2007 and 2.9% in FY 2006. Net charge-offs were 1.22%, up from 0.84% in FY 2007. This is the first time since FY 2003 that net charge offs were not below 1% (see Figure 3).
Thirty-four (25%) loan funds experienced no net loan losses in FY 2008 or had net recoveries; eleven (8%) had net loan loss rates greater than 10%. Loss rates vary among different types of loan funds. The weighted average net charge-off (net loan loss) rate for loan funds with a primary activity of business or microenterprise—relatively high-risk lending—was 3.1% (4.3% average), while the weighted average rate for loan funds with a primary focus of housing or community facilities—relatively low-risk activities—was 0.8% (1.3% average). CDLFs reserve more than
Jack and Fonda Gross are the owners and operators of Jack’s IGA, a full-service grocery store in Lee County, Kentucky. With 25 employees, Jack’s IGA is a major employer in the community and one of only two grocery stores in the area.
In August 2009, the Grosses lost everything in a fire that gutted a busy block of their town where Jack’s IGA, a department store, and the office of a weekly newspaper were all located. Undeterred, the Grosses resolved not only to rebuild Jack’s IGA, but to improve it. They used their insurance benefit to rebuild on the same location, add 1,000 square feet and a deli, and expand production capabilities.
MACED shared information on energy saving opportunities and extended a loan of $400,000 in January 2010. The loan financed several measures that would reduce the store’s energy use and operating costs, including the installation of high efficiency overhead lighting, higher levels of thermal insulation in block walls and beneath the roof, insulated windows and rolling doors, and a waste heat recovery system attached to the central refrigeration system to be used for space and water heating. Says Jack, “We’ve got to reduce costs to stay competitive in the future. Our
energy savings will reduce our operating expenses—and that’s a big deal in the grocery business.” Estimated savings from the upgrades total 2,045 MMBtu (a measure of energy) and $34,000 in reduced utility bills annually.
“This is just a great opportunity that lots of people I’ve talked to in the industry are interested in,” says Jack. “Most grocery stores in the area are older buildings that are really inefficient. Getting money for independent grocers to help them remodel and implement energy efficiency measures offers so many ways to save money! Increasing energy efficiency is a big opportunity and a great need for us to improve our bottom line.”
The mission of the Mountain Association for Community Economic Development (MACED) is to work with people in eastern Kentucky and Central Appalachia to create economic opportunity, strengthen democracy, and support the sustainable use of natural resources.
Energy Efficiency Financing Lee County, KY
Featuring MACED
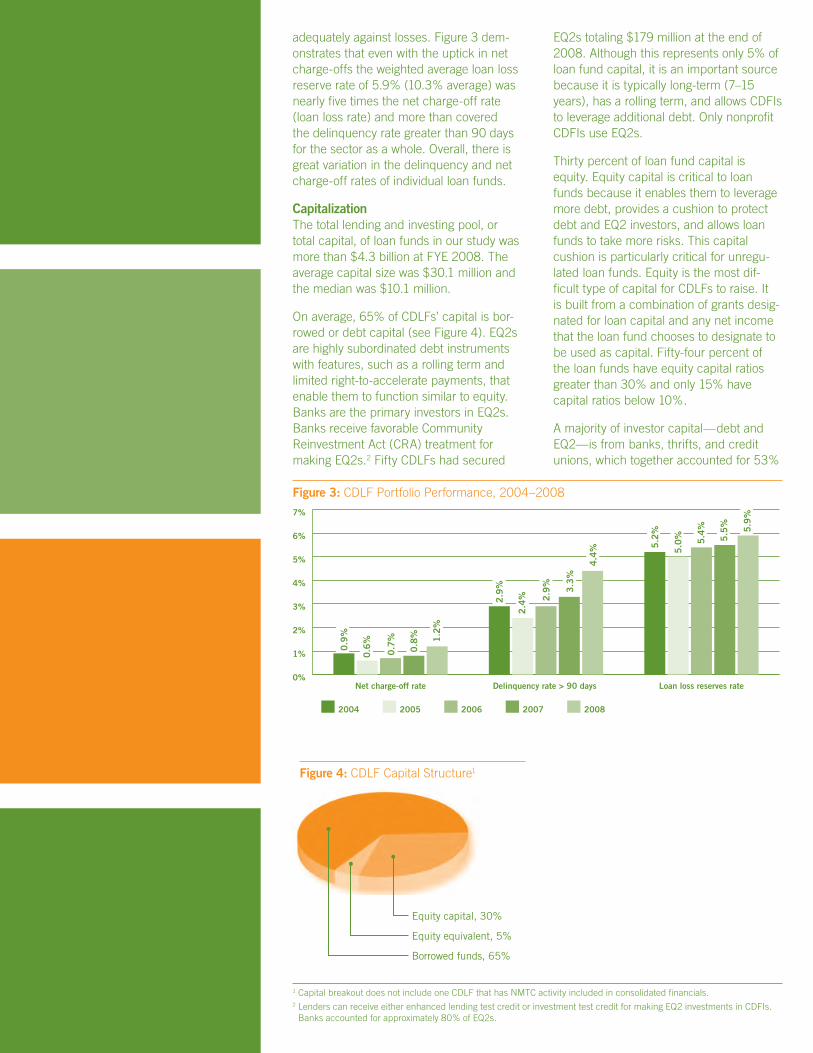
adequately against losses. Figure 3 dem-onstrates that even with the uptick in net charge-offs the weighted average loan loss reserve rate of 5.9% (10.3% average) was nearly five times the net charge-off rate (loan loss rate) and more than covered the delinquency rate greater than 90 days for the sector as a whole. Overall, there is great variation in the delinquency and net charge-off rates of individual loan funds.
CapitalizationThe total lending and investing pool, or total capital, of loan funds in our study was more than $4.3 billion at FYE 2008. The average capital size was $30.1 million and the median was $10.1 million.
On average, 65% of CDLFs’ capital is bor-rowed or debt capital (see Figure 4). EQ2s are highly subordinated debt instruments with features, such as a rolling term and limited right-to-accelerate payments, that enable them to function similar to equity. Banks are the primary investors in EQ2s. Banks receive favorable Community Reinvestment Act (CRA) treatment for making EQ2s.2 Fifty CDLFs had secured
EQ2s totaling $179 million at the end of 2008. Although this represents only 5% of loan fund capital, it is an important source because it is typically long-term (7–15 years), has a rolling term, and allows CDFIs to leverage additional debt. Only nonprofit CDFIs use EQ2s.
Thirty percent of loan fund capital is equity. Equity capital is critical to loan funds because it enables them to leverage more debt, provides a cushion to protect debt and EQ2 investors, and allows loan funds to take more risks. This capital cushion is particularly critical for unregu-lated loan funds. Equity is the most dif-ficult type of capital for CDLFs to raise. It is built from a combination of grants desig-nated for loan capital and any net income that the loan fund chooses to designate to be used as capital. Fifty-four percent of the loan funds have equity capital ratios greater than 30% and only 15% have capital ratios below 10%.
A majority of investor capital—debt and EQ2—is from banks, thrifts, and credit unions, which together accounted for 53%
1 Capital breakout does not include one CDLF that has NMTC activity included in consolidated financials.2 Lenders can receive either enhanced lending test credit or investment test credit for making EQ2 investments in CDFIs.
Banks accounted for approximately 80% of EQ2s.
20082007200620052004
0%
1%
2%
3%
4%
5%
6%
7%
Loan loss reserves rateDelinquency rate > 90 days Net charge-off rate
0.9
%
0.6
%
0.7
%
0.8
% 1.2
%
2.9
%
2.4
% 2.9
%
3.3
%
4.4
% 5.2
%
5.0
% 5.4
%
5.5
% 5.9
%
Figure 3: CDLF Portfolio Performance, 2004–2008
Equity capital, 30%
Equity equivalent, 5%
Borrowed funds, 65%
Figure 4: CDLF Capital Structure1

of borrowed funds and EQ2 (see Figure 5). Financial institutions have consistently been the largest source of capital among loan funds. Loan funds are safe investment vehicles and flexible partners for banks. In addition, banks can receive CRA credit for their investments in loan funds. As fewer banks are willing to lend to CDLFs at below-market fixed rates, more CDLFs are using traditional financial products to capi-talize and manage liquidity; these products include lines of credit at floating rates, repurchase agreements, and interest rate swaps and other derivative products.
Another key source of loan fund capital for CDLFs is foundations, which account for 10% of total investor capital. Some founda-tions offer below-market, long-term loans called program-related investments (PRIs). In FY 2008, 72 loan funds in our study derived $238 million from foundations.
Public sources are also significant. Eight percent of capital is provided by federal government and 7% by state sources. CDLFs draw from several federal pro-grams to capitalize their loan pools.
Opportunity Finance Network’s 2008 publication Attracting Federal Funds for Opportunity Finance reports that, after the CDFI Fund’s Financial Assistance and Technical Assistance Program, the federal programs ranked most beneficial to CDFIs are the Department of Housing and Urban Development’s Community Development Block Grants, the CDFI Fund’s New Markets Tax Credit Program, the Small Business Administration’s Microloan Program, and the U.S. Department of Agriculture’s Intermediary Relending Program.3
Other key sources of investor capital are nondepository financial institutions and religious institutions. Although such inves-tors account for only 7% and 3%, respec-tively, of loan fund investor capital, they are important long-term sources of capital for CDLFs. Religious investors represent some of the first supporters of CDLFs and helped found many of the organizations.
0% 10% 20% 30% 40% 50% 60%
Individuals
Other
Corporations
Religious institutions
National intermediaries
State government
Nondepository financial institutions
Federal government
Foundations
Banks, thrifts, and credit unions
2%
3%
3%
3%
4%
7%
7%
8%
10%
53%
Figure 5: CDLFs’ Investor Capital Sources4
3 http://opportunityfinance.net/store/downloads/Attracting_FedFunds_012709.pdf4 One outlier is excluded from the capital sources breakout.

Notes

Notes

The CDFI Data ProjectThe CDFI Data Project (CDP) is an industry collaborative that produces data about CDFIs. The goal of the CDP is to ensure access and use of data to improve practice and attract resources to the CDFI field. The CDP collected FY 2008 data on 496 CDFIs. The data set includes approximately 40 data points on operations, financing, capitalization, and impact. Supported bythe John D. and Catherine T. MacArthur Foundation, this initiative convenes leading organizations in the CDFI industry.
Partner Organizations> Aspen Institute
www.fieldus.orgNational nonprofit that disseminates best practices and educates policymakers, funders, and others about microenterprise
> Association for Enterprise Opportunitywww.microenterpriseworks.orgNational member-based trade association of more than 500 microenterprise development programs
> Coalition of Community Development Financial Institutionswww.cdfi.orgLead organization in the United States that promotes the work of CDFIs
> Community Development Venture Capital Alliancewww.cdvca.orgCertified CDFI intermediary that serves community development venture capital funds through training, financing, consulting, research, and advocacy
> National Community Investment Fundwww.ncif.orgCertified CDFI that channels equity, debt, and information to locally owned banks, thrifts, and selected credit unions with a primary purpose of community development
> National Federation of Community Development Credit Unionswww.cdcu.coopCertified CDFI intermediary that serves more than 200 low-income credit unions across the United States
> Opportunity Finance Networkwww.opportunityfinance.netThe leading network of private financial intermediaries with a proven expertise in lending prudently and productively in unconventional markets often overlooked by conventional financial institutions.
For more information on the CDFI Data Project, contact any of the partner organizations or Jumana Poonawala of Opportunity Finance Network at [email protected] (215.320.4316).
Community Development Microenterprise Financing
Providing Capital
Building Communities
Creating ImpactFiscal Year 2008
Community development financial institu-tions (CDFIs) offer microenterprise devel-opment services in order to implement a variety of civic goals, including poverty reduction and the economic empow-erment of traditionally disadvantaged populations, the development of entre-preneurial skills and the seeding of new industries, and place-based economic development strategies.
According to statistics compiled by the Association for Enterprise Opportunity, the trade association for microenterprise devel-opment in the United States, there were 24.9 million businesses with five or fewer employees in the United States in 2006. These businesses accounted for approxi-mately 88 percent of all business estab-lishments.3 The Aspen Institute estimates that 10 million owners of these very small businesses are individuals who face barriers to mainstream financial and business devel-opment services. This group is composed largely of women, people of color, ethnic minorities, the disabled and individuals on public assistance, who are interested in starting a business.4
It is estimated that, in FY2008, 696 microenterprise programs assisted 274,128 individuals.5 The majority of clients are women (57 percent), people of color or members of traditionally disadvantaged racial or ethnic groups (53 percent), and low- and moderate-income6 individuals (57 percent).7 In the last industry-wide census of microenterprise activity, at least 43 percent of individuals assisted were below 150 percent of the U.S. Department of Health and Human Services (HHS) poverty guideline at intake.8
What assistance do business owners receive? Microenterprise development programs typically offer a variety of services to help clients grow their businesses. Business training and technical assistance, used to expand managerial skills, are the most commonly offered and utilized services across the field. Virtually all microenterprise clients receive some form of training or technical assistance. Because CDFIs have a lending focus, nearly all of the organiza-tions in this dataset offered loans. However, according to an industry-wide assessment of the domestic microenterprise industry, lending is offered by two-thirds (68 per-
cent) of programs nationwide.9 In FY2008, microentrepreneurs received an average microenterprise loan of $8,952, with loan amounts ranging from approximately $214 to $35,000.10
CDFIs and Microenterprise Microlending is a reported activity of many CDFIs and for some it is a significant focus of their efforts. Of the 305 CDFIs that reported a breakout of their financing out-standing, 33 percent (100 CDFIs) reported microenterprise financing in FY2008.11 The total microenterprise portfolio of this group of 100 CDFIs was $114.5 million. Extrapolated data from the FIELD Program’s microenterprise field-wide survey estimates the total outstanding portfolio of all micro-lenders in FY2008 to be $173.6 million.12
While the average microenterprise portfolio at the end of FY2008 was $1,145,453, the range in the size of microenterprise port-folios in this group was very broad, from a low of $3,532 to a high of over $16 million. Thirty-three CDFIs held at least $1 million in microenterprise financing.
Table 1 distributes the 100 CDFIs engaged in microenterprise financing according to the size of their microenterprise portfolio.
1 Association for Enterprise Opportunity, the trade association for microenterprise in the United States. 2 The CDP authors would like to thank Ilgar Alisultanov for his assistance in analyzing the CDP FY2008 dataset for this chapter. 3 Association for Enterprise Opportunity, available from http://www.microenterpriseworks.org/microenterpriseworks/files/ccLibraryFiles/Filename/000000001328/US-MEBS-2006.pdf;
Internet. 4 Elaine L. Edgcomb and Joyce A. Klein, Opening Opportunities, Building Ownership: Fulfilling the Promise of Microenterprise in the United States. (Washington, D.C.: The Aspen Institute/
FIELD, February 2005). 5 Extrapolations are based on the field-wide survey data collected by the FIELD Program. An attempt was made to contact all microenterprise development organizations (MDOs) currently
operating in the United States. There were 696 programs and 369 responded to the survey. To account for non-response, we employ a traditional weighting class adjustment technique. Because of limited Intake information only two variables, state and whether the program offered microloans, are used to create the weighting cells. Programs in the weighting cells are assumed to be homogenous. Because this is a census and the base weights are one, final respondent weights are calculated by taking the inverse of the response rate within each cell. A weight of zero is assigned to non-respondents.
6 Eighty percent of regional medians as defined by the U.S. Department of Housing and Urban Development (HUD). 7 Field-Wide Survey Data Highlights FY2008 Data (Washington, D.C.: The Aspen Institute/FIELD, 2010); 2-3; available from http://fieldus.org/Publications/HighlightsFY2008.pdf; Internet. 8 Field-Wide Survey Data Highlights, 3. 9 Field-Wide Survey Data Highlights, 3.10 MicroTest FY2008 data; MicroTest, an initiative of FIELD, is a management tool that empowers microenterprise practitioners to gauge and improve the performance of their programs and
the outcomes of their clients. The MicroTest performance framework, developed through a collaborative effort with industry practitioners, has been used by more than 154 microenter-prise organizations since 1997.
11 These figures are based on all CDFIs reporting at least $1 outstanding in microfinancing at the end of FY2008.12 Extrapolations are based on the field-wide survey data collected by the FIELD Program.
Microenterprises are defined as businesses with five or fewer employees, with capital requirements of up to $35,000 in order to start up or expand, and whose owners do not have access to mainstream commercial banking services.1,2
Community Development Microenterprise Financing
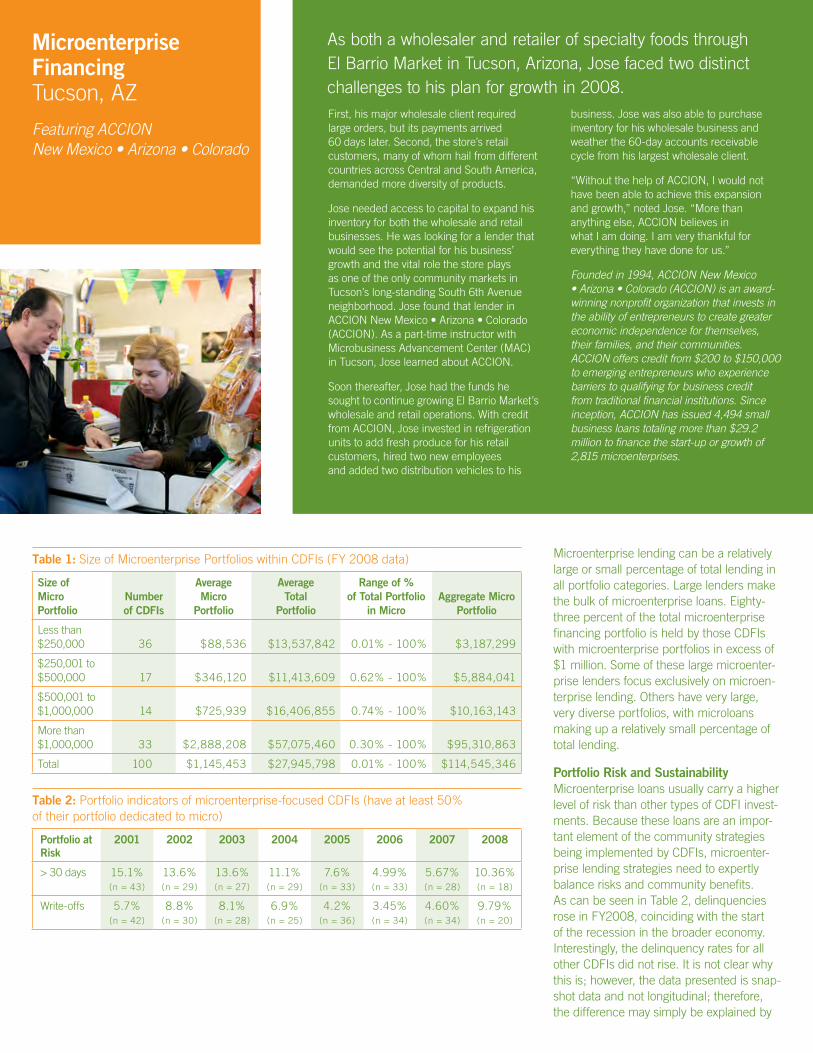
Microenterprise lending can be a relatively large or small percentage of total lending in all portfolio categories. Large lenders make the bulk of microenterprise loans. Eighty-three percent of the total microenterprise financing portfolio is held by those CDFIs with microenterprise portfolios in excess of $1 million. Some of these large microenter-prise lenders focus exclusively on microen-terprise lending. Others have very large, very diverse portfolios, with microloans making up a relatively small percentage of total lending.
Portfolio Risk and Sustainability Microenterprise loans usually carry a higher level of risk than other types of CDFI invest-ments. Because these loans are an impor-tant element of the community strategies being implemented by CDFIs, microenter-prise lending strategies need to expertly balance risks and community benefits. As can be seen in Table 2, delinquencies rose in FY2008, coinciding with the start of the recession in the broader economy. Interestingly, the delinquency rates for all other CDFIs did not rise. It is not clear why this is; however, the data presented is snap-shot data and not longitudinal; therefore, the difference may simply be explained by
Microenterprise Financing Tucson, AZ
Featuring ACCION New Mexico • Arizona • Colorado
As both a wholesaler and retailer of specialty foods through El Barrio Market in Tucson, Arizona, Jose faced two distinct challenges to his plan for growth in 2008. First, his major wholesale client required large orders, but its payments arrived 60 days later. Second, the store’s retail customers, many of whom hail from different countries across Central and South America, demanded more diversity of products.
Jose needed access to capital to expand his inventory for both the wholesale and retail businesses. He was looking for a lender that would see the potential for his business’ growth and the vital role the store plays as one of the only community markets in Tucson’s long-standing South 6th Avenue neighborhood. Jose found that lender in ACCION New Mexico • Arizona • Colorado (ACCION). As a part-time instructor with Microbusiness Advancement Center (MAC) in Tucson, Jose learned about ACCION.
Soon thereafter, Jose had the funds he sought to continue growing El Barrio Market’s wholesale and retail operations. With credit from ACCION, Jose invested in refrigeration units to add fresh produce for his retail customers, hired two new employees and added two distribution vehicles to his
business. Jose was also able to purchase inventory for his wholesale business and weather the 60-day accounts receivable cycle from his largest wholesale client.
“Without the help of ACCION, I would not have been able to achieve this expansion and growth,” noted Jose. “More than anything else, ACCION believes in what I am doing. I am very thankful for everything they have done for us.”
Founded in 1994, ACCION New Mexico • Arizona • Colorado (ACCION) is an award-winning nonprofit organization that invests in the ability of entrepreneurs to create greater economic independence for themselves, their families, and their communities. ACCION offers credit from $200 to $150,000 to emerging entrepreneurs who experience barriers to qualifying for business credit from traditional financial institutions. Since inception, ACCION has issued 4,494 small business loans totaling more than $29.2 million to finance the start-up or growth of 2,815 microenterprises.
Table 1: Size of Microenterprise Portfolios within CDFIs (FY 2008 data)
Size of Micro Portfolio
Number of CDFIs
Average Micro
Portfolio
Average Total
Portfolio
Range of % of Total Portfolio
in MicroAggregate Micro
Portfolio
Less than$250,000 36 $88,536 $13,537,842 0.01% - 100% $3,187,299
$250,001 to $500,000 17 $346,120 $11,413,609 0.62% - 100% $5,884,041
$500,001 to $1,000,000 14 $725,939 $16,406,855 0.74% - 100% $10,163,143
More than $1,000,000 33 $2,888,208 $57,075,460 0.30% - 100% $95,310,863
Total 100 $1,145,453 $27,945,798 0.01% - 100% $114,545,346
Table 2: Portfolio indicators of microenterprise-focused CDFIs (have at least 50% of their portfolio dedicated to micro)
Portfolio at Risk
2001 2002 2003 2004 2005 2006 2007 2008
> 30 days 15.1% (n = 43)
13.6% (n = 29)
13.6% (n = 27)
11.1% (n = 29)
7.6% (n = 33)
4.99% (n = 33)
5.67% (n = 28)
10.36% (n = 18)
Write-offs 5.7% (n = 42)
8.8% (n = 30)
8.1% (n = 28)
6.9% (n = 25)
4.2% (n = 36)
3.45% (n = 34)
4.60% (n = 34)
9.79% (n = 20)
The CDFI Data ProjectThe CDFI Data Project (CDP) is an industry collaborative that produces data about CDFIs. The goal of the CDP is to ensure access and use of data to improve practice and attract resources to the CDFI field. The CDP collected FY 2008 data on 495 CDFIs. The data set includes approximately 40 data points on operations, financing, capitalization, and impact. Supported bythe John D. and Catherine T. MacArthur Foundation, this initiative convenes leading organizations in the CDFI industry.
Partner Organizations> Aspen Institute
www.fieldus.orgNational nonprofit that disseminates best practices and educates policymakers, funders, and others about microenterprise
> Association for Enterprise Opportunitywww.microenterpriseworks.orgNational member-based trade association of more than 500 microenterprise development programs
> Coalition of Community Development Financial Institutionswww.cdfi.orgLead organization in the United States that promotes the work of CDFIs
> Community Development Venture Capital Alliancewww.cdvca.orgCertified CDFI intermediary that serves community development venture capital funds through training, financing, consulting, research, and advocacy
> National Community Investment Fundwww.ncif.orgCertified CDFI that channels equity, debt, and information to locally owned banks, thrifts, and selected credit unions with a primary purpose of community development
> National Federation of Community Development Credit Unionswww.cdcu.coopCertified CDFI intermediary that serves more than 200 low-income credit unions across the United States
> Opportunity Finance Networkwww.opportunityfinance.netThe leading network of private financial intermediaries with a proven expertise in lending prudently and productively in unconventional markets often overlooked by conventional financial institutions.
For more information on the CDFI Data Project, contact any of the partner organizations or Jumana Poonawala of Opportunity Finance Network at [email protected] (215.320.4316).
Table 3: Delinquency Data
Microenterprise- Focused CDFIs14 Other Loan Funds and Banks
FY2008
>30 days late** FY2008 10.36% 3.80%
>91 days lateFY2008
5.70%* 0.92%
Average Outstanding Portfolio FY2008
$3,559,264(n=1815)
$110,790,106(n=113)
FY2007
> 91 days lateFY2007
2.59% 3.35%
Average Outstanding Portfolio FY2007
$3,739,483(n=2816)
$26,690,301(n=101)
FY2006
>91 days lateFY2006
2.42% 2.60%
Average Outstanding Portfolio FY2006
$3,024,769(n=33)
$28,908,505(n=82)
*Delinquencies as a percentage of total financing outstanding.
**Includes delinquencies that are included in the > 91 row.
Table 4: Microenterprise Lending Program Sustainability17
Operational Self-Sufficiency (OSS)
FY 2001
FY 2002
FY 2003
FY 2004
FY 2005
FY 2006
FY 2007
FY 2008
Mean 36% 36% 39% 40% 43% 46% 49% 33%
Median 21% 16% 19% 20% 21% 19% 22% 16%
n 48 56 49 44 43 38 35 30
Average OSS Among Top Performers18
59% (n = 10)
52% (n = 11)
56% (n = 10)
41% (n = 8)
74% (n = 8)
81% (n = 7)
75% (n = 7)
57% (n = 6)
Note: Some indicators may differ from previous publications due to updated information.
13 Operational self-sufficiency is defined as total income from loan fund/total credit program operating expenses. The credit program operating expenses do not include interest paid on borrowed loan capital or the amount of loans reserved or charged off in a given year.
14 At least 50 percent of the portfolio is outstanding to microenterprises. 15 Out of 20 microenterprise-focused CDFIs, 18 reported complete delinquency data.16 Out of 34 microenterprise-focused CDFIs, 28 reported complete delinquency data.17 MicroTest data.18 Top 20 percent of programs in OSS.
which programs reported in the various years. (See Table 3.)
Because of their size, risk, and pricing for charitable purposes, the income earned from microenterprise loans rarely covers the costs of origination, collection and manage-ment. In addition, many microenterprise lenders support their lending with training and technical assistance in business and financial management. Ongoing public and charitable investment is needed to serve this market. And while some programs have implemented innovations in program
efficiency, pricing, and scale that led to increased performance in rates of opera-tional self-sufficiency13, we see a worsening of self-sufficiency rates in FY2008. While the data presented is snapshot and not lon-gitudinal data, the FY2008 cohort appears less sustainable than previous cohorts. This may be a function of lower revenues due to several factors; worsening portfolio perfor-mance and increased expenditures due to greater monitoring of portfolio performance and work with clients. (see Table 4).