community food assessment - oregon food bank thornberry sara miller . oregon food bank ... when the...
TRANSCRIPT

Community Food Assessment
Wallowa County

2
Assessment Team
Author Graphic Design
Joshua Russell Joshua Russell
RARE AmeriCorps
Advisors Editorial Team
Sharon Thornberry Sara Miller
Oregon Food Bank NEOEDD
Sara Miller Megan Newell-Ching
Northeast Oregon Oregon Food Bank
Economic Development
District (NEOEDD)

3
Acknowledgements
To all of Wallowa County: Thank you for taking the time to share the information
that has served to inform this assessment. The Wallowa County Community Food
Assessment is dedicated to those individuals working tirelessly to improve the local
food system. Your work is truly inspiring.

4
Foreward
When the first settlers came to Oregon they were amazed by the rich soil, abundant water
supply and even the islands of productivity in Oregon‟s deserts. They were thrilled with the
crops, fruits and berries they were able to raise, the rich pastureland as well as the streams
teaming with fish and the bounty of wild game available to feed a growing population. It would
have been impossible for them to believe that anyone could be hungry or food insecure in this
land of plenty. It is incredible that hunger and food insecurity abound in Oregon nearly two
centuries later. In fact, many of the areas that seemed so bountiful to those early settlers now
have the least access to food today.
Four years ago Oregon Food Bank in partnership with University of Oregon RARE program
began to conduct community food assessments in some of Oregon‟s rural counties. Very few
community food assessment efforts have been undertaken in rural America with a county by
county approach. The report you are about to read is a result of conversations with the peo-
ple who make Oregon‟s rural communities and their food systems so very unique. These re-
ports are also a gift from a small group of very dedicated young people who have spent the
last year listening, learning and organizing. It is our sincere hope, that these reports and orga-
nizing efforts will help Oregonians renew their vision and promise of the bountiful food system
that amazed those early settlers.
Sharon Thornberry
Community Resource Developer
Oregon Food Bank

5
Assessment Team……………………………………………………………….....................
Acknowledgements………………………………………………………................................
Foreward……………………………………………………………………………..............
Table of Contents...................................................................................................................................
Preface.......................................................................................................................................................
Development of the Assessment........................................................................................................
Introduction.............................................................................................................................................
I. Local Food Production and Processing
Historical Background of Food Production in Wallowa County...................................
Current Statistical Data.............................................................................................
Livestock Production..................................................................................................
Profile: 6 Ranch..............................................................................................
Vegetable Production...............................................................................................................
Profile: Bear Creak Farms...........................................................................
Processing Introduction...........................................................................................................
Regulatory Challenges................................................................................................
Commercial Shared-Use Kitchens..........................................................................
Oregon Farm Direct Bill..............................................................................
After the Harvest........................................................................................................
Opportunities for Local Food Production and Processing..............................................
II. Consumer Access and Food Availability
Consumer Access Introduction.............................................................................................
Consumer Demographics.......................................................................................................
Highlights from the Wallowa County Consumer Food Access Survey.........
Points of Food Access..............................................................................................................
Grocery Stores............................................................................................................
Rural Grocery Store Owner Survey.........................................................
Restaurants...................................................................................................................
Farmers‟ Markets.........................................................................................................
Profile: Wallowa County Farmers‟ Market Association......................
Farm Stands..................................................................................................................
Profile: June‟s Local Market.........................................................................
Community Supported Agriculture.......................................................................
Table of Contents
2
3
4
5
7
8
9
10
11
11
12
14
15
16
17
18
18
21
22
23
24
24
28
29
29
30
31
32
32
33
34

6
Community Gardens................................................................................................
Food In Schools.......................................................................................................................
Profile: Magic Garden.................................................................................
Emergency Food Services......................................................................................................
Profile: Community Connection..............................................................
Food Waste..............................................................................................................................
Opportunities for Consumer Access and Food Availability..........................................
III. Community Food System Development Efforts
Introduction..............................................................................................................................
FEAST.........................................................................................................................................
Wallowa County Food System Council.............................................................................
Slow Food Wallowas..............................................................................................................
Northeast Oregon Economic Development District.....................................................
Profile: Northeast Oregon Regional Collaborative.............................
Opportunities for Community Food System Development Efforts............................
Works Cited.......................................................................................................................................
Appendix A: Wallowa County Consumer Food Access Survey
Appendix B: Rural Grocery Survey
Appendix C: Ken Meter Report on Agriculture in Wallowa County
Appendix D: Table on Commercial Shared-Use Kitchens
Table of Contents
34
35
36
37
37
38
39
40
40
41
42
42
43
44
45

7
In the spring of 2005, a group of 23 Wallowa County residents met to discuss their interest in
improving the local food system. Around the table were potato growers, market farmers, cattle
and sheep ranchers, egg and poultry farmers, gleaners, community organizers and other people
concerned about hunger, health and local food. The three key topics were Food Access and
Availability, Awareness and Marketing of Local Food, and Support for Ongoing Food System
Development efforts. The group came up with an ambitious list of initiatives and prioritized the
ones they wanted to accomplish in the short term. Among the milestones achieved in those
first years were:
· Creation of a list serve for people wanting to network, share resources, and collaborate
· Publishing the first three years of Wallowa County food and farm directories
· A Community Harvest Dinner feeding over 250 people with local & regional food
· Articles and press coverage of local food issues and activities
Although the group scattered after a few years, when I look back at the list of potential activi-
ties from that first meeting, I‟m amazed at how many of the project ideas are currently part of
renewed food system development efforts in Wallowa County and NE Oregon:
· Food Policy Council
· USDA Meat Processing facilities
· Cooperative marketing, linking food production and tourism
· Nutrition education and working with the schools
· Certification and Niche Marketing
· Co-op store supplying locally grown food
· Farmers Market support and expansion
· Buy Local Campaign
· Farm to School Program
One activity the group thought was needed was a Community Food Assessment. The group felt
an assessment would be “a good place to start,” by helping answer the question: What kind of
food system to do we have now? I‟m happy to say that after 7 years, Wallowa County is finally
getting a Community Food Assessment (CFA).
In 2011, the Northeast Oregon Economic Development District applied for an AmeriCorps
volunteer through the University of Oregon RARE program. With funding support from the
Oregon Food Bank, we were able to bring Joshua Russell on board to help organize the Food
System Council and complete a CFA for Wallowa County. The document Joshua presents here
is the result of countless hours of outreach, interviews, networking and research. My hope is
that all of us interested in improving access to local food can honor this work by taking action
on what we‟ve learned, by working „better together‟ to keep the many excellent efforts going
and find ways to create even more positive change in our communities.
Sara Miller
Economic Development Specialist, NEOEDD
Preface

8
The Wallowa County Food Assessment utilized a mixed method approach that combined both
qualitative and quantitative data. Qualitative data, which forms the basis for this document, was
obtained through formal and informal conversations, interviews, and group meetings. Quantita-
tive data includes primary data in the form of two surveys along with numerous secondary
sources. Considering the limited understanding of the food system in Wallowa County there
was very little pre-existing data or research to draw upon to inform this work. The Community
Food Assessment is the first project in Wallowa County that takes a broad, community-based
approach toward examining the local food system.
A consumer survey and rural grocery store owner survey were completed for this report. The
Wallowa County Consumer Food Access Survey was administered between February and April
2012. Survey Participants had numerous access points in which to complete the survey. Paper
copies were distributed at the following locations: Department of Human Services, Building
Healthy Families, Community Connection, Wallowa Senior Center, The Bookloft, Gypsy Java,
and The Blonde Strawberry. Digital copies were also made available via links on the Northeast
Oregon Economic Development District‟s webpage and Facebook profile. In total 133 re-
sponses were collected. This survey was designed to provide the author with the insights of
local consumers regarding food accessibility, affordability, and food acquisition habits.
The second survey completed for this assessment was a Rural Grocery Store Owner Survey,
developed by Kansas State University‟s Center for Engagement and Community Development.
The intention of this survey is to provide quantifiable data regarding the perspective of rural
grocery store owners. Seven rural grocery stores participated in this survey. These stores
represent all but one of the primary food retail establishments in Wallowa County.
This Community Food Assessment is intended to serve as the first step in understanding the
highly complex set of interactions that bring food from the farm to our tables. Additionally this
report should serve to identify the many assets and needs of the community food system in
Wallowa County, though is undoubtedly limited in its depth and scope. It is the author‟s hope
that community members reading this will feel empowered to add and amend as necessary. This
is a working document and should be treated as such. Continued efforts to identify our assets,
needs and potential solutions will better inform actions to improve our community food sys-
tem.
Development of the Assessment

9
Wallowa County, which encompasses 3,146 square miles, is located in the Northeast corner of
Oregon. This county contains a stunning amount of geographical relief, much of which has
served to shape the culture of those who live here. The Eagle Cap Wilderness, Oregon‟s larg-
est wilderness area, is located in the southern section of the county. To the east one can see
Hell‟s Canyon, where the Snake River runs its course to the Columbia. Moving westward from
Hell‟s Canyon you will find numerous smaller canyons striating the landscape of the eastern and
northern portions of Wallowa County. In these canyons the Nez Perce spent their winters
away from the higher elevations where long, harsh winters played out across the landscape,
shaping both the land and its inhabitants.
The forces of water and ice have been the chief architects in creating this wondrous and dy-
namic landscape; one only has to look at the expertly shaped moraine of Wallowa Lake, or the
dynamic inverse relief of Joseph Canyon to understand the scope and grandeur of this work.
To simply gaze up toward the canyon walls from the banks of the Imnaha River leaves the ob-
server with the sense that he is laying his eyes upon a scene that is both ancient and new.
The earliest inhabitants relied upon the abundant natural resources present in Wallowa County
to sustain their populations. The food system was almost entirely localized, a necessity due to
the isolation of this area. In 2012 we see a very different story with regard to the food system,
not only of Wallowa County, but also in nearly every other rural area in the United States. No
longer are communities producing, processing, and distributing locally the majority of food that
their residents consume. We now participate in a global food system that has largely removed
small and medium scale family farms from the picture.
According to a 2011 Wallowa County Local Farm & Food Economy report prepared by Ken
Meter, of the Crossroads Resource Center, 88% of all food purchased by Wallowa County
consumers comes from outside the County. Wallowa County consumers spend $18 million
buying food each year (including $11 million for home use) of which $16 million is produced
outside the County. At the same time, Wallowa County farmers lose $10 million each year
producing food commodities sold mainly outside the area, and purchase $17 million of inputs
(feed, fuel, supplies, etc.) sourced outside the county.
A Community Food Assessment is defined as being a “Collaborative and participatory process
that systematically examines a broad range of community food issues and assets, so as to inform
change actions to make the community more food secure.” (Pothukuchi, Joseph, Burton, &
Fisher, 2002) This assessment is intended to provide a broad snapshot of the entire food sys-
tem of Wallowa County. Additionally this assessment will serve as the foundation from which a
strategic plan for community food system development can be produced.
Introduction

10
Production
Historical Background and Overview
Agriculture has been, and continues to be, an integral component to the landscape and culture
of this area. The Nez Perce (Nee-Me-Poo) grazed horses and cattle for hundreds of years in
and around Wallowa County. The Tribe recognized the value of the unique topography, and
used this to their advantage by grazing their animals at different elevations according to the sea-
son. As an added effect, the steep pitch of the canyon walls and rimrock act as natural fencing
that help to control grazing. Many ranchers utilize these same grazing patterns today. Cattle
are grazed at lower elevations during the winter, and then are gradually brought up to higher
elevations as springtime takes effect. (OSU: 2009)
The Wallowa Valley contains the major incorporated townships of Wallowa and Lostine in
what is referred to as the Lower Valley, and Enterprise and Joseph that are situated in the Up-
per Valley. The valley also serves as the primary area for crop production. Wheat, barley, and
most prominently hay, have been the primary commodity crops grown in the Wallowa valley.
Clover and canola have served as rotational crops on a much smaller scale. It should be noted
that areas such as Troy and Imnaha are located at a much lower elevation and feature unique
microclimates that allow for the production of items, such as tomatoes and stone fruits, that do
not fare well in the upland areas. These lower elevation areas also possess the added benefit of
having a longer growing season. However, some of these locations are prone to flooding, and
due to the steep topography have limited areas that can be cultivated without extensive land-
scaping.
According to the USDA Census of Agriculture, the number of farms, acreage in farming and
sales of farm products increased from 2002 to 2007. The 2007 Census shows 524 farms
Local Food Production and Processing

11
occupying 526,000 acres of land with a total of $32 million dollars worth of crop and livestock
sales. This compares to 518 farms occupying 518,100 acres with total crop and livestock sales
of $21 million in 2002.
Livestock Production
Cattle and calves are the primary farm products of Wallowa County comprising 68% of farm
sales in 2007, and in this same year their sales totaled approximately $19 million. (USDA: 2007).
Wallowa County in particular has been a prime area for the emergence of grass fed beef pro-
duction due much in part to the qualities exhibited by the native forage that is found here,
though it must be noted that this method does not constitute the majority of beef production
in the county. That distinction goes to commodity beef production. In 2010 Sara Miller, of the
Northeast Oregon Economic Development District, produced a report that examined the po-
Wallowa County Agriculture –USDA Census of Agriculture
Numbers of Farms 2007 Numbers of Farms 1997 Products Produced
240 288 Beef cattle
227 239 Forage crops, hay, etc.
56 Not Available Grains, oil seeds, edible beans
54 40 Horses and ponies
53 68 Sheep, goats and lambs
36 22 Laying hens, eggs
16 54 Vegetables
10 20 Dairy cattle
9 22 Hogs and pigs
3 Not Available Aquaculture
2 5 Orchards, fruit, nuts, berries
1 6 Broilers

12
tential for locally produced grass-fed artisan beef products in regional markets. The report
noted that the demand for such products continues to grow, however barriers such as a lack of
processing and distribution elements place constraints on how much artisanal beef products
from Wallowa County can make it into larger regional markets. (Miller: 2010)
Profile: 6 Ranch
Liza Jane Nichols, owner and operator of the 6 Ranch, is a 4th generation rancher in Wallowa
County. 6 Ranch specializes in the production of
Corriente cattle. Her great grandparents home-
steaded the property in 1884, and their current op-
eration is solely run by Liza Jane and her immediate
family. 6 Ranch has been working exclusively with
Corriente cattle for the past 25 years. Corriente
cattle are much smaller than conventional breeds of
cattle and have a low impact on the land. They
thrive on dry, less palatable feed and require half
the amount water so are well adapted to utilizing
less productive landscapes. 6 Ranch applies the fol-
lowing principles to their beef production:
· They do not administer any vaccinations or antibiotics to their cattle
· They do not use motorized vehicles to move the cattle (only horses and dogs)
· The cattle eat only grass and forbs from start to finish
· They do not apply fertilizers, herbicides or harmful products on their grasses
· They only provide mature animals no less than two years of age for beef sales
In 2008, a sample of their Corriente beef was sent to an independent food science lab for analy-
sis. The results were then compared against sample meat data from the USDA National Nutri-
ent Database.
6 Ranch does not sell their cattle to feed lots, so they are responsible for the marketing of their
beef and setting the price for their product. They offer whole, half, or quarter animals for sale
direct to consumer, and they have some of their beef processed at a USDA facility for retail
sales. 6 Ranch beef products can be found at nearly all of the grocery stores around Wallowa
County, and two restaurants feature 6 Ranch Beef on their menus (Mutiny Brewing in Joseph
6Ranch Corri-
ente beef
Conventional
Beef
Pork (chops) Chinook
Salmon
Grams of Fat 2.2 37.7 10.2 11.8
Cholesterol
(1mg.)
35 87 78 57
Calories 144 416 193 203

13
and Terminal Gravity in Enterprise). They also lease some of their Corriente cattle out for
sport use at rodeos. Because these cattle are registered, they can sell some as seed stock for
others who are trying to develop a herd. In addition to their ranching operation, Liza Jane has a
roadside farm stand located on Highway 82. It is open 24 hours a day and features fresh pro-
duce, honey, duck eggs and Corriente beef from their ranch, as well as products from other
local farmers.
Goats and sheep are raised in Wallowa County, and their by-products are used in a wide range
of applications. Unique breeds of sheep,
such as the Targhee and Wendsleydale
crosses that June Colony is raising, provide
high quality wool. Goat‟s milk is used in the
production of artisan soaps, and is also be-
ing transformed into cheese and yogurt for
personal consumption, though due to cur-
rent regulations the cheese and yogurt
products cannot be sold in local grocery
stores. Local consumer demand for goat or
lamb meat is not high, though two of the
goat producers interviewed for this assess-
ment said that they have either sold wethers for meat in recent years or are planning to sell
goats for consumption this fall.
Egg producers have relatively few obstacles to negotiate in
selling their product compared to those selling meat or
dairy products. An egg handler‟s certification from the
Oregon Department of Agriculture is all they need in or-
der to sell eggs to grocery retailers, institutions, or direct
to consumer. Retail groceries (Ruby Peak Naturals, Mt.
Joseph Family Foods, and The Dollar Stretcher), On-farm
sales, and delivery routes all provide consumers with ac-
cess points to purchase local eggs.
There are fewer individuals in the business of raising chick-
ens for their meat compared to those who raise chickens
primarily for their eggs. Jeff Mathias of Lucky Farm in
Lostine is a local producer and Education Specialist for June‟s Local Market Producer Network.
He is currently raising a breed of chicken that should fare well in the upland areas of the
county, and has broiler chickens for sale on-farm direct to consumer as well as offering USDA
inspected birds at many of the farmers‟ markets in the county. Turkeys and ducks are also
raised locally, neither of which are available as USDA inspected products for purchase at local
retailers, though there are limited amounts of each available for on-farm sales. Chuck and
Karen Benbrook of Double Eddy Farm in Troy are currently producing and selling rabbits farm-
direct.

14
Vegetable Production
The climate of Wallowa County varies greatly in relation to the geography, and farmers have
come to adjust the variety of crops that they produce in accordance with these variations.
Farmers that operate in the Lower and Upper Wallowa Valleys, which are situated between
3,000‟-4,500‟, are capable of producing root crops (ex. potatoes, beets, and parsnips) of out-
standing quality and diversity. Micro greens tend to do well, particularly when grown in a hoop
house or green house. Cucumbers, squash, and carrots are also common vegetables grown in
the Wallowa Valley. The winter is fairly long and harsh in this area of the county, and with
these conditions in mind more and more farmers are looking to incorporate hoop houses and
other season extension technologies into their production methods. Troy and Imnaha lie at an
elevation nearly 2,000‟ lower than that of the
Wallowa Valley. In these areas farmers are able to grow tomatoes, peppers, various orchard
fruits, melons, and corn.
Numerous producers interviewed for this assessment expressed a desire to operate at a pro-
duction level that would allow them to work solely as farmers without having to incorporate off
-farm employment as a supplement to their income. The cost of land suitable for food produc-
tion is largely prohibitive to new and existing small-scale farmers, so in order to elevate their
capital to a level that is needed for such an operation these producers must engage as many
marketing strategies as possible, both locally and regionally. Sales through farmers‟ markets and
grocery stores are effective outlets in which producers can increase consumer access to their
fruits and vegetables, both locally and regionally, though farm direct sales offer the most benefit
to both producer and consumer. Patrick Thiel of Prairie Creek Farms is one such proponent of
direct sales. “The brokerage system really does not serve the producer, rather it really just
serves itself. A brokerage system does not let the consumer choose. In order to offer things
to the public, you need to be more direct, and as a result supply and demand is a real equa-

15
tion.” Speaking on their experiences with selling their products directly to restaurants in Port-
land, Patrick states “What we‟ve learned from collaborative models is that the skills of the chefs
and their engagement through collaboration rather than competition, lead to the presentation
of products that would otherwise not be available to the consumers, and the consumers over-
whelmingly rewarded this effort.” (Thiel: 2012)
Ranchers and farmers in Wallowa County play an important role in the support and develop-
ment of the local food system. Not only do they provide food for those living here, these pro-
ducers are capable of providing additional opportunities for economic development in the
county. Ken Meter states in his 2011 report on Wallowa County food and farm economy that
“If Wallowa County residents purchased 15% of their food for home use directly from county
farmers, this would generate $1.6 million of new farm income for the county annually. This
would require each resident of the county to buy, on average, less than $5.00 of food directly
from farmers each week.” (Meter: 2011)
Profile: Bear Creek Farms
John Linder and Debborah Reth of Wallowa have been producing vegetables from their Bear
Creek Farms site for the past 20 years. June Colony of June‟s Local Market in Lostine provided
the encouragement and technical assistance to help them get started with a greenhouse, and
now Bear Creek Farms is producing some of the highest quality micro greens available in the
area. A 20x50 greenhouse provides micro greens in the winter and then tomatoes, cucumbers,
and peppers in the summer. A 50‟x50‟ deer fenced garden is used for the production of pota-
toes, carrots, and cabbage as well as a variety of other specialty crops. They also have a small
fruit tree orchard on the property. John and Deb soon realized that they were able to produce
far more than they could eat and started looking for outlets for their produce. The Blonde
Strawberry was quick to provide such an outlet, and currently offers Bear Creek Produce for
sale, and features their produce on the food menu.

16
Deb has been a driving force in the development of the Lower Valley Farmers‟ Market in Wal-
lowa, and along with market manager Juanita Rolan, relishes the prospect of increasing access
to locally produced food items. There are plans to expand the scope of educational outreach
and food system infrastructure with the development of a building that Deb recently acquired in
downtown Wallowa. The Telephone building offers a resource library containing information
on all aspects of food production, storage, and marketing, as well as a meeting space and office
area for farmers‟ market managers and other project coordinators working on community food
system development activities.
Processing and Distribution
Introduction
Processing was once a thriving sector of the local economy in Wallowa County. According to
an Oregon Bureau of Labor Statistics census report, there were grain mills in both Wallowa
and Enterprise, and Enterprise had a creamery. (Fourth State of Oregon Biennial Report: 1911)
All of these processing facilities have long been out of operation with little hope of them re-
turning anytime soon. Despite the loss of these facilities, there is a growing interest among lo-
cal producers to have processing facilities re-established in the county, though they may not be
at the scale they once were. Community kitchens are of particular interest, in that they would
provide a space where local producers could process their fruits and vegetables into value-
added products that could be sold in retail establishments. These facilities could also provide
the space needed for fruit and vegetable preparation and packing for gleaning groups.
There are two meat processors and one mobile slaughter unit operating in the county, though
none are USDA certified, which means that none of the local meat that is processed via these
facilities can be sold by the cut to consumers. There are no state or USDA inspected poultry
processing facilities located in the county. State regulations regarding poultry processing have
changed for the better over the last year, such that poultry producers can now slaughter up to

17
1,000 birds per year on farm for sale direct to consumer. Small scale poultry farmers in Wal-
lowa County have access to shared processing equipment in the form of a scalder and plucker,
which are stored at Whitetail Farm. None of the dairies operating in Wallowa County are
Grade A and there has been no change regarding small farm dairy regulations at the state level.
Under the current circumstances non Grade A dairy producers are not allowed to advertise
and may only conduct on-farm sales of fluid milk (ORS 621.012).
Commercial food distribution systems are extremely limited. Restaurants and large grocery
stores rely on a handful of supply chains that bring in food products sourced almost entirely
from outside the County. There are rare exceptions, such as Carman Ranch beef, which is
transported to the west side of the state for USDA processing and then enters the supply chain
through a wholesale distributor serving restaurants in Wallowa County.
Online food ordering is another component of the food distribution system. Azure Standard is
a popular online company that sells natural and organic foods delivered directly to customers
and retailers by semi truck and United Parcel Service. There are two drop points in Wallowa
County as part of Azure Standard‟s regularly scheduled monthly delivery route, one in the up-
per valley and one in the lower valley.
FoodHub (http://food-hub.org) is an online membership-based marketplace open to commercial
buyers, independent producers, regional distributors, media, industry suppliers, farmers' market
managers, trade associations and non-profits, in California, Oregon, Washington, Idaho, Mon-
tana and Alaska. Producers can list products available for sale and wholesale buyers can list
products wanted. Currently nine Wallowa County food producers are members of FoodHub,
which provides wholesale buyers with a way to source local products, however all transporta-
tion of product must be arranged on a case by case basis.
A few local food producers have forged creative ways to transport product into and out of the
county. One farmer uses the public transit van to transport weekly food boxes to customers
located in Union County. A farmer who regularly travels to the Portland farmers market trans-
ports and sells limited product from another farmer. A rancher with a freezer trailer who
transports beef to customers in Portland occasionally back-hauls other food products to Wal-
lowa County by special order.
Regulatory Challenges
One theme that came up time and again when speaking with local producers and retailers was
the need for regulatory reform, or de-regulation, of certain aspects of our food system. Some
of the most prohibitive food regulations in place right now are based around dairy production
and processing. Under current Oregon law, a producer can have up to 3 milk producing cows,
or 9 goats or sheep from which they can sell their milk on farm (ORS 621.012 Exception for
small-scale on-farm sales). Farms with more than 3 milk cows or 9 goats or sheep must have all
dairy products processed in a certified facility. Most of the dairy producers that were inter-
viewed for this assessment had no interest in increasing their production levels by adding more

18
animals to their production cycle, but every producer had a desire to be able to openly sell
their products. The fact that they are limited to selling only on the farm, without advertising,
makes them nearly invisible to consumers. The absurdity of this regulation was summed up by
a local retailer that wanted to sell raw milk: “How is it that I can‟t even think about selling local
raw milk, cheese, or yogurt, and yet it‟s alright for tobacco and soda, both known to have det-
rimental effects on your health?”
Another sector of the food system that is affected by strict regulatory practices is that of meat
processing. Mt. Joseph Family Foods and Valley Meats operate with state certification for cus-
tom-exempt meat processing, and Dale‟s Mobile Slaughter offers custom-exempt on farm
slaughtering. This means that a consumer can purchase a whole, half, or quarter of a live ani-
mal, which is harvested via the mobile slaughter unit and then delivered to a custom-exempt
processor who breaks down the animal into individual cuts. This meat cannot be re-sold to
consumers through retail outlets. Only meat that is processed in USDA inspected facilities can
be sold by the cut to consumers. Stafford‟s Custom Meats in Elgin, Oregon, 44 miles from En-
terprise, became a USDA inspected meat processing facility in 2012 and is the closest of such
facilities to Wallowa County. Previously, the nearest USDA inspected facility was 220 miles
away in Nampa, Idaho.
Poultry producers now have the option to slaughter on farm up to 1,000 birds per year, which
they can then sell direct to consumer. If they want to sell their birds to a grocery retailer or
restaurant, they have to have them processed in a USDA facility. This is a difficulty, consider-
ing that the one USDA inspected poultry processing facility in all of Oregon (Scio Poultry Proc-
essing in Scio, Or) is located 386 miles away from Enterprise.
Developing distribution and transport systems is time consuming and relationship intensive.
Since most food purchased in Wallowa County comes from sources outside the County, we
know there are trucks leaving the County with space available, however the development of
back-haul services has not happened yet.
Commercial Kitchen
Commercial shared-use community kitchen facilities provide development opportunities for
numerous sectors of the local food system. A proprietor with the proper license(s) can use
such facilities for the production of value-added food products, like condiments, baked, frozen,
or canned foods and more. Catering food production and gleaning re-packing are other activi-
ties that could take place in a commercial kitchen. A 2011 Commercial Shared-Use kitchen
study, produced by Sara Miller of NEOEDD, examined kitchens in Wallowa County for their
potential to meet the needs of commercial food businesses. Three kitchens were identified as
available for shared use by licensed food businesses. Five additional kitchens were identified as
having good potential for becoming shared-use commercial kitchens through modifications or
upgrades described in the report.

19
The publicly owned Cloverleaf Hall kitchen at the Wallowa County Fairgrounds in Enterprise
and the privately owned Currie Kitchen in Joseph can accommodate licensed baking, cooking
and some types of food processing. The Lostine Presbyterian Church Manse Kitchen is an ex-
ample of a community kitchen that is available for limited use. It is certified for the production
of baked goods, though it does not have the infrastructure in place to be used for processed
food items that, based upon their ingredients, preparation, and packaging, require special licens-
ing.
This study also included an assessment of community interest in having this type of facility avail-
able. Caterers, specialty and gourmet food producers, individuals interested in food preserva-
tion for personal use, and those interested in conducting cooking classes and educational work-
shops all expressed interest in having access to a commercial shared-use kitchen. The produc-
tion of frozen vegetables, custom meals on wheels, canning of local produce, ravioli production
and dried foods for backpacking were some of the responses offered by interested individuals
when asked to describe the projects that they are currently participating in, or projects that
they hope to develop in having access to a community kitchen.
Oregon Farm Direct Bill
In 2011, the passing of Oregon House Bill 2336 (also referred to as the Oregon Farm Direct
Bill), gave producers the opportunity to sell direct to consumer certain value-added acidified
foods such as salsas, jams, pickles, sauerkraut or lacto-fermented vegetables, syrups, and pre-
serves without having to process them in certified kitchens. Products must be made from fruits
and vegetables that they have grown and processed on their farm. These products cannot ex-
ceed $20,000 annually in sales.
Other non-acidified foods that can be sold direct to consumer, that have no sales limit, include
whole fruits, vegetables, pan-roasted grains, nuts in shell, eggs in shell, pure honey, whole or
cracked grains, and flour. All of the processed products require labeling that includes a list of
ingredients, and name and address of the agricultural producer, and must include the following
statement: „This product is homemade and is not prepared in an inspected food establishment.‟
This de-regulation should prove to be beneficial for small-scale family farmers that do not oper-
ate on a level that would warrant the need or expense of licensing or utilizing a commercial
processing facility. The Oregon Farm Direct Bill also provides producers more opportunities
to develop relationships with consumers through direct-sales. (ODA: 2012)

20
Food Item
No
Sales
Limit
$20,000
sales
limit
Additional
labeling
requirement
Allowed for
Consignment Food must be clearly and
conspicuously labeled with
the name and business ad-
dress of the agricultural
producer
Fruits, vegetables, herbs
(fresh/dried) X X
Par-roasted grains X X
Nuts in shell X X
Shelled Nuts X
Eggs in shell X X
Consignment allowed when
the egg producer has an egg
handler license
Honey-pure X X X
Grains, whole or cracked X X
Flour X X
Legumes/Seeds
Fresh or dried X X
Canned fruit,
Syrups,
Preserves, jams,
Jellies
X X
Salsa and hot
Sauce X X
Sauerkraut or
Lactofermented
Vegetables
X X
Pickles X X
ODA, Food Safety Division, 2011

21
After the Harvest
Food storage and preservation are two aspects of the processing sector of the local food sys-
tem worth further consideration. Storage and preservation come in a variety of forms that in-
clude, but are not limited to, root cellar storage, refrigeration or deep freezing, canning, drying
or dehydrating, and curing.
Root cellars provide an environment in which certain produce can be kept in conditions that
extend their usability beyond the period immediately after their harvest. In fact, individuals that
have these cellars are often able to keep suitable produce (potatoes, beets, parsnips) for many
months, or through the entire winter season. Numerous homes of older construction feature
these cellars. Communal root cellars would provide an opportunity for those without private
cellars the opportunity to store their root crops, though more investigation needs to take place
regarding to the location of such sites. Cold storage, such as large coolers or deep freezers,
provides another means with which to store and preserve food. In addition to the initial cost
for refrigeration or freezer units, one must have available space for such an appliance, and most
importantly there should be consideration for the additional cost of operation for a refrigerator
or freezer. Dry storage space is also useful for those who purchase food in bulk quantities.
Canning appears to be gaining in popularity once again as a means for food preservation. Prop-
erly canned foods can last anywhere from months to years after processing. The glass jars that
are used for home canning are not excessively expensive and they are re-usable, and there are
both single-use and re-usable sealing lids. Specialized knowledge is necessary for canning, for if
the participant does not properly can an item they risk creating a hazardous product that could
bring about an illness or even death when consumed. Oregon State University offers a Master
Preserver program for those who are interested in developing this skill set. Interested parties
should contact the local OSU Extension office for more information on when this series of
courses will be offered.

22
Dehydrating and smoking are other options for food preservation, though special attention
must be paid to those who are applying these methods to protein-rich foods. Dehydrating is an
effective option for those that spend extended periods of time in the backcountry and have no
access to refrigeration, though the dehydrating process is time-consuming. Many local residents
smoke fish and other meats, plus there is the option to have your product smoked for you at
Mt. Joseph Family Foods in Joseph if the original meat product is processed there.
Opportunities for Local Food Production and Processing
Strengthen the producer network through increased collaboration (sharing
of information, resources, transport, marketing, etc.).
Strengthen the supply chain through increased collaboration and networking
with transporters, distributors, and marketers.
Increase support for new or young farmers/ranchers.
Facilitate producer engagement with local, regional, and state organizations
that promote food policy change/development.
Conduct an inventory of existing sites for food storage.
Conduct further research into consumer demand for locally produced grain.
Continue support for the development of commercial shared-use kitchen fa-
cilities.
Investigate the interest among poultry producers for developing a mobile
poultry-processing trailer.
Promote season extension practices through workshops, and dissemination
of best practices.
Continue business planning and product marketing education for producers
and processors.
Increase producer participation in the regional food and farm guide.

23
Consumer Access Introduction
Open and equitable consumer access to food is one of the most important indicators of a
healthy food system. Food access means that all consumers are able to obtain the food that
they need when they need it. Food access also has implications for producers, insofar as there
being enough outlets for them to sell their goods, particularly at a local or regional level. Ac-
cess points for food include retailers, restaurants, food banks, farmers‟ markets, and farm-direct
sales.
Availability is largely determinate by the seasons of the year and geographic distribution of food
access points. Large retailers such as Safeway feature a greater variety of year-round product
availability (due to their sourcing of products from distant locales), as compared to the variety
and availability of locally produced goods at times outside of the short growing season that ex-
ists in Wallowa County. However, Safeway is largely devoid of any locally produced food prod-
ucts. Affordability is another factor that can affect the accessibility of food. Even if a product is
readily available and easy to locate, it doesn‟t mean that the consumer can afford it.
The necessity of having a more robust local food system was recently exemplified in 2007 when
much of Clatsop County became completely cut-off from the more populated areas west of the
Coast Range after a major storm battered the area. “Distribution lines for retailers ceded, while
many local residents, for the first time, had to rely on the resiliency of the food bank in attaining
food for their families.” (Dean: 2010) This food insecure situation could be mitigated by not
only increasing the amount of food that is produced locally and increasing consumer access to
these products, but also in developing the infrastructure that would allow these products to be
stored during the off-season, thus promoting year-
round availability of local food and creating a more
secure local food system.
Food Access and Availability

24
Consumer Demographics
Wallowa County has 7,008 residents with 12.9% live below the poverty level (Census: 2006-
2010). Nearly 1,900 residents (28%) earn less than 185% of federal poverty level. Individuals
earning less than 185% of the federal poverty level guidelines qualify for federal nutritional assis-
tance programs such as the Supplemental Nutrition Assistance Program (SNAP, formerly
known as Food Stamps) or WIC (Women Infant Children) vouchers, and their children would
qualify for free or reduced price school meals. In 2012 185% of federal poverty level would
equate to $11,170 annual income for an individual, or $23,050 for a family of four.
In 2010, 1,016 people in Wallowa County received SNAP benefits each month. This amounted
to over 1.4 million dollars being brought into the local economy that year. If all eligible people
were enrolled in SNAP, the local economy would have received an additional $619, 987 in fed-
eral dollars and 437 additional people would have received help putting food on the table.
(Partners for a Hunger Free Oregon: 2011)
Highlights from the Wallowa County Consumer Food Access Survey
In order to gain a better understanding of how local consumers feel about the accessibility and
affordability of food in Wallowa County, a food access survey was created and administered in
the Spring of 2012. 133 individuals completed the survey, which equates to approximately 1.9%
of the population of Wallowa County. This survey also provided information on shopping hab-
its, whether or not the consumer qualifies for federal nutrition assistance, and whether or not
the participant purchases locally produced food products. This survey is intended to illustrate
some of the general trends that are present in Wallowa County regarding local consumer ac-
cess to food.. A copy of the survey instrument can be found in the Appendix A of this assess-
ment.
When asked, “Do you feel that food is accessible in Wallowa County, 83.3% said “yes” and
17.7% said “no”.
Now looking at the question of food affordability, we see a slightly different outcome than the
question of food accessibility. 57% of the responses were “yes” while 43% were “no”. These
survey participants were then asked to elaborate on their yes or no response. Here are some
of the responses that were recorded:
· “A qualified yes since this area cannot support discount food stores. With growing your
own garden and being careful with purchases, it is possible to find affordable food.”
· “I wish to support local growers but it seems to be rather spendy.”
· “I can‟t afford food. I eat out dated food all the time, and a good part of the time I eat
out of the dumpster.”
· “I think we're comparable to many other rural communities, but some items are just
ridiculously expensive... I think that our lower-income people often end up buying the
inexpensive calories and suffering nutritionally.”
· “The real answer is I don't know. I buy food, preferring local, organic produce and pas-
tured meat. I still buy conventional produce and hunt for bargains. When I was cooking

25
for a family of three, on food assistance, if I were to shop according to preferences I
would use my full allotment and more, without buying processed foods.”
The majority (81%) of local consumers represented in this survey stated that they primarily get
their food from grocery stores. None of the survey respondents indicated a primary food
source of Food Bank/Pantry, Restaurant or Convenience Store.
Respondents indicated numerous sources as secondary food sources
0.0%
10.0%
20.0%
30.0%
40.0%
50.0%
60.0%
Wallowa Consumer Food Survey Secondary Food Sources by Percentage of Respondents
Farmers Market
Grow Your Own
Natural/Specialty Stores
Restaurants
Large Retail (Costco, Winco, etc.)
Hunting
Fishing
Barter/Trade

26
Looking further into the issue of whether or not local consumers feel that food is accessible,
the question was asked “Which of the following factors affect your ability to get the food that
you need?”
0.0%
10.0%
20.0%
30.0%
40.0%
50.0%
60.0%
70.0%
Percent of Respondents by Factor
Availability and Variety of Quality Food
High Food Cost
Distance
Rising Cost of Household Expenses
Low Income
Lack of Time
lack of Transportation

27
All consumers have priorities that guide their product choices. Survey participants were asked
to rank in order of importance 5 different factors (Healthfulness, Taste, Convenience, Locally
Produced, and Price) that they consider when determining what food products that they will
purchase:
Factors Influencing Consumer Food Purchases
What we see is that Healthfulness was the most frequent response for Most Important factor,
while Convenience was the most frequent response for Least Important factor.
Looking closer at a more specific sector of the survey respondents, 16.5% stated that they
were eligible for government food assistance. However, there were some (7.4% of respon-
dents) that were not sure of their eligibility. If they were not sure, then these individuals had
the opportunity to elaborate on what factors were preventing them from seeking out this infor-
mation. Here are a few of the responses that were recorded:
· “I want to earn my own way.”
· “Don’t feel like I need assistance as much as others do”
· “I am working, supporting my family without assistance.”
· “I just need to fill out the hated forms. I am quite sure I am eligible at this time.”
· “I produce enough food to live on.”
0.0%
10.0%
20.0%
30.0%
40.0%
50.0%
60.0%
70.0%
1 Most Important
2 3 4 5 Least Important
Healthfulness
Price
Taste
Locally Produced
Convenience

28
For those that answered “yes” in regard to their eligibility for food assistance, it was noted that
85% of these respondents participated in SNAP, 35% participated in WIC, and 25% utilized the
local food bank.
Eight individuals who were eligible for food assistance and stated that they had used emergency
food service (local food bank/pantry) in the past twelve months provided information on factors
that make it difficult for them to access these services. Four of those who used emergency
food services indicated that they had no trouble accessing these services. None of the respon-
dents felt that the type of food offered, limits on the amount of food available, or location of a
food pantry relative to their residence were factors in their ability to access emergency food
services. Factors that did affect emergency food access are shown below.
Points of Access
Local retail and restaurants play an important role in providing points of food access for con-
sumers. As noted in the Wallowa County Food Access Survey, approximately 81% of respon-
dents primarily get their food from grocery stores. Aside from the Safeway grocery in Enter-
prise, the remaining grocery stores are independently owned businesses that, in most cases, are
the only food retailers in a rural community. Many of these same grocery stores feature local
products on a seasonal basis, thus providing another outlet through which local producers can
sell their goods. Retailers that are able to process SNAP transactions provide an opportunity
for low income individuals to support local producers, while in turn getting to enjoy food that is
more nutritionally dense and has travelled far less to reach it‟s final destination. Numerous lo-
cal restaurants feature local products on their menus now. Farmers‟ markets and farm stands
are also increasing in number around Wallowa County. All of these outlets (grocery, farm
stand/ on-farm sales, restaurants, and farmers‟ markets) provide local consumers with access to
the food they need, while also creating opportunities for local producers to sell their products.
0 1 2 3 4 5
I don't feel comfortable going there for help
Transportation is not available
Service hours are limited and I can't make it there in time
Barriers to Emergency Food Services Number of Consumer Responses
Barriers to Emergency Food Services Number of Consumer Responses

29
Grocery Stores
The role of grocery stores in rural communities is of great importance, particularly in areas that
the USDA defines as being a “Food Desert.” A food dessert is a low-income census tract with 1) a
poverty rate of 20 percent or higher, OR 2) a median family income at or below 80 percent of
the area's median family income; and at least 500 people and/or at least 33 percent of the cen-
sus tract's population must reside more than one mile from a supermarket or large grocery
store (for rural census tracts, the distance is more than 10 miles). In Wallowa County there is a
fairly large food desert that encompasses much of the Lower Valley, including the towns of
Lostine and Wallowa. The M. Crow Store in Lostine, and Wallowa Food City in Wallowa are
the only grocery stores in these towns, which further demonstrates the need for these estab-
lishments to thrive and continue to serve their local populations, but it also highlights the point
that a more robust and localized food system would provide more sales opportunities for local
producers as well as increasing access to fresh food for residents in these areas.
Rural Grocery Store Owner Survey
Starting in late 2011 the Rural Grocery Store Owner Survey, developed by Kansas State Uni-
versity‟s Center for Civic Engagement, was administered to seven rural grocery store owners
or managers. These seven stores represent nearly all of food retail outlets in Wallowa County.
In addition to the survey, these same owners and managers were interviewed for further com-
ment on the answers that they provided in the survey. Questions related to the identification
of primary and secondary grocery suppliers, whether or not their store sold locally produced
goods, and the identification of major challenges that they face as rural grocers were presented
in this survey.
All of the survey participants stated that they feature at least a few local food products, and ex-
pressed a willingness to feature more. Some of the local food products that can be found in
local retailers include vegetables, fruits, meats, vinaigrettes, chocolates, and eggs. Issues that
the storeowners expressed as preventing them from wanting to carry more local products in-
clude:
*Lack of Professionalism: Producers need to be readily accessible in case their product runs
out and the storeowner needs to re-supply a product. Providing the storeowner with a busi-
ness card and reliable contact information is greatly appreciated.
*Lack of “Real estate”: Most grocery stores have very little room to work with on their
shelves when it comes to bringing a new product into the store.
*Perishability of Produce: Produce has a very limited shelf life, so therefore it is more of a risk
to the store when compared to most processed value-added products. In spite of perishability,
most storeowners agreed that they like to feature local produce, particularly those fruits and
vegetables that have a longer shelf life (e.g potatoes, tomatoes, and corn.) When asked about
how their stores came to feature local products, all stated that the producer came to them and
made a strong case regarding why the store should sell their products. One storeowner stated

30
“…as long as it‟s a superior product, I am willing to carry it in my store. We are able to pur-
chase local products, whereas Safeway cannot.”
Rural grocery store owners and managers commented on the numerous challenges that they
face. This table shows the frequency that some of these issues were noted as being challenges
for these retailers.
Looking at the distributors/suppliers for these stores, the majority (5) of the stores interviewed
for this assessment purchased the bulk of their products through URM Stores, Inc, which is a
retailer owned (co-op) food distributor. The base of URM‟s operations is Spokane, which
makes them the closest food distributor to Wallowa County. The five stores that listed URM
as their primary source for food products are able to collectively fill an entire semi-truck each
week, which provides URM with a delivery order large enough to continue product delivery to
stores in Wallowa County. All stores utilizing URM also stated that they felt they were receiv-
ing a fair price for those products. Only one of the five store owners purchasing products from
URM commented that they had trouble meeting the minimum purchase requirements, particu-
larly during off-season times in winter months when their sales volume tends to drop off.
Restaurants
Across the United States there is a growing movement within restaurants to present a menu
that features local food. This is a remarkable shift from purchasing practices that have largely
been dictated by the limited range of goods provided by large food service distributors. Con-
sumers are more informed and increasingly critical of the ingredients utilized in the food that
they buy in restaurants. Parallel to this consumer demand, one can see an increased level of
concern from restaurateurs and chefs regarding the products that they utilize in their establish-
Government Regulations
5
Competition with large chain grocery
stores
4
High operations costs (utilities, building
lease, repairs/maintenance, etc. 4
High Inventory costs/ low turnover
3
Shoplifting/ bad checks, internal theft/
unpaid accounts 3
Narrow Profit Margins 3
Availability of satisfactory Labor
2
Taxes
3
Shortage of working capital
1
Lack of community Support
1
Low Sales Volume 1
Minimum buying requirements from
vendors 0

31
ments. Numerous restaurants in Wallowa County already utilize locally grown or raised prod-
ucts in their menu items. Mutiny Brewing and Terminal Gravity both feature locally raised 6
Ranch beef and Backyard Gardens greens on their menus, Little Bear offers Carmen Ranch beef
as an option on their menu. Stangel Buffalo is featured at both Terminal Gravity and Heavenly‟s,
and Caldera‟s in Joseph grows some of their own produce for their restaurant. When asked
about how some of these restaurants came to incorporate local products into their menu, the
response was much the same as grocery retailers: the producer came to them and presented a
compelling case as to why their respective establishments should carry their product. Those
responsible for the purchasing and menu development at these restaurants agreed that locally
produced items were of a superior quality, represented production methods that were sustain-
able, ethical, and were fresher and flavor-rich in comparison to offerings from their food service
distributors. There is an opportunity for local farmers and ranchers to market their product
through restaurants, both within the county and on a regional level. Some producers have
sought external markets almost exclusively, as in the case with Carmen Ranch and Prairie
Creek Farms.
Farmers’ Markets
In 2012 five farmers‟ markets are open across Wallowa County (Joseph, Enterprise, Troy,
Lostine, and Wallowa.). Each of these markets provide an opportunity for local producers to
promote their goods and production practices, as well as creating a setting in which consumers
can participate in a dialogue with these producers.
The markets in Enterprise and Joseph are able to process SNAP benefit transactions, which
provides consumers of all income levels the opportunity to enjoy local produce. Hopefully as
the newer markets in Wallowa, Troy, and Lostine develop over the upcoming years they too
will be able to accept SNAP EBT cards and create even more access to locally grown produce
for Wallowa County residents.
For the past four years Oregon Rural Action has pub-
lished a Food and Farm Directory that provides infor-
mation on the location of farmers‟ markets and farm
direct sales opportunities across Northeast Oregon.
Check out the following link: http://oregonrural.org/
northeast-oregon-food-and-farm-directory/Food-and-
Farm-Guide
“To increase our community’s access
to fresh, local products; to offer a vi-
brant social gathering place in an open
air setting that is mutually beneficial to
consumers as well as local businesses;
and to promote the economic sustain-
ability of local producers by providing
them with a venue to sell their goods
direct to consumer.” -Mission State-
ment of the Lower Valley Farmers’
Market

32
Profile: Wallowa County Farmers’ Market
The Wallowa County Farmers‟ Market (WCFM)
includes the farmers‟ markets in Joseph and Enter-
prise. Beth Gibans, (chair) for the WCFM Board
of Directors, is a local producer (Backyard Gar-
dens) that served as a founding member for the
Joseph farmers‟ market in 2002 and later the En-
terprise farmers‟ market in 2005. These markets
have served as integral access points for local
products; in 2010 with the help of a grant from
Soroptimist in Enterprise, they were able to pur-
chase a wireless SNAP processing machine for use
at their farmers‟ markets. In 2011 WCFM pro-
duced an educational flyer that was distributed to new SNAP applicants at the Department of
Human Services on how to use SNAP benefits at the participating farmers‟ markets. WIC and
Senior Fruit and Vegetable vouchers are also accepted at
both markets.
The Joseph and Enterprise farmers‟ markets have provided
the setting in which consumers can engage in a wide range
of educational opportunities. The WCFM has worked to
develop collaborative efforts with groups such as Building
Healthy Families, Slow Food Wallowas, and the Magic Gar-
den by providing them the opportunity to inform market
goers on topics ranging from cooking with local whole
foods to the preparation of healthy snacks for children.
The WCFM has also worked in partnership with the Wal-
lowa Valley Music Alliance to provide live entertainment at
both the Joseph and Enterprise markets since 2006.
Farm Stands
Farm and roadside stands are another great opportunity for producers to market their food
products direct to consumer. In Wallowa County there are two such stands: June‟s Local
Market in Lostine, and Liza Jane‟s Farm Stand located about 3 miles west of Enterprise on High-
way 82. June‟s Local Market, owned and operated by June Colony, has served as a starting point
for numerous projects related to food system development (see profile), and increased the
amount of food that consumers can access in a community that is located in an area defined by
the USDA as being a Food Desert. Liza Jane‟s Farm Stand provides a unique opportunity for
consumers, in that it is open 24 hours a day and also provides other local producers who may
not be growing produce at a very large scale, the opportunity to sell some of their products.

33
Profile: Junes’s Local Market
June‟s Local Market in Lostine offers local
produce and craft goods to community
members and visitors and is working to
become a food hub for Wallowa County.
Through June‟s Local Market Producer
Network LLC, June Colony is working to
develop the infrastructure needed to pro-
mote a more robust and localized food
system. In Fall 2011, June‟s Local Market
Producer Network LLC was awarded a
USDA Farmers‟ Market Promotional Pro-
gram (FMPP) grant. Lostine is located in a
Food Desert, which gave the project priority over applications submitted from non-food desert
designated areas. Infrastructure development, increasing consumer food access and education
are project areas that are being addressed by June and other association members through
June‟s Local Market Producer Network LLC.
At the core of this project is the need for more infrastructure, such as equipment to transport
farm products from the production site to market and cold storage to hold those products.
Producers who are interested in becoming a member of the LLC pay a $5 annual fee to the
network and receive access to the infrastructure components, such as a pickup truck with a
drop-in freezer/cooler to transport products from the field to market, a walk-in cooler that can
be used to hold products until they are needed for a market, and a vegetable packing/ prepara-
tion area. These infrastructure components should help facilitate the incorporation of products
that are grown or raised in some of the more isolated areas of the county into the local food
system. A food cart is being constructed for use at the Lostine Farmers‟ Market. Local cooks
and chefs will utilize locally produced vegetables in ready-to-eat foods that will be sold from the
cart on market days. June worked with the Lostine Presbyterian Church to get the Manse
kitchen certified for the production of baked goods.
More market opportunities will be made available with the help of the FMPP grant funding to
promote and coordinate new farmers‟ markets in Lostine and Wallowa in the 2012 season.
Along with increased infrastructure and market opportunities, there is a pressing need for edu-
cation on food preservation and season extension practices. June has already worked to edu-
cate individuals, both adults and youth, through the Lostine Community Garden and in provid-
ing on-site technical assistance.

34
CSA
Community Supported Agriculture (CSA) is another option for producers and consumers to
work directly with each other without the need for a middleman. A consumer participating in a
CSA will typically pay for either a half or whole share of a season‟s produce at the beginning of
a growing season, and would then collect a weekly allotment of produce from a specified collec-
tion site. As of 2007, there were nine farms in Wallowa County that marketed their products
through CSA. Farmers face a tremendous outlay of operating capital at the start of a season,
not including the labor and time inputs that are necessary, then often have to come to terms
with risk factors (pests, inclement weather, disease, misapplication of chemicals from neighbor-
ing areas) that are largely beyond their control. When consumers purchase a CSA share at the
beginning of the season, they are providing the farmer with more capital to invest in inputs,
equipment, or infrastructure needs, as well as assuming some of the burden of risk with the
farmer, accepting that in a good year they will enjoy in the bounty of extra produce, while dur-
ing a less productive year they will accept having a smaller amount of produce in the weekly
farm share. This arrangement works well for small-medium scale family farms, in that farmers
can spend more of their time on-farm working to maximize the potential of their harvest,
rather than having to run around making deliveries to retail, restaurants, and other outlets.
Beth Gibans of Backyard Gardens offers a few different options for her CSA program. A par-
ticipant can purchase a whole share or a half share, both of which feature 22 weekly distribu-
tions of fresh, sustainably grown produce, or there is the option to buy a share in the Farmers‟
Market CSA, in which the participant pays for a share up-
front at the beginning of the season, and then is able to se-
lect the items for each weekly share from the produce of-
fered by Backyard Gardens at one of the weekly markets.
Community Gardens
Community gardens are a relatively new prospect in Wal-
lowa County. Until recently there has been very little or-
ganizing for community garden projects, though this is
changing as we speak. In 2012 a new community garden
has been established in Wallowa at the Wallowa River
House. Point of Connection, located off of Highway 82
between Enterprise and Joseph, has offered land for a com-
munity garden, and so far there have been plots established
that will provide produce for the Joseph Charter School,
Community Connection food bank, as well as plots for in-
dividual households. One interesting project that could have a profound effect if implemented,
would be to promote the purchasing of plant starts at the Enterprise and Joseph farmers‟ mar-
kets at the beginning of the season, particularly to those who will be using their SNAP benefits
for this purchase, then signing them up for a community garden plot and providing them with
the education needed to maintain this plot throughout the growing season. This would multiply
the amount of SNAP benefit redeemed at the time of purchase many times over, as individuals
would get to enjoy an entire harvest of vegetables rather than just purchasing finished produce.

35
Food in Schools
The food that is served in schools has long been recognized as being overly processed and pur-
chased from non-local sources. In fact, the majority of food served in Wallowa County schools
comes from USDA commodity offerings. Budget considerations have a great amount of influ-
ence over the food purchasing in each of the four school districts in the county. Federal fund-
ing for the school lunch program is based upon the number of students enrolled in the free and
reduced lunch program. All of the school districts interviewed for this assessment have noted
an increase in enrollment for this program. For the 2011-2012 school year Joseph Charter
School has a student enrollment of 64% in the Free and Reduced Price School Lunch program,
up from 52% the previous year. Enterprise has an enrollment of 43%, and Wallowa has an en-
rollment of 52% in this program. In recent years most schools have had to reduce the amount
of kitchen staff they employ. This further decreases their ability to utilize whole, locally grown
food products in their program due to the extra time needed to process such ingredients. De-
spite the difficult situation that these school kitchens are up against, there are many positive
changes currently underway.
Schools can serve as a venue for lasting, positive change for the local food system. In order to
sustain this change, the youth must be engaged in all aspects of the process. Schools can pro-
vide the opportunity for incorporating demonstration gardens into their curriculum, thus en-
gaging the students in food production methods. Food that is produced in these gardens can be
incorporated into the school food program, nutrition education can be featured as a compo-
nent to Health or Science curricula, all of which serve to instill healthier eating habits and a
more critical consideration of where food comes from in the students. Not only will these stu-
dents carry the lessons learned with them for time to come, but they will most likely go on to
convey this information to their families, becoming educators themselves and helping to change
the eating habits of their families for the better.
Efforts are already underway in Wallowa County to enact some of the changes mentioned
above. With the start of the 2011-2012 school year the Joseph Charter School featured pro-
duce in their school lunch program that came from the Magic Garden, a joint effort engaging
students, parents, and community members. Anne Dundas, Head Cook for the Joseph Charter
School, has also reached out to local farmers for items such as salad greens, radishes, and other
vegetables to incorporate into the school lunches. Fluit Family Farms has contributed locally
raised beef for use in the school lunch program at the Joseph Charter School. The FFA pro-
gram at Wallowa high school was recently awarded grant money for the purchase of a Hoop
House that will be used by FFA student members as an educational resource and practicum for
the use of season extension technology. In Enterprise students have the opportunity to visit
local and regional farms with the intention of illustrating the agricultural and food production
process while also providing these youth with the chance to interact with producers.

36
Profile: Magic Garden
The Magic Garden is a project that demonstrates the potential that exists in developing student
and community ties to the food production process. In 2010 Robin Martin, founder and coordi-
nator of the Magic Garden, applied for an Ecumenical Ministries of Oregon grant that would
support the development of a community garden in Joseph. Initially the plan was to establish the
community garden on the Joseph Methodist Church property, but after speaking with Joseph
School District superintendent Rhonda Shirley, it was decided that the greenhouse and fenced
garden plot located at the Joseph Charter School could be an ideal location for a community
garden, plus it would allow for greater involvement with students at the school. The $1200 dol-
lars that was awarded from this grant went toward the purchase of new greenhouse roof-
ing and a new propane heater so the greenhouse can be used year round by students. During
the FEAST event in March 2011, Robin came into contact with Sharon Thornberry, Community
Food Systems Manager for Oregon Food Bank, who suggested that she should apply for a
United Methodist Church Bishop‟s Initiative on Hunger grant. This grant provided $2550 in
funding for further development of the Magic Garden project, and a fellow member of the Jo-
seph Methodist Church offered an additional 1/2 acre near Imnaha for the Magic Garden. The
later funding allowed for the purchase of materials for deer fencing around the Imnaha site, as
well as the purchase of more implements and inputs for both gardens.
In 2011a total of 82 community and student volunteers provided approximately 5000+ hours of
labor for the development and maintenance of the Magic Garden sites. Numerous church mem-
bers from Joseph United Methodist Church provided countless hours during the harvest season
and for vegetable preparation and processing so that the school could use this produce in their
school lunch program. Anne Dundas of the Joseph Charter School believes that the Magic Gar-
den produce that was provided for the lunch program saved her approximately $1000 dollars
during the first few months of the 2011-2012 school year. Community contributions also pro-
vided a food processor and a microwave for the school kitchen. The response from the com-
munity toward the Magic Garden has been overwhelmingly positive, and in the first year Robin
was able to develop 52 community partnerships between the Magic Garden and local busi-
nesses, organizations, and individuals who contributed time, expertise, supplies, or other dona-
tions to the development of the Magic Garden. In its first season, 680 individuals used produce
from the garden.

37
Emergency Food Services
In Wallowa County, Community Connection is the primary source for emergency food assis-
tance (e.g. food bank or pantry). They operate two food banks and senior meal sites, one each
located in Wallowa and Enterprise. From these sites meals on wheels are delivered to the
homebound in the Enterprise/Joseph area and the Wallowa / Lostine area. Community Connec-
tion of Wallowa County also administers a summer lunch program for children at sites in Jo-
seph, Enterprise, Lostine, and Wallowa. There are numerous church congregations in Wallowa
county that offer emergency food assistance to community members as well.
Profile: Community Connection
Community Connection in Enterprise provides numerous services to underserved individuals in
Wallowa County. Transportation is available to the general public, seniors and people with
disabilities. Medical transportation is available for qualifying individuals. Energy Assistance as well
as other services to prevent homelessness, power shut offs, evictions, and weatherization pro-
grams are available to those that qualify. The FY 2011 (ending November 2011) Program Ac-
tion Report on services rendered for Wallowa County indicate their impact on local emergency
food services:
-4,867 Meals were served on-site to individuals over
the age of 60
-414 Meals were served on-site to individuals under
6o
-2,035 Home-delivered meals were served
-2,327 Summer snacks/lunches were provided
-1,442 Food packages were administered through the
food bank
The majority of the food offered through their food bank comes from community donations.
The local Stock Growers Association has donated a whole beef to the food bank. The The ani-
mal is then processed and packaged at a USDA inspected facility. Community Connection pays
for this cost with help from the local chapter of the Lion‟s Club. Oregon Department of Fish
and Wildlife donates steelhead and salmon seasonally. Produce from the Magic Garden, Back-
yard Gardens, and other farmers‟ market vendors, was donated to the food bank during the
2011 growing season. When asked about how food bank patrons felt about having fresh pro-
duce, Carolyn Pfeaster, Community Connection Wallowa County Manager in Enterprise, stated
“They love it! Carrots, potatoes, salad greens, those are all items that they are glad to re-
ceive.” The demographic of those who come to Community Connection has changed slightly
since the onset of the Great Recession in 2008. They are now seeing more single individuals
coming to their food bank for assistance, whereas in years past it was primarily small, young
families that were using their services. There is also a trend among recipients to only use ser-
vices when they have to, presumably because they want these services to be available to others
38
who are perceived as being in greater need. Noted in the Wallowa County Consumer Food
Access survey, there is an inclination among low-income residents that they do not want to ac-
cept assistance, even though they qualify and could benefit from the supplemental food provi-
sions that Community Connection offers. For those that are willing to participate in their pro-
gram, Pfeaster suggests, “We encourage those receiving SNAP benefits to use the food bank
first, allowing them to stretch their food dollars.”
Food Waste
The term food waste does not only pertain to food
that is going into waste management facilities. This
term can also encompass the idea of gleaning, where
organized groups go and collect un-harvested fruit,
vegetables, grain, or even non-food items like fire-
wood, to be re-distributed to individuals in need.
The subject of food waste also involves looking at
how individuals, institutions, and businesses deal with
their waste. Do they compost organic materials? Do
they donate excess product to local food banks or
pantries?
Every year hundreds, if not thousands, of pounds of
fruit end up rotting on trees instead of finding its way into the homes of those that could use it.
Sometimes fruit trees are planted in areas that are rarely visited, so the owner does not think
of harvesting all of the fruit that the trees produce. Perhaps the owner is physically unable to
go out and harvest the fruit. In both of these scenarios, nutritious and accessible food is going
to waste though, though this would not have to be the case if there were individuals willing to
go out and get it. Wallowa County does not have any formal gleaning organizations right now.
However, gleaning projects have been carried out in the past, and there are organizations like
Slow Food Wallowas that are looking to sponsor and organize more of these events. In addi-
tion to the need for increased organization around gleaning activities, a facility in which gleaners
could gather, package, store, and re-distribute the items that they have gathered would help
make gleaning a more efficient and effective activity. A community kitchen could provide the
facilities needed for the processing and re-packaging of gleaned produce, though storage may be
an aspect that would have to be addressed through other venues. Composting is a simple and
effective way to reduce the amount of organic waste that would otherwise end up going into a
landfill. Those same food scraps could also be used as feed for animals, such as chickens or
pigs. While none of the restaurants or schools interviewed practiced composting, the Joseph
Charter School does save food scraps from the school lunches and gives them to one of the
school bus drivers, who in turn uses them as feed for chickens.
Grocery stores have food that has passed its expiration date and is pulled from the shelves,
though it is often perfectly edible. The same goes for produce that could still be consumed,
though it is nearing the end of its usefulness. All of these items could be collected by a gleaning

39
organization and re-distributed to those individuals who are in need of food assistance. As pre-
viously mentioned, there are currently no gleaning organizations here, so very little of this type
of food reclamation and redistribution activity takes place in Wallowa County.
Opportunities for Consumer Access and Food Availability
Create more opportunities for food literacy/education.
Continue development and expansion of community and school gardens and
support collaboration needed to secure additional funding.
Investigate actions that would lead to a decrease in the stigma felt by com-
munity members seeking emergency food assistance.
Encourage development and collaboration among all of the farmers’ mar-
kets.
Develop resources to increase the amount of gleaning activities.
Support acquisition of equipment needed for SNAP, WIC, and Senior Fruit
and Vegetable voucher redemption at all farmers’ markets and look into
ways to increase redemption.

40
Introduction
Community-based solutions are the most fundamental component toward developing a health-
ier, more resilient local food system. Education, advocacy, planning, and project development
and execution must be led by local individuals in order to ensure the long-term sustainability of
these solutions. Additionally, solutions developed from within a community are informed and
focused on the unique issues that each community seeks to address. In recent years, commu-
nity members in Wallowa County have made it clear that there is a desire to engage the county
population at-large and work toward restructuring the local food system. Organizations such
as the Wallowa County Food System Council, Slow Food Wallowas, Junes Local Market Pro-
ducer Network Llc., Wallowa County Farmers‟ Market Association, and the Northeast Oregon
Economic Development District are working in collaboration, reaching out to fellow organiza-
tions at a regional level and beyond. This work will serve to inform and inspire our community
members to move toward creating a food system that supports family farms and the economic
prosperity of local communities, broaden the access that individuals have to healthy food, and
create space for dialogue among those who are affected by local, state, and federal food poli-
cies.
FEAST
In March of 2011 the Northeast Oregon Economic Development District, Slow Food Wallowa
County, and Community Connection sponsored a community-organizing event facilitated by
Sharon Thornberry of the Oregon Food Bank called FEAST (Food-Education-Agriculture-
Solutions-Together). Events like this are intended to act as a first step for community members
to begin organizing toward the improvement of the local food system. The event opened with
a panel discussion led by community members representing different sectors of the local food
system. During this discussion the panelists shared information on current food projects that
they are engaged in, as well as challenges and opportunities that they have identified. After the
initial panel discussion, Thornberry introduced the topics of community food organizing, food
security, and offered a definition and explanation about the nature and purpose of a community
food assessment. She also shared often-cited data sources relevant to food system develop-
ment such as the 2007 USDA Agriculture Census, Centers for Disease Control and Prevention,
and Indicators Northwest.
All who were present at the FEAST meeting were asked to develop their personal vision for
what they would want to see change in Wallowa County as a result of developing a community
foods organizing plan. One such vision reads:
“Meet more of the needs of local producers to grow/succeed in their farms and ranches.
Section 3 Community Food System
Development Efforts

41
Use gleaning and connecting people to get more of the food available used in the community.
Increase access to education, land, and resources for more people to be able to grow and store
food.”
After the visioning session, participants were asked to record three goals from their vision for
community food system development, and the following categories were generated:
· Education
· Production and Distribution
· Food Processing
· Food Security and Access
· Funding and Overarching Organiza-
tion
The categories then provided the framework
for small group discussion, and from each of
these groups an initial organizing plan was
constructed.
Wallowa County Food System Council
The Funding and Overarching Organization
sub-group that formed during FEAST contin-
ued to meet periodically through the spring and summer of 2011 until they were called upon
again in order to further develop their group, re-visit the visions that they constructed during
the FEAST workshop, and to participate in one of the key components of the food system de-
velopment process: the Community Food Assessment. In the fall of 2011, these group mem-
bers adopted a new name, a collective vision, and a slightly broader scope of interest with the
formation of the Wallowa County Food System Council.
The Wallowa County Food System Council was formed with the intention of keeping the con-
versation going that was initiated by the FEAST organizing event. Participants put forth the idea
that those individuals representing different sectors of the local food system should continue to
come together regularly to report on the progress of the food system projects that they were
undertaking, generate more opportunities to collaborate on newly identified projects, and to
share specific information related to funding opportunities or technical information.
The WCFSC has played an integral role in the development of the Wallowa County community
food system assessment. During the second meeting of the council, members generated a list
of potential interviewees and made initial contact calls with these producers, retailers, and oth-
ers associated with the local food system. The information gleaned from those interviews has
We envision community members in Wallowa County engaged in growing an equitable, local food sys-
tem that promotes Economic Development, Community Development, and Sustainable Agriculture.” -
Wallowa County Food System Council Vision Statement

42
provided the bulk of information presented in this assessment. This process of networking has
also expanded the presence of the WCFSF among local residents with the help of local media
outlets (The Observer, Chieftain, KWVR Radio, Chamber of Commerce) by providing cover-
age of WCFSC-related activities.
Slow Food Wallowas
Slow Food Wallowas was formed in March 2010 with the intent of coming together to bring
the support of a national organization (Slow Food USA) to local and regional food system de-
velopment. “Collaboration with existing community-based, governmental and non-profit agen-
cies involved in food production, distribution and delivery, and to serve primarily as an educa-
tional organization to further their interests” lie at the core of Slow Food Wallowas‟ approach
toward food system development, as related by Lynne Curry, co-chair for this chapter. Their
mission also includes work that will ultimately lead to increased access to local food products,
particularly for lower income individuals, by promoting the development of community gardens
and gleaning activities. Products from these actions could then be channeled into the local food
bank for re-distribution throughout the county. Slow Food Wallowas also supports the devel-
opment of a commercial shared-use kitchen in Wallowa County and envisions this facility pro-
viding space for the production of added-value products, where surplus foods could be pre-
served for donation to the food bank, and their community members can learn the traditional
skills for cooking and preserving local foods.
In addition to the education and food access components to their mission, Slow Food Wal-
lowas is strengthening their connections with larger urban chapters, such as Portland Slow
Food, in order to help bridge the urban/rural divide and educate urban dwellers about the life-
styles, benefits, and challenges of rural residents and small-scale producers. Activities under-
taken by Slow Food Wallowas include their co-sponsorship of the FEAST organizing event, pro-
viding cooking and educational demonstrations at the Enterprise and Joseph Farmers‟ Markets,
food preparation classes on healthy foods for children in collaboration with Building Healthy
Families, and carrying out an event called Dig In! in which excess local produce was distributed
to community members and to the food bank.
Northeast Oregon Economic Development District
The Northeast Oregon Economic Development District (NEOEDD) is an organization based in
Wallowa County working on numerous areas related to food system development. NEOEDD
provides economic and community development services in a three county region that includes
Baker, Union, and Wallowa Counties. One of the key economic development strategies in the
region is entrepreneurial development, providing financial and technical assistance to help local
business owners start and grow businesses. Projects that NEOEDD has carried out in Wal-
lowa County have included product feasibility and market research for local value-added meat

43
projects, working with volunteers and kitchen owners to complete a feasibility study for
commercial shared-use kitchens in Wallowa County, hosting events like FEAST, as well as
facilitating informational workshops on food regulations and product marketing.
Current and future food system development-related activities for NEOEDD include these
project items:
-Follow up with identified kitchen owners and food business owners to improve their kitch-
ens and their use; and to present the information gathered in this feasibility study in Union
and Baker counties as requested.
-Provide facilitation and technical assistance to the Wallowa County Food System Council
organizers and assist with the development of work plans and funding resources.
-Provide evaluation assistance and reporting for June‟s Local Market Producer Network LLC
Farmers‟ Market Promotion Program.
-Offer business coaching and matched savings program support for businesses participating
in the Individual Development Account (IDA) program. NEOEDD is currently serving 15
food or farm related businesses.
-Provide farm succession planning workshops and land-holder workshops to help older
farmers plan future land transitions with the intent of keeping land in production.
-Provide business planning classes and other resources to 4H and FFA students and assist
them in starting small food and farm businesses before they leave high school.
Profile: Northeast Oregon Regional Food System Collaborative
NEOEDD is a partner along with Oregon Rural Action, Oregon Health Sciences University-
School of Nursing, Community Action Program of East and Central Oregon, and Oregon
State University Extension Agency on a regional collaboration aimed at improving the food
system in Baker, Umatilla, Union, Malheur, and Wallowa Counties. The goals of this collabo-
rative are as follows:
-Strengthen access to affordable, healthy food for all the members of our communities;
-Develop a strong regional food system through building diverse collaborations and regional
dialogue on community food systems;
-Engage a diversity of people in their food system and empower them to act through orga-
nizing food policy councils throughout the region;
-Promote sustainable, profitable practices by family farms and ranches;
-Foster food and agricultural enterprises that re-circulate financial capital within and among
our communities, support local and regional businesses, and create „green jobs‟;
-Encourage local production of food for local consumption by strengthening links between
family farmers, ranchers, and eaters;
-Increase intake of local and nutritious fruits and vegetables by school children through farm-
to-school programs; and
-Support policies that remove barriers to local, sustainable food production, processing, and
consumption

44
Opportunities for Community Food System Development Efforts
Develop a strategic action plan for future community food system develop-
ment activities.
Formalize participation in the Wallowa County Food System Council.
Inform the public on current and future food system development activities.
Encourage collaboration and information sharing among local/regional or-
ganizations working on community food system development projects

45
Bureau of Labor Statistics and Inspector of Factories. (1911). Fourth Biennial Report. Retrieved
May 18, 2012, from http://www.google.com/books?id=ZSUoAAAAYAA
Dean, John. (2010) Clatsop County Food Talk: A Report on the Food System of Clatsop County.
Portland. Oregon Food Bank
Meter, Ken. (2011) Wallowa County Oregon, Food and Farm Economy: Highlights of a Data Compi-
lation. Minneapolis, Mn. Crossroads Center
Miller, Sara. (2010) Product Development and Market Research for Beef and Lamb USDA Inspected
Meat Products from Wallowa County. Wallowa County, Oregon. Northeast Oregon Economic
Development District.
Miller, Sara. (2011) Feasability Study for a Commercial Shared-Use Kitchen Facility in Wal-
lowa County. Wallowa County, Oregon. Northeast Oregon Economic Development Dis-
trict.
Nutritional Analysis of Corriente Beef. (2012) Retrieved May 20, 2012, from http://
www.6ranch.com/beef.htm
Oregon Department of Agriculture, Food Safety Division. (2012) Farm Direct FAQ. Retrieved
on June 15, 2012, from http://www.oregon.gov/ODA/FSD/faq_2336.shtm.
Oregon State Legislature Regulations on Dairy Production. (2011). Retrieved on May 20, 2012,
from http://www.leg.state.or.us/ors/621.ht
Oregon State University, Custom and Culture of Wallowa County. (2009) Retrieved on May 16th,
2012, from http://extension.oregonstate.edu/wallowa/local-publication
Partners for a Hunger Free Oregon, Snap 2011 Participation Report. (2011) Retrieved on July
30, 2012 from http://oregonhunger.org/files/SNAP_for_WebREV-1.pdf
Pothukuchi, K., H. Joseph, H. Burton, & A. Fisher. (2002). What’s cooking in your food system? A
guide to community food assessment. Los Angeles: Community Food Security Coalition.
Thiel, Patrick. (January 10, 2012) Personal Communication.
USDA Census of Agriculture. (2002-2007). State and county data. Retrieved May 18, 2012,
from http://www.agcensus.usda.gov.
Works Cited

Appendix A
Page | 1
This Consumer Food Access Survey is part of a local effort to look at a range of food-related issues and opportunities in order to improve the food system in Wallowa County. By completing this survey, you will help provide up-to-date information on where people living in Wallowa County get their food and the factors that affect local access to food (such as price, availability, choice, etc.). Individual responses will remain confidential. Information on consumer access to food will be included in the Wallowa County Community Food Assessment. When complete in July 2012, this Assessment will also include information provided by local food growers/producers, retail and restaurants, emergency food services, gleaners, and schools and institutions. The Assessment report will include a mixture of statistics, trends, and survey results; as well as qualitative information collected about the food system in Wallowa County. The Wallowa County Community Food Assessment is sponsored by volunteers with the Wallowa County Food System Council, with assistance from the Northeast Oregon Economic Development District (NEOEDD) and the Oregon Food Bank.
Date:
Name: (optional)
Sex: (optional) Male ( ) Female ( )Age: (optional) Under 18( ) 18-29( ) 30-49( )
50-64( ) 65-74( ) 75+( )
Ethnicity: (optional) Hispanic or Latino( ) Not Hispanic or Latino( )
Race: (optional) Black or African American( ) Asian( ) Native Hawaiian or Other Pacific
Islander( )
American Indian or Alaskan Native( ) Caucasian( ) Other ( )
Yearly Household Income: Less than $10,000( ) $10,000-$20,000( ) $20,000-$30,000( )
$30,000-$50,000( ) More than $50,000( ) Unemployed( ) Retired( )
Number of Adults living in your household: 1( ) 2( ) 3-5( ) More than 5( )
Number of Children living in your household: 0( ) 1( ) 2( ) 3-5( ) More than 5( )
Contact Info: (optional)

Appendix A
Page | 2
1. Do you think that food is accessible here in Wallowa County?
Yes ( ) No ( )
Comments:
2. If no, then what do you think are the barriers that limit consumers’ access to food?
3. Do you think that food is affordable in Wallowa County?
Yes ( ) No ( )
Comments:
4. How far do you travel to get the majority of your groceries? (check one)
0-5 miles ( ) 6-10 miles ( ) 11-25miles ( ) 26+miles ( )
5. What is your primary food source? (check one)
Grocery Stores ( ) Food Bank ( ) Farmers’ Market ( ) Grow Your Own ( ) Convenience Stores ( ) Large retail (Costco, Winco, etc.) ( ) Restaurants ( ) Natural/Specialty Stores ( ) Food Coop/Buying Club ( ) 6. In addition to your primary source listed above, what other food sources do you utilize? (check all that apply) Hunting ( ) Fishing ( ) Food Bank ( ) Community Meals ( ) Grow Your Own ( ) Barter/Trade ( ) Restaurants ( ) Farmers’ Market ( ) Natural/Specialty Stores ( ) Convenience Stores ( ) Gleaning ( ) Large retail (Costco, Winco, etc.) ( ) Food Coop/Buying Club ( )

Appendix A
Page | 3
7. Which of the following factors do you feel affect your ability to get the food you need? (check all that apply) Low income ( ) Rising cost of household expenses (ex. Childcare, rent, utilities) ( ) Lack of time ( ) Availability and variety of quality food ( ) Lack of transportation ( ) Distance ( ) High food cost ( ) 8. Please rank the following factors in order of importance (1 being the highest and 5 the lowest) of what shapes your decisions regarding a food purchase:
Price ( ) Convenience ( ) Locally Produced ( ) Taste ( ) Healthfulness ( ) 9. Are you eligible for government food assistance?
Yes ( ) No ( ) Not Sure ( )
10. If Yes, then which program(s) do you, or your children, utilize? (check all that apply)
Reduced Price/Free School Lunch and/or Breakfast ( ) Other: [ex. church pantry] ( ) Food bank/Pantry ( ) Farm Direct Nutrition Program ( ) Describe WIC ( ) Meals on Wheels ( ) SNAP (Food Stamps) ( ) Senior Meals ( )
11. If you are not sure of your eligibility for food assistance, what factors have prevented you from seeking out this information and what do you think would help you find out if you are eligible?
Comment:
12. Have you utilized emergency food services in the past twelve months (ex. food bank/pantry or soup kitchen)?
Yes ( ) No ( )
13. If yes, do any of the following factors make it difficult for you to access emergency food services? (Check all that apply) There is not a food pantry near my residence ( ) I don’t feel comfortable going there for help ( ) Transportation is not available ( ) Service hours are too limited and I can’t make it there in time ( ) They don’t have the kind of food that I like ( )

Appendix A
Page | 4
They limit the amount of food that I can get ( ) No, I don’t have any trouble getting emergency food help ( ) 14. Do you buy food that is grown/produced locally in Wallowa County? (check all that apply)
Fruits and Vegetables( ) Dairy ( ) Honey ( ) Don’t Know ( ) Meat ( ) Eggs ( ) Baked Goods ( ) No, I do not ( ) Poultry ( ) Fish ( ) Other: Processed foods (jam, salsa, pickes, etc.) ( ) 15. If you do not purchase food that is locally produced, what is the main reason that keeps you from doing so? (check one)
Too Expensive ( ) Not available ( ) Not what I like ( ) Don’t know where to get it ( ) Other: 16. Would you be interested in learning more about any of the following?
(Check all that apply)
Growing fruits and vegetables ( ) Raising livestock (including poultry) ( ) Cooking healthy food ( ) Local food for schools/ school gardens ( ) Having a certified community kitchen for making value-added products to sell ( ) Shopping on a budget ( ) Food preservation ( ) Community gardens ( ) Other:
Once completed, you can return this survey to the place where you got it, or you can return it to the NE Oregon Economic Development District office at:
101 NE First Street, Enterprise, OR 97828.
The results of this survey will used in the 2012 Wallowa County Food Assessment.
Your responses will remain confidential.
Thank you for your time, your opinion is greatly appreciated!!!
Questions? Contact Joshua Russell at 541-426-9058 or [email protected].

Appendix B
Rural Grocery Store Owner Survey Rural Community Food Systems Assessment Project
Name of store:
Address:
Phone number:
Contact person for store:
Email address:
Would you like to be added to a listserv for rural grocery store owners and advocates?
____ yes ____ no 1. What major products and services does your store offer? Check all that apply.
ATM Bank Hunting/fishing/camping supplies Books/cards/gifts Institutional supply (school, hospital) Café/restaurant Pharmacy Catering Photo development Delicatessen Pre-packaged snacks Fuel Self-serve snacks/drinks Groceries Video rental Other (specify)
2. Who is/are your primary grocery supplier(s)? _____________________________________________________________________________________ 3. What products do your secondary suppliers supply? ____________________________________________________________________________________ 4. Do minimum (purchasing/ordering) buying requirements create a problem for your grocery store?
____ yes ____ no If yes, how? 5. If minimum buying requirements are a problem, what solutions might you suggest? 6. As an independent grocer, do you feel you are getting fair pricing from your suppliers compared to
chain stores?

Rural Grocery Store Owner Survey – Oregon Food Bank Rural Community Food Systems Assessment Project
2
____ yes ____ no
Comments: 7. Have you had problems getting products delivered because of your location?
____ yes ____ no Comments: 8. Do you sell locally-produced food in your store?
____ yes ____ no
If yes, what products? 9. Do you accept Food Stamps/SNAP?* ____ yes ____ no
Do you accept WIC?** ____ yes ____ no
* Supplemental Nutrition Assistance Program ** Women, Infants and Children Program 10. Has your business been negatively affected by the presence of emergency or supplemental food distribution in your community (i.e. people get bread from food pantry or gleaners so don’t buy it from you)? ____ yes ____ no If yes, explain: 11. Which of the following are major challenges for your store? Check all that apply.
Availability of satisfactory labor Lack of community support Competition with large chain grocery stores Low sales volume Debt and/or high payments Narrow profit margins
Government regulations Required minimum buying requirements from vendors
High inventory costs/low turnover
Shoplifting/bad checks/internal theft/unpaid accounts
Shortage of working capital Taxes High operations costs (utilities, building
lease, repairs/maintenance, etc.) Other (specify)
Which of the above do you feel is the most significant for you and your store? _____________________________________________________________________________________

Rural Grocery Store Owner Survey – Oregon Food Bank Rural Community Food Systems Assessment Project
3
12. Do you collaborate with other small independently owned stores? ____ yes ____ no If yes, for which purposes? Check all that apply.
Cooperative advertising/marketing Grocery distribution purposes Sharing concerns and/or ideas To achieve minimum buying requirements Other
If no, would you be interested in doing this?
____ yes ____ no
Why or why not? 13. Do you feel that a statewide alliance of small, independently owned grocery store owners may have
value? ____ yes ____ no
If yes, how could it help? 14. What marketing strategies have you used in your grocery stores that have been effective in drawing
in customers?
Advertising Newspapers Radio TV Flyers/inserts Facebook Internet/WWW Promotions Word of mouth OTHER: Please identify:

Rural Grocery Store Owner Survey – Oregon Food Bank Rural Community Food Systems Assessment Project
4
When running a grocery store, how important is it to you to offer each of the following? Rate the importance of each by circling the number that best fits your response. Not Very
Important Very Important
1. Quality of food . . . . . . . . . . . . . . . . . . . . . . . . Comments:
1
2
3
4
5
2. Availability of food (variety, brand choices) Comments:
1
2
3
4
5
3. Prices of items offered . . . . . . . . . . . . . . . . . . . Comments:
1
2
3
4
5
4. Customer service . . . . . . . . . . . . . . . . . . . . . . . Comments:
1
2
3
4
5
5. Business hours . . . . . . . . . . . . . . . . . . . . . . . . . Comments:
1
2
3
4
5
6. Buying locally. . . . . . . . . . . . . . . . . . . . . . . . . . Comments:
1
2
3
4
5
Which of the above do you feel is the most significant for you and your store? ______________________________________________________________________________

Rural Grocery Store Owner Survey – Oregon Food Bank Rural Community Food Systems Assessment Project
5
7. Accepting Food Stamps/SNAP and WIC. . . . . Comments:
1
2
3
4
5
Which of the above do you feel is the most significant for you and your store? ____________________________________________________________________________________ How do you assess the buying needs of your customer? Is your stocking of products responsive to customer requests? What other concerns or comments do you have?
How does your store do at providing the following to customers? Rate your store by circling the number that best fits your response. Not Very
Well__ Very Well
1. Quality of food . . . . . . . . . . . . . . . . . . . . . . . . Comments:
1
2
3
4
5
2. Availability of food (variety, brand choices) Comments:
1
2
3
4
5
3. Prices of items offered . . . . . . . . . . . . . . . . . . . Comments:
1
2
3
4
5
4. Customer service . . . . . . . . . . . . . . . . . . . . . . . Comments:
1
2
3
4
5
5. Business hours . . . . . . . . . . . . . . . . . . . . . . . . . Comments:
1
2
3
4
5
6. Buying locally. . . . . . . . . . . . . . . . . . . . . . . . . . Comments:
1
2
3
4
5

Rural Grocery Store Owner Survey – Oregon Food Bank Rural Community Food Systems Assessment Project
6
Tell us about your store: How long have you been in the grocery business as an owner? __________ How long has there been a grocery store at your current location? __________ Do you have more than one location? _____ How many? _____ What are your hours of operation? Mon _____ to _____ Tues _____ to _____ Wed _____ to _____ Thur _____ to _____ Fri _____ to _____ Sat _____ to _____ Sun _____ to _____ Are you open on the major holidays (Christmas, New Years, Thanksgiving, etc.)? _____ Are there other grocery outlets in your community? _____ a ‘quick shop’ _____ another full service grocery How far is it to the nearest discount grocery (Wal-Mart, etc?) _____ How many employees do you have, not counting yourself? _____full-time (40 hrs/week minimum) _____ part-time (less than 40hrs/week) What are your average weekly gross sales? _____Less than $5,000
_____Between $5,000 and $10,000 _____Between $10,000 and $20,000 _____Greater than $20,000 This survey was developed by Kansas State University Center for Civic Engagement and is being used with their permission. We thank them for their support of this project. For more information, please contact Sharon Thornberry, Community Food Systems Manager, Oregon Food Bank, [email protected] or Megan Newell-Ching, Community Resource Developer, Oregon Food Bank, 1-800-777-7427 x2270 or [email protected]

Appendix C
Crossroads Resource Center
7415 Humboldt Ave. S. / Minneapolis, Minnesota 55423 / 612.869.8664 [email protected] www.crcworks.org
Tools for Community Self-determination
Wallowa County, Oregon Local Farm & Food Economy
Highlights of a data compilation
by Ken Meter, Crossroads Resource Center (Minneapolis)1
for
Oregon Rural Action
December 30, 2011 Wallowa County (Bureau of Economic Analysis, 2009) 6,889 residents receive $225 million of income annually. Although income from retail and manufacturing has fallen over the past ten years, personal income still increased 82% from 1969 – 2009, after dollars were adjusted for inflation. Population growth [see below] played a significant role in this increase. The largest source of personal income is transfer payments (from government programs such as pensions), which account for $62 million (28%) of personal income [see below]. Capital income (from interest, rent or dividends) ranks just below transfer payments, with a rounded-off value of $62 million of personal income. Government jobs rank third, with $37 million. Retail jobs rank fourth, with $13 million. Health care jobs ranked next, with $8 million. Manufacturing jobs produce $5 million of personal income. Note that income from public sources makes up 44% of all personal income earned in the county.
Income earned from transfer payments includes $27 million of retirement and disability insurance benefits, $22 million of medical benefits, $3.9 million of income maintenance benefits, $4.2 million of unemployment insurance, and $2.6 million of veteran’s benefits.
Government income includes $9 million of income earned by federal workers, $3 million for state government workers, and $24 million earned by local government staff. Military personnel earn $949,000 of personal income.
Although population has increased 10% since 1969, there has been only limited public planning to assure a secure and stable food supply.
Issues affecting low-income residents of Wallowa County: Nearly 1,900 residents (28%) earn less than 185% of federal poverty guidelines. At this level of income, children qualify for free or reduced-price lunch at school. These lower-income residents spend $12 million each year buying food, including $1 million of SNAP benefits (formerly known as
1 Nick Wojciak contributed substantial research to this report.

Highlights of Wallowa County (Oregon) Farm & Food Economy — Ken Meter, Crossroads Resource Center
— 2 —
food stamps) and additional WIC coupons. The county’s 526 farmers receive an annual combined total of $4 million in subsidies (23-year average, 1987-2008), mostly to raise crops such as wheat that are sold as commodities, not to feed Wallowa County residents. Data from Federal Census of 2000, Bureau of Labor Statistics, & Bureau of Economic Analysis.
9% percent of the county’s households (nearly 600 residents) earn less than $10,000 per year. Source: Federal Census American Community Survey 2005-2009.
20% of Oregon adults aged 18-64 carry no health insurance. Source: Centers for Disease Control.
Food-related health conditions: 26% of Oregon residents reported in 2009 that they eat five or more servings of fruit or vegetables each day. 74% do not. This is a key indicator of health, since proper fruit and vegetable consumption has been connected to better health outcomes. Source: Centers for Disease Control.
56% of Oregon adults reported in 2009 they have at least 30 minutes of moderate physical activity five or more days per week, or vigorous physical activity for 20 or more minutes three or more days per week. Source: Centers for Disease Control.
7% of Oregon residents have been diagnosed with diabetes as of 2010. Source: Centers for Disease Control. Medical costs for treating diabetes and related conditions in Wallowa County are estimated at $4 million per year. Costs for the state of Oregon as a whole total $2.2 billion. Source: American Diabetes Association cost calculator.
61% of Oregon residents are overweight (33%) or obese (28%). Source: Centers for Disease Control.
The county’s farms (Agricultural Census, 2007) Agricultural Census data for 2007 were released February 4, 2009
The Census of Agriculture defines a “farm” as “an operation that produces, or would normally produce and sell, $1,000 or more of agricultural products per year.”
Land:
• 526 farms. This is 1% of Oregon farms. • The county had 5% more farms in 2007 than in 2002. Some of this may be due to census
takers making better contact with small farms. • 113 (21%) of these are 1,000 acres or more in size. • 170 (32%) farms are less than 50 acres. • Average farm size is 1,004 acres, more than double the state average of 425 acres. • The county has 528,000 acres of land in farms. • This amounts to 3% of the state’s farmland. • Wallowa County holds 49,000 acres of harvested cropland. • 45,000 of these acres are irrigated. • Average value of land and buildings per farm was $1.2 million. This was significantly more
than the 2007 state average of $804,000.

Highlights of Wallowa County (Oregon) Farm & Food Economy — Ken Meter, Crossroads Resource Center
— 3 —
Sales: With the exception of foods sold directly to consumers (see below), farmers typically sell commodities to wholesalers, brokers or manufacturers that require further processing or handling to become consumer items. The word “commodities” is used in this report to mean the crops and livestock sold by farmers through these wholesale channels. The term “products” encompasses commodity sales, direct sales, and any other sales.
• The county’s farmers sold $32 million of crops and livestock in 2007. • Farm product sales increased by 55% from 2002 to 2007. • $12 million of crops were sold. • $20 million of livestock and products were sold. • 275 (52%) of the county’s farms sold less than $10,000 of products in 2007. • Total sales from these small farms were $598,000, 2% of the county’s farm product sales. • 84 (16%) of the county’s farms sold more than $100,000 of products. • Total sales from these larger farms were $25 million, 78% of the county’s farm product sales. • 51% of the county’s farms (269 of 526) reported net losses in 2007. This is less than the
Oregon average of 65%. • 209 (40%) of Wallowa County farmers collected a combined total of $2.9 million of federal
subsidies in 2007. Top farm products of Wallowa County (2007). Note that sales data for aquaculture, fruits, tree nuts, and berries, sheep, goats, and their products, Christmas trees, and vegetables were suppressed by the USDA in an effort to protect confidentiality. Therefore, these products are not included in this chart.
Product $ millions Cattle and calves 19 Forage (hay, etc.) 7 Wheat 3 Barley 1
Production Expenses: • Feed purchases were the largest single expense for Wallowa farmers in 2007, totaling $3.7
million (13% of production expenses). • Gasoline, fuel, and oil ranked as the second most important expense, at $3.6 million (12%). • Supplies, repairs, and maintenance cost farmers $3.5 million (12%). • Farmers charged $3.4 million (11%) to depreciation. • Land and building rental cost farmers $2.8 million (9%). • Interest expenses totaled $2.6 million (9%). • Hired farm labor cost farmers $2.3 million (8%). • Fertilizer, lime, and soil conditioners cost $2.2 million (7%).
Cattle & Dairy:
• 270 farms hold an inventory of 43,000 cattle. • 26,000 cattle worth $19 million were sold by farmers in 2007. • 240 farms raise beef cows. • 10 farms raise milk cows. • 227 farms produced 114,000 tons of forage crops (hay, etc.) on 35,000 acres. • 139 farms sold $7 million of forage.

Highlights of Wallowa County (Oregon) Farm & Food Economy — Ken Meter, Crossroads Resource Center
— 4 —
Other Livestock & Animal Products:
• 9 farms hold an inventory of 38 hogs and pigs. • 9 farms sold 75 hogs and pigs in 2007. • 47 farms hold an inventory of 1,446 sheep and lambs. • 53 farms sold sheep, goats, and lambs in 2007. Note that data for sales of sheep, goats, and their
products were suppressed by the USDA in an effort to protect confidentiality. • 36 farms hold an inventory of 618 laying hens. • One farm raises broiler chickens. • 3 farms engage in aquaculture. • 54 farms raise horses and ponies.
Grains, Oil Seeds, & Edible Beans:
• 56 farms produced $4.1 million of grains, oil seeds, and edible beans. • 39 farms produced 405,000 bushels of wheat on 8,117 acres, worth $2.7 million. • This amounts to an average price per bushel of wheat of $6.66. Note that this price is an
approximation, and does not necessarily represent the actual price at which wheat was sold. • This includes:
o 20 farms produced 157,000 bushels of winter wheat on 3,778 acres. o 26 farms produced 248,000 bushels of spring wheat on 4,339 acres.
Vegetables & Melons (some farmers state that Ag Census data does not fully represent vegetable production):
• 16 farms worked 101 acres to produce vegetables. Note that data for vegetable sales were suppressed by the USDA in an effort to protect confidentiality.
• This represents a 45% increase in the number of farms (from 11 in 2002). • 6 farms raised potatoes.
Fruits (some farmers state that Ag Census data does not fully represent fruit production):
• 2 farms in the county have orchards. Note that data for acreage of orchards were suppressed by the USDA in an effort to protect confidentiality.
• 2 farms sold fruits, nuts and berries. Note that data for sales of fruits, nuts, and berries were suppressed by the USDA in an effort to protect confidentiality.
Nursery & Greenhouse Plants:
• 6 farms sold $101,000 worth of ornamentals in 2007. • This represents a decrease of 33% in the number of farms (from 9 in 2002) and an increase
of 2% in the number of sales from 2002. • One farm sold Christmas trees.
Direct & Organic Sales:
• 57 farms sell $313,000 of food products directly to consumers. This is a 12% increase of number of farms (51 in 2002) selling direct over 2002, and a 240% increase in direct sales over 2002 sales of 92,000.
• This amounts to 1% of farm product sales, more than double the national average of 0.4%.

Highlights of Wallowa County (Oregon) Farm & Food Economy — Ken Meter, Crossroads Resource Center
— 5 —
• 10 farms in the county sold $378,000 of organic products, accounting for 0.4% of Oregon’s organic sales.
• For comparison, 799 farms in Oregon sold $88 million of organic food products. • 9 farms market through community supported agriculture (CSA). • 89 farms produce and sell value-added products.
Conservation Practices:
• 154 farms use conservation methods such as no-till, limited tilling, filtering field runoff to remove chemicals, fencing animals to prevent them from entering streams, etc.
• 197 farms practice rotational or management intensive grazing. • 14 farms generate energy or electricity on the farm.
Other Crops:
• 11 farms produced 43,000 bushels of oats on 453 acres. Note that the USDA does not report sales data for oats.
• 29 farms produced 259,000 bushels or barley on 3,827 acres, worth $1.2 million.

Highlights of Wallowa County (Oregon) Farm & Food Economy — Ken Meter, Crossroads Resource Center
— 6 —
Limited-resource farms and others in Wallowa County (Census of Agriculture, 2007)
Small family farms: Farms Percent Acres Percent
Limited-resource 71 13% 41,903 8% Retirement 105 20% 47,845 9% Residential/lifestyle 181 34% 76,225 14% Farming occupation/lower sales 76 14% 61,423 12% Farming occupation/higher sales 31 6% 44,163 8%
Large family farms 23 4% 119,388 23% Very large family farms 9 2% 45,884 9% Nonfamily farms 30 6% 91,126 17%
Total 526 527,957
Definitions of terms (Agricultural Census 2007):
Limited-resource farms have market value of agricultural products sold gross sales of less than $100,000, and total principal operator household income of less than $20,000.
Retirement farms have market value of agricultural products sold of less than $250,000, and a principal operator who reports being retired.
Residential/lifestyle farms have market value of agricultural products sold of less than $250,000, and a principal operator who reports his/her primary occupation as other than farming.
Farming occupation/lower-sales farms have market value of agricultural products sold of less than $100,000, and a principal operator who reports farming as his/her primary occupation.
Farming occupation/higher-sales farms have market value of agricultural products sold of between $100,000 and $249,999, and a principal operator who reports farming as his/her primary occupation.
Large family farms have market value of agricultural products sold between $250,000 and $499,999.
Very large family farms have market value of agricultural products sold of $500,000 or more.
Nonfamily farms are farms organized as nonfamily corporations, as well as farms operated by hired manager.

Highlights of Wallowa County (Oregon) Farm & Food Economy — Ken Meter, Crossroads Resource Center
— 7 —
County and State Highlights
Wallowa County highlights (Agriculture Census 2007): • 526 farms, 5% more than in 2002. • Wallowa County has 528,000 acres of land in farms. • Farmers sold $32 million of products in 2007. • $12 million (38%) of these sales were crops. • $20 million (62%) of these sales were livestock. • The most prevalent farm size is 1,000 acres or more with 113 farms (21%) in this category. • The next most prevalent is 108 acres with 108 (21%) farms. • 170 farms (32%) are less than 50 acres. • 275 farms (52%) sold less than $10,000 in farm products. • 84 farms (16%) sold more than $100,000 in farm products. • Wallowa County ranks 1st in Oregon for inventory of bison, but inventory figures were not
reported by the USDA in an effort to protect confidentiality. • The county ranks 4th in the state for acreage of short-rotation woody crops, but acreage figures
for short-rotation woody crop were not reported by the USDA in an effort to protect confidentiality. • Wallowa County ranks 5th in the state for sales of barley, with 3,827. • The county ranks tenth in Oregon for acreage of forage (hay, etc.), with 35,000. • Wallowa County ranks 10th in the state for acreage of wheat, with 8,117. • The county ranks 10th in the state for inventory of cattle and calves, with 43,000. • 57 farms sold $313,000 of food directly to consumers. This is a 12% increase in the number
of farms selling direct (51 in 2002), and a 240% increase in direct sales over 2002 sales of $92,000.
• Direct sales were 1% of farm product sales, more than double the national average of 0.4%.

Highlights of Wallowa County (Oregon) Farm & Food Economy — Ken Meter, Crossroads Resource Center
— 8 —
State of Oregon highlights (Agriculture Census 2007): • 38,553 farms, 4% less than in 2002. • Oregon has 16 million acres of land in farms. • Farmers sold $4.4 billion of products in 2007. • $3 billion (68%) of these sales were crops. • $1.4 billion (32%) of these sales were livestock. • The most prevalent farm size is 10 to 49 acres with 14,142 farms (37%) in this category. • The next most prevalent is 1 to 9 acres with 9,546 (25%) farms. • 2,564 farms (7%) are 1,000 acres or more. • 23,688 farms (61%) are less than 50 acres. • 26,035 farms (68%) sold less than $10,000 in farm products. • 4,678 farms (12%) sold more than $100,000 in farm products. • Oregon ranks 1st in the U.S. for acreage of Christmas trees, with 67,000. • The state ranks 1st in the country for acreage of field and grass seed crops, with 557,000. • Oregon ranks first in the country for sales of Christmas trees, with $117 million. • The state ranks 3rd in the U.S. for sales of ornamentals, with $989 million. • Oregon ranks 3rd in the country for sales of forage crops (hay, etc.), with $698 million. • The state ranks fourth in the country for sales of fruits, tree nuts, and berries, with $516
million. • Oregon ranks 9th in the U.S. for sales of sheep, goats, and their products, with $21 million. • The state ranks 9th in the country for acreage of vegetables, with 150,000. • Oregon ranks ninth in the country for inventory of sheep and lambs, with 217,000. • The state ranks 10th in the U.S. for vegetable sales, with $339 million. • 6,274 farms sold $56 million of food directly to consumers. This is a 2% decrease in the
number of farms selling direct (6,383 in 2002), and a 163% increase in direct sales over 2002 sales of $21 million.
• Direct sales were 1.3% of farm product sales, over three times the national average of 0.4%. • If direct food sales made up a single commodity, the value of these sales would outrank the
state’s 15th-most important product, chicken eggs. • 933 farms farm organically, with a total of 46,000 acres of harvested cropland, and 42,000
acres of pastureland. • 16,000 acres on 470 farms are undergoing organic conversion. • 799 farms in Oregon sold $88 million of organic food products, including $42 million of
crops (this may include ornamental and greenhouse crops), $3 million of livestock and poultry, and $43 million of products from livestock and poultry (such as milk or eggs).
• 311 farms market through community supported agriculture (CSA). • 1,753 farms produce value-added products. • 9,327 farms use conservation methods such as no-till, limited tilling, filtering field runoff to
remove chemicals, fencing animals to prevent them from entering streams, etc. • 9,694 farms practice rotational management of intensive grazing. • 631 farms generate energy or electricity on the farms.

Highlights of Wallowa County (Oregon) Farm & Food Economy — Ken Meter, Crossroads Resource Center
— 9 —
Oregon’s top farm products in 2010 (Economic Research Service) See chart on next page.
$ millions
1 Ornamentals 760 2 Cattle & calves 446 3 Dairy products 412 4 Wheat 326 5 Hay 253 6 Potatoes 139 7 Onions 129 8 Ryegrass 123 9 Pears 90
10 Cherries 78 11 Fescue 73 12 Hazelnuts (filberts) 67 13 Blueberries 64 14 Grapes 63 15 Chicken eggs 52 16 Mint 43 17 Blackberries 35 18 Hops 31 19 Corn 27 20 Apples 26 21 Corn, sweet 26 22 Beans, snap 20 23 Sheep and lambs 19 24 Bluegrass, Kentucky 19
Note: broiler chickens were also listed among Oregon’s top 25 products, but sales figures for these products were not released by ERS, in an effort to protect confidentiality.
Note also that at $56 million, direct sales from farmers to consumers amount to more than the value of the 15th-ranking product, chicken eggs.

Highlights of Wallowa County (Oregon) Farm & Food Economy — Ken Meter, Crossroads Resource Center
— 10 —
Oregon’s top farm products in 2010 (Economic Research Service) See table on previous page
Top farm products in Oregon, 2010
Ornamentals 23%
Cattle & calves 13%
Dairy products
12%
Wheat 10%
Other 7%
Chicken eggs
2%
Grapes
2%
Pears
Hay 8%
Potatoes 4%
Onions 4%
Ryegrass Blueberries
2% Fescue 3% 4%
2%
Cherries Hazelnuts (filberts) 2%
2% Source: USDA Economic Research Service

Highlights of Wallowa County (Oregon) Farm & Food Economy — Ken Meter, Crossroads Resource Center
— 11 —
Balance of Cash Receipts and Production Costs (BEA): Wallowa County ranchers and farmers sell $40 million of food products per year (1987-2009 average), spending $50 million to raise them, for an average loss of $10 million each year, or 27% of sales. Note that these sales figures compiled by the BEA may differ from cash receipts recorded by the USDA Agriculture Census (above).
Overall, farm producers spent $245 million more producing crops and livestock than they earned by selling these products from 1987 to 2009. Farm production costs exceeded cash receipts for 21 years of that 23-year period. Moreover, 51% of the county's farms and ranches reported a net loss to the 2007 Census of Agriculture. Wallowa County farmers and ranchers earned $16 million less by selling farm products in 2009 than they earned in 1969 (in 2009 dollars).
Farmers and ranchers earn another $6 million per year of farm-related income — primarily custom work, and rental income (23-year average for 1987-2009). Federal farm support payments are relatively small, averaging $4 million per year for the entire county for the same years.
The county's consumers: See also information covering low-income food consumption and food-related health conditions, page 1-2 above.
Wallowa County consumers spend $18 million buying food each year, including $11 million for home use. Most of this food ($16 million) is produced outside the county. Only $313,000 of food products (1% of farm cash receipts and 1.7% of the county’s consumer market) are sold by farmers directly to consumers.
Estimated change in net assets (that is, assets minus liabilities) for all county households combined was a loss of $36 million in 2009 alone (BLS). This places additional pressure on Wallowa County consumers trying to buy food.
Farm and food economy summary: Farmers lose $10 million each year producing food commodities, while spending $17 million buying inputs sourced outside of the county. From the standpoint of the county as a whole, these external input purchases take money away from the local economy. This is a total loss of $27 million to the county.
Meanwhile, consumers spend $16 million buying food from outside. Thus, total loss to the county is $43 million of potential wealth each year. This loss amounts to more than the value of all food commodities raised in the county.

Highlights of Wallowa County (Oregon) Farm & Food Economy — Ken Meter, Crossroads Resource Center
— 12 —
Wallowa County: markets for food eaten at home (2009): Wallowa County residents purchase $18 million of food each year, including $11 million to eat at home. Home purchases break down in the following way:
millions
Meats, poultry, fish, and eggs $ 2.3 Fruits & vegetables 2.0 Cereals and bakery products 1.4 Dairy products 1.1 “Other,” incl. Sweets, fats, & oils 3.9
If Wallowa County residents purchased 15% of their food for home use directly from county farmers, this would generate $1.6 million of new farm income for the county. This would require each resident of the county to buy, on average, less than $5.00 of food directly from farmers each week.
Northeast Oregon: markets for food eaten at home (2009): Northeast Oregon residents purchase $322 million of food each year, including $189 million to eat at home. Home purchases break down in the following way:
millions Meats, poultry, fish, and eggs $ 40.8 Fruits & vegetables 34.5 Cereals and bakery products 24.1 Dairy products 20.2 “Other,” incl. Sweets, fats, & oils 68.2
If Northeast Oregon residents purchased 15% of their food for home use directly from farmers in the region, this would generate $28 million of new farm income. This would require each resident of the region to buy, on average, less than $5.00 of food directly from farmers each week.
Pendleton: markets for food eaten at home (2009): Pendleton residents purchase $225 million of food each year, including $131 million to eat at home. Home purchases break down in the following way:
millions Meats, poultry, fish, and eggs $ 28.6 Fruits & vegetables 24.2 Cereals and bakery products 16.8 Dairy products 14.1 “Other,” incl. Sweets, fats, & oils 47.7

Highlights of Wallowa County (Oregon) Farm & Food Economy — Ken Meter, Crossroads Resource Center
— 13 —
Baker County: markets for food eaten at home (2009): Baker County residents purchase $43 million of food each year, including $25 million to eat at home. Home purchases break down in the following way:
millions
Meats, poultry, fish, and eggs $ 5.4 Fruits & vegetables 4.6 Cereals and bakery products 3.2 Dairy products 2.7 “Other,” incl. Sweets, fats, & oils 9.0
Umatilla County: markets for food eaten at home (2009): Umatilla County residents purchase $195 million of food each year, including $114 million to eat at home. Home purchases break down in the following way:
millions Meats, poultry, fish, and eggs $ 24.7 Fruits & vegetables 20.9 Cereals and bakery products 14.6 Dairy products 12.2 “Other,” incl. Sweets, fats, & oils 41.2
Union County: markets for food eaten at home (2009): Union County residents purchase $66 million of food each year, including $39 million to eat at home. Home purchases break down in the following way:
millions
Meats, poultry, fish, and eggs $ 8.4 Fruits & vegetables 7.1 Cereals and bakery products 5.0 Dairy products 4.2 “Other,” incl. Sweets, fats, & oils 14.1
Metro Boise: markets for food eaten at home (2009): Metro Boise residents purchase $1.9 billion of food each year, including $1.1 billion to eat at home. Home purchases break down in the following way:
millions Meats, poultry, fish, and eggs $ 239 Fruits & vegetables 202 Cereals and bakery products 141 Dairy products 118 “Other,” incl. Sweets, fats, & oils 400
Highlights of Wallowa County (Oregon) Farm & Food Economy — Ken Meter, Crossroads Resource Center
— 14 —
Oregon: markets for food eaten at home (2009): Oregon residents purchase $10 billion of food each year, including $6 billion to eat at home. Home purchases break down in the following way:
millions Meats, poultry, fish, and eggs $ 1,287 Fruits & vegetables 1,089 Cereals and bakery products 759 Dairy products 636 “Other,” incl. Sweets, fats, & oils 2,150

Highlights of Wallowa County (Oregon) Farm & Food Economy — Ken Meter, Crossroads Resource Center
— 15 —
Key data sources: Bureau of Economic Analysis data on farm production balance http://www.bea.doc.gov/bea/regional/reis/
Food consumption estimates from Bureau of Labor Statistics Consumer Expenditure Survey http://www.bls.gov/cex/home.htm
U.S. Census of Agriculture http://www.nass.usda.gov/census/
USDA/Economic Research Service food consumption data: http://www.ers.usda.gov/data/foodconsumption/
USDA/ Economic Research Service farm income data: http://ers.usda.gov/Data/FarmIncome/finfidmu.htm
For more information: To see results from Finding Food in Farm Country studies in other regions of the U.S.: http://www.crcworks.org/locales.html
To read the original Finding Food in Farm Country study from Southeast Minnesota (written for the Experiment in Rural Cooperation): http://www.crcworks.org/ff.pdf
To view a PowerPoint presented in March, 2008, by Ken Meter at Rep. Collin Peterson’s (D-MN) Minnesota agricultural forum, called the “Home Grown Economy”: http://www.crcworks.org/crcppts/petersonkm08.pdf
To get a brief list of essential food facts, many of which are cited in the presentation above, http://www.crcworks.org/foodmarkets.pdf
To link to further analysis of farm and food economies in the U.S.: http://www.crcworks.org/econ.html
Contact Ken Meter at Crossroads Resource Center <[email protected]>
(612) 869-8664

Appendix D
1
Basic Information and Suitability for Producing Foods for Sale - A Selection of Wallowa County Kitchens
Name Location Contact Food Processing
Baking Ready to Eat Packaged Foods
Catering Classes or Home Canning
Currie Kitchen Joseph Sherri Currie, 541 398 2425
Yes Yes Yes Yes Not suitable.
Cold Storage Frozen Storage
Dry Storage Cost Notes
Yes Limited Limited $80 for full day
Available on case by case basis. Has regular oven, indoor smoker ovens, stainless steel prep tables, two commercial refrigerators, commercial ice machine, small commercial dishwasher. No late night use. Must have own license and insurance.
Name Location Contact Food Processing
Baking Ready to Eat Packaged Foods
Catering Classes or Home Canning
Lostine Presbyterian Church Manse Kitchen
Lostine June Colony, 541 569 2388
Not at this time
Yes Not at this time
Not at this time
Yes, cooking classes and home canning are unlicensed uses.
Cold Storage Frozen Storage
Dry Storage Cost Notes
Limited Limited Yes By donation
This kitchen must be used under supervision of kitchen manager, June Colony. Standard size oven, refrigerator and freezer. No dishwasher; double sink with additional dishpan are used to meet “triple sink” dishwashing requirements. The owner hopes to increase equipment available via donated items. A standard label template will be provided and users will be assisted to customize the labels to meet requirements of baked goods produced for sale.

Appendix D
2
Name Location Contact Food Processing
Baking Ready to Eat Packaged Foods
Catering Classes or Home Canning
Cloverleaf Hall Kitchen
Fair Grounds Enterprise
Wallowa County Extension 541 426 3143
Limited Limited Limited Limited Yes, does not require a license.
Cold Storage Frozen Storage
Dry Storage Cost Notes
Yes Yes No Daily $75 Hourly $20
The Wallowa County Fair Board has jurisdiction over the facility, but the County Extension office currently manages scheduling and access. This kitchen has been used by a licensed food processor who completely uses all ingredients each time he prepares food so that onsite ingredient storage is not necessary. It has also been used by a licensed caterer. It could accommodate catering done under a temporary restaurant license, for uses that would not require ongoing onsite dry, cold or frozen storage. Most other uses would require dry storage for ingredients and utensils and currently there is no dry storage available. There is the potential to develop dry storage and also additional cold and frozen storage in other parts of the building if the Fair Board determines they would like to support more business use of the facility. The kitchen is also suited to non-licensed uses like classes, home canning, and private events. Equipment includes commercial gas flat top grill, 6 burner range and 2 ovens with hood/fire suppression system; 2 standard electric ranges/ovens; commercial dishwasher, triple sink, 2 handwashing sinks, dishwashing sink, microwave, 2 rolling steam tables, 2 rolling carts, 1 commercial reach-in refrigerator, 1 small chest freezer, 1 can opener, and a microwave. There are two stainless steel prep tables and limited counter space. The kitchen has some commercial pots/pans/bowls, baking sheets and baking pans, kitchen ware, dishes and silverware available for use with additional fee of $35 per day. A cleaning deposit of $50 is required for use of the kitchen. The kitchen features roll-up windows to adjacent meeting room (seats 40 with tables and chairs) and main hall (seats 600 with tables and chairs). Meeting room and main hall have separate fees and

Appendix D
3
cleaning deposits. Name Location Contact Food
Processing Baking Ready to
Eat Packaged Foods
Catering Classes or Home Canning
Joseph Civic Center
Joseph Debbie Short 541 432 1015 Donna Warnock 541 432 3832
Not at this time
Limited Not at this time
Possibly Yes, classes and home canning do not require a license.
Cold Storage Frozen Storage
Dry Storage Cost Notes
Yes No Not at this time
$125 per day
The Civic Center belongs to the City of Joseph and is currently managed by the Joseph Chamber of Commerce. This kitchen can be used for private parties/events with food served to invited guests, and for other unlicensed uses such as home canning projects and classes. It may be able to accommodate a licensed baking operation if all ingredients were used each time and were not required to be stored on site. It could become suitable for temporary events (catered and public events), but would require modification of the food prep sink drain. There is not adequate on site storage to accommodate most licensed uses at this time. The kitchen is well set-up and equipped with a large gas grill, 10 burner gas range & 3 gas ovens, hood and fire suppression system; 1 convection oven, 2 reach-in commercial refrigerators, 1 large commercial dishwasher and dishwashing sink, 1 under-the-counter stainless steel dishwasher, 1 five unit electric food heating table, 1 slicer, 1 microwave, 1 two-drawer built-in Toastmaster, 1 butcher block counter, 1 formica covered food prep island, 1 double food prep sink, 1 hand wash sink, and multiple wooden cupboards and drawers, including some with locks. A roll-up window provides access from the main room to the dishwashing area and a large roll-up window provides access to the food warmer table (buffet service) from the main hall. There are also large coffee pots, cookware and baking sheets, and other miscellaneous cooking and baking utensils. Dishes, serving ware and table service are also available.

Appendix D
4
Name Location Contact Food
Processing Baking Ready to Eat
Packaged Foods
Catering Classes or Home Canning
Wallowa Resources Old Hospital/ Care Center
Enterprise Jeffrey Weckes 541 426-8053 ext. 24
Yes Yes Yes Yes The facility would be well suited to classes if it becomes available for rent by the hour. Cooking classes do not require a license. Home canning would be possible, but it is likely that other kitchens could be used that would be less expensive, such as churches.
Cold Storage Frozen Storage
Dry Storage Cost Notes
Yes Yes Lots Not currently for rent
This kitchen is not currently available. It is expected to be vacated by the Care Center by January 2013. Wallowa Resources is currently planning to lease the facility to an herbal business when the Care Center moves. The herbal business may be interested in subletting to other commercial users if food safety regulations permit This kitchen is well suited to a number of food business uses as it is well equipped and has a large amount of dry storage space as well as cold and frozen storage. It has a separate dishwashing room with commercial dishwasher, newer walk in freezer (not operating), newer reach in freezer, newer reach in refrigerator, standard refrigerator, ice maker, 2 convection ovens, three electric ovens, electric grill with hood, 6 burner commercial electric stove, 2 microwaves, large toaster, 3 large rolling carts, 1 small rolling cart, 2 double sinks, 2 hand washing sinks. It does not have pans/bakeware or utensils. It will need more food prep space which could be added through steel covers for the double sinks. The freezer needs to be recharged and there a few other minor repairs. Wallowa Resources is willing to do some of the improvements depending on what kind of tenant moves in to the space. They will also work on getting all of the equipment working. The kitchen is adjacent to serving and dining areas and rooms suitable for additional storage and office functions. Freight receiving area is also

Appendix D
5
adjacent to the kitchen. Name Location Contact Food
Processing Baking Ready to Eat
Packaged Foods
Catering Classes or Home Canning
Community Connection Kitchens
Enterprise and Wallowa
Carolyn Pfeaster 541 426 3840
No No No Limited Yes
Cold Storage Frozen Storage
Dry Storage Cost Notes
Limited, during short-term events
No No $50 deposit $125 for kitchen only $250 for kitchen and dining room
These kitchens operate as part of a benevolent organization and as such are inspected, but they do not have adequate on site storage to accommodate most business uses. The kitchens can be rented by groups and private parties. Groups using the facility for public events such as fundraising would need to get their own temporary restaurant license and prepare all food on site. Private parties are not required to obtain a permit as food is only served to invited guests. Caterers can use the kitchen if they have a license to operate in another facility and prepare the food at that facility. Serving of alcohol requires an OLCC license, an additional deposit of $100 and a certification of insurance in the amount of $300,000. There is a rental agreement and orientation walk-through, as well as an extensive check list for clean-up after use. Borrowing of pans, etc. is strictly prohibited. The kitchen is well equipped and clean. Industrial mixer is no longer available to rental users. Available with rental are griddle, reach-in refrigerator, slicer, gas range, two ovens (convection in Enterprise, standard in Wallowa), double sink, hand sink, can opener, warming table, bakers station, pots, pans, serving ware, dishwasher, and mop sink/storage.


Acknowledgements

Table of Contents

Table of Contents

Addendum
Purpose
Introduction
Local Food Production and Processing

Local Food Production and Processing
Strengthen collaboration among producers

Local Food Production and Processing

Local Food Production and Processing


Producer engagement with food systems development organizations

Local Food Production and Processing
Development of commercial shared-use kitchen facilities
Meat Processing

Business planning and product market education
Local Food Production and Processing

Ralph Anderson


Food Access and Consumer Availability

Create opportunities for food literacy/education
Food Access and Consumer Availability

Food Access and Consumer Availability

Food Access and Consumer Availability

Food Access and Consumer Availability

Community and school gardens
Food Access and Consumer Availability

Food Access and Consumer Availability

Joseph Charter School


Food Access and Consumer Availability

Food Access and Consumer Availability


Decrease stigma of food assistance programs

Develop farmers markets and encourage their collaboration
Food Access and Consumer Availability
Food Access and Consumer Availability

Food Access and Consumer Availability

Food Access and Consumer Availability

Food Access and Consumer Availability

Community Food System Development
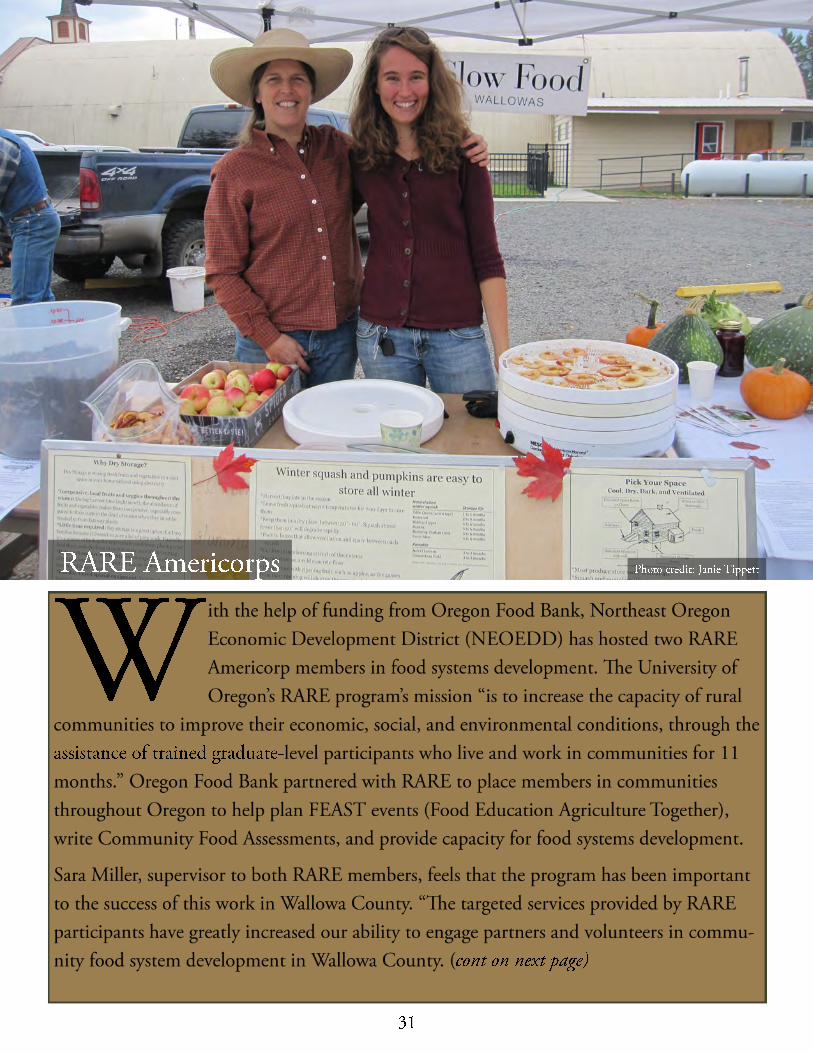

Strategic planning for community food system development
Inform the public on current and future food system development activity

Collaboration among local, regional, and state organizations working on food system development projects
Community Food System Development

Conclusion
Community Food System Development