community health assessment 2019-2024
TRANSCRIPT

1
Community Health Assessment
2019-2024
June 2019

2
Table of Contents
Letter to the Community………………………………………………………… 3 Acknowledgements……………………………………………………………… 4 Introduction & Methodology……………………………………………………. 7 Community Profile………………………………………………………………. 10 Built Environment………………………………………………………………. 14 Leading Causes of Death………………………………………………………. 16 Healthy Weight…………………………………………………………………… 17 Physical Activity…………………………………………………………………. 18 Nutrition…………………………………………………………………………… 19 Tobacco…………………………………………………………………………… 19 Social & Mental Health…………………………………………………………. 20 Injury & Violence…………………………………………………………………. 23 Infectious Diseases……………………………………………………………… 25 Sexual Health……………………………………………………………………. 27 Teen Pregnancy…………………………………………………………………. 30 References………………………………………………………………………. 31 Priority Areas……………………………………………………………………. 33 Appendix A: Focus Group Materials…………………………………………. 35
Focus Group Discussion Questions…………………………………… 35 Focus Group Summary…………………………………………………. 36
Appendix B: Community Survey Materials…………………………………… 41 Community Survey………………………………………………………. 41
Community Survey Summary…………………………………………………... 41 Appendix C: Local Public Health System Assessment Summary…………. 72 Appendix D: Forces of Change Materials……………………………………. 75 Forces of Change Survey………………………………………………………. 75 Forces of Change Summary…………………………………………………… 83
3

4
Acknowledgments
The Florida Department of Health in Washington County thanks the following individuals and organizations for their invaluable contributions to this report. CHA Planning Committee Donna Carnley, Early Learning Coalition of NW Florida Suzan Gage, Early Learning Coalition of NW Florida Traci Corbin, Florida Department of Health (FDOH) Susie Sewell, FDOH Karen Johnson, FDOH Community Survey Committee Susie Sewell, Chair, FDOH- Nursing Director Suzan Gage, Co-Chair, Early Learning Coalition of NW Florida Judy Corbus, UF/IFAS Extension Washington County Amy Riley, Chipola Healthy Start Amanda Brannon, Washington County Sheriff’s Office Cecilia Spears, Early Learning Coalition of NW Florida Lindsay Holmes, Early Learning Coalition of NW Florida Community Focus Group Committee Sharron Hobbs, Chair, FDOH- Tobacco Prevention Milton Brown, Co-Chair, FDOH- Green Dot Stephanie Green, FDOH- School Health Renae Rountree, Director Washington County Library Rachael Conrad, Chemical Addiction Recovery Effort (CARE) Allison Blevins, FDOH- Preparedness Susan Roberts, Washington County School Board Member Melissa Medley, FDOH- Heart Health Plus Arely Sapp, FDOH- Green Dot Forces of Change Committee Traci Corbin, Chair, FDOH- Accreditation/Quality Improvement Coordinator Cecilia Spears, Co-Chair, Early Learning Coalition of NW Florida Valery Lawton, FDOH- Healthy Start Coordinator Catherine Wynne, Big Bend Community Based Care Board Member Donna Carnley, Early Learning Coalition of NW Florida Rachael Conrad, CARE

5
Local Public Health System Committee Karen Johnson, Chair, FDOH- Health Officer Kristin Martin, Co-Chair, Washington County Sheriff’s Office Brenda Blitch, FDOH-Preparedness Russ Thomas, FDOH- Environmental Health Sean Golder, PanCare of Florida Cecilia Spears, Early Learning Coalition of NW Florida Other Key Partners Salem Avery, Northwest Florida Community Hospital (NFCH) Connie Swearingen, NFCH Eileen Swindle, NFCH Stephanie Gustuson, NFCH Janet Kinney, CFO, NFCH Michael Kozar, CEO, NFCH Melissa Collins, Gulf Coast Sexual Assault Kathy Green, FDOH Amanda Baker, FDOH Shelia Paul, FDOH Sunshine Speers, Emerald Coast Hospice Joe Taylor, Washington County Superintendent of Schools Anita Clarke, Washington County Council on Aging James Lewis, FDOH Martha Compton, Florida Panhandle Technical College Lynne Abel, Washington County Emergency Management Deborah Anderson, Community Home Health Lisa Autdencamp, Big Bend Community Based Care Nicole Barefield, Washington County News Missie Finch, NHC Homecare Kevin Crews, Washington County Sheriff Landrea Garrett, Kindred at Home Candice Hudson, FDOH Rick Kerr, Washington County Fire/Rescue Heather Lopez, Washington County Tourist Development Council George Parsons, PanCare Joel Paul, Tri County Community Council Troy Peoples, Washington County School District Stephanie Sweeting, Washington County Jail Natalie Parker, Rivertown Community Church Philip Horvath, Rivertown Community Church Hannah Gainey, Gulf Coast State College Student Jeanna Olson, Department of Children & Families Kayleigh Cosson, CARE Joshua Skipper, Washington County Sheriff’s Office Angela Klopf, United Way of NW Florida

6
WASHINGTON COMMUNITY HEALTH IMPROVEMENT PARTNERSHIP (WCHIP)
Introduction
7
The Florida Department of Health in Washington County (DOH-Washington) produces a Community Health assessment (CHA) every five years. The CHA tells the story of public health in Washington County. It shares the wonderful things about our community and the ways we can improve. We all have a role to play in making Washington County a healthier place to live, learn, work and play! As you read the CHA, think about how you can become involved.
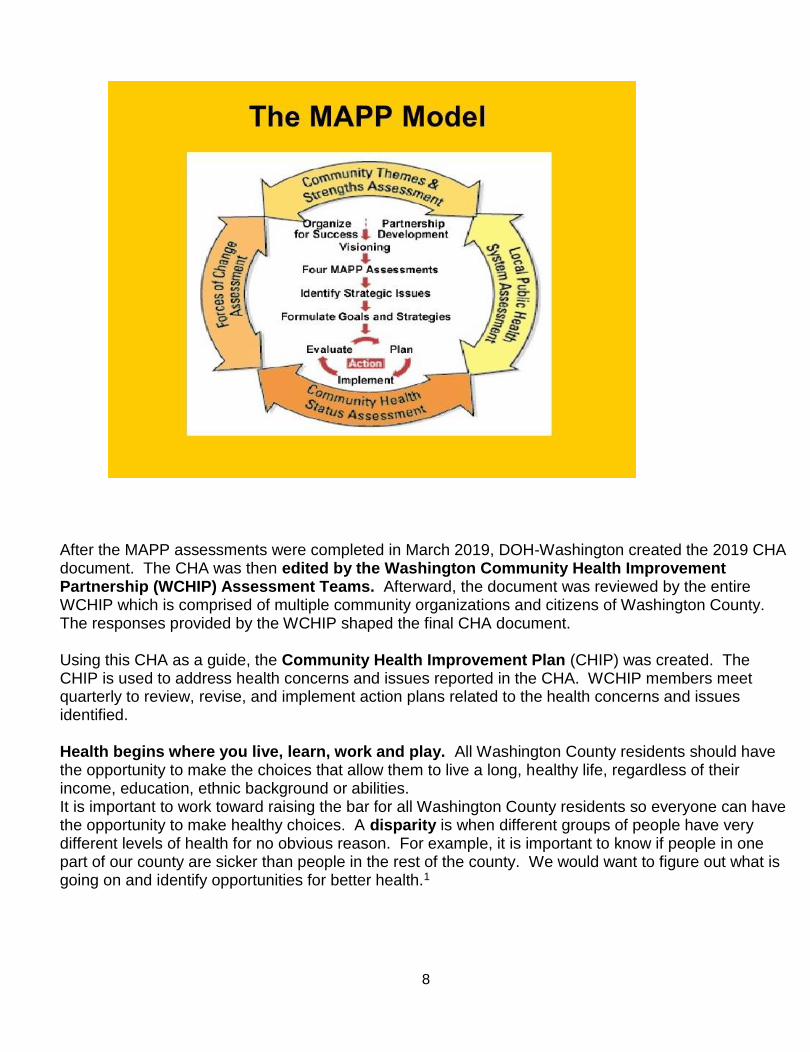
Methodology To develop the CHA, we used the Mobilizing for Action through Planning and Partnerships (MAPP) model. The MAPP model is made up of four assessments that help identify public health issues in our community:
Community Health Status Assessment: This explains the health standing of our
community. It helped us identify our key community health problems by reviewing data about health conditions, quality of life and risk factors in the community.
Community Themes and Strengths Assessment: Information was collected from
three face-to-face focus groups that included citizens from the Council on Aging in Caryville, students from the Florida Panhandle Technical College, and members of the Hispanic Community. A community survey was also distributed throughout Washington County from August 2018 – March 2019 with over 250 people responding. The data helped us learn: what issues are important to our community, how the quality of life is seen in our community and what resources our community has that can be used to improve health.
Local Public Health System Assessment: Washington County stakeholders met in a
face-to-face meeting on February 28, 2019 to review and score each of the ten essential public health services. Participants were asked questions about each essential service and scored each service using recommended scoring levels provided in the assessment instrument. The data helped us learn: how well public health services are being provided to our community and the performance and abilities of our public health system.
Forces of Change Assessment: Information was collected from community leaders,
which helped us learn: what is happening or could happen that affects the health of our community and what dangers or opportunities are exposed by these occurrences.
8
After the MAPP assessments were completed in March 2019, DOH-Washington created the 2019 CHA document. The CHA was then edited by the Washington Community Health Improvement Partnership (WCHIP) Assessment Teams. Afterward, the document was reviewed by the entire WCHIP which is comprised of multiple community organizations and citizens of Washington County. The responses provided by the WCHIP shaped the final CHA document. Using this CHA as a guide, the Community Health Improvement Plan (CHIP) was created. The CHIP is used to address health concerns and issues reported in the CHA. WCHIP members meet quarterly to review, revise, and implement action plans related to the health concerns and issues identified. Health begins where you live, learn, work and play. All Washington County residents should have the opportunity to make the choices that allow them to live a long, healthy life, regardless of their income, education, ethnic background or abilities. It is important to work toward raising the bar for all Washington County residents so everyone can have the opportunity to make healthy choices. A disparity is when different groups of people have very different levels of health for no obvious reason. For example, it is important to know if people in one part of our county are sicker than people in the rest of the county. We would want to figure out what is going on and identify opportunities for better health.1
9
What determines our health?2
Economic Stability: employment, income, housing, affordability of food and other necessities Education: high school graduation, language, literacy Social & Community Context: social support, discrimination, civic participation, policies, culture Health & Health Care: access to health care, access to interventions, health literacy (or ability to understand and interpret health information) Neighborhood & Built Environment: public safety, access to healthy foods, quality of housing, access to sidewalks, air quality, water quality, street lighting, parks
Why does the CHA include information on education and income?
Higher education and incomes impact health in many ways. People with higher incomes have the opportunity to make healthy choices because they are more likely to live in safe homes and neighborhoods, have access to healthy foods and safe places to exercise, have health insurance and resources to deal with stressful life events. Those who are working and still struggling to pay the rent can’t always make healthy choices because they don’t have as many resources. Families who are struggling to get by are also more likely to face more overall stress and have less resources to deal with stressful events. Chronic stress creates higher levels of harmful hormones which can increase the risk of many diseases such as cancer, diabetes, heart disease and stroke. 1,3 So, it makes sense that groups of people with more education and higher incomes generally have better health and live longer than those with lower incomes. Middle-income Americans are healthier than those who struggle financially, but they are less healthy than those with high incomes. Groups of people with the lowest incomes tend to have the worst health and die younger.1
Why are the statistics broken down by population groups?
By comparing, we can see where we are doing well and where we could improve. It is helpful to look at how healthy people in Washington County are, as a group, compared to people in the rest of Florida or in the whole United States. These comparisons cannot be applied to individual people, only to groups of people. For example, men might be twice as likely to die of accidental poisoning than women, but that does not mean a specific man is twice as likely to die from poisoning than his sister.
What are rates?
Rates are a way to compare between groups of different sizes. Let’s say 1,000 puppies were born and 100 of those puppies died. Fifty of the puppies who died had stripes, and 50 had spots. These numbers would make us think striped and spotted puppies die at the same rate. But, what if 80% of the puppies born had stripes and 20% had spots? Then we would expect that if 100 puppies had died, 80

10
would have stripes and 20 would have spots. Rates help us see the number of puppies who die in relation to the number of puppies born. Puppies Born Puppies Died Death Rate 800 Striped 50 Striped 50 of 800 = 6% (1 out of every 16)
200 Spotted > 50 Spotted = 50 of 200 = 25% (1 out of every 4)
1,000 Total 100 Total 100 of 1,000 = 10% (1 out of every 10)
This symbol is used throughout the CHA to highlight disparities, or areas that need improvement. We focus on the issues that need improvement so we can work together on solutions!
Community Profile Population The most recent population estimate for Washington County is 24,567. There were 8,558 households in the 2013-2017 American Community Survey (ACS).4
Sex & Age
Washington County’s population is 54.2% male and 45.8% female. The median age of 42 years, Washington County has a similar age composition to the state of Florida (median age: 42.1 years). Washington County also has a similar proportion of its population in the 45-64 age group and a smaller portion in the <5 age group in comparison to Florida.5,6
Age Breakdown: Washington County, Florida and the U.S.
Age Washington County
Florida United States
<5 5.1% 5.5% 6.2%
5-14 12.4% 11.2% 12.9%
15-24 12.1% 12% 13.6%
25-44 26.2% 25.0% 26.4%
45-64 27.6% 26.6% 26.1%
65-74 10.8% 11.0% 8.6%
>74 7.0% 8.8% 6.3%
Race & Ethnicity Roughly eighty-one percent (80.6%) of the population is White, fifteen percent (14.9%) are Black or African American, alone and four percent (3.8%) are Hispanic or Latino. The remaining less than one percent (.7%) are represented by individuals classified as “other races or ethnicities”. Washington County has a foreign-born population of approximately three percent (2.8%).5
Race and Ethnicity: Washington County, Florida and U.S.
11
Race and Hispanic Origin
Washington County Florida United States
White 80.6% 77.6% 76.6%
Black or African American
14.9% 16.9% 13.4%
Hispanic or Latino 3.8% 25.0% 18.1%
Other 2.2% 5.6% 7.3%
This symbol is used throughout the CHA to highlight positive aspects of Washington County.
Annual festivals and opportunities for families and visitors to enjoy local culture.7
Choctawhatchee River, Econfina Creek, several lakes, and ponds offer outdoor activities for all
ages.7
Nature trails, camping, and boating sites can be found throughout the county. 7
Washington County Public Schools participate in the Community Eligibility Provision that
provides all students with free lunch and breakfast.8
Northwest Florida Community Hospital recognized as one of Florida’s Top Hospitals and has
been selected for a Hospital of Choice Award.
Educational Attainment There are six public schools in the county (two elementary, two middle and two high schools). All are designated under the federal Title I program, meaning they have a large percentage of low-income students.
Washington County has a greater portion of people whose highest education level is high school or some college and a smaller portion with college degrees in comparison to the Florida average.4,6,9
2017 Washington County Florida United States
Less than 9th grade
6.0% 5.1% 5.4%
9th to 12th grade, no diploma
13.5% 12.4% 7.2%
High school graduate (includes equivalency)
41.1% 29.0% 27.3%
Bachelor’s Degree or higher
11.3% 28.5% 30.9%
12
Graduation Rate Using Federal Guidelines
2017-18
White 83.3%
Black or African American 67.4%
Hispanic 81.8%
“Better-educated individuals live longer, healthier lives than those with less education.” -Robert Wood Johnson Foundation1
Socioeconomic Characteristics Median Household Income5,6
Washington $36,989
Florida $50,883
United States $57,652
Families in Poverty5,6
Washington County has a larger portion of people and families living in poverty in comparison to the state of Florida. The percentage of elementary and middle school students eligible for free/reduced lunch is 66.8% compared to Florida’s rate of 59.8%. 21.1% of Washington County residents lived below poverty level. 5
Type of Family in Poverty Washington Percentage Florida Percentage
Families with Children Under 18
22.5% 18.2%
Families with Children Under 5
28.1% 17.0%
Families with Female Householder, no husband present with Children Under 18
51.4% 36.5%
Families with Female Householder, no husband present with Children Under 15
59.1% 39.1%
Individuals 18 years and over
16.5% 14.8%
Individuals 65 years and over
19.4% 10.3%

13
2019 Federal Poverty Guidelines10
2019 POVERTY GUIDELINES FOR THE 48 CONTIGUOUS STATES AND THE DISTRICT OF COLUMBIA
Persons in family/household Poverty guideline
For families/households with more than 8 persons, add $4,420 for each additional person.
1 $12,490
2 $16,910
3 $21,330
4 $25,750
5 $30,170
6 $34,590
7 $39,010
8 $43,430
Medical & Dental Resources
Washington County has 1 primary care doctor/provider for every 4,910 residents. This is less than the goal of having 1 for every 1,040 residents.1
Washington County has 1 dentist for every 3,070 residents. This is less than the goal of having 1 for every 1,340 residents1
There are no pediatricians, obstetricians, or birthing facilities in Washington County.6
Disability 30% of adults report having limited activities because of physical, mental, or emotional problems. The State rate is 21.2%.11
Physical & Mental Health 18.4% of adults report having poor physical health and 14.6% report having poor mental health on 14 or more of the past 30 days compared to the State rate of 12.9% & 11.4% respectively.12

14
Health Insurance Coverage
Florida Department of Health (DOH)-Washington and the Federally Qualified Health Center, PanCare, each offer medical and dental care to the uninsured.
Adults with any type of health care insurance coverage BRFSS Data 2016
Washington 81.6%
Florida 83.7%
Adults who have Medicare
Washington 44.2%
Florida 37.9%
Number of people enrolled in Medicaid for Washington County as of February 2019: 4,28413
Hospital Northwest Florida Community Hospital is a 59-bed healthcare facility that includes a 25-bed Critical Access hospital, a 34-bed Long Term Care Facility, Health Clinics, and a Home Health Agency. A clinic is available in Vernon.
Built Environment in Washington County
Indicator Washington Florida Population that live within a 1/2 mile of healthy food source
3.9% 30.9%
Population that live within a ten-minute walk (1/2 mile) of an off-street trail system7
2.3% 18.2%
Workers who used car, truck, or van - drove alone2
88.6% 79.5%
14

15
Positive Factors
There are 49 boat/canoe/kayak ramps & launches in Washington County. 15
There are 18 miles of Florida National Scenic Trail that pass-through Washington County in the
Econfina Section. The Econfina Trail passes through public property managed by the Northwest
Florida Water Management District.
Pine Log Trail is an 8-mile length of Florida National Scenic Trail passing through Pine Log State
Forest. This State Forest is located in the Southern section of Washington County. 16
Washington County Sidewalk construction since 2015:
o CR 273 South Blvd from West of 7th St. to East of Peach St.
o CR 273 South Blvd 5th St. to Hoyt Street and Hoyt St. from S Blvd. to US 90.
o Usery Road from CR 280 Brickyard Road to 1st St./Pine Ave. Currently under
construction; final completion anticipated date September 30, 2019
o CR 273 South Blvd from Hoyt Street to Kirkland Road and along Kirkland Rd to CR 280
Brickyard Rd. Currently in Design; Construction slated for FY 2021
o Once the Brickyard/Kirkland sidewalks are completed, all schools in Chipley will be
connected with sidewalks.
New Kate Smith Elementary School constructed in 2016 with 1,000 student stations available.
Negative Factors
Fluoridated Water 2015 Data Washington County
Percent of population on public water with optimally fluoridated water supplies 0.077
Housing Data Year 2014 Washington County Florida Number of housing
units
10,676 9,152,815
Percent of pre-
1950 housing units
7.62 4.38
Percent of housing
units built between
1950 and 1979
30.51 34.88

16
Percent of housing
units that are
vacant
21.60 19.22
Percent of
occupied housing
units that use
wood, fuel oil,
kerosene, coal, or
coke as heating
fuel
1.04 0.36
Percent of housing
units that lack
complete plumbing
facilities
4.32 1.04
17
Leading Causes of Death in Washington County 2015-17 Cause of Death Percentage
Heart Disease 25%
Cancer 17%
Chronic Lower Respiratory Disease 6%
Stroke 5%
Diabetes 4%
All Other Causes 6%
Total Deaths 1,032.5
Number of Cancer Deaths in Washington County 2017
The rate of heart disease and cancer deaths is higher than the State average for Florida.
Type of Cancer Percentage
Lung 23
Colorectal 5
Breast 1
Prostate 2
Melanoma 0
Total Cancer Deaths 41 23,24

17
Diabetes/Prediabetes
An estimated 84.1 million adults ages 18 years or older (33.9 percent of U.S. adults) have prediabetes and an estimated 30.3 million people have diabetes (9.4 percent of the U.S. Population). 25
15.3% of adults in Washington County have been told they have diabetes and 8.7% have been told they are prediabetic according to 2016 Behavioral Risk Survey. 11
Black residents are almost TWICE as likely to die from diabetes compared to White residents.6
Heart Disease
Smoking is a major cause of cardiovascular disease (CVD) and causes approximately one of every four deaths from CVD. CVD is the single largest cause of death in the United States, killing more than 800,000 people a year. More than 16 million Americans have heart disease. Almost 8 million have had a heart attack and 7 million have had a stroke.18
Smoking causes one in three deaths from cardiovascular disease, including heart disease, and Chronic Lower Respiratory Disease. 19
14.9% of adults in Washington County compared to 9.8% of Floridians have reported ever having a heart attack, angina, coronary heart disease, or stroke. From 2015-2017 there were 40 deaths related to a heart attack. 20
Cardiovascular disease is the No. 1 killer of women, causing 1 in 3 deaths each year. 21
Stroke Strokes in Washington County lead to 211 hospitalizations from 2015-2017.20
Healthy Weight in Washington County

18
Obesity/Overweight “We do not have many options locally for healthier lifestyles, such as access to fresh fruits and vegetables or recreation.”- Resident comment from survey, 2019 Residents who are Overweight or Obese by Race/Ethnicity 14
White 72.3%
Black 83.2%
Hispanic No data
73% of adults are not at a healthy weight 14
76% of males and 70% of females are overweight or obese.14
Fact: Contributing factors in our society to obesity include the food we eat, physical activity
environment, education, food marketing and promotion. 29
Percent of Students Who Are Overweight or Obese23
High School 36.7%
Middle School 33.9%
Fact: Children with obesity are at increased risk for type 2 diabetes, cardiovascular disease, sleep
apnea, orthopedic problems, and psychosocial distress. 24
Physical Activity in Washington County
“Need a safe place to exercise. A local gym would be good.” Resident comments from survey, 2019 59% of adults in Washington County reported that they are inactive and 39% are completely sedentary.14
49% of residents have at least a 30-minute commute and drive alone to work.30
A 2012 study in the American Journal of Preventive Medicine found that the farther people commute by vehicle, the higher their blood pressure and body mass index. Also, the farther they commute, the less physical activity the individual tends to participate in. Each additional hour spent in a car per day is associated with a 6 percent increase in the likelihood of obesity. 30

19
Middle & High School Students Without Sufficient Vigorous Physical Activity 31
High School 77.3%
Middle School 72%
Nutrition in Washington County In 2018, a total of 238 persons attended the following classes presented by University of Florida, Extension: Rock the Crock Slow Cooker; 5~30 Meals; Grill Smart, Eat Smart; Meals Under Pressure Pressure Cooking; Beginners Pressure Canning; Water Bath Canning; Introduction to Fermentation; Fresh Sausage Making; and Meat Smoking and Curing.
Fact: Breastfeeding provides optimal nutrition for infants. Studies show that breastfeeding reduces
the risk of childhood obesity. Breastfeeding is especially important for underweight babies, who need optimum nutrition and their mother’s immunity to get through the first few months of life. 32
Women, Infant’s & Children (WIC) Program Infants and Children < 24 mos. Old Of WIC Moms Ever Breastfed
Washington 78.9%
State 83.4 %
Percent of Breastfed Infants Enrolled in WIC
27.5% 37.1%
Infants at least 26 Weeks Old that are Breastfeeding
45.7% 35.8%
Only 19.4% of adults eat the recommended five servings of fruits and vegetables per day.11
Tobacco in Washington County
Current Adult Smokers34
Washington 20.5%
Florida 15.5%
Goal 12%
Since 2002, smoking rates have declined in Washington County, but remain higher than the state. Current Middle and High School Student Smokers33
High School 14.5%
Middle School 4.1%

20
Percent of students who have ever used smokeless tobacco (chewing tobacco, snuff, or dip).
High School 21.7%
Middle School 10.2%
Washington Youth (Ages 11-17) who have ever tried electronic vaping has risen from 10.5% in 2012 to 31.9% in 2018.33
Spotlight on E-Cigarettes Electronic cigarettes are devices that deliver vapor to the user by heating “e-liquids”. Many e-liquids contain nicotine, a highly addictive chemical. Nicotine is the main reason people continue to use tobacco. The most popular brand is JUUL, a device shaped like a USB flash drive. 35
Youth vaping, or e-cigarette use, has increased dramatically across the country and in Florida. In September, the FDA officially declared youth vaping an epidemic and stated that flavors play an important role in driving the youth appeal.35
74.5% of youth in Washington County are committed to never using cigarettes33
Smoking During Pregnancy 36
15.5% of mother’s report smoking during pregnancy between 2015-17.36
Percentage of Pregnant Smokers36
Washington White 17.4%
Florida White 5.6%
Washington Black 7.5%
Florida Black 2.9%
FACT: Moms who smoke during pregnancy are at a greater risk for having a low birth weight and/or
preterm delivery compared to moms who do not smoke during pregnancy. 37
Social & Mental Health in Washington County
148 people were hospitalized for mental disorders in 2017. 38
Percentage of Adults Who Have Ever Been Told They Have a Depressive Disorder11
Washington 18.8%
Florida 14.2%
“We have no inpatient mental health services available in this county. People end up in facilities that are at least 60 miles away.” -Key Informant, 2019

21
Percentage of Adults Who Had Poor Mental Health on 14 or More of the Past 30 days, Overall11
Washington 14.6%
Florida 11.4%
25% of adults reported having poor physical or mental health that kept them from doing usual activities on 14 or more of the past 30 days.26
As of March 31,2019, 39 Washington County children have been removed from their parental homes and are in the care of someone else. The greatest percent of children in Circuit 14 (Bay, Calhoun, Gulf, Holmes, Jackson and Washington) that have been removed are between the ages of 0-4 years old41
Adults with serious psychological distress are more likely to have family income below $20,000 than those without. 39 21% of Washington County individuals live below poverty. Educational achievement is recognized as a factor that impacts a person’s health. 40
Adults 25 years and over with no High School diploma
Washington 19.5%
Florida 12.4%
How many households are struggling in Florida? ALICE, an acronym for Asset Limited, Income Constrained, Employed, comprises households that earn more than the Federal Poverty Level but less than the basic cost of living for the state (the ALICE Threshold). Of Florida’s 7,574,766 households, 1,056,316 earn below the Federal Poverty Level (14 percent) and another 2,424,570 (32 percent) are ALICE. Combined, 3,480,886 (46 percent) live below the ALICE threshold. Census County Divisions (CCD)43
COUNTY 2016
TOTAL HOUSEHOLDS
% ALICE & POVERTY
Washington 8,370 54%
Town Total HH % ALICE & Poverty
Caryville CCD 1,339 49%
Chipley 1,258 61%
Chipley CCD 2,852 52%
Ebro 102 56%
Vernon 303 63%
Vernon CCD 4,179 57%
Wausau 163 62%
Tri County Community Council served 5,420 residents in Washington County: Head Start
/Early Head Start, HUD housing, Community Services Block Grant (self-sufficiency, attaining an adequate education, job development, supportive services, food pantry & transportation), Low Income Home Energy Assistance Program (provides assistance to meet the cost of home heating and cooling

22
needs), Transportation, EFS (emergency food & shelter), and services through their Senior Center.
Adults Who Engage in Heavy or Binge Drinking by Race/Ethnicity White Non-Hispanic 10.3%
Black Non-Hispanic 2.1%
Women 7.7%
Men 11.3%
Binge drinking is having 5 or more drinks for males or 4 or more drinks for females during a single occasion in the past 30 days.44
Heavy drinking is having more than 2 drinks per day for males and more than 1 drink per day for females. 44
Middle School Students Who Have Used Alcohol in Past 30 days45
Middle school students who have used alcohol in past 30 days, Percent of Middle School Students, Single Year
Washington Florida
Year Percent Percent
2016 10.0 8.3
2015
9.4
2014 15.1 10.1
Middle school students reporting binge drinking, Percent of Middle School Students, Single Year
Washington Florida
Year Percent Percent
2016 3.6 3.2
2015
3.4
2014 5.1 3.9
Middle school students using marijuana/hashish in past 30 days, Percent of Middle School Students, Single Year
Washington Florida
Year Percent Percent
2016 4.1 3.2
2015
3.7
2014 4.3 4.2

23
Injury & Violence in Washington County
Total Count of Non-Fatal Injury ED Visits by Mechanism- Washington County, 2017
Falls 835
Struck by Against 335
Motor Vehicle Traffic (motorcyclist, occupant, other, pedal cyclist, pedestrian)
248
Cut/Pierce 232
Overexertion 217 46
Age Group Percent of Deaths Highest Incidence of Injury Death 2017
Less than 1 0
1-14 0
15-64 13% Motor Vehicle Accident
15-64 13% Firearm
65+ 10% Falls 46
FACT: Fall death rates in the U.S. increased 30% from 2007 to 2016 for older adults.48
In 2017 there were 4 homicides committed by suffocation, firearms and cutting/piercing in Washington County.47
58 Washington County children had alleged maltreatments related to household violence and intimate partner violence.42
Suicide
1. According to the Centers for Disease Control and Prevention (CDC) WISQARS Leading Causes
of Death Reports, in 2017: 49
o Suicide was the tenth leading cause of death overall in the United States, claiming the
lives of over 47,000 people.
o Suicide was the second leading cause of death among individuals between the ages of 10
and 34, and the fourth leading cause of death among individuals between the ages of 35
and 54.
o There were more than twice as many suicides (47,173) in the United States as there were
homicides (19,510).
In 2017 there were 5 suicides reported in Washington County between the ages of 25-84.50

24
Drugs In May of 2017, Florida’s Governor declared the opioid epidemic in Florida a public health emergency. This allowed the state to obtain grant money to pay for prevention, treatment and recovery services.
Information from Florida Emergency Medical Services Tracking and Reporting System (EMSTARS) for 2018 fourth quarter:51
Drug Overdose
Geographic Area Non-Fatal Fatal
Washington 4 0
Bay 38 0
Holmes 4 0
Opioid Overdose
Geographic Area Non-Fatal Fatal
Washington 2 0
Bay 20 0
Holmes 0 0
Opioid-antagonist36
Geographic Area Non-Fatal Fatal
Washington 2 0
Bay 61 0
Holmes 0 0
Opioid Use, Washington County51
2017 2016
Opioid Overdose Death 1 1
Drug Overdose Death 1 1
Suspected Non-Fatal Opioid-involved Overdose
3 10
Suspected Non-Fatal All Drug Overdose
27 35
Drug Arrests Adult Juvenile
380 368 12
107 105 2

25
The drugs/substances that caused the most deaths in Florida (2016)51
Cocaine
Benzodiazepines (tranquilizers such as Valium and Xanax)
Fentanyl
Morphine
Heroin
Alcohol
Oxycodone
Methadone
Methamphetamine
Infectious Diseases in Washington County Enteric Diseases: Intestinal infections that can cause fever, stomach ache, nausea, vomiting, diarrhea and headache. These infections are usually caused by certain bacteria and virus.2
Bacteria2 How do you get it? Who has the highest risk?
Campylobacter Undercooked poultry, unpasteurized milk and animal feces
Adults >60
Salmonella Undercooked eggs, poultry or meet; also present in animal feces, such as birds and reptiles
Children <5
Shigella Contact with fecal matter from an infected person
Children 1-10
Salmonella was the most commonly reported bacterial disease from 2016-2019 in Washington County at 16 cases.54
Rabies is a preventable viral disease of mammals most often transmitted through the bite of a rabid animal. The vast majority of rabies cases reported to the CDC each year occur in wild animals like raccoons, skunks, bats, and foxes.56
FACT: In Florida, it is required by law to report any animal bite to the Health Department to determine the victim’s risk of rabies and need for rabies post-exposure prophylaxis (PEP). Rabies PEP is a series of injections which can prevent the nearly 100% fatal disease.57
Washington FL
Dog Bite Emergency Department Visits
Crude Rate of Dog Bite emergency department visits per 100,000 2017 128.33 113.59

26
From 1/1/18 to 1/1/19 there were 65 animal bite reports sent to the Health Department. Majority involved dogs.
Vaccine-Preventable Diseases
Certain dangerous diseases, like polio, measles, and smallpox can be prevented with vaccinations.2
96.4% of kindergarten students in Washington County have been fully vaccinated as of December 2018. The Florida goal is 95%.58
2.6% of the 271 kindergarten students have a religious exemption to receiving vaccinations.59
Herd Immunity When a contagious disease enters an unvaccinated group, many members are infected because they lack immunity against the disease. When a large percentage of the population is vaccinated, the spread of disease is limited. This indirectly protects unimmunized individuals, including those who can’t be vaccinated and those for whom vaccination was not successful. This is the principle of herd immunity.60
Viral Hepatitis Hepatitis means inflammation of the liver. Hepatitis is often caused by a virus. The most common type of viral hepatitis are hepatitis A, hepatitis B, and hepatitis C.55
Hepatitis B and C are transmitted through blood and body fluids.55
There are vaccines against Hepatitis A and B available.
2016-2019 Hepatitis Cases in Washington County61
A B Chronic C Chronic
1 14 463

27
Sexual Health in Washington County
Chlamydia Counts 201761
Females 90 Males 34
Non-Hispanic White 20 Non-Hispanic Black 23

28
Gonorrhea Counts 201761 Females 15 Males 15
Non-Hispanic White 5 Non-Hispanic Black 7

29
Syphilis Counts 201761 Females 0 Males 12
Non-Hispanic White 1 Non-Hispanic Black 3
Reported cases of chlamydia increased by 46% from 2013 to 2017. Washington County ranks 19th out of 67 counties in Florida for the highest rates of chlamydia infections. Reported cases of gonorrhea increased by 30% from 2013 to 2017.

30
Teen Pregnancy in Washington County62
Births to Mothers’ Ages 15-19
Year Count Rate State Rate
2017 18 27.5 18.5
2016 30 46.5 19.5
2015 19 29.7 21.0
From 2015-2017, there were 10 repeat births among women ages 15-19 in Washington County. All of these occurred among White mothers. Young age is a factor that makes a pregnancy high risk. Pregnant teens are more likely to develop pregnancy-related high blood pressure and anemia. 63

31
References
1. Robert Wood Johnson Foundation. (2016-17). Retrieved from http://www.countyhealthrankings.org 2. Centers for Disease Control and Prevention. (2014-2017). Retrieved from
https://www.cdc.gov/nchhstp/socialdeterminants/faq.html#what-are-social-determinants 3. American Psychological Association. (2017). Retrieved from http://www.apa.org/helpcenter/understanding-chronic-stress.aspx 4. American Community Survey. (2013-2017). Retrieved from https://factfinder.census.gov/faces/nav/jsf/pages/index.xhtml 5. United States Census Bureau. (2013-2017). Retrieved from https://factfinder.census.gov/faces/nav/jsf/pages/community_facts.xhtml 6. Florida Health CHARTS. (2017). Retrieved from
http://www.flhealthcharts.com/ChartsReports/rdPage.aspx?rdReport=ChartsProfiles.CountyHealthProfile 7. Chamber of Commerce Washington County. Retrieved from https://www.washcomall.com/ 8. Washington County School District. Retrieved from https://www.wcsdschools.com/news?ID=34334102-AF8D-47B5-A1E2-61F168DFF8A9 9. Florida Department of Education. Retrieved from http://www.fldoe.org/accountability/data-sys/edu-info-accountability-services/pk-12-
public-school-data-pubs-reports/students.stml 10. United States Department of Health & Human Services, Office of the Assistant Secretary for Planning and Evaluation. (2017). Retrieved from
https://aspe.hhs.gov/poverty-guidelines 11. Florida Health Charts. (2017). Retrieved from http://www.flhealthcharts.com/charts/Brfss.aspx 12. Florida Health Charts. (2017). Retrieved from http://www.flhealthcharts.com/charts/SocialAndMentalHealth/default.aspx 13. Agency for Health Care Administration. (2018). Retrieved from
http://ahca.myflorida.com/medicaid/Finance/data_analytics/enrollment_report/index.shtml 14. Florida Health Charts. (2017). Retrieved from
http://www.flhealthcharts.com/ChartsReports/rdPage.aspx?rdReport=ChartsProfiles.HealthiestWeightCountyProfile 15. Florida Fish and Wildlife Conservation Commission. Retrieved from https://publictemp.myfwc.com/le/boatramp/public/CountySearch.aspx 16. Florida Trail Association. Retrieved from http://www.floridatrail.org/pine-log/ 17. Florida Environmental Public Health Tracking. Retrieved from
https://www.floridatracking.com/healthtracking/report.htm?i=1010&s=1#reportProfileTab 18. Centers for Disease Control and Prevention. Retrieved from https://www.cdc.gov/tobacco/data_statistics/sgr/50th-
anniversary/pdfs/fs_smoking_CVD_508.pdf 19. Centers for Disease Control and Prevention. Retrieved from
https://www.cdc.gov/mmwr/volumes/65/wr/mm6544a2.htm?s_cid=mm6544a2_w 20. Florida Health Charts. (2017). Retrieved from
http://www.flhealthcharts.com/ChartsReports/rdPage.aspx?rdReport=ChartsProfiles.CountyChronicDiseaseProfile 21. American Heart Association, Go Red for Women. Retrieved from https://www.goredforwomen.org/en/about-heart-disease-in-women/facts 22. Florida Behavioral Risk Factor Surveillance System (BRFSS). 2016. Retrieved from
http://www.flhealthcharts.com/Charts/Brfss/DataViewer.aspx?bid=77 23. Florida Youth Behavioral Risk Factor Surveillance System. 2016. Retrieved from
http://www.flhealthcharts.com/Charts/YouthTobacco/YTDataViewer.aspx?bid=8 24. Centers for Disease Control and Prevention. Preventing Chronic Disease. Retrieved from
https://www.cdc.gov/pcd/issues/2015/15_0185.htm 25. Florida Cancer Data System. Retrieved from
https://fcds.med.miami.edu/downloads/FloridaAnnualCancerReport/2015/Table_No_T16_(2015).pdf 26. Florida Health Charts. (2017). Retrieved from
http://www.flhealthcharts.com/ChartsReports/rdPage.aspx?rdReport=ChartsProfiles.CountyHealthSummary 27. U.S. Department of Health and Human Services National Institute of Diabetes and digestive and Kidney Diseases. Retrieved from
https://www.niddk.nih.gov/health-information/health-statistics/diabetes-statistics 28. Smoking and cardiovascular disease. Surgeon general report on smoking & health. Retrieved from
https://www.cdc.gov/tobacco/data_statistics/sgr/50th-anniversary/pdfs/fs_smoking_CVD_508.pdf 29. Adult obesity causes & consequences. CDC. Retrieved from https://www.cdc.gov/obesity/adult/causes.html 30. Robert Wood Johnson Foundation County Health Rankings. Retrieved from
http://www.countyhealthrankings.org/app/florida/2019/measure/factors/137/description 31. Florida Health Charts. (2017). Retrieved from
http://www.flhealthcharts.com/ChartsReports/rdPage.aspx?rdReport=ChartsProfiles.ChildHealthStatusProfile 32. Centers for Disease Control and Prevention. Breastfeeding. Retrieved from https://www.cdc.gov/breastfeeding/index.htm 33. 2018 Florida Youth Tobacco Survey County Reports. Retrieved from http://www.floridahealth.gov/statistics-and-data/survey-data/florida-
youth-survey/2018FYTSCountyPDF/Washington.pdf 34. Healthy People 2020. Retrieved from https://www.healthypeople.gov/2020/topics-objectives/topic/tobacco-use/objectives 35. Tobacco Free Florida. E-Epidemic: Vaping and Youth. Retrieved from http://tobaccofreeflorida.com/eepidemic/ 36. Florida Health Charts. (2017). Retrieved from
http://www.flhealthcharts.com/ChartsReports/rdPage.aspx?rdReport=ChartsProfiles.PregnancyandYoungChild
32
37. Centers for Disease Control and Prevention. Smoking & Tobacco Use. Smoking During Pregnancy. Retrieved from https://www.cdc.gov/tobacco/basic_information/health_effects/pregnancy/index.htm
38. Florida Health Charts. (2017). Retrieved from http://www.flhealthcharts.com/charts/OtherIndicators/NonVitalIndDataViewer.aspx?cid=9877
39. Pratt LA, Dey AN, Cohen AJ. Characteristics of adults with serious psychological distress as measured by the K6 scale: United States, 2001–2004. Retrieved from https://www.ncbi.nlm.nih.gov/pubmed/17432488
40. Agency for Healthcare Research and Quality. Population Health: Behavioral and Social Science Insights. Retrieved from https://www.ahrq.gov/professionals/education/curriculum-tools/population-health/zimmerman.html
41. Florida Department of Children and Families. Retrieved from https://www.myflfamilies.com/programs/childwelfare/dashboard/c-in-ooh.shtml
42. Florida Department of Children and Families. Retrieved from https://www.myflfamilies.com/programs/childwelfare/dashboard/alleged-maltreatments.shtml
43. ALICE: A Study of Financial Hardship in Florida. 2018 Report. United Way. 44. Florida Health CHARTS. (2017). Retrieved from http://www.flhealthcharts.com/Charts/Brfss/DataViewer.aspx?bid=10 45. Florida Health CHARTS. (2017). Retrieved from
http://www.flhealthcharts.com/Charts/OtherIndicators/NonVitalIndRateOnlyDataViewer.aspx?cid=509 46. Florida Health CHARTS. (2017). Retrieved from
http://www.flhealthcharts.com/ChartsReports/rdPage.aspx?rdReport=ChartsProfiles.InjuryProfileDASHBOARD 47. Florida Health CHARTS. (2017). Retrieved from
http://www.flhealthcharts.com/ChartsReports/rdPage.aspx?rdReport=ChartsProfiles.InjuryProfileDASHBOARD 48. Centers for Disease Control and Prevention. Falls are serious and costly. Retrieved from
https://www.cdc.gov/homeandrecreationalsafety/falls/adultfalls.html 49. National Institute of Mental Health. Suicide. Retrieved from https://www.nimh.nih.gov/health/statistics/suicide.shtml 50. Florida Health Charts. (2017). Retrieved from
http://www.flhealthcharts.com/charts/DataViewer/DeathViewer/DeathViewer.aspx?indNumber=0116 51. Florida Department of Health. Emergency Medical Services Controlled Substance Overdose Report. Fourth Quarter 2018 October-
December. 52. Florida Health CHARTS. (2017). Retrieved from
http://www.flhealthcharts.com/ChartsReports/rdPage.aspx?rdReport=ChartsProfiles.OpioidUseDashboard 53. Drugs Identified in Deceased Persons by Florida medical Examiners, Annual Report. (2016). Retrieved from
https://www.fdle.state.fl.us/MEC/Publications-and-Forms/Documents/Drugs-in-Deceased-Persons/2016-Annual-Drug-Report.aspx 54. Florida Health CHARTS. (2017). Retrieved from
http://www.flhealthcharts.com/ChartsReports/rdPage.aspx?rdReport=FrequencyMerlin.Frequency&FirstTime=True 55. Center for Disease Control and Prevention. What is Viral Hepatitis?. Retrieved from https://www.cdc.gov/hepatitis/ 56. Center for Disease Control and Prevention. Rabies. Retrieved from https://www.cdc.gov/rabies/ 57. Rabies Prevention and Control in Florida, 2014. Retrieved from
https://floridahealth.sharepoint.com/sites/EMERGENCYPREPAREDNESS/EPP/Statewide_SOP_14_RabiesGuide.pdf 58. Florida Health CHARTS. (2018). Retrieved from
http://www.flhealthcharts.com/charts/OtherIndicators/NonVitalIndNoGrpDataViewer.aspx?cid=0075 59. Florida Department of Health Annual Immunization Assessment of Kindergarten Students 2018-19 By County, Public and Private Schools,
December 2018. 60. The History of Vaccines. Retrieved from https://www.historyofvaccines.org/content/herd-immunity-0 61. Florida Health CHARTS. (2017). Retrieved from http://www.flhealthcharts.com/charts/CommunicableDiseases/default.aspx 62. Florida Health CHARTS. (2017). Retrieved from
http://www.flhealthcharts.com/Charts/DataViewer/BirthViewer/BirthViewer.aspx?cid=0001&agefrom=15&ageto=19 63. US Department of Health and Human Services National Institutes of Health. What are some factors that make a pregnancy high risk?
Retrieved from https://www.nichd.nih.gov/health/topics/high-risk/conditioninfo/factors 64. Centers for Disease Control and Prevention. Retrieved from
https://www.cdc.gov/publichealthgateway/publichealthservices/essentialhealthservices.html

33
Priority Areas
Based on data collected from the Forces of Change Survey, Community Survey, Local Public Health System meeting, and the three Focus Groups the following issues were identified and brought to members of the Washington County Health Improvement Partnership (WCHIP): • Economics (jobs, technology, housing, funding)
Natural disasters Lack of affordable housing opportunities Lack of jobs and increasing unemployment Decreased funding for public programs Increasing technology requirements Assuring a competent workforce Lack of economic opportunities
• Substance Abuse (alcohol & drugs) Increase in drug abuse Top 3 behaviors of concern: #1 Drug abuse; #2 Being overweight/obese; #3 Alcohol abuse
• Mental Health Increase in mental health issues Top 3 areas that have access & availability problems: #1 Mental health services for adults; #2 Mental health services for young children & teens #3 Substance Abuse Services
• Violence/Crime Increase in violence/crime Top 3 other issues that are important to address: #1 Addiction- alcohol or drug; #2 Child abuse/neglect; #3 Domestic violence
• Communication Increasing reliance on social media Need for improved communication in the county
• Healthcare Change in prescribing of controlled substances Lack of awareness of health services Lack of specialists Lack of access to services Lack of long-term care options Need affordable health insurance options Improving research/innovations Linkage to health services Top 3 Health problems most important to address: #1High blood pressure; #2 Obesity #3 Diabetes & Cancer (Tied on rankings) Barrier to getting health care- Lack of evening and weekend services

34
• Other Need for faith-based intervention Need for transportation Improving research/innovations
Members from the Washington County Health Improvement Partnership (WCHIP) met on April 23, 2019 to review the summary of the four MAPP assessments and other community data. Four priority areas were selected based on members voting and discussion. The following issues were chosen as the most important public health concerns or priorities in Washington County: Communication
Resources
Dissemination
Keeping public informed
Mental Health
Availability
Resources
Substance Abuse
Drug use
Health
Obesity
Chronic Diseases
35
Appendix A: Focus Group Materials
Qualitative Data Collection: Focus Group Washington County Community Health Assessment
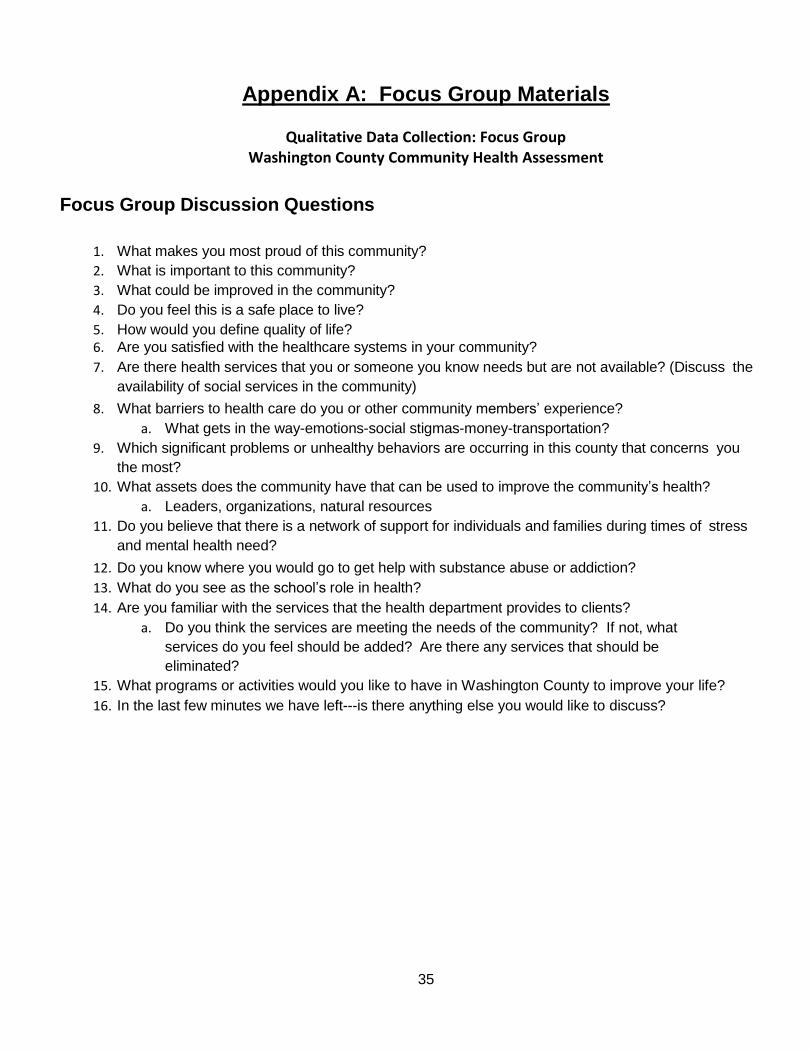
Focus Group Discussion Questions
1. What makes you most proud of this community?
2. What is important to this community?
3. What could be improved in the community?
4. Do you feel this is a safe place to live?
5. How would you define quality of life?
6. Are you satisfied with the healthcare systems in your community?
7. Are there health services that you or someone you know needs but are not available? (Discuss the
availability of social services in the community)
8. What barriers to health care do you or other community members’ experience?
a. What gets in the way-emotions-social stigmas-money-transportation?
9. Which significant problems or unhealthy behaviors are occurring in this county that concerns you
the most?
10. What assets does the community have that can be used to improve the community’s health?
a. Leaders, organizations, natural resources
11. Do you believe that there is a network of support for individuals and families during times of stress
and mental health need?
12. Do you know where you would go to get help with substance abuse or addiction?
13. What do you see as the school’s role in health?
14. Are you familiar with the services that the health department provides to clients?
a. Do you think the services are meeting the needs of the community? If not, what
services do you feel should be added? Are there any services that should be
eliminated?
15. What programs or activities would you like to have in Washington County to improve your life?
16. In the last few minutes we have left---is there anything else you would like to discuss?

36
Community Focus Group Summary
A core element of the MAPP model is the Community Strengths and Themes Assessment. As noted in the Florida MAPP Field Guide, this portion of the planning process is intended to generate direct feedback from community residents regarding perceptions of their own health, community health, and access to healthcare services. This assessment attempts to generate a better understanding of community health issues and concerns as well as residents’ quality of life. The themes and issues identified during this phase often offer insight into the information discovered through the other assessments. Staff of the Florida Department of Health in Washington County conducted three focus groups in November 2018. The purpose of conducting the focus groups was to better understand the perspectives of community stakeholders on the health and healthcare needs of Washington County residents. These focus groups were intended to ascertain opinions of stakeholders with knowledge of the community. The findings provide qualitative information, revealing community sentiments regarding healthcare services in Washington County. A summary of community opinions is reported without assessing the veracity of participant comments.
Community Focus Groups Community input was solicited via three focus groups held in Washington County during November 2018. Focus group participants were given a survey with questions about their demographics, insurance status, quality of life, health status, and more. Additionally, discussion questions were presented at the meeting for participants to answer aloud. Appendix A includes the full survey and discussion questions. The focus groups were advertised via local newspapers, websites, flyers at strategic locations throughout the county (e.g., banks, public offices, doctors’ offices, and community centers), and word of mouth. Meetings were held at three locations in Washington County in an attempt to capture opinions from a diverse citizen base. To further capture the diversity of Washington County residents a focus group was conducted in Spanish with members of the Hispanic community. Meeting locations included:
Florida Panhandle Technical College, Chipley, FL
St. Joseph Catholic Church, Chipley, FL
Caryville Community Center, Caryville, FL
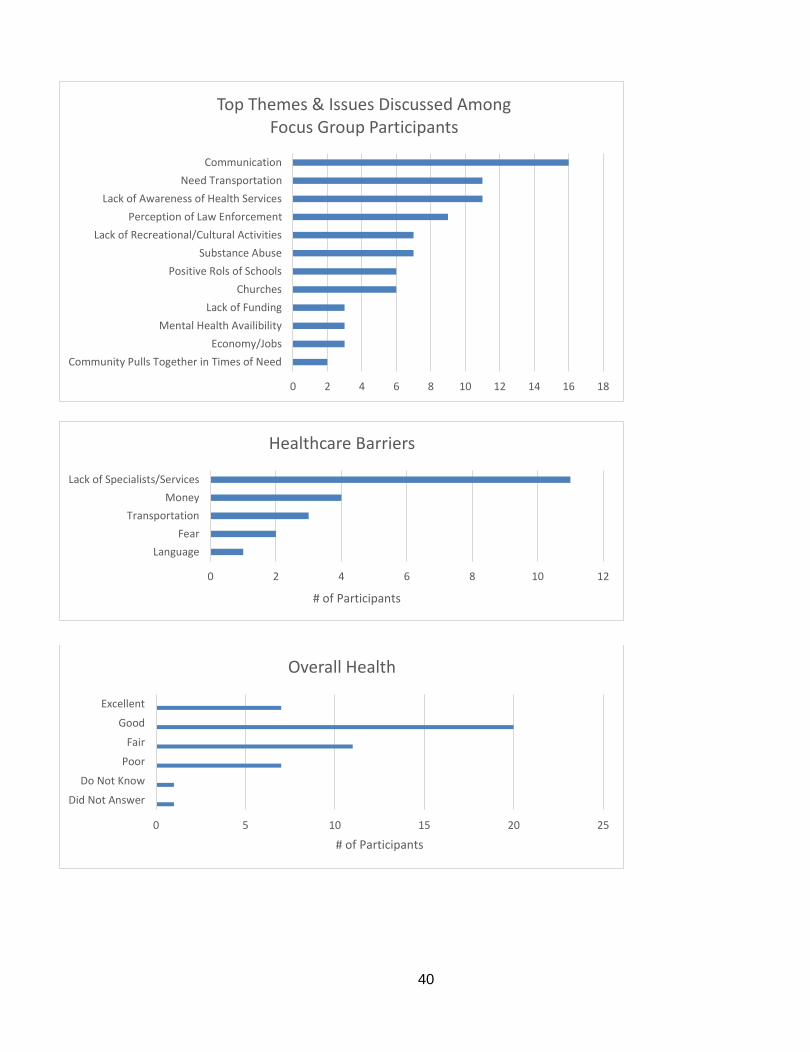
Following the focus groups, an analysis of the focus group data was conducted to determine top themes and issues discussed by community participants. Using field notes and recordings of the focus groups, participant responses were grouped into categories and weighted based on the frequency, extensiveness, and intensity with which a category or topic was discussed. Frequency relates to how often a comment or topic was mentioned. Extensiveness relates to how in depth a comment or topic was discussed. Intensity relates to whether a comment was discussed with greater strength/depth of feeling.
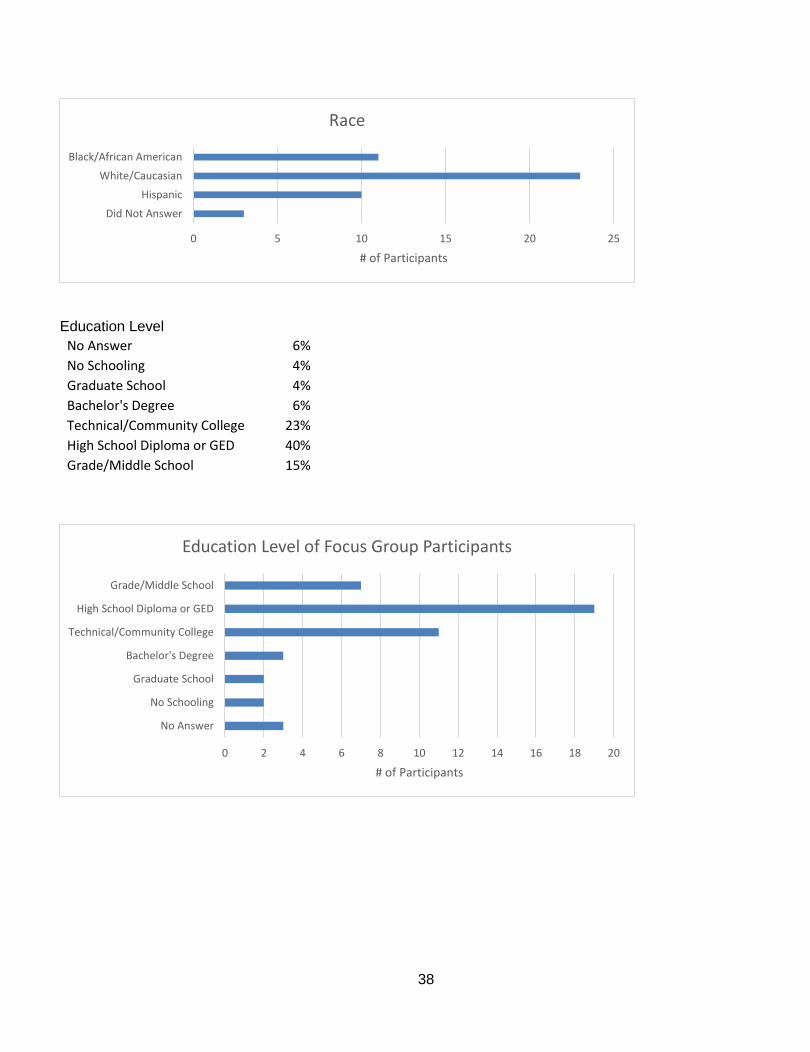
Focus Group Demographics A total of 47 participants in attendance at the focus groups filled out the demographic survey. Data Points to pick from to highlight: Age Distribution:

37
75+ 11%
65 - 74 11%
55 - 64 4%
40 - 54 15%
26 - 39 19%
18 - 25 38% Less than 18 2%
Gender:
Female 55%
Male 45%
Race
Did Not Answer 6%
Hispanic 21%
White/Caucasian 49% Black/African American 23%
0
5
10
15
20
75+ 65 - 74 55 - 64 40 - 54 26 - 39 18 - 25 Less than 18
# o
f P
arti
cip
ants
Age Groups
Age of Participants in Focus Groups
0 5 10 15 20 25 30
Female
Male
# of Participants
Gender
38
Education Level
No Answer 6%
No Schooling 4%
Graduate School 4%
Bachelor's Degree 6%
Technical/Community College 23%
High School Diploma or GED 40%
Grade/Middle School 15%
0 5 10 15 20 25
Did Not Answer
Hispanic
White/Caucasian
Black/African American
# of Participants
Race
0 2 4 6 8 10 12 14 16 18 20
No Answer
No Schooling
Graduate School
Bachelor's Degree
Technical/Community College
High School Diploma or GED
Grade/Middle School
# of Participants
Education Level of Focus Group Participants

39
0
2
4
6
8
10
12
Did NotAnswer
$100,000 orMore
$50,000 -$99,999
$30,000 -$49,999
$20,000 -$29,999
$10,000 -$19,999
Less than$10,000
# o
f P
arti
cip
ants
Household Income
Household Annual Income (Before Taxes)
0 2 4 6 8 10 12 14
Retired/Disability
Retired
Self Employed
Full Time Student
Part Time Student
Student
Stay At Home
Unemployed
Part Time
Full Time
# of Participants
Employment Status
40
0 2 4 6 8 10 12 14 16 18
Community Pulls Together in Times of Need
Economy/Jobs
Mental Health Availibility
Lack of Funding
Churches
Positive Rols of Schools
Substance Abuse
Lack of Recreational/Cultural Activities
Perception of Law Enforcement
Lack of Awareness of Health Services
Need Transportation
Communication
Top Themes & Issues Discussed Among Focus Group Participants
0 5 10 15 20 25
Did Not Answer
Do Not Know
Poor
Fair
Good
Excellent
# of Participants
Overall Health
0 2 4 6 8 10 12
Language
Fear
Transportation
Money
Lack of Specialists/Services
# of Participants
Healthcare Barriers

41
Appendix B: Community Survey Materials
42

43

44

45

46
Community Survey Summary
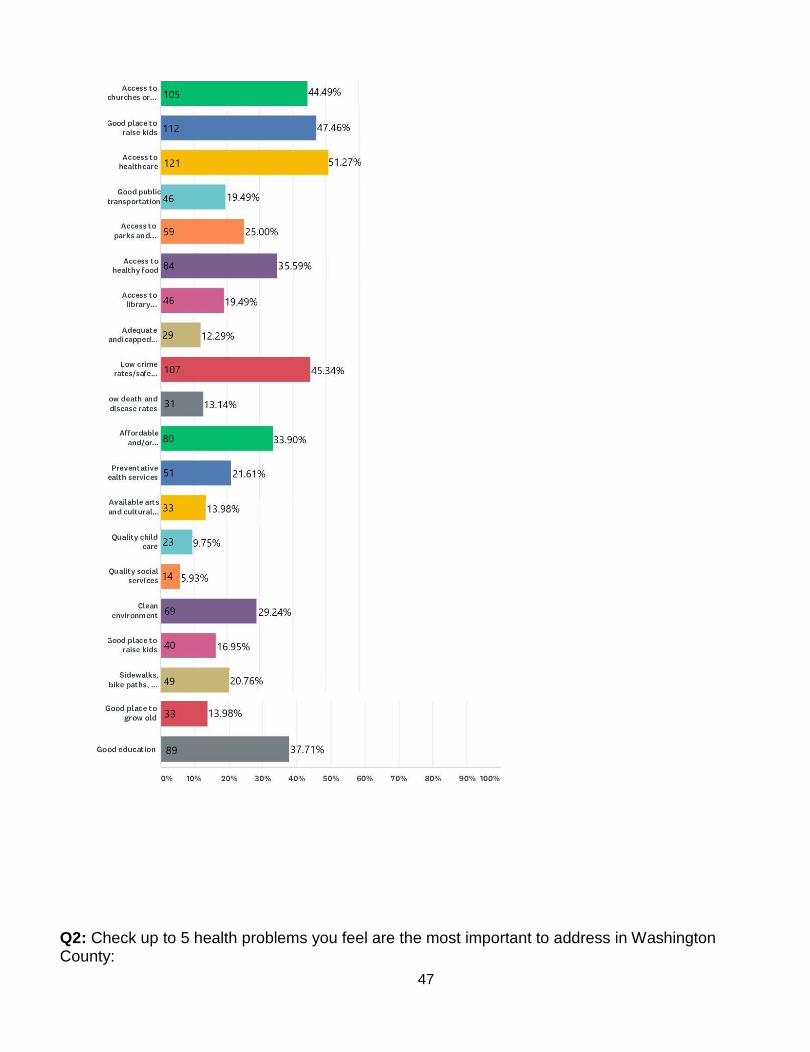
Community Survey In order to better understand the health status of the Washington County community, the Washington County on Wellness Task Force asked community members and stakeholders to participate in a survey on community health, health care services and quality of life in Washington County. A total of 236 community members and stakeholders in Washington County took the survey. Not all respondents answered every question on the survey. Percentages in the charts and narrative that follow are calculated based on the number of respondents per question, rather than the total number of respondents for the survey as a whole. Q1: Check up to 5 selections you feel are the most important features of a healthy community:
Based on the information provided the top 5 answered by 236 and skipped by 0: #1 Access to healthcare 51.27%; #2 Good place to raise kids 47.46%; #3 Low crime rates/safe neighborhoods 45.34%; #4 Access to churches or other places of worship; #5 Good education 37.71% FIGURE 1: IMPORTANT FEATURES OF HEALTH TO COMMUNITY SURVEY RESPONDENTS
47
Q2: Check up to 5 health problems you feel are the most important to address in Washington County:

48
Based on the information provided the top 5 answered by 236 and skipped by 0: #1 High blood pressure; #2 Obesity 69.07%; #3 (TIED) Diabetes and Cancer 65.68% #4 Heart disease & stroke 65.25%; #5 Contagious diseases 40.25% FIGURE 2: IMMANENT HEALTH ISSUES OF COMMUNITY SURVEY RESPONDENTS
Q3: Check up to 5 areas that you feel is an access and availability problem in Washington County:

49
Based on the information provided the top 5 answered by 233 and skipped by 3: #1 Mental health services for adults 55.79%; #2 Mental health services for young children and teens 51.93%; #3 Substance abuse services 46.78%; #4 Specialty care services 41.20%; 5# Pediatric services 39.91% FIGURE 3: ACCESS AND AVAILABILITY PROBLEMS OF COMMUNITY SURVEY RESPONDENTS
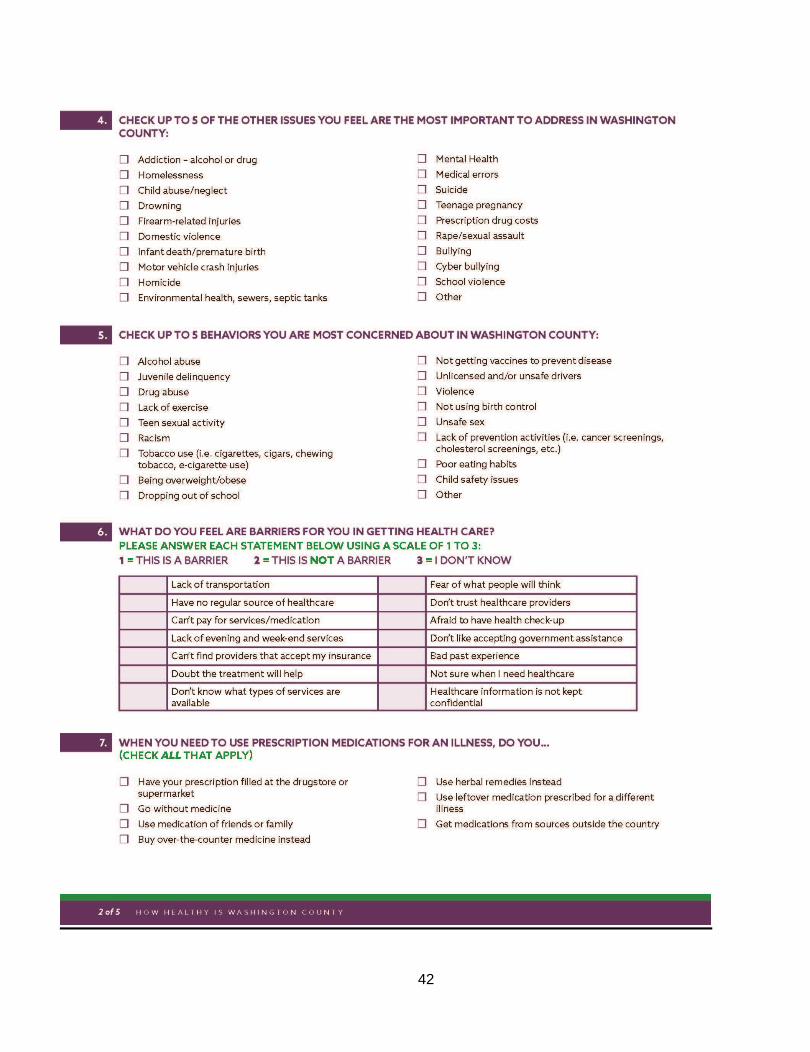
Q4: Check up to 5 of the other issues you feel are the most important to address in Washington County:

50
Based on the information provided the top 5 answered by 232 and skipped by 4: #1 Addiction – alcohol or drug 66.81%; #2 Child abuse/neglect 56.47%; #3 Domestic violence 47.84%; #4 Mental health 43.53%; Suicide 32.33% FIGURE 4: IMPORTANT ISSUES OF COMMUNITY SURVEY RESPONDENTS
Q5: Check up to 5 behaviors you are most concerned about Washington County: Based on the information provided the top 5 answered by 230 and skipped by 6:

51
#1 Drug abuse 68.70%; #2 Being overweight/obese 50.43%; #3 Alcohol abuse 41.30%; #4 (TIED) Lack of exercise/Poor eating habits 32.17%; #5 Racism 30.00% FIGURE 5: BEHAVIORAL CONCERNS OF COMMUNITY SURVEY RESPONDENTS

52
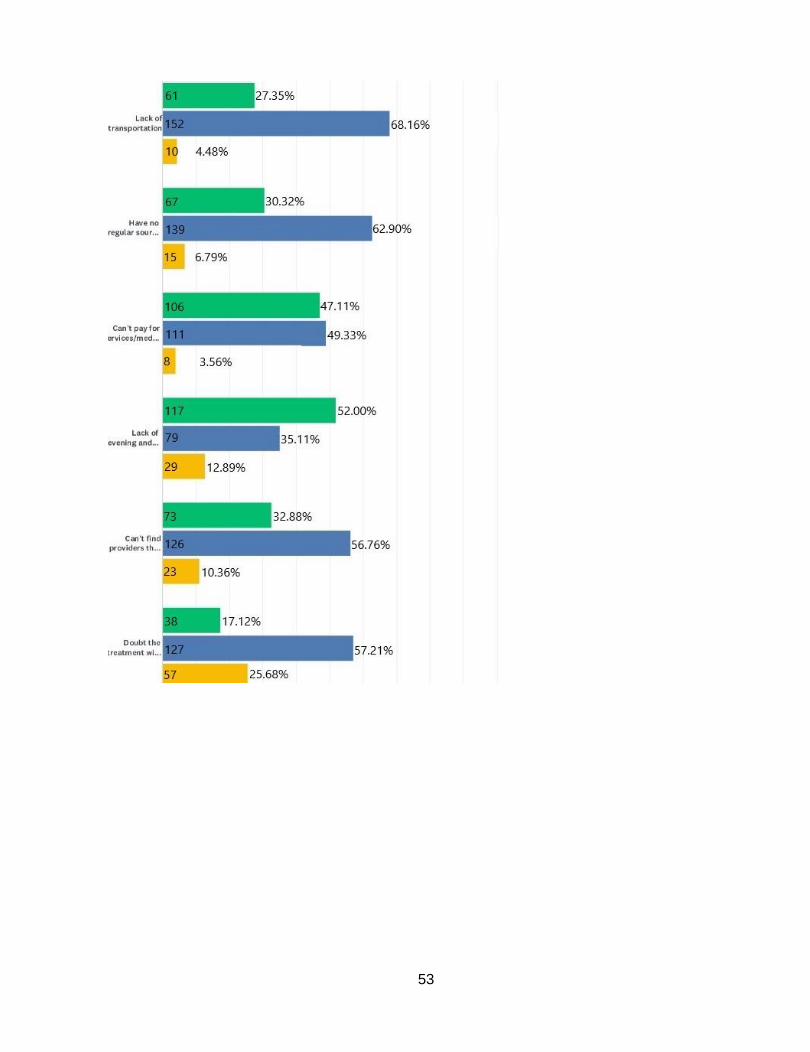
Q6: What do you feel are barriers for you in getting health care? Based on the information provided by 227 and skipped by 9: Not a barrier: Lack of transportation 68.16%; Have no regular source of healthcare 62.90%; Can’t find providers that accept my insurance 56.76%; Doubt the treatment will help 57.21%; Don’t know what types of services are available 47.30%; Fear of what people will think 73.66%; Don’t trust healthcare providers 64.73%; Afraid to have health check-up 73.21%; Don’t like accepting government assistance 70.85%; Bad past experience 69.51%; Not sure when I need healthcare 68.61%; Healthcare information is not kept confidential 61.33% A barrier: Lack of evening and weekend services 52.00% A potential barrier: Can’t pay for services/medications 49.33% states it’s a barrier and 47.11% state that it is a barrier. FIGURE 6: HEALTH BARRIERS OF COMMUNITY SURVEY RESPONDENTS
53

54
Q7: When you need to use prescription medications for an illness do you:
55
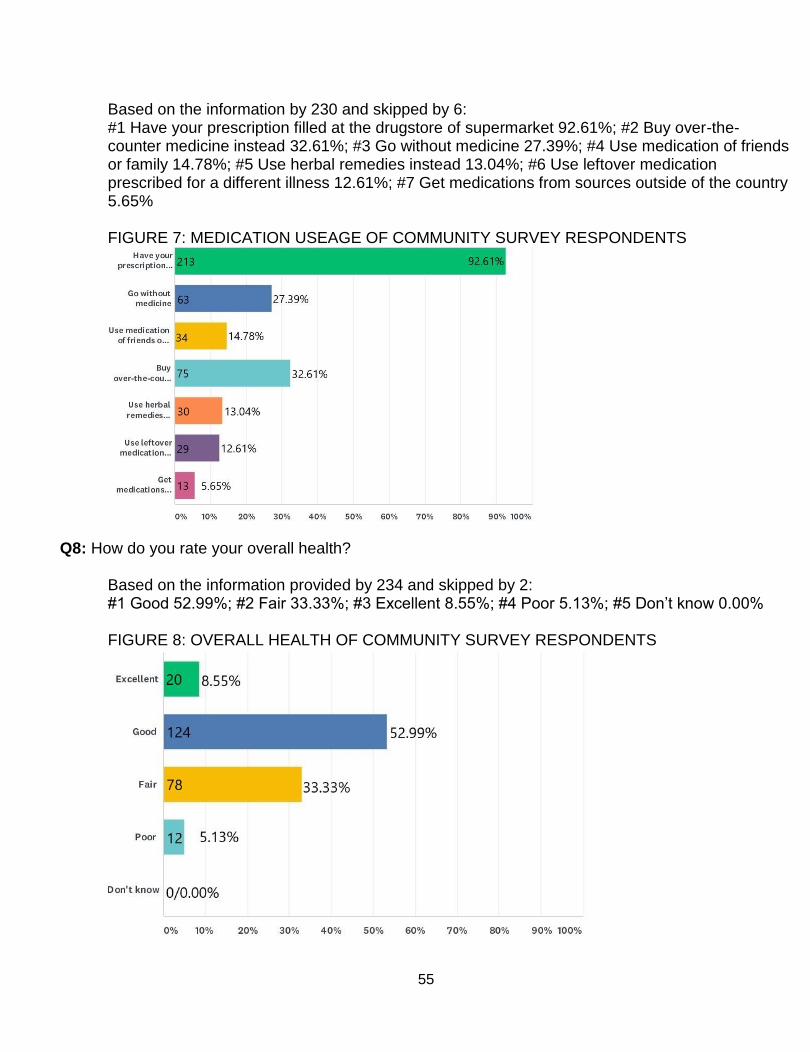
Based on the information by 230 and skipped by 6: #1 Have your prescription filled at the drugstore of supermarket 92.61%; #2 Buy over-the-counter medicine instead 32.61%; #3 Go without medicine 27.39%; #4 Use medication of friends or family 14.78%; #5 Use herbal remedies instead 13.04%; #6 Use leftover medication prescribed for a different illness 12.61%; #7 Get medications from sources outside of the country 5.65% FIGURE 7: MEDICATION USEAGE OF COMMUNITY SURVEY RESPONDENTS
Q8: How do you rate your overall health? Based on the information provided by 234 and skipped by 2: #1 Good 52.99%; #2 Fair 33.33%; #3 Excellent 8.55%; #4 Poor 5.13%; #5 Don’t know 0.00% FIGURE 8: OVERALL HEALTH OF COMMUNITY SURVEY RESPONDENTS

56
Q9: How would you rate Washington County as a “Healthy County”? Based on the information provided by 234 and skipped by 2: #1 Somewhat healthy 46.15%; #2 Unhealthy 24.36%; #3 Somewhat unhealthy 10.26%; #5 Very unhealthy 8.97%; #6 Very healthy 1.71% FIGURE 9: HEALTH RATING OF COMMUNITY SURVEY RESPONDENTS
Q10: How is your healthcare covered?
Based on the information provided by 235 and skipped by 1: #1 Health insurance offered from your job or a family member’s job 50.21%; #2 Medicare 24.26%; #3 I don’t have health insurance 17.02%; #4 Health insurance that you pay for on your own 13.19%; #5 Medicaid 8.94%; #6 Veterans’ Administration 4.26%; #7 Military Coverage 2.98%; #8 Other 0.85% FIGURE 10: HEALTH CARE COVERAGE OF COMMUNITY SURVEY RESPONDENTS

57
Q11: Who do you feel is the most responsible for keeping you healthy? Based on the information provided by 234 and skipped by 2: #1 Myself 76.50%; #2 Family 11.11%; #3 Medical professionals 9.83%; #4 Hospitals 1.28%; #5 Other 0.85%; #6 Church or other place of worship 0.43%; #7 School clinics 0.00% FIGURE 11: RESPONSIBILITY OF HEALTH OF COMMUNITY SURVEY RESPONDENTS
Q12: Where do you go if you are sick or need advice about your health? Based on the information provided by 230 and skipped by 6: #1 A doctor’s office 78.26%; #2 Hospital emergency room 20.00%; #3 Urgent care/Walk-in clinic; #4 Nowhere – I don’t have a place to go when I get sick 8.70%; #5 The local health department 8.26%; #6 Social media/web searches 4.78%; #7 Other 3.91%; #8 A school clinic 0.00%

58
FIGURE 12: HEALTH ADVICE OF COMMUNITY SURVEY RESPONDENTS
Q13: What social media services do you use on a regular basis?
Based on the information provided by 219 and skipped by 17: #1 Facebook 84.47%; #2 Instagram 26.94%; #3 Pinterest 23.29%; #4 Snapchat 26.94%; #5 Twitter 13.70%; #6 Other 10.96% #7 LinkedIn 5.94%; #8 Tumblr 4.11% FIGURE 13: SOCIAL MEDIA SERVICES OF COMMUNITY SURVEY RESPONDENTS

59
Q14: Have you ever used a child care center or family child care home to take care of your children: Based on the information provided by 232 and skipped by 4: #1 No 45.69%; #2 Yes 35.34%; #3 I don’t have children 19.97% FIGURE 14: CHILD CARE USAGE OF COMMUNITY SURVEY RESPONDENTS
Q15: Other than cost, what are the 3 most important factors that you would consider when choosing child care?
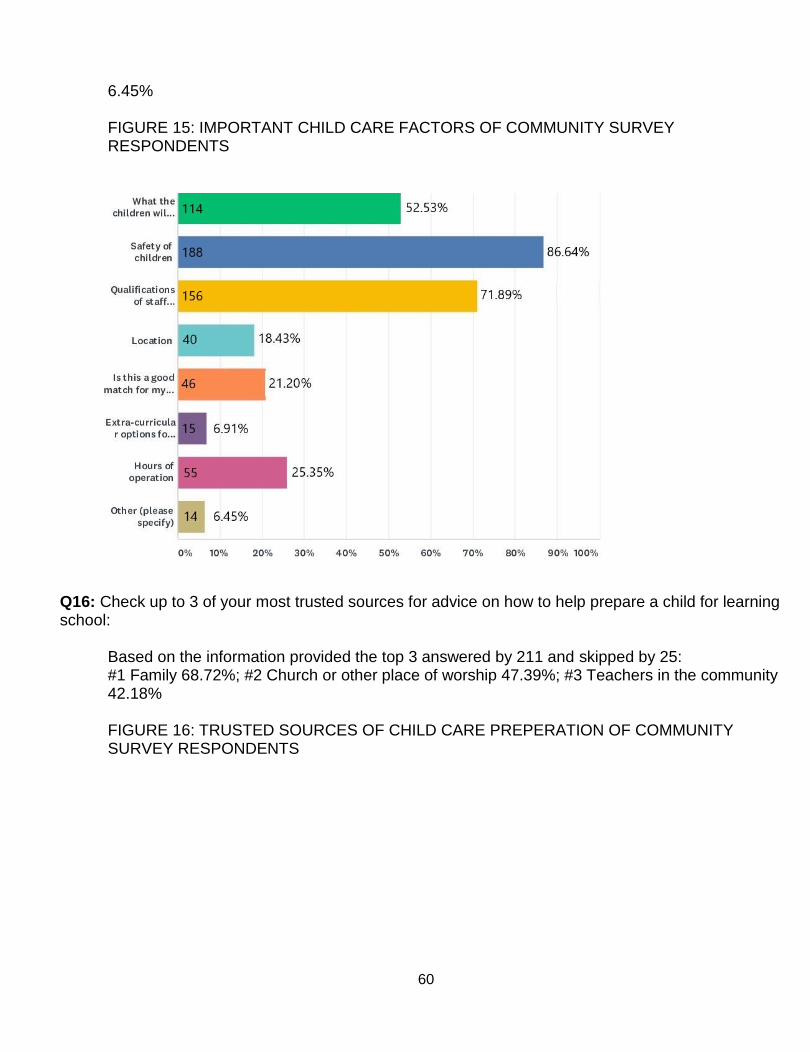
Based on the information provided by 217 and skipped by 19: #1 Safety of children 86.64%; #2 Qualifications of staff teaching/caring for children 71.89%; #3 What the children will learn 52.53%; #4 Hours of operation 25.35%; #5 Is this a good match for my child 21.20%; #6 Location 18.43%; #7 Extra-curricular options for my child 6.91%; #8 Other
60
6.45% FIGURE 15: IMPORTANT CHILD CARE FACTORS OF COMMUNITY SURVEY RESPONDENTS
Q16: Check up to 3 of your most trusted sources for advice on how to help prepare a child for learning school:
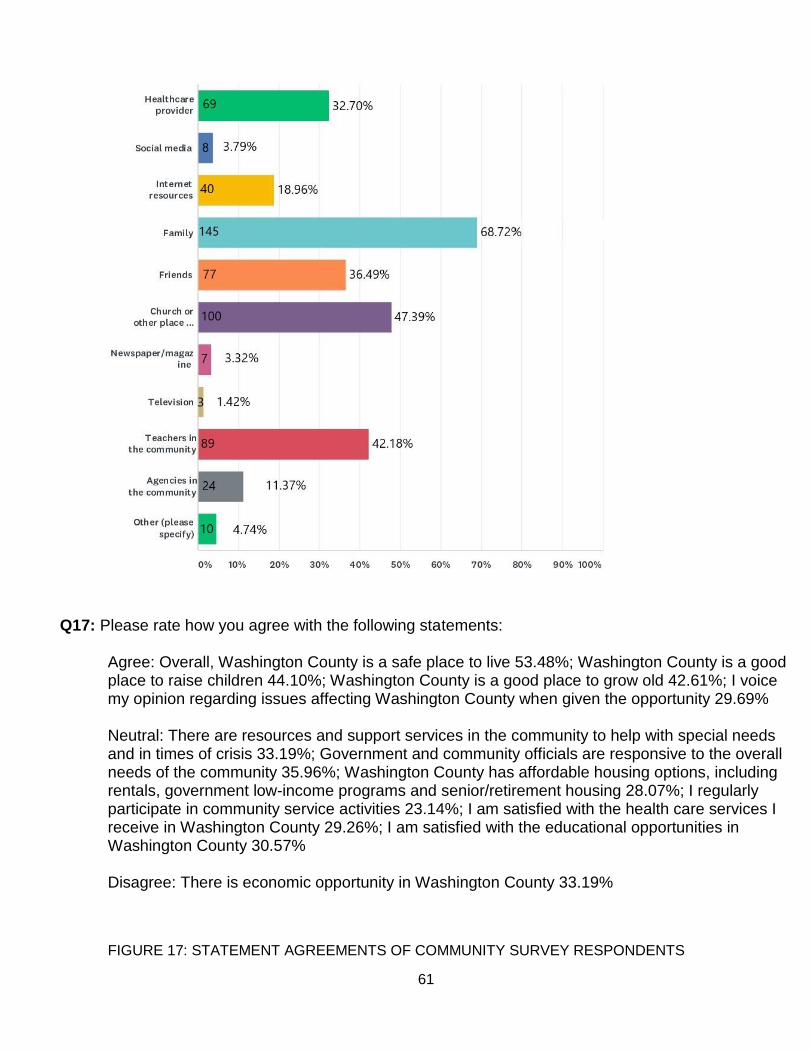
Based on the information provided the top 3 answered by 211 and skipped by 25: #1 Family 68.72%; #2 Church or other place of worship 47.39%; #3 Teachers in the community 42.18% FIGURE 16: TRUSTED SOURCES OF CHILD CARE PREPERATION OF COMMUNITY SURVEY RESPONDENTS
61
Q17: Please rate how you agree with the following statements: Agree: Overall, Washington County is a safe place to live 53.48%; Washington County is a good place to raise children 44.10%; Washington County is a good place to grow old 42.61%; I voice my opinion regarding issues affecting Washington County when given the opportunity 29.69% Neutral: There are resources and support services in the community to help with special needs and in times of crisis 33.19%; Government and community officials are responsive to the overall needs of the community 35.96%; Washington County has affordable housing options, including rentals, government low-income programs and senior/retirement housing 28.07%; I regularly participate in community service activities 23.14%; I am satisfied with the health care services I receive in Washington County 29.26%; I am satisfied with the educational opportunities in Washington County 30.57% Disagree: There is economic opportunity in Washington County 33.19% FIGURE 17: STATEMENT AGREEMENTS OF COMMUNITY SURVEY RESPONDENTS

62

63

64
Q18: Name of city/town where you live: Based on the information 225 answered and was skipped by 11: Answers in written format.
Q19: What is your zip code: Based on the information 226 answered and was skipped by 10: Answers in written format.
Q20: How long have you lived there: Based on the information 222 answered and was skipped by 14: Answers in written format.
Q21: Select your age range
65
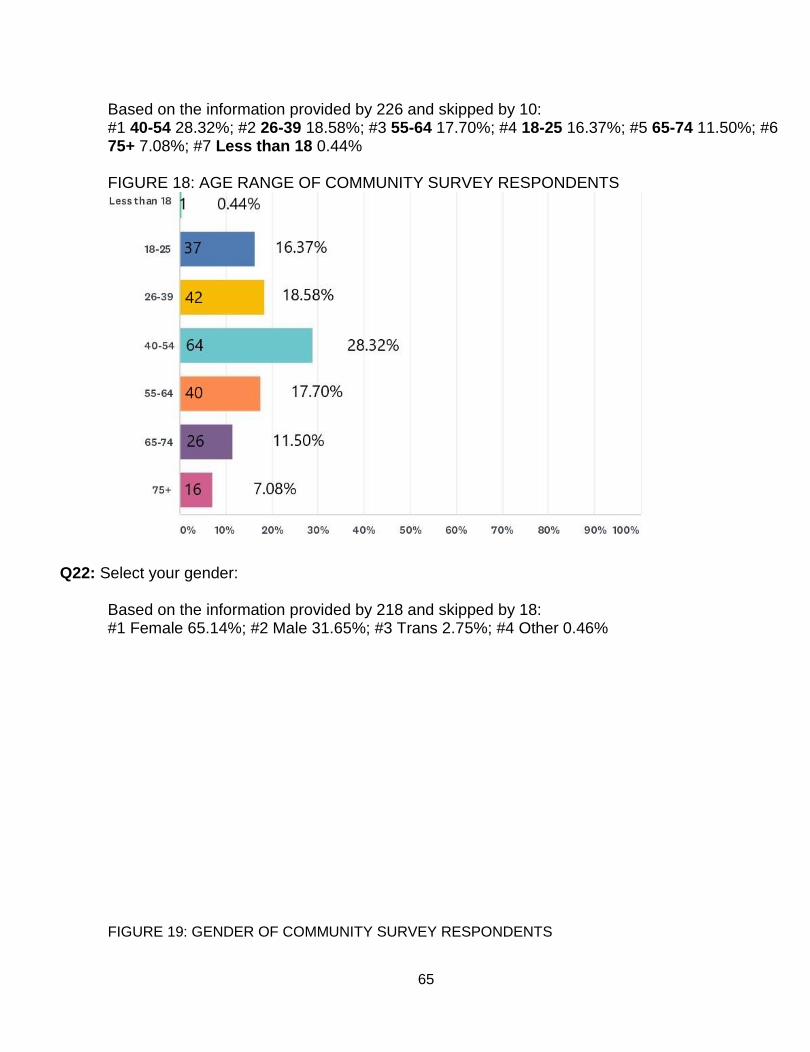
Based on the information provided by 226 and skipped by 10: #1 40-54 28.32%; #2 26-39 18.58%; #3 55-64 17.70%; #4 18-25 16.37%; #5 65-74 11.50%; #6 75+ 7.08%; #7 Less than 18 0.44% FIGURE 18: AGE RANGE OF COMMUNITY SURVEY RESPONDENTS
Q22: Select your gender: Based on the information provided by 218 and skipped by 18: #1 Female 65.14%; #2 Male 31.65%; #3 Trans 2.75%; #4 Other 0.46% FIGURE 19: GENDER OF COMMUNITY SURVEY RESPONDENTS

66
Q23: Which race/ethnicity do you most identify with? Based on the information provided by 223 and skipped by 13: #1 White/Caucasian 65.02%; #2 Black/African American 26.01%; #3 Hispanic 4.48%; #4 Biracial 2.24%; #5 Other 1.79%; #6 Native American 0.45%; #7 Asian/Pacific Islander 0.00% FIGURE 20: RACE/ETHNICITY OF COMMUNITY SURVEY RESPONDENTS
Q24: What is your marital status?

67
Based on the information provided by 217 and skipped by 19: #1 Married 40.55%; #2 Single 29.49%; #3 Divorced 13.36%; #4 Widow/Widower 8.76%; #5 Separated 4.15%; #6 Other 3.69% FIGURE 21: MARITAL STATUS OF COMMUNITY SURVEY RESPONDENTS
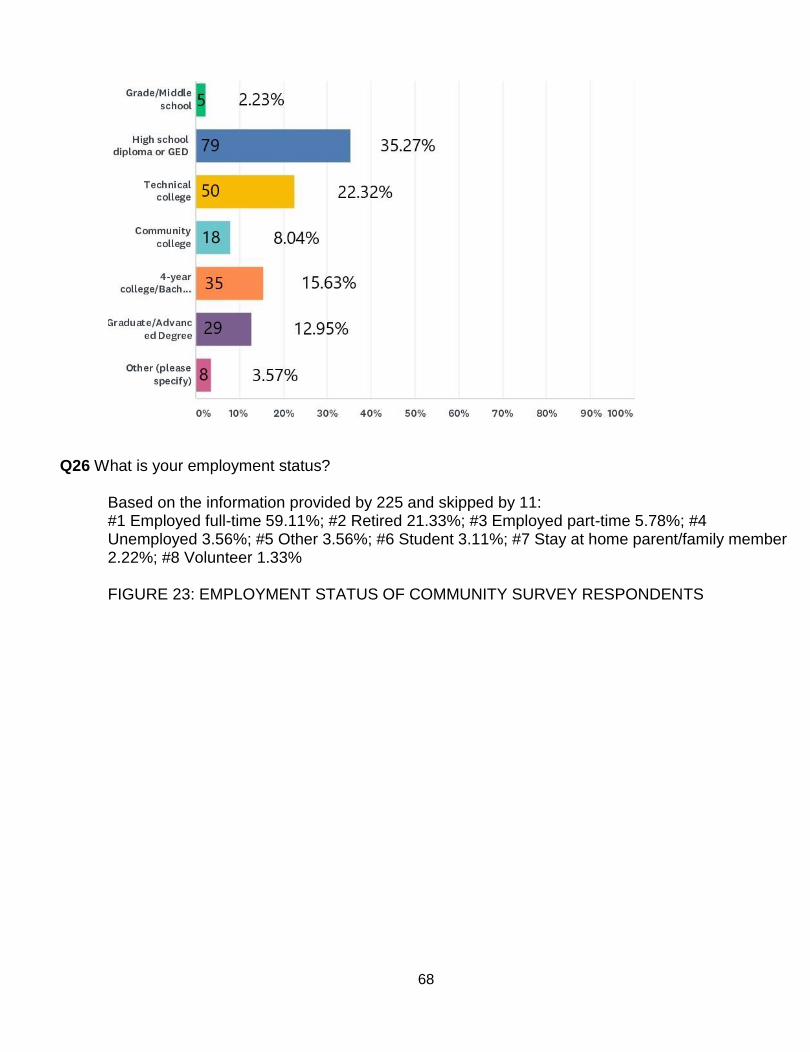
Q25: What is the highest level of education you have completed? Based on the information provided by 224 and skipped by 12: #1 High school diploma or GED 35.27%; #2 Technical college 22.32%; #3 4-year college/bachelor’s degree 15.63%; #4 Graduate/Advanced Degree 12.95%; #5 Community College 8.04%; #6 Other 3.57%; #7 Grade/Middle School 2.23% FIGURE 22: HIGHEST LEVEL OF EDUCATION OF COMMUNITY SURVEY RESPONDENTS
68
Q26 What is your employment status? Based on the information provided by 225 and skipped by 11: #1 Employed full-time 59.11%; #2 Retired 21.33%; #3 Employed part-time 5.78%; #4 Unemployed 3.56%; #5 Other 3.56%; #6 Student 3.11%; #7 Stay at home parent/family member 2.22%; #8 Volunteer 1.33% FIGURE 23: EMPLOYMENT STATUS OF COMMUNITY SURVEY RESPONDENTS

69
Q27: What is your household’s yearly income before tax? Based on the information provided by 213 and skipped by 23: #1 $30,000-$50,000 20.66%; #2 Less than $10,000 20.19%; #3 50,000-$99,000 19.72%; #4 $20,000-$30,000 15.49%; #5 $10,000-$20,000 12.68%; #6 $100,000 or more 11.27%
FIGURE 24: YEARLY INCOME OF COMMUNITY SURVEY RESPONDENTS
Q28: Please list any other comments you have about the health issues in Washington County:

70
Based on the information, 82 answered and was skipped by 154:
We need more restaurant choices, more things for families to do together, such as movies,
bowling, put-put golf, etc. Keep the residents in town to do things. Keep their money here.
We need to be closer to Mother Earth and connect to each other as one race, the human race.
We need less hate and drugs and more love. Love will heal us all.
Too many people are on drugs and there's no help for them. You can't find a good place to live
that isn't too expensive. Meth is a BIG problem. We need help.
I feel we need more prenatal care and more prenatal options.
Need a place to exercise. Clean and easily accessed.
Need a safe place to exercise.
Northwest Florida Community Hospital needs more help at the Emergency Room. More help and
more educated help. I went there and waited several hours to be seen only to be turned away,
saying I don't have a problem. Laziness. Just plain laziness. If you want to die, then go to that
hospital.
Need more jobs.
More local activities would be nice! :)
We do not have many options locally for healthier lifestyles, such as access to fresh fruits and
vegetables or recreation. We should have initiatives to encourage local grocers/farmers markets
to set up in each town.
We need a place to get a good workout. A local gym would be good. I tried this place that was
privately owned and never could get the code right. Wasted a month's payment. I'm not the only
one who had issues. We need PROFESSIONALS! Give us a Planet Fitness!
Better access to prenatal care
NFCH needs more good workers that will do their job correctly. If you go to the ER, they will
send you right back out saying you don't have a problem. I believe its laziness. Poor services. I
wouldn't recommend anyone go there.
Washington Co. offers more than Jackson Co. which is why I have visited doctors there but will
no longer because of extremely long wait periods (hours). Also, feel pressure to take meds that I
consider a poor choice based on educated evaluation of meds. It would be nice to actually see a
Dr. versus a RN or Dr. Asst.

71
Very few choices for food - "Organic"/Fresh - and not many choices for primary care doctors.
Of concern is the amount of illegal drug use/availability in the area.
Wait time for health care is too long.
Need a free gym and classes to assist with healthy meals free
Need more options
Birthing center or deliver babies at the hospital
I think Washington County Health Department is doing a wonderful job in our community,
especially with our children.
I think Washington County Health Department is doing a wonderful job in our community,
especially with our children.
Second hand smoke is a huge issue. We also need dementia services for elderly people.

72
Appendix C: Local Public Health System Assessment Summary (LPHSA)
LPHSA Summary
The National Public Health Performance Standards Program (NPHPSP) was developed by the U.S. Department of Health and Human Services (DHHS) to provide measurable performance standards public health systems can use to ensure delivery of public health services. The Local Public Health System Assessment (LPHSA) is a tool from the NPHPSP used to examine competency, capacity, and provision of health services at the local level. The DHHS defines the public health systems as “all public, private, and voluntary entities that contribute to the delivery of essential public health services within a jurisdiction.”63 The 10 Essential Public Health Services outline the public health activities that should be undertaken in all communities, providing the fundamental framework for the LPHSA.63 The LPHSA instrument is divided into ten sections, assessing the local public health system’s ability to provide each Essential Service. The 10 Essential Public Health Services are:
1. Monitor health status to identify community health problems. 2. Diagnose and investigate health problems and health hazards in the community. 3. Inform, educate, and empower people about health issues . 4. Mobilize community partnerships to identify and solve health problems. 5. Develop policies and plans that support individual and community health efforts. 6. Enforce laws and regulations that protect health and ensure safety. 7. Link people to needed personal health services and assure the provision of healthcare when otherwise unavailable. 8. Assure a competent public and personal healthcare workforce. 9. Evaluate effectiveness, accessibility and quality of personal and population-based health services.
10. Research for new insights and innovative solutions to health problems.

73
Washington County stakeholders met in a face-to-face meeting on February 28, 2019 to review and score each of the ten essential public health services. Participants were asked questions about each essential service and scored each service using recommended scoring levels provided in the assessment instrument. The scoring levels are as follows:
Optimal Activity (76-100%): Greater than 75% of the activity described within the question is met.
Significant Activity (51-75%): Greater than 50% but no more than 75% of the activity described within the question is met.
Moderate Activity (26-50%): Greater than 25% but no more than 50% of the activity described within the question is met.
Minimal Activity (1-25%): Greater than zero but no more than 25% of the activity described within the question is met.
No Activity (0%): 0% or absolutely no activity. Figure 1 below provides the overall score for each of the ten essential services, as determined by the Washington County stakeholders. It is important to remember that these scores consider the county’s complete public health/safety-net services system and are not limited to activities performed directly by the county health department. Washington County performs best in Essential Services 1, 2, 3, 4, 5, 6, and 9 and worst in Essential Services 7, 8 and 10.
FIGURE 1 ESSENTIAL PUBLIC HEALTH SERVICE PERFORMANCE SCORE SUMMARY, 2019
Figure 2 shows further breakdown of the performance scores for essential services (7) Link to Health Services, (8)
78.3
80.6
94.4
80.6
82.3
89.6
81.8
65.6
73.8
82.1
52.8
0.0 20.0 40.0 60.0 80.0 100.0
Average Overall Score
ES 1: Monitor Health Status
ES 2: Diagnose and Investigate
ES 3: Educate/Empower
ES 4: Mobilize Partnerships
ES 5: Develop Policies/Plans
ES 6: Enforce Laws
ES 7: Link to Health Services
ES 8: Assure Workforce
ES 9: Evaluate Services
ES 10: Research/Innovations
Summary of Average ES Performance Score

74
Assure Workforce, and (10) Research/Innovations. These were the essential services most in need of improvement, as
identified by the Local Public Health System Assessment stakeholders.
FIGURE 2. DETAILED PERFORMANCE SCORES FOR ESSENTIAL SERVICES 7, 8, AND 10
ES 7: Link to Health Services 65.6
7.1 Personal Health Service Needs 75.0
7.2 Assure Linkage 56.3
ES 8: Assure Workforce 73.8
8.1 Workforce Assessment 58.3
8.2 Workforce Standards 91.7
8.3 Continuing Education 70.0
8.4 Leadership Development 75.0
ES 10: Research/Innovations 52.8
10.1 Foster Innovation 50.0
10.2 Academic Linkages 58.3
10.3 Research Capacity 50.0
75
Appendix D: Forces of Change Materials

76
77
78

79

80

81
82

83
Forces of Change Summary
One of the components of the Washington County Community Health Assessment process is the
Forces of Change (FOC) Assessment. The purpose of this assessment is to identify what impending
changes will affect the community in which the public health system operates. This assessment will answer the question, “What is occurring or might occur that affects the health of
our community or the local public health system?” This FOC assessment will result in a
comprehensive, but focused, list that identifies key forces and describes their impact. The Washington Community Health Improvement Partnership (WCHIP) members considered forces from three major categories :
Forces are a broad, all-encompassing category that includes trends, events and factors.
Trends are patterns over time, such as migration in and out of a community or a
growing disillusionment with government.
Factors are discrete elements, such as a community’s large ethnic population, or rural setting, or
the jurisdiction’s proximity to a major waterway.
Events are one-time occurrences, such as a hospital closure, a natural disaster, or the
passage of new legislation.
The WCHIP consider a variety of perspectives when identifying potential forces of change, including:
Political forces such as policy/legislation, budgeting, and advocacy
Economic forces such as changes in employment/income, program funding levels, and the
stability of industry and trade within the county
Social forces such as population demographics, cultural norms, and violence/crime/safety
Technological forces such as healthcare advances, information technology, and communications
Ethical/Legal forces such as privacy and end of life issues
In choosing the forces, the WCHIP reflected on the following questions:
What has occurred recently that may affect our local public health system or community?
What may occur in the future?
Are there any trends occurring that will have an impact locally?
What forces are occurring locally? Regionally? Nationally? Globally?
What characteristics of our jurisdiction or state may pose an opportunity or threat?
What may occur or has occurred that may pose a barrier to achieving the shared vision?
The anticipated forces of change identified by the WCHIP, along with the potential impacts (both
positive and negative), are included in the lists below.

84
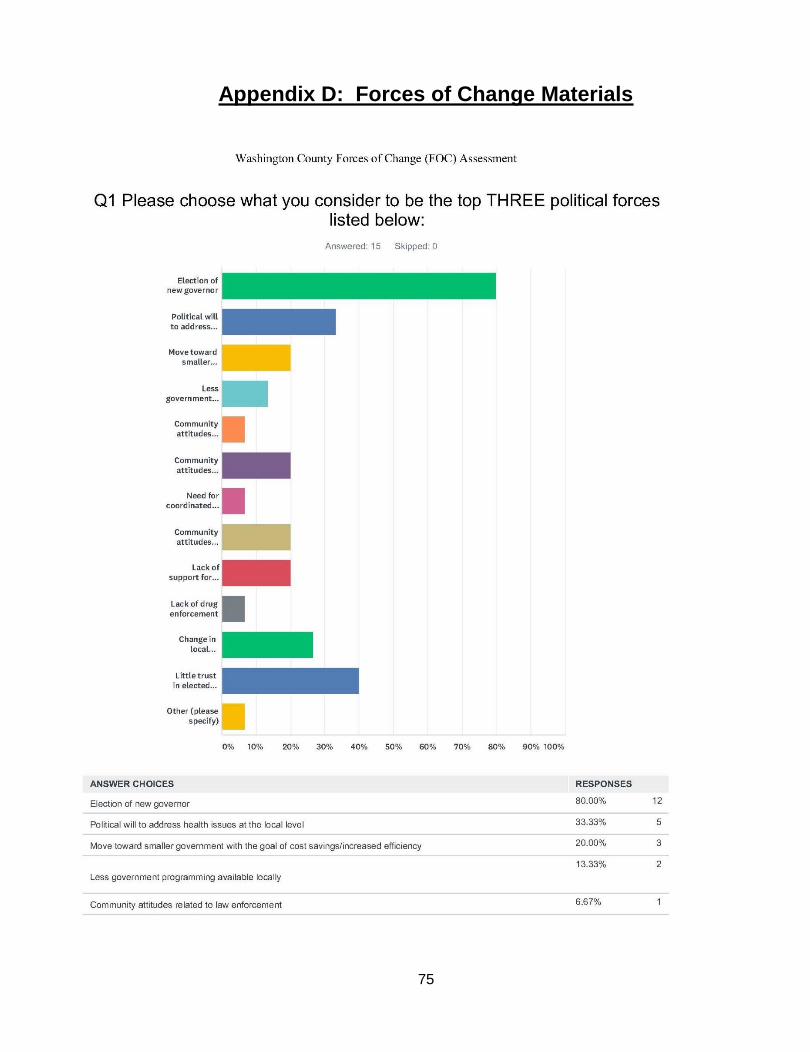
The top ranked political forces include:
1. Election of new governor
2. Little trust in elected officials
3. Political will to address health issues at the local level
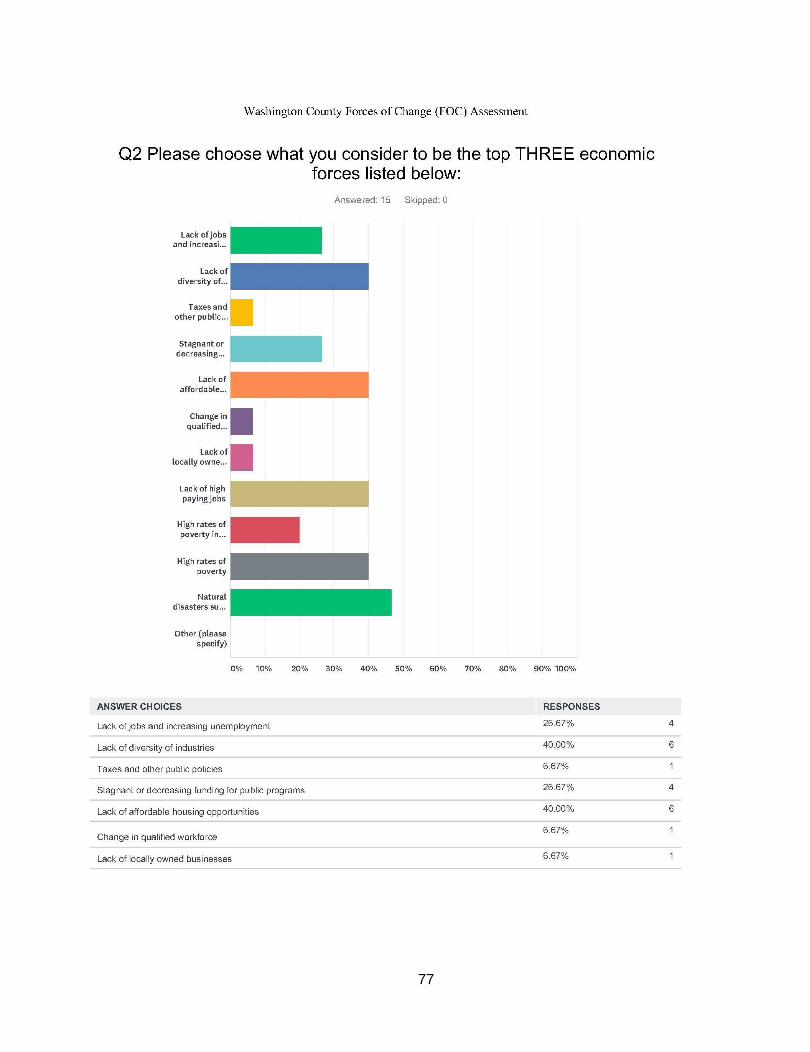
The top ranked economic forces include:
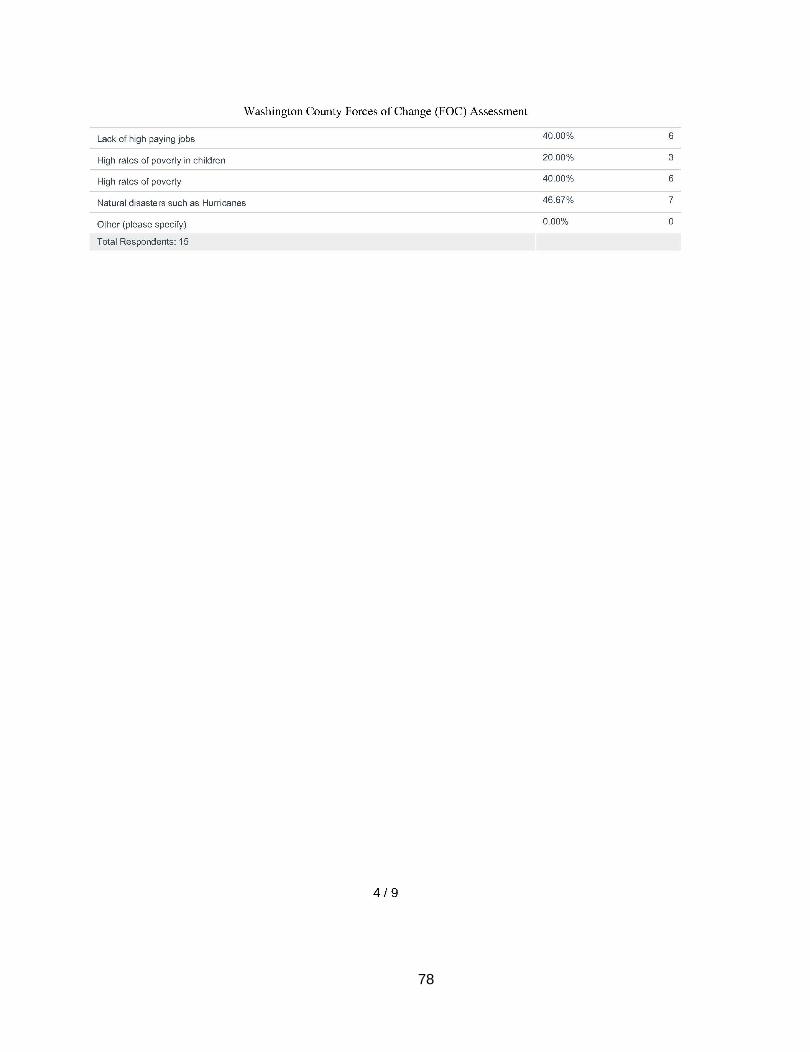
1. Natural disasters such as hurricanes
2. Lack of diversity of industries and lack of affordable housing opportunities
3. Lack of jobs and increasing unemployment and stagnant or decreasing funding for public programs.
The top ranked social forces include:
1. Increase in drug abuse (prescription and non-prescription) and increase in mental health issues.
2. Culture that is resistant to change
3. Increase in violence/crime
The top ranked technological forces include:
1. Increasing pervasiveness and reliance on evolving technology in day-to-day society (social media, online blogs, texting, smart phones, Skype)
2. Increasing technology requirements (electronic health record, meaningful use, etc.)
3. New technologies driving the need for technology competency within the workforce and among consumers
The top ranked ethical/legal forces include:
1. Changing of prescribing of controlled substances
2. Implementation of the Patient Protection and Affordable Care Act (also known as Obamacare)
3. Lack of Medicaid expansion in the state of Florida following the Affordable Care Act
Some survey respondents listed additional forces, trends, factors events that did not necessarily fit
into the political, technological, or ethical/legal categories. These included:
Lack of access to services Lack of low-income housing Lack of long-term care options Need affordable health insurance options Need faith-based intervention (spiritual)
