community health survey report - milwaukee...community health survey report . 2012 . commissioned...
TRANSCRIPT

Milwaukee Community Health Survey Report
2012
Commissioned by: Aurora Health Care
Children’s Hospital of Wisconsin Columbia St. Mary’s Health System
Froedtert Health Wheaton Franciscan Healthcare
In Partnership with: Milwaukee Health Department
Center for Urban Population Health
Prepared by: JKV Research, LLC

Milwaukee Community Health Survey Report—2012
Section Title Page Number Purpose ..................................................................................................................................................................... 1 Methodology ............................................................................................................................................................ 1 Summary .................................................................................................................................................................. 4 Key Findings .......................................................................................................................................................... 11 Rating Their Own Health ................................................................................................................................ 11 Health Care Coverage ..................................................................................................................................... 15 Health Care Needed ........................................................................................................................................ 24 Health Information and Services..................................................................................................................... 29 Routine Procedures ......................................................................................................................................... 39 Vaccinations .................................................................................................................................................... 49 Prevalence of Select Health Conditions .......................................................................................................... 54 Physical Well Being and Body Weight ........................................................................................................... 74 Nutrition .......................................................................................................................................................... 86 Women’s Health ............................................................................................................................................. 93 Men’s Health ................................................................................................................................................... 99 Colorectal Cancer Screening ......................................................................................................................... 102 Tobacco Use.................................................................................................................................................. 109 Exposure to Cigarette Smoke ........................................................................................................................ 120 Alcohol Use .................................................................................................................................................. 125 Household Problems ..................................................................................................................................... 131 Mental Health Status ..................................................................................................................................... 134 Personal Safety Issues ................................................................................................................................... 141 Children in Household .................................................................................................................................. 148 Community Health Issues ............................................................................................................................. 156 Appendix A: Questionnaire Frequencies ............................................................................................................. 174 Appendix B: Survey Methodology ...................................................................................................................... 193 Table Title Page Number Table 1. Weighted Demographic Variables of Survey Respondents for 2012 ......................................................... 2 Table 2. Fair or Poor Health by Demographic Variables for Each Survey Year ................................................... 14 Table 3. Personally No Health Care Coverage by Demographic Variables for Each Survey Year ....................... 18 Table 4. Personally Not Covered by Health Insurance in Past 12 Months by Demographic Variables for Each Survey Year ............................................................................................................................... 21 Table 5. Someone in Household Not Covered by Health Insurance in Past 12 Months by Demographic Variables for Each Survey Year ............................................................................................................... 22 Table 6. Prescription Medications Not Taken Due to Cost in Past 12 Months by Demographic Variables for 2012 .................................................................................................................................... 24 Table 7. Unmet Medical Care in Past 12 Months by Demographic Variables for Each Survey Year ................... 26 Table 8. Unmet Dental and Mental Health Care in Past 12 Months by Demographic Variables for 2012............ 28 Table 9. Doctor as Health Information Source by Demographic Variables for Each Survey Year ....................... 31 Table 10. Internet as Health Information Source by Demographic Variables for Each Survey Year .................... 33 Table 11. Doctor’s or Nurse Practitioner’s Office as Primary Health Care Service by Demographic Variables for Each Survey Year ............................................................................................................. 36 Table 12. Advance Care Plan by Demographic Variables for Each Survey Year ................................................. 38 Table 13. Routine Checkup Two Years Ago or Less by Demographic Variables for Each Survey Year ............. 41 Table 14. Cholesterol Test Four Years Ago or Less by Demographic Variables for Each Survey Year. .............. 43 Table 15. Dental Checkup Less than One Year Ago by Demographic Variables for Each Survey Year .............. 46 Table 16. Eye Exam Less than One Year Ago by Demographic Variables for Each Survey Year ....................... 48
Table of Contents
Milwaukee Community Health Survey Report—2012
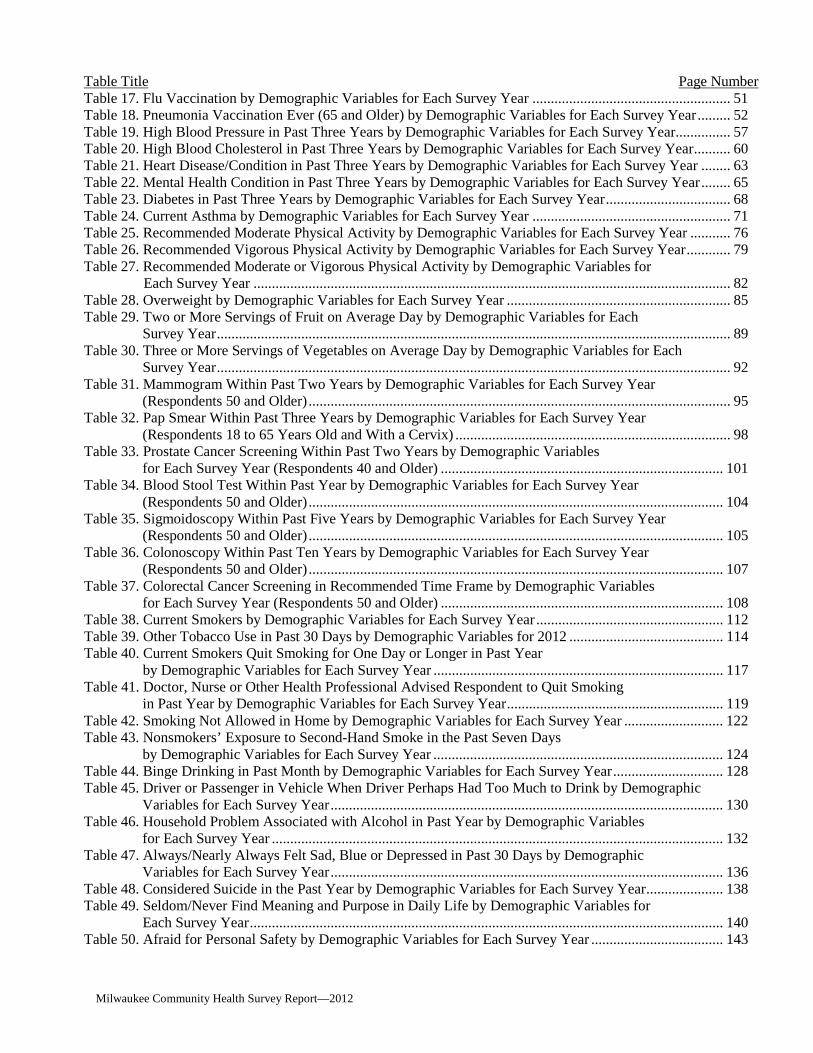
Table Title Page Number Table 17. Flu Vaccination by Demographic Variables for Each Survey Year ...................................................... 51 Table 18. Pneumonia Vaccination Ever (65 and Older) by Demographic Variables for Each Survey Year ......... 52 Table 19. High Blood Pressure in Past Three Years by Demographic Variables for Each Survey Year............... 57 Table 20. High Blood Cholesterol in Past Three Years by Demographic Variables for Each Survey Year .......... 60 Table 21. Heart Disease/Condition in Past Three Years by Demographic Variables for Each Survey Year ........ 63 Table 22. Mental Health Condition in Past Three Years by Demographic Variables for Each Survey Year ........ 65 Table 23. Diabetes in Past Three Years by Demographic Variables for Each Survey Year .................................. 68 Table 24. Current Asthma by Demographic Variables for Each Survey Year ...................................................... 71 Table 25. Recommended Moderate Physical Activity by Demographic Variables for Each Survey Year ........... 76 Table 26. Recommended Vigorous Physical Activity by Demographic Variables for Each Survey Year ............ 79 Table 27. Recommended Moderate or Vigorous Physical Activity by Demographic Variables for Each Survey Year .................................................................................................................................. 82 Table 28. Overweight by Demographic Variables for Each Survey Year ............................................................. 85 Table 29. Two or More Servings of Fruit on Average Day by Demographic Variables for Each Survey Year ............................................................................................................................................ 89 Table 30. Three or More Servings of Vegetables on Average Day by Demographic Variables for Each Survey Year ............................................................................................................................................ 92 Table 31. Mammogram Within Past Two Years by Demographic Variables for Each Survey Year (Respondents 50 and Older) ................................................................................................................... 95 Table 32. Pap Smear Within Past Three Years by Demographic Variables for Each Survey Year (Respondents 18 to 65 Years Old and With a Cervix) ........................................................................... 98 Table 33. Prostate Cancer Screening Within Past Two Years by Demographic Variables for Each Survey Year (Respondents 40 and Older) ............................................................................. 101 Table 34. Blood Stool Test Within Past Year by Demographic Variables for Each Survey Year (Respondents 50 and Older) ................................................................................................................. 104 Table 35. Sigmoidoscopy Within Past Five Years by Demographic Variables for Each Survey Year (Respondents 50 and Older) ................................................................................................................. 105 Table 36. Colonoscopy Within Past Ten Years by Demographic Variables for Each Survey Year (Respondents 50 and Older) ................................................................................................................. 107 Table 37. Colorectal Cancer Screening in Recommended Time Frame by Demographic Variables for Each Survey Year (Respondents 50 and Older) ............................................................................. 108 Table 38. Current Smokers by Demographic Variables for Each Survey Year ................................................... 112 Table 39. Other Tobacco Use in Past 30 Days by Demographic Variables for 2012 .......................................... 114 Table 40. Current Smokers Quit Smoking for One Day or Longer in Past Year by Demographic Variables for Each Survey Year ............................................................................... 117 Table 41. Doctor, Nurse or Other Health Professional Advised Respondent to Quit Smoking in Past Year by Demographic Variables for Each Survey Year ........................................................... 119 Table 42. Smoking Not Allowed in Home by Demographic Variables for Each Survey Year ........................... 122 Table 43. Nonsmokers’ Exposure to Second-Hand Smoke in the Past Seven Days by Demographic Variables for Each Survey Year ............................................................................... 124 Table 44. Binge Drinking in Past Month by Demographic Variables for Each Survey Year .............................. 128 Table 45. Driver or Passenger in Vehicle When Driver Perhaps Had Too Much to Drink by Demographic Variables for Each Survey Year ........................................................................................................... 130 Table 46. Household Problem Associated with Alcohol in Past Year by Demographic Variables for Each Survey Year ........................................................................................................................... 132 Table 47. Always/Nearly Always Felt Sad, Blue or Depressed in Past 30 Days by Demographic Variables for Each Survey Year ........................................................................................................... 136 Table 48. Considered Suicide in the Past Year by Demographic Variables for Each Survey Year ..................... 138 Table 49. Seldom/Never Find Meaning and Purpose in Daily Life by Demographic Variables for Each Survey Year ................................................................................................................................. 140 Table 50. Afraid for Personal Safety by Demographic Variables for Each Survey Year .................................... 143

Milwaukee Community Health Survey Report—2012
Table Title Page Number Table 51. Pushed, Kicked, Slapped or Hit by Demographic Variables for Each Survey Year ............................ 145 Table 52. At Least One of the Personal Safety Issues by Demographic Variables for Each Survey Year .......... 147 Table 53. Did Not Receive Care Needed in Past 12 Months by Demographic Variables for 2012 (All Children) ........................................................................................................................ 150 Table 54. Nutrition and Exercise by Demographic Variables for 2012 (Children 5 to 17 Years Old) ................ 151 Table 55. Current Asthma by Demographic Variables for 2012 (All Children) .................................................. 152 Table 56. Child Always/Nearly Always Felt Unhappy, Sad or Depressed by Demographic Variables for 2012 (Children 8 to 17 Years Old) ................................................................................................. 153 Table 57. Child Seldom/Never Safe in Community or Neighborhood by Demographic Variables for 2012 (All Children) ........................................................................................................................ 154 Table 58. Experienced Bullying in Past 12 Months by Demographic Variables for 2012 (Children 8 to 17 Years Old)................................................................................................................ 155 Table 59. Alcohol or Drug Use as Community Health Issue by Demographic Variables for Each Survey Year ........................................................................................................................... 158 Table 60. Violence as Community Health Issue by Demographic Variables for Each Survey Year................... 160 Table 61. Chronic Diseases as Community Health Issue by Demographic Variables for Each Survey Year ........................................................................................................................... 162 Table 62. Teen Pregnancy as Community Health Issue by Demographic Variables for Each Survey Year ....... 164 Table 63. Infectious Diseases as Community Health Issue by Demographic Variables for Each Survey Year .. 166 Table 64. Mental Health or Depression as Community Health Issue by Demographic Variables for Each Survey Year ........................................................................................................................... 168 Table 65. Infant Mortality as Community Health Issue by Demographic Variables for Each Survey Year ....... 170 Table 66. Lead Poisoning as Community Health Issue by Demographic Variables for Each Survey Year ........ 172 Figure Title Page Number Figure 1. Rate Own Health for 2012 ...................................................................................................................... 11 Figure 2. Fair or Poor Health ................................................................................................................................. 15 Figure 3. Type of Health Care Coverage for 2012 ................................................................................................. 16 Figure 4. Health Care Coverage ............................................................................................................................. 23 Figure 5. Health Information and Services ............................................................................................................ 39 Figure 6. Routine Procedures ................................................................................................................................. 49 Figure 7. Vaccinations............................................................................................................................................ 53 Figure 8. Health Conditions in Past Three Years for 2012 .................................................................................... 54 Figure 9. Health Conditions in Past Three Years ................................................................................................... 73 Figure 10. Physical Activity/Week for 2012 .......................................................................................................... 80 Figure 11. Physical Well Being and Body Weight ................................................................................................ 86 Figure 12. Fruit and Vegetable Consumption on an Average Day ........................................................................ 93 Figure 13. Women's Health Tests .......................................................................................................................... 99 Figure 14. Prostate Cancer Screening in Past Two Years (Male Respondents 40 and Older) ............................. 102 Figure 15. Colorectal Cancer Screenings (Respondents 50 and Older) ............................................................... 109 Figure 16. Tobacco Use (Past 30 Days) ............................................................................................................... 115 Figure 17. Smoking Cessation in Past 12 Months (Current Smokers) ................................................................. 120 Figure 18. Smoking Policy Inside Home for 2012 ............................................................................................... 121 Figure 19. Exposure to Cigarette Smoke ............................................................................................................. 125 Figure 20. Alcohol Use in Past Month ................................................................................................................. 131 Figure 21. Household Problems in Past Year ..................................................................................................... 133 Figure 22. Felt Sad, Blue or Depressed in Past 30 Days for 2012 ....................................................................... 134 Figure 23. Mental Health Status ........................................................................................................................... 141 Figure 24. Personal Safety Issues in Past Year .................................................................................................... 148 Figure 25. Community Health Issues for 2012 .................................................................................................... 156 Figure 26. Community Health Issues ................................................................................................................... 173

Milwaukee Community Health Survey Report—2012 1
The purpose of this project is to provide Milwaukee with information for an assessment of the health status of residents. Primary objectives are to:
1. Gather specific data on behavioral and lifestyle habits of the adult population. Select information will also be collected about the respondent’s household.
2. Gather data on the prevalence of risk factors and disease conditions existing within the adult population. 3. Compare, where appropriate, health data of residents to previous health studies. 4. Compare, where appropriate and available, health data of residents to state and national measurements.
This report was commissioned by Aurora Health Care, Children’s Hospital of Wisconsin, Columbia St. Mary’s Health System, Froedtert Health and Wheaton Franciscan Healthcare in partnership with the Milwaukee Health Department and the Center for Urban Population Health. The purpose of this effort was to gather information on the health practices and health-related behavioral risks of residents. Respondents were scientifically selected so that the survey would be representative of all adults 18 years old and older. The sampling strategy was two-fold. 1) A random-digit-dial landline sample of telephone numbers which included listed and unlisted numbers. The respondent within each household was randomly selected by computer based on the number of adults in the household (n=744). 2) A cell phone-only sample where the person answering the phone was selected as the respondent (n=456). At least 8 attempts were made to contact a respondent in both samples. Screener questions verifying location were included. Data collection was conducted by Management Decisions Incorporated. A total of 1,200 telephone interviews were completed between June 20 and November 7, 2012. With a sample size of 1,200, we can be 95% sure that the sample percentage reported would not vary by more than ±3 percent from what would have been obtained by interviewing all persons 18 years old and older who lived in Milwaukee. The margin of error for smaller subgroups will be larger. For the landline sample, weighting was based on the number of adults in the household and the number of residential phone numbers, excluding fax and computer lines, to take into account the probability of selection. For the cell-phone only sample, it was assumed the respondent was the primary cell phone user. Combined, post-stratification was conducted by sex and age to reflect the 2010 census proportion of these characteristics in the area. Throughout the report, some totals may be more or less than 100% due to rounding and response category distribution. Percentages occasionally may differ by one or two percentage points from previous reports or the Appendix as a result of rounding, recoding variables or response category distribution. The survey was conducted by JKV Research, LLC. For technical information about survey methodology, contact Janet Kempf Vande Hey, M.S. at (920) 439-1399 or [email protected]. For further information about the survey, contact Mark M. Huber, M.S., Chair, Milwaukee Health Care Partnership Community Health Assessment Task Force at (414) 219-7282 or [email protected].
Purpose
Methodology
Milwaukee Community Health Survey Report—2012 2
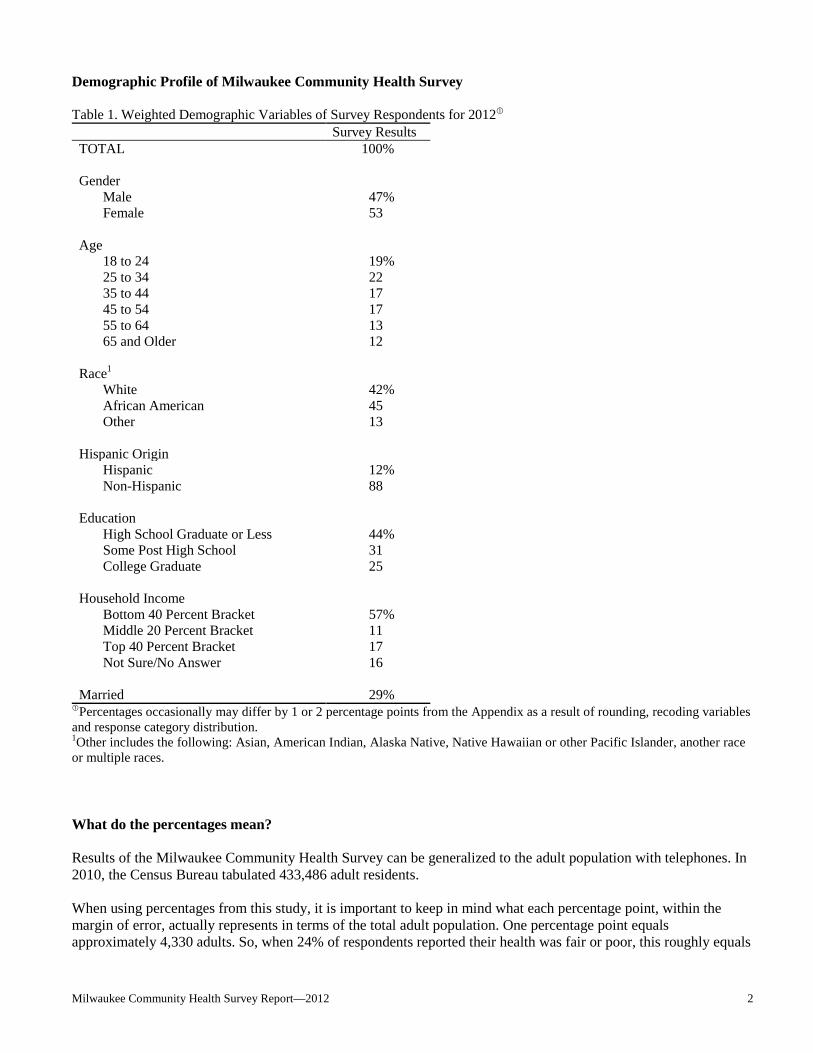
Demographic Profile of Milwaukee Community Health Survey Table 1. Weighted Demographic Variables of Survey Respondents for 2012
Survey Results TOTAL 100% Gender Male 47% Female 53 Age 18 to 24 19% 25 to 34 22 35 to 44 17 45 to 54 17 55 to 64 13 65 and Older 12 Race1 White 42% African American 45 Other 13 Hispanic Origin Hispanic 12% Non-Hispanic 88 Education High School Graduate or Less 44% Some Post High School 31 College Graduate 25 Household Income Bottom 40 Percent Bracket 57% Middle 20 Percent Bracket 11 Top 40 Percent Bracket 17 Not Sure/No Answer 16 Married 29%
Percentages occasionally may differ by 1 or 2 percentage points from the Appendix as a result of rounding, recoding variables and response category distribution. 1Other includes the following: Asian, American Indian, Alaska Native, Native Hawaiian or other Pacific Islander, another race or multiple races. What do the percentages mean? Results of the Milwaukee Community Health Survey can be generalized to the adult population with telephones. In 2010, the Census Bureau tabulated 433,486 adult residents. When using percentages from this study, it is important to keep in mind what each percentage point, within the margin of error, actually represents in terms of the total adult population. One percentage point equals approximately 4,330 adults. So, when 24% of respondents reported their health was fair or poor, this roughly equals

Milwaukee Community Health Survey Report—2012 3
103,920 residents ±12,990 individuals. Therefore, from 90,930 to 116,910 residents may have fair or poor health. Because the margin of error is ±3%, events or health risks that are small will include zero. The 2010 Census found 232,188 occupied housing units in Milwaukee. In certain questions of the Community Health Survey, respondents were asked to report information about their household. Using the household estimate, each percentage point for household-level data represents approximately 2,320 households. For example, 25% of survey respondents reported that someone in their household was not covered by health insurance at least some of the time in the past year. Thus, the estimated number of households with someone not covered by health insurance would be 58,000. Definitions Marital status: Married respondents were classified as those who reported married and those who reported a member of an unmarried couple. All others were classified as not married. Household income: It is difficult to compare household income data throughout the years as the real dollar value changes. Each year, the Census Bureau classifies household income into five equal brackets, rounded to the nearest dollar. It is not possible to exactly match the survey income categories to the Census Bureau brackets since the survey categories are in increments of $10,000 or more; however, it is the best way to track household income. This report looks at the Census Bureau’s bottom 40%, middle 20% and top 40% household income brackets each survey year. In 2003, the bottom 40% income bracket included survey categories less than $30,001, the middle 20% income bracket was $30,001 to $50,000 and the top 40% income bracket was at least $50,001. In 2006, 2009 and 2012, the bottom 40% income bracket included survey categories less than $40,001, the middle 20% income bracket was $40,001 to $60,000 and the top 40% income bracket was at least $60,001. The recommended amount of physical activity by the Centers for Disease Control is moderate activity for at least 30 minutes on five or more days of the week or vigorous activity for at least 20 minutes on three or more days of the week. Moderate physical activity includes walking briskly, bicycling, vacuuming, gardening or anything else that causes small increases in breathing or heart rate. Vigorous physical activity includes running, aerobics, heavy yard work, or anything else that causes large increases in breathing or heart rate. Insufficient physical activity includes participation in either activity, but not for the duration or the frequency recommended. Inactive respondents reported no moderate or vigorous physical activity in a typical week. Overweight was calculated using the Center for Disease Control’s Body Mass Index (BMI). Body Mass Index is calculated by using kilograms/meter2. A BMI of 25.0 to 29.9 is considered overweight and 30.0 or more is obese. Throughout the report, the category “overweight” includes both overweight and obese respondents. Current smoker is defined as someone who smoked at least some days in the past 30 days. The definition for binge drinking varies. Currently, the Centers for Disease Control (CDC) defines binge drinking as four or more drinks per occasion for females and five or more drinks per occasion for males to account for weight and metabolism differences. Previously, the CDC defined binge drinking as five or more drinks at one time, regardless of gender. In 2003 and 2012, the Milwaukee Health Survey defined binge drinking as four or more drinks per occasion for females and five or more drinks per occasion for males to account for weight and metabolism differences. All other study years were five or more drinks, regardless of gender.
Milwaukee Community Health Survey Report—2012 4
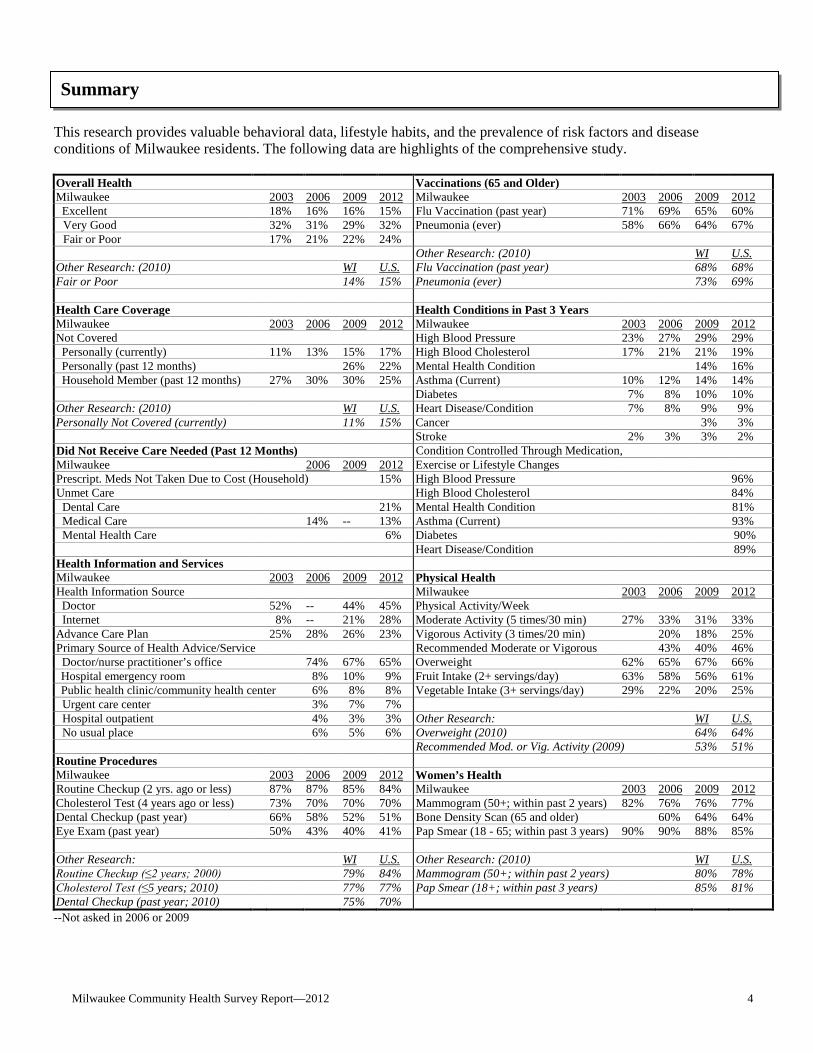
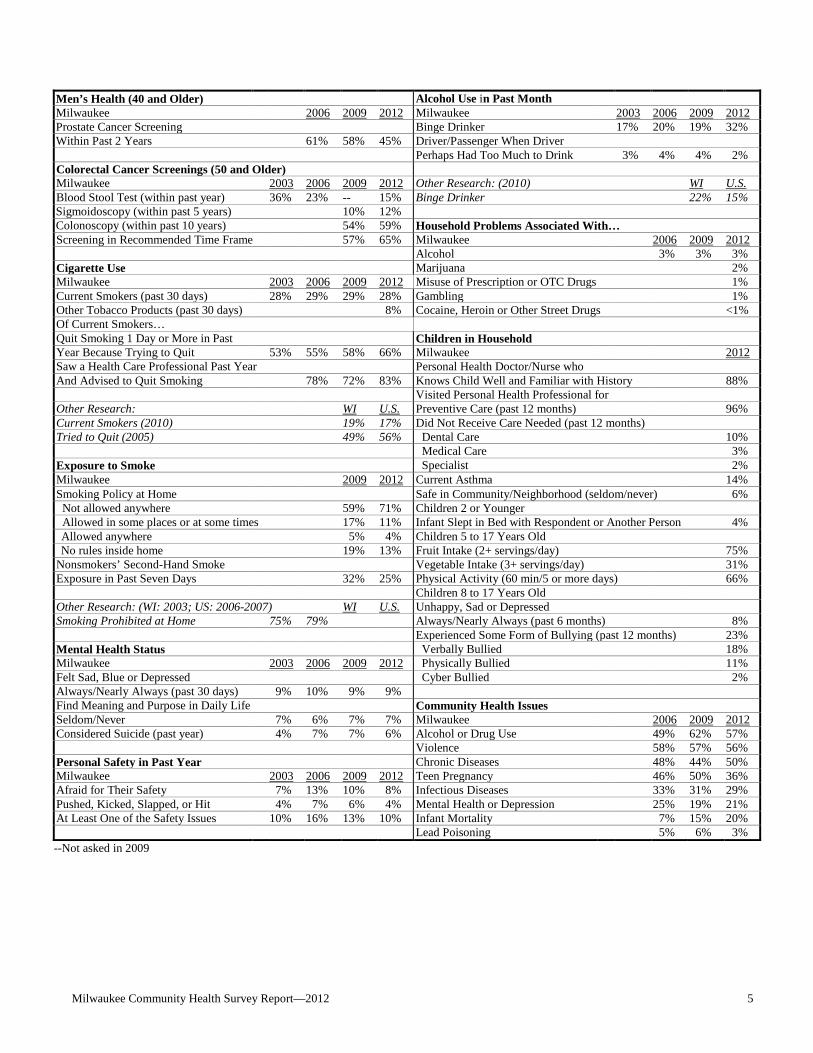
This research provides valuable behavioral data, lifestyle habits, and the prevalence of risk factors and disease conditions of Milwaukee residents. The following data are highlights of the comprehensive study.
Overall Health Vaccinations (65 and Older) Milwaukee 2003 2006 2009 2012 Milwaukee 2003 2006 2009 2012 Excellent 18% 16% 16% 15% Flu Vaccination (past year) 71% 69% 65% 60% Very Good 32% 31% 29% 32% Pneumonia (ever) 58% 66% 64% 67% Fair or Poor 17% 21% 22% 24% Other Research: (2010) WI U.S. Other Research: (2010) WI U.S. Flu Vaccination (past year) 68% 68% Fair or Poor 14% 15% Pneumonia (ever) 73% 69% Health Care Coverage Health Conditions in Past 3 Years Milwaukee 2003 2006 2009 2012 Milwaukee 2003 2006 2009 2012 Not Covered High Blood Pressure 23% 27% 29% 29% Personally (currently) 11% 13% 15% 17% High Blood Cholesterol 17% 21% 21% 19% Personally (past 12 months) 26% 22% Mental Health Condition 14% 16% Household Member (past 12 months) 27% 30% 30% 25% Asthma (Current) 10% 12% 14% 14% Diabetes 7% 8% 10% 10% Other Research: (2010) WI U.S. Heart Disease/Condition 7% 8% 9% 9% Personally Not Covered (currently) 11% 15% Cancer 3% 3% Stroke 2% 3% 3% 2% Did Not Receive Care Needed (Past 12 Months) Condition Controlled Through Medication, Milwaukee 2006 2009 2012 Exercise or Lifestyle Changes Prescript. Meds Not Taken Due to Cost (Household) 15% High Blood Pressure 96% Unmet Care High Blood Cholesterol 84% Dental Care 21% Mental Health Condition 81% Medical Care 14% -- 13% Asthma (Current) 93% Mental Health Care 6% Diabetes 90% Heart Disease/Condition 89% Health Information and Services Milwaukee 2003 2006 2009 2012 Physical Health Health Information Source Milwaukee 2003 2006 2009 2012 Doctor 52% -- 44% 45% Physical Activity/Week Internet 8% -- 21% 28% Moderate Activity (5 times/30 min) 27% 33% 31% 33% Advance Care Plan 25% 28% 26% 23% Vigorous Activity (3 times/20 min) 20% 18% 25% Primary Source of Health Advice/Service Recommended Moderate or Vigorous 43% 40% 46% Doctor/nurse practitioner’s office 74% 67% 65% Overweight 62% 65% 67% 66% Hospital emergency room 8% 10% 9% Fruit Intake (2+ servings/day) 63% 58% 56% 61% Public health clinic/community health center 6% 8% 8% Vegetable Intake (3+ servings/day) 29% 22% 20% 25% Urgent care center 3% 7% 7% Hospital outpatient 4% 3% 3% Other Research: WI U.S. No usual place 6% 5% 6% Overweight (2010) 64% 64% Recommended Mod. or Vig. Activity (2009) 53% 51% Routine Procedures Milwaukee 2003 2006 2009 2012 Women’s Health Routine Checkup (2 yrs. ago or less) 87% 87% 85% 84% Milwaukee 2003 2006 2009 2012 Cholesterol Test (4 years ago or less) 73% 70% 70% 70% Mammogram (50+; within past 2 years) 82% 76% 76% 77% Dental Checkup (past year) 66% 58% 52% 51% Bone Density Scan (65 and older) 60% 64% 64% Eye Exam (past year) 50% 43% 40% 41% Pap Smear (18 - 65; within past 3 years) 90% 90% 88% 85% Other Research: WI U.S. Other Research: (2010) WI U.S. Routine Checkup (≤2 years; 2000) 79% 84% Mammogram (50+; within past 2 years) 80% 78% Cholesterol Test (≤5 years; 2010) 77% 77% Pap Smear (18+; within past 3 years) 85% 81% Dental Checkup (past year; 2010) 75% 70% --Not asked in 2006 or 2009
Summary
Milwaukee Community Health Survey Report—2012 5
Men’s Health (40 and Older) Alcohol Use in Past Month Milwaukee 2006 2009 2012 Milwaukee 2003 2006 2009 2012 Prostate Cancer Screening Binge Drinker 17% 20% 19% 32% Within Past 2 Years 61% 58% 45% Driver/Passenger When Driver Perhaps Had Too Much to Drink 3% 4% 4% 2% Colorectal Cancer Screenings (50 and Older) Milwaukee 2003 2006 2009 2012 Other Research: (2010) WI U.S. Blood Stool Test (within past year) 36% 23% -- 15% Binge Drinker 22% 15% Sigmoidoscopy (within past 5 years) 10% 12% Colonoscopy (within past 10 years) 54% 59% Household Problems Associated With… Screening in Recommended Time Frame 57% 65% Milwaukee 2006 2009 2012 Alcohol 3% 3% 3% Cigarette Use Marijuana 2% Milwaukee 2003 2006 2009 2012 Misuse of Prescription or OTC Drugs 1% Current Smokers (past 30 days) 28% 29% 29% 28% Gambling 1% Other Tobacco Products (past 30 days) 8% Cocaine, Heroin or Other Street Drugs <1% Of Current Smokers… Quit Smoking 1 Day or More in Past Children in Household Year Because Trying to Quit 53% 55% 58% 66% Milwaukee 2012 Saw a Health Care Professional Past Year Personal Health Doctor/Nurse who And Advised to Quit Smoking 78% 72% 83% Knows Child Well and Familiar with History 88% Visited Personal Health Professional for Other Research: WI U.S. Preventive Care (past 12 months) 96% Current Smokers (2010) 19% 17% Did Not Receive Care Needed (past 12 months) Tried to Quit (2005) 49% 56% Dental Care 10% Medical Care 3% Exposure to Smoke Specialist 2% Milwaukee 2009 2012 Current Asthma 14% Smoking Policy at Home Safe in Community/Neighborhood (seldom/never) 6% Not allowed anywhere 59% 71% Children 2 or Younger Allowed in some places or at some times 17% 11% Infant Slept in Bed with Respondent or Another Person 4% Allowed anywhere 5% 4% Children 5 to 17 Years Old No rules inside home 19% 13% Fruit Intake (2+ servings/day) 75% Nonsmokers’ Second-Hand Smoke Vegetable Intake (3+ servings/day) 31% Exposure in Past Seven Days 32% 25% Physical Activity (60 min/5 or more days) 66% Children 8 to 17 Years Old Other Research: (WI: 2003; US: 2006-2007) WI U.S. Unhappy, Sad or Depressed Smoking Prohibited at Home 75% 79% Always/Nearly Always (past 6 months) 8% Experienced Some Form of Bullying (past 12 months) 23% Mental Health Status Verbally Bullied 18% Milwaukee 2003 2006 2009 2012 Physically Bullied 11% Felt Sad, Blue or Depressed Cyber Bullied 2% Always/Nearly Always (past 30 days) 9% 10% 9% 9% Find Meaning and Purpose in Daily Life Community Health Issues Seldom/Never 7% 6% 7% 7% Milwaukee 2006 2009 2012 Considered Suicide (past year) 4% 7% 7% 6% Alcohol or Drug Use 49% 62% 57% Violence 58% 57% 56% Personal Safety in Past Year Chronic Diseases 48% 44% 50% Milwaukee 2003 2006 2009 2012 Teen Pregnancy 46% 50% 36% Afraid for Their Safety 7% 13% 10% 8% Infectious Diseases 33% 31% 29% Pushed, Kicked, Slapped, or Hit 4% 7% 6% 4% Mental Health or Depression 25% 19% 21% At Least One of the Safety Issues 10% 16% 13% 10% Infant Mortality 7% 15% 20% Lead Poisoning 5% 6% 3% --Not asked in 2009

Milwaukee Community Health Survey Report—2012 6
Overall Health and Health Care Key Findings In 2012, 47% of respondents reported their health as excellent or very good; 24% reported fair or poor. Respondents who were female, 45 to 54 years old, African American, with a high school education or less, in the bottom 40 percent household income bracket, who were unmarried, overweight, inactive or smokers were more likely to report fair or poor conditions. From 2003 to 2012, there was a statistical increase in the overall percent of respondents who reported their health as fair or poor. In 2012, 17% of respondents reported they were not currently covered by health care insurance; respondents who were male, 18 to 24 years old, non-white, with a high school education or less, in the bottom 40 percent household income bracket or unmarried respondents were more likely to report this. Twenty-two percent of respondents reported they personally did not have health care coverage at least part of the time in the past 12 months; respondents who were male, 18 to 24 years old, non-white, Hispanic, with a high school education or less, in the bottom 40 percent household income bracket or unmarried respondents were more likely to report this. Twenty-five percent of respondents reported someone in their household was not covered at least part of the time in the past 12 months; respondents who were in the bottom 40 percent household income bracket or unmarried were more likely to report this. From 2003 to 2012, the overall percent statistically increased for respondents 18 and older as well as for respondents 18 to 64 years old who reported no current personal health care insurance. From 2009 to 2012, the overall percent statistically remained the same for respondents who reported no personal health care insurance at least part of the time in the past 12 months. From 2003 to 2012, the overall percent statistically remained the same for respondents who reported someone in the household was not covered at least part of the time in the past 12 months. In 2012, 15% of respondents reported that someone in their household had not taken their prescribed medication due to prescription costs in the past 12 months; respondents in the bottom 60 percent household income bracket were more likely to report this. Thirteen percent of respondents reported that they did not get the medical care they needed in the last 12 months; respondents who were 18 to 24 years old, 45 to 64 years old, African American, in the bottom 40 percent household income bracket or unmarried were more likely to report this. Twenty-one percent of respondents reported that they did not get the dental care they needed in the last 12 months; respondents who were African American, in the bottom 40 percent household income bracket or unmarried were more likely to report this. Six percent of respondents reported that they did not get the mental health care they needed in the last 12 months; respondents who were 45 to 54 years old, non-white and non-African American, Hispanic or in the bottom 40 percent household income bracket were more likely to report this. From 2006 to 2012, there was no statistical change in the overall percent of respondents reporting there was a time in the last 12 months they did not receive the medical care needed. In 2012, 45% of respondents reported they receive most of their health information from a doctor while 28% reported the internet. Respondents who were female, 65 and older or in the bottom 40 percent household income bracket were more likely to report they receive most of their health information from a doctor. Respondents who were male, 25 to 34 years old, non-white and non-African American, with a college education or in the middle 20 percent household income bracket were more likely to report they receive most of their health information from the internet. Sixty-five percent of respondents reported their primary place for health services was from a doctor’s or nurse practitioner’s office; respondents who were female, 65 and older, white, non-Hispanic, with a college education, in the top 60 percent household income bracket or married respondents were more likely to report this. Twenty-three percent of respondents had an advance care plan; respondents who were female, 65 and older, white, non-Hispanic, with a college education or in the top 40 percent household income bracket were more likely to report an advance care plan. From 2003 to 2012, there was a statistical decrease in the overall percent of respondents reporting they receive most of their health information from a doctor while there was a statistical increase in the overall percent of respondents reporting the internet as their primary source. From 2006 to 2012, there was a statistical decrease in the overall percent of respondents reporting their primary place for health services was from a doctor’s or nurse practitioner’s office. From 2003 to 2012, there was no statistical change in the overall percent of respondents having an advance care plan.

Milwaukee Community Health Survey Report—2012 7
In 2012, 84% of respondents reported a routine medical checkup two years ago or less while 70% reported a cholesterol test four years ago or less. Fifty-one percent of respondents reported a visit to the dentist in the past year while 41% reported an eye exam in the past year. Respondents who were female, 65 and older, African American or non-Hispanic were more likely to report a routine checkup two years ago or less. Respondents who were 65 and older, white, African American, non-Hispanic, with a college education, in the top 60 percent household income bracket or married respondents were more likely to report a cholesterol test four years ago or less. Respondents 35 to 54 years old, with a college education, in the top 40 percent household income bracket or married respondents were more likely to report a dental checkup in the past year. Respondents 65 and older were more likely to report an eye exam in the past year. From 2003 to 2012, there was a statistical decrease in the overall percent of respondents reporting a routine checkup two years ago or less, a dental checkup in the past year or an eye exam in the past year. From 2003 to 2012, there was no statistical change in the overall percent of respondents reporting a cholesterol test four years ago or less. In 2012, 35% of respondents had a flu vaccination in the past year. Respondents who were female, 65 and older, Hispanic, with a high school education or less or in the bottom 40 percent household income bracket were more likely to report a flu vaccination. Sixty-seven percent of respondents 65 and older had a pneumonia vaccination in their lifetime. From 2003 to 2012, there was no statistical change in the overall percent of respondents 18 and older who reported a flu vaccination in the past 12 months. From 2003 to 2012, there was a statistical decrease in the overall percent of respondents 65 and older who reported a flu vaccination in the past 12 months. From 2003 to 2012, there was no statistical change in the overall percent of respondents 65 and older who had a pneumonia vaccination. Health Risk Factors Key Findings In 2012, out of eight health conditions listed, the two most often mentioned in the past three years were high blood pressure or high blood cholesterol (29% and 19%, respectively). Respondents who were female, 65 and older, African American, non-Hispanic, with a high school education or less, in the bottom 40 percent household income bracket, who were overweight or inactive were more likely to report high blood pressure. Respondents who were 65 and older, white, non-Hispanic, with a high school education or less, who were overweight or inactive were more likely to report high blood cholesterol. Respondents who were 65 and older, non-Hispanic, in the bottom 40 percent household income bracket, overweight or inactive were more likely to report heart disease/condition. Respondents who were female, 45 to 54 years old, with some post high school education or in the bottom 40 percent household income bracket were more likely to report a mental health condition. Respondents who were 65 and older, African American, with a high school education or less, in the bottom 40 percent household income bracket, who were overweight or inactive were more likely to report diabetes. Respondents who were female, 45 to 54 years old, non-white, with some post high school education or less, in the bottom 40 percent household income bracket or unmarried respondents were more likely to report current asthma. From 2003 to 2012, there was a statistical increase in the overall percent of respondents who reported high blood pressure, diabetes or current asthma. From 2003 to 2012, there was no statistical change in the overall percent of respondents who reported high blood cholesterol, heart disease/condition or stroke. From 2009 to 2012, there was no statistical change in the overall percent of respondents who reported a mental health condition or cancer. In 2012, 9% of respondents reported they always or nearly always felt sad, blue or depressed in the past 30 days; respondents who were 45 to 54 years old, non-white and non-African American, Hispanic, with a high school education or less, in the bottom 40 percent household income bracket or unmarried respondents were more likely to report this. Six percent of respondents felt so overwhelmed they considered suicide in the past year; respondents who were 18 to 24 years old, non-white and non-African American, in the bottom 40 percent household income bracket or unmarried were more likely to report this. Seven percent of respondents reported they seldom or never find meaning and purpose in daily life; respondents 65 and older, with a high school education or less, in the bottom 40 percent household income bracket or unmarried respondents were more likely to report this. From 2003 to 2012, there was no statistical change in the overall percent of respondents who reported they always or nearly always felt
Milwaukee Community Health Survey Report—2012 8
sad, blue or depressed or they seldom/never find meaning and purpose in daily life. From 2003 to 2012, there was a statistical increase in the overall percent of respondents who reported they considered suicide. Behavioral Risk Factors Key Findings In 2012, 33% of respondents did moderate physical activity five times a week for 30 minutes while 25% did vigorous activity three times a week for 20 minutes. Combined, 46% met the recommended amount of physical activity; respondents who were 18 to 34 years old, non-white and non-African American, Hispanic, with at least some post high school education or unmarried respondents were more likely to report this. Sixty-six percent of respondents were classified as overweight. Respondents who were 45 to 54 years old, African American or Hispanic were more likely to be classified as overweight. From 2003 to 2012, there was a statistical increase in the overall percent of respondents who reported moderate physical activity five times a week for at least 30 minutes. From 2006 to 2012, there was a statistical increase in the overall percent of respondents who reported vigorous physical activity three times a week for at least 20 minutes. From 2006 to 2012, there was no statistical change in the overall percent of respondents who met the recommended amount of physical activity. From 2003 to 2012, there was a statistical increase in the overall percent of respondents being overweight. In 2012, 61% of respondents reported two or more servings of fruit while 25% reported three or more servings of vegetables on an average day. Respondents who were female, non-African American, Hispanic or who met the recommended amount of physical activity were more likely to report at least two servings of fruit. Respondents who were female, 35 to 44 years old, non-Hispanic, with a college education, in the top 40 percent household income bracket or overweight were more likely to report at least three servings of vegetables on an average day. From 2003 to 2012, there was no statistical change in the overall percent of respondents who reported at least two servings of fruit on an average day. From 2003 to 2012, there was a statistical decrease in the overall percent of respondents who reported at least three servings of vegetables on an average day. In 2012, 77% of female respondents 50 and older reported a mammogram within the past two years. Sixty-four percent of female respondents 65 and older had a bone density scan. Eighty-five percent of female respondents 18 to 65 years old reported a pap smear within the past three years; respondents who were 35 to 44 years old, African American, non-Hispanic or in the top 40 percent household income bracket were more likely to report this. From 2003 to 2012, there was no statistical change in the overall percent of respondents 50 and older who reported having a mammogram within the past two years. From 2006 to 2012, there was no statistical change in the overall percent of respondents 65 and older who reported a bone density scan. From 2003 to 2012, there was a statistical decrease in the overall percent of respondents 18 to 65 years old who reported having a pap smear within the past three years. In 2012, 45% of male respondents 40 and older had a prostate cancer screening within the past two years with either a digital rectal exam (DRE) or a prostate-specific antigen (PSA) test. Respondents who were 50 and older or African American were more likely to report this. From 2006 to 2012, there was a statistical decrease in the overall percent of male respondents 40 and older who reported a prostate cancer screening within the past two years. In 2012, 15% of respondents 50 and older reported a blood stool test within the past year. Twelve percent of respondents 50 and older reported a sigmoidoscopy within the past five years while 59% reported a colonoscopy within the past ten years. This results in 65% of respondents meeting current colorectal cancer screening recommendations; African American respondents were more likely to report this. From 2003 to 2012, there was a statistical decrease in the overall percent of respondents who reported a blood stool test within the past year. From 2009 to 2012, there was no statistical change in the overall percent of respondents who reported a sigmoidoscopy within the past five years or a colonoscopy within the past ten years. From 2009 to 2012, there was a statistical increase in the overall percent of respondents who reported at least one of these tests in the recommended time frame.
Milwaukee Community Health Survey Report—2012 9
In 2012, 28% of respondents were current smokers; respondents who were male, 25 to 34 years old, African American, non-Hispanic, with a high school education or less, in the bottom 40 percent household income bracket or unmarried respondents were more likely to be a smoker. Eight percent of respondents reported other tobacco use such as cigars, pipes, chewing tobacco or snuff in the past 30 days; respondents who were male, 25 to 44 years old, white, with a college education or in the top 40 percent household income bracket were more likely to report this. In the past 12 months, 66% of current smokers quit smoking for one day or longer because they were trying to quit. Eighty-three percent of current smokers who saw a health professional in the past year reported the professional advised them to quit smoking; respondents who were 35 to 54 years old or married were more likely to report this. From 2003 to 2012, there was no statistical change in the overall percent of respondents who were current smokers. From 2003 to 2012, there was a statistical increase in the overall percent of current smokers who reported they quit smoking for one day or longer in the past 12 months because they were trying to quit. From 2006 to 2012, there was no statistical change in the overall percent of current smokers who reported their health professional advised them to quit smoking. In 2012, 71% of respondents reported smoking is not allowed anywhere inside the home. Respondents who were in the top 40 percent household income bracket, married, nonsmokers or in households with children were more likely to report smoking is not allowed anywhere inside the home. Twenty-five percent of nonsmoking respondents reported they were exposed to second-hand smoke in the past seven days; respondents who were male, 18 to 24 years old, non-white, Hispanic, with some post high school education or less, in the bottom 40 percent household income bracket or unmarried respondents were more likely to report this. From 2009 to 2012, there was a statistical increase in the overall percent of respondents who reported smoking is not allowed anywhere inside the home. From 2009 to 2012, there was a statistical decrease in the overall percent of respondents who reported they were exposed to second-hand smoke in the past seven days. In 2012, 32% of respondents were binge drinkers in the past month. Respondents who were male, 25 to 34 years old, white, with a college education or in the top 40 percent household income bracket were more likely to have binged at least once in the past month. Two percent reported they had been a driver or a passenger in the past month when the driver perhaps had too much to drink. From 2003 to 2012, there was a statistical increase in the overall percent of respondents who reported binge drinking in the past month. From 2003 to 2012, there was no statistical change in the overall percent of respondents who reported in the past month they were a driver or passenger when the driver perhaps had too much to drink. In 2012, 3% of respondents reported someone in their household experienced a legal, social, personal or physical problem in the past year in connection with drinking. Two percent of respondents reported someone in their household experienced a problem in connection with marijuana use. One percent of respondents each reported misuse of prescription drugs/over-the-counter drugs or a household problem with gambling. Less than one percent reported someone in their household experienced a problem in connection with cocaine/heroin/other street drugs. From 2006 to 2012, there was no statistical change in the overall percent of respondents reporting they, or someone in their household, experienced some kind of problem, such as legal, social, personal or physical, in connection with drinking in the past year. In 2012, 8% of respondents reported someone made them afraid for their personal safety in the past year; respondents who were non-Hispanic or with at least some post high school education were more likely to report this. Four percent of respondents reported they had been pushed, kicked, slapped or hit in the past year; respondents who were male or unmarried were more likely to report this. A total of 10% reported at least one of these two situations; respondents who were non-Hispanic or with some post high school education were more likely to report this. From 2003 to 2012, there was no statistical change in the overall percent of respondents reporting they were afraid for their personal safety or they were pushed, kicked, slapped or hit. From 2003 to 2012, there was no statistical change in the overall percent of respondents reporting at least one of the two personal safety issues.

Milwaukee Community Health Survey Report—2012 10
Children in Household In 2012, a random child was selected for the respondent to talk about the child’s health issues. Eighty-eight percent of respondents reported they have one or more persons they think of as their child’s personal doctor or nurse, with 96% reporting their child visited their personal doctor or nurse for preventive care during the past 12 months. Ten percent of respondents reported there was a time in the last 12 months their child did not receive the dental care needed. Three percent of respondents reported their child did not receive the medical care needed while 2% reported their child did not visit a specialist they needed to see. Seventy-five percent of respondents reported their 5 to 17 year old child ate two or more servings of fruit on an average day while 31% reported three or more servings of vegetables. Sixty-six percent of respondents reported their 5 to 17 year old child was physically active five times a week for 60 minutes. Fourteen percent of respondents reported their child currently had asthma, with 46% of them having had an asthma attack in the past year. Four percent of respondents with a child two years old or younger reported their infant child slept in a bed with them or with another person. Eight percent of respondents reported their 8 to 17 year old child always or nearly always felt unhappy, sad or depressed in the past six months. Six percent of respondents reported their child was seldom or never safe in their community or neighborhood. Twenty-three percent reported their 8 to 17 year old child experienced some form of bullying in the past 12 months. Eighteen percent reported verbal bullying, 11% reported physical bullying and 2% reported cyber bullying. Community Health Issues In 2012, respondents were asked to pick the top three health issues in the area out of eight listed. The most often cited were alcohol or drug use (57%), violence (56%) and chronic diseases (50%). Respondents who were non-white and non-African American, in the top 40 percent household income bracket or married were more likely to report alcohol or drug use as a top community health issue. Respondents with a college education were more likely to report violence. Respondents who were white, with at least some post high school education or in the top 40 percent household income bracket were more likely to report chronic diseases. Respondents who were 18 to 24 years old, non-white and non-African American, Hispanic, with some post high school education or less, in the bottom 40 percent household income bracket or unmarried respondents were more likely to report teen pregnancy. Respondents who were 18 to 24 years old, African American, with some post high school education, in the bottom 40 percent household income bracket or unmarried respondents were more likely to report infectious diseases as a top community health issue. Respondents who were 35 to 44 years old or non-Hispanic were more likely to report mental health or depression. Respondents who were female, white, with at least some post high school education, in the middle 20 percent household income bracket or married respondents were more likely to report infant mortality. Respondents who were female, Hispanic, with a high school education or less or with a college education were more likely to report lead poisoning as a top community health issue. From 2006 to 2012, there was a statistical increase in the overall percent of respondents who reported alcohol/drug use or infant mortality as a top community health issue. From 2006 to 2012, there was a statistical decrease in the overall percent of respondents who reported teen pregnancy, infectious diseases, mental health/depression or lead poisoning. From 2006 to 2012, there was no statistical change in the overall percent of respondents who reported violence or chronic diseases as a top community health issue.

Milwaukee Community Health Survey Report—2012 11
Rating Their Own Health (Figures 1 & 2; Table 2) KEY FINDINGS: In 2012, 47% of respondents reported their health as excellent or very good; 24% reported fair
or poor. Respondents who were female, 45 to 54 years old, African American, with a high school education or less, in the bottom 40 percent household income bracket, who were unmarried, overweight, inactive or smokers were more likely to report fair or poor conditions.
From 2003 to 2012, there was a statistical increase in the overall percent of respondents who reported their health as fair or poor.
In 2010, 57% of Wisconsin respondents reported their health as excellent or very good while 14% reported fair or poor. Fifty-five percent of U.S. respondents reported their health as excellent or very good while 15% reported fair or poor (2010 Behavioral Risk Factor Surveillance). 2012 Findings • Forty-seven percent of respondents said their own health, generally speaking, was either excellent (15%) or
very good (32%). A total of 24% reported their health was fair or poor.
Figure 1. Rate Own Health for 2012
Very Good32%
Good28% Fair
18%
Excellent15%
Poor6%
Not Sure<1%
• Female respondents were more likely to report their health was fair or poor (27%) compared to male
respondents (21%).
• Forty-one percent of respondents 45 to 54 years old reported their health was fair or poor compared to 17% of those 18 to 24 years old or 14% of respondents 25 to 34 years old.
• Thirty-one percent of African American respondents reported their health was fair or poor compared to 24% of
those who were non-white and non-African American or 16% of white respondents.
• Thirty-one percent of respondents with a high school education or less reported their health was fair or poor compared to 24% of those with some post high school education or 11% of respondents with a college education.
Key Findings
Milwaukee Community Health Survey Report—2012 12
• Thirty-four percent of respondents in the bottom 40 percent household income bracket reported their health was fair or poor compared to 14% of those in the middle 20 percent income bracket or 5% of respondents in the top 40 percent household income bracket.
• Unmarried respondents were more likely to report their health was fair or poor compared to married
respondents (27% and 16%, respectively).
• Overweight respondents were more likely to report their health was fair or poor (26%) compared to respondents who were not overweight (19%).
• Thirty-nine percent of inactive respondents reported their health was fair or poor compared to 27% of those
who did an insufficient amount of physical activity or 17% of respondents who met the recommended amount of physical activity.
• Smokers were more likely to report their health was fair or poor (32%) compared to nonsmokers (21%). Year Comparisons • From 2003 to 2012, there was a statistical increase in the overall percent of respondents who reported fair or
poor health. • In 2006, 2009 and 2012, female respondents were more likely to report fair or poor health. In 2003, gender was
not a significant variable. From 2003 to 2012, there was a noted increase in the percent of respondents across gender reporting fair or poor health.
• In 2003, respondents 65 and older were more likely to report fair or poor health. In 2006, respondents 55 to 64
years old were more likely to report fair or poor health. In 2009, respondents 45 and older were more likely to report fair or poor health. In 2012, respondents 45 to 54 years old were more likely to report fair or poor health. From 2003 to 2012, there was a noted increase in the percent of respondents 45 to 64 years old reporting fair or poor health.
• In 2003, respondents who were non-white and non-African American were more likely to report fair or poor
health. In 2006 and 2012, African American respondents were more likely to report fair or poor health. In 2009, race was not a significant variable. From 2003 to 2012, there was a noted increase in the percent of African American respondents reporting fair or poor health.
• In 2003, Hispanic respondents were more likely to report fair or poor health. In all other study years, Hispanic
origin was not a significant variable. From 2003 to 2012, there was a noted increase in the percent of non-Hispanic respondents reporting fair or poor health.
• In all study years, respondents with a high school education or less were more likely to report fair or poor
health, with a noted increase in 2012. From 2003 to 2012, there was a noted increase in the percent of respondents with a college education reporting fair or poor health.
• In all study years, respondents in the bottom 40 percent household income bracket were more likely to report
fair or poor health, with a noted increase in 2012. • In all study years, unmarried respondents were more likely to report fair or poor health. From 2003 to 2012,
there was a noted increase in the percent of respondents across marital status reporting fair or poor health.

Milwaukee Community Health Survey Report—2012 13
• In all study years, overweight respondents were more likely to report fair or poor health. From 2003 to 2012, there was a noted increase in the percent of respondents across overweight status reporting fair or poor health.
• In 2006, 2009 and 2012, inactive respondents were more likely to report fair or poor health. From 2006 to 2012,
there was a noted increase in the percent of respondents who did an insufficient amount of physical activity reporting fair or poor health.
• In 2006, 2009 and 2012, smokers were more likely to report fair or poor health. In 2003, smoking status was not
a significant variable. From 2003 to 2012, there was a noted increase in the percent of smokers reporting fair or poor health.

Milwaukee Community Health Survey Report—2012 14
Table 2. Fair or Poor Health by Demographic Variables for Each Survey Year,
2003 2006 2009 2012 TOTALa 17% 21% 22% 24% Gender2,3,4 Malea 15 19 18 21 Femalea 19 23 25 27 Age1,2,3,4 18 to 24 24 16 10 17 25 to 34 9 15 11 14 35 to 44 12 18 19 18 45 to 54a 16 25 34 41 55 to 64a 20 32 33 35 65 and Older 29 27 34 24 Race1,2,4 White 15 19 18 16 African Americana 20 24 24 31 Other 30 16 22 24 Hispanic Origin1 Hispanic 33 21 25 22 Non-Hispanica 16 21 21 24 Education1,2,3,4 High School or Lessa 23 27 29 31 Some Post High School 19 21 17 24
College Graduatea 5 9 11 11 Household Income1,2,3,4 Bottom 40 Percent Bracketa 24 28 26 34 Middle 20 Percent Bracket 15 11 15 14 Top 40 Percent Bracket 6 6 6 5 Marital Status1,2,3,4 Marrieda 9 15 16 16 Not Marrieda 22 24 24 27 Overweight Status1,2,3,4 Not Overweighta 11 16 16 19 Overweighta 22 23 24 26 Physical Activity2,3,4 Inactive -- 34 37 39 Insufficientb -- 20 20 27 Recommended -- 16 15 17 Smoking Status2,3,4 Nonsmoker 18 18 18 21 Smokera 16 29 29 32
Percentages occasionally may differ by 1 or 2 percentage points from previous reports or the Appendix as a result of rounding, recoding variables and response category distribution. Physical activity was defined differently in 2003. 1demographic difference at p≤0.05 in 2003; 2demographic difference at p≤0.05 in 2006 3demographic difference at p≤0.05 in 2009; 4demographic difference at p≤0.05 in 2012 ayear difference at p≤0.05 from 2003 to 2012 byear difference at p≤0.05 from 2006 to 2012
Milwaukee Community Health Survey Report—2012 15
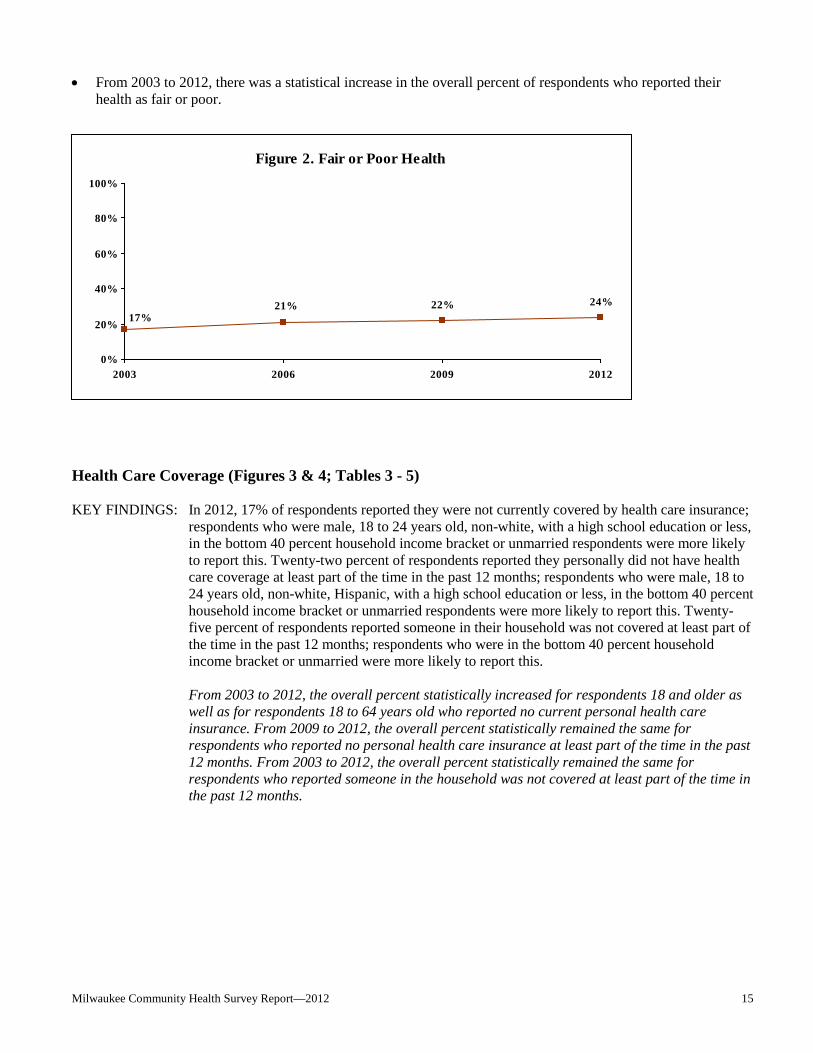
• From 2003 to 2012, there was a statistical increase in the overall percent of respondents who reported their health as fair or poor.
Health Care Coverage (Figures 3 & 4; Tables 3 - 5) KEY FINDINGS: In 2012, 17% of respondents reported they were not currently covered by health care insurance;
respondents who were male, 18 to 24 years old, non-white, with a high school education or less, in the bottom 40 percent household income bracket or unmarried respondents were more likely to report this. Twenty-two percent of respondents reported they personally did not have health care coverage at least part of the time in the past 12 months; respondents who were male, 18 to 24 years old, non-white, Hispanic, with a high school education or less, in the bottom 40 percent household income bracket or unmarried respondents were more likely to report this. Twenty-five percent of respondents reported someone in their household was not covered at least part of the time in the past 12 months; respondents who were in the bottom 40 percent household income bracket or unmarried were more likely to report this.
From 2003 to 2012, the overall percent statistically increased for respondents 18 and older as well as for respondents 18 to 64 years old who reported no current personal health care insurance. From 2009 to 2012, the overall percent statistically remained the same for respondents who reported no personal health care insurance at least part of the time in the past 12 months. From 2003 to 2012, the overall percent statistically remained the same for respondents who reported someone in the household was not covered at least part of the time in the past 12 months.
Figure 2. Fair or Poor Health
22% 24%17%
21%
0%
20%
40%
60%
80%
100%
2003 2006 2009 2012
Milwaukee Community Health Survey Report—2012 16
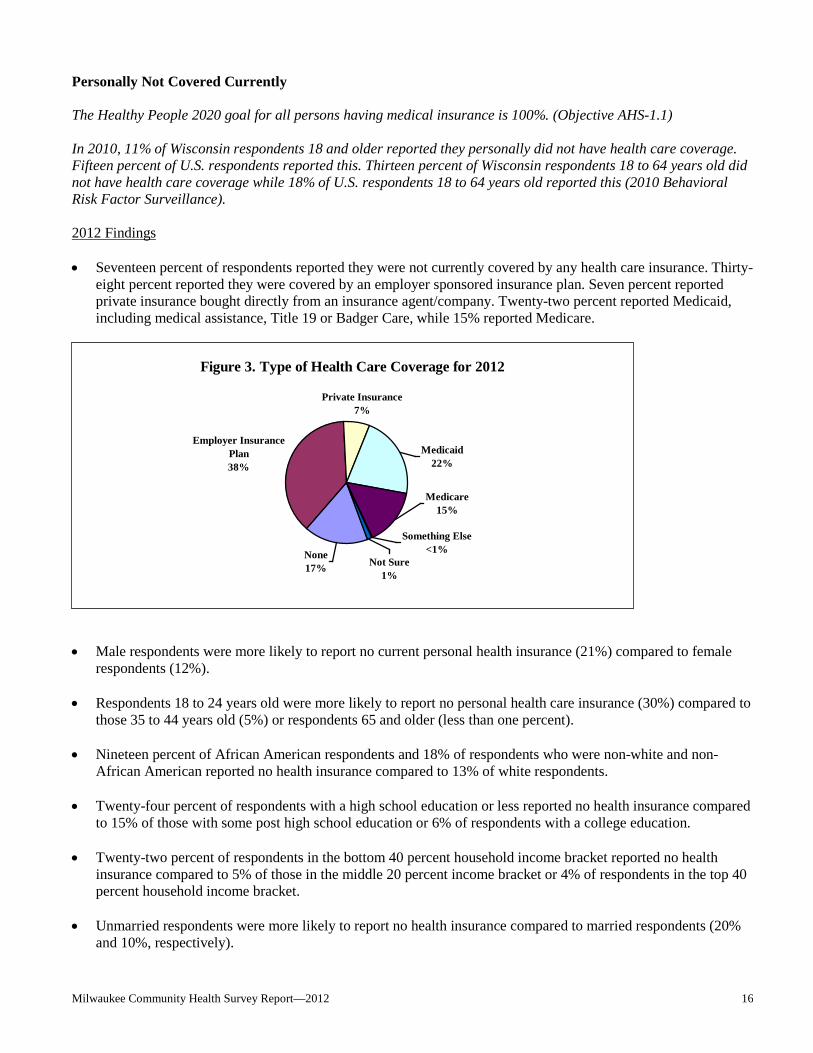
Personally Not Covered Currently The Healthy People 2020 goal for all persons having medical insurance is 100%. (Objective AHS-1.1) In 2010, 11% of Wisconsin respondents 18 and older reported they personally did not have health care coverage. Fifteen percent of U.S. respondents reported this. Thirteen percent of Wisconsin respondents 18 to 64 years old did not have health care coverage while 18% of U.S. respondents 18 to 64 years old reported this (2010 Behavioral Risk Factor Surveillance). 2012 Findings • Seventeen percent of respondents reported they were not currently covered by any health care insurance. Thirty-
eight percent reported they were covered by an employer sponsored insurance plan. Seven percent reported private insurance bought directly from an insurance agent/company. Twenty-two percent reported Medicaid, including medical assistance, Title 19 or Badger Care, while 15% reported Medicare.
• Male respondents were more likely to report no current personal health insurance (21%) compared to female
respondents (12%).
• Respondents 18 to 24 years old were more likely to report no personal health care insurance (30%) compared to those 35 to 44 years old (5%) or respondents 65 and older (less than one percent).
• Nineteen percent of African American respondents and 18% of respondents who were non-white and non-African American reported no health insurance compared to 13% of white respondents.
• Twenty-four percent of respondents with a high school education or less reported no health insurance compared
to 15% of those with some post high school education or 6% of respondents with a college education.
• Twenty-two percent of respondents in the bottom 40 percent household income bracket reported no health insurance compared to 5% of those in the middle 20 percent income bracket or 4% of respondents in the top 40 percent household income bracket.
• Unmarried respondents were more likely to report no health insurance compared to married respondents (20%
and 10%, respectively).
Figure 3. Type of Health Care Coverage for 2012
Employer Insurance Plan38%
Private Insurance7%
Not Sure1%
Something Else<1%
Medicare15%
Medicaid22%
None17%

Milwaukee Community Health Survey Report—2012 17
Year Comparisons • From 2003 to 2012, the overall percent statistically increased for respondents 18 and older as well as for
respondents 18 to 64 years old who reported no current personal health care insurance. • In all study years, male respondents were more likely to report no health insurance. From 2003 to 2012, there
was a noted increase in the percent of respondents across gender reporting no health insurance.
• In 2003, respondents 18 to 24 years old or 45 to 54 years old were more likely to report no health insurance. In 2006, 2009 and 2012, respondents 18 to 24 years old were more likely to report no health insurance. From 2003 to 2012, there was a noted increase in the percent of respondents 18 to 34 years old reporting no health insurance.
• In 2006 and 2009, respondents who were non-white and non-African American were more likely to report no
health insurance. In 2012, respondents who were non-white were more likely to report no health insurance, with a noted increase since 2003. In 2003, race was not a significant variable.
• In 2006 and 2009, Hispanic respondents were more likely to report no health insurance. In all other study years,
Hispanic origin was not a significant variable. From 2003 to 2012, there was a noted increase in the percent of respondents across Hispanic origin reporting no health insurance.
• In all study years, respondents with a high school education or less were more likely to report no health
insurance. From 2003 to 2012, there was a noted increase in the percent of respondents with some post high school education or less reporting no health insurance.
• In all study years, respondents in the bottom 40 percent household income bracket were more likely to report no
health insurance. • In all study years, unmarried respondents were more likely to report no health insurance, with a noted increase
in 2012.
Milwaukee Community Health Survey Report—2012 18
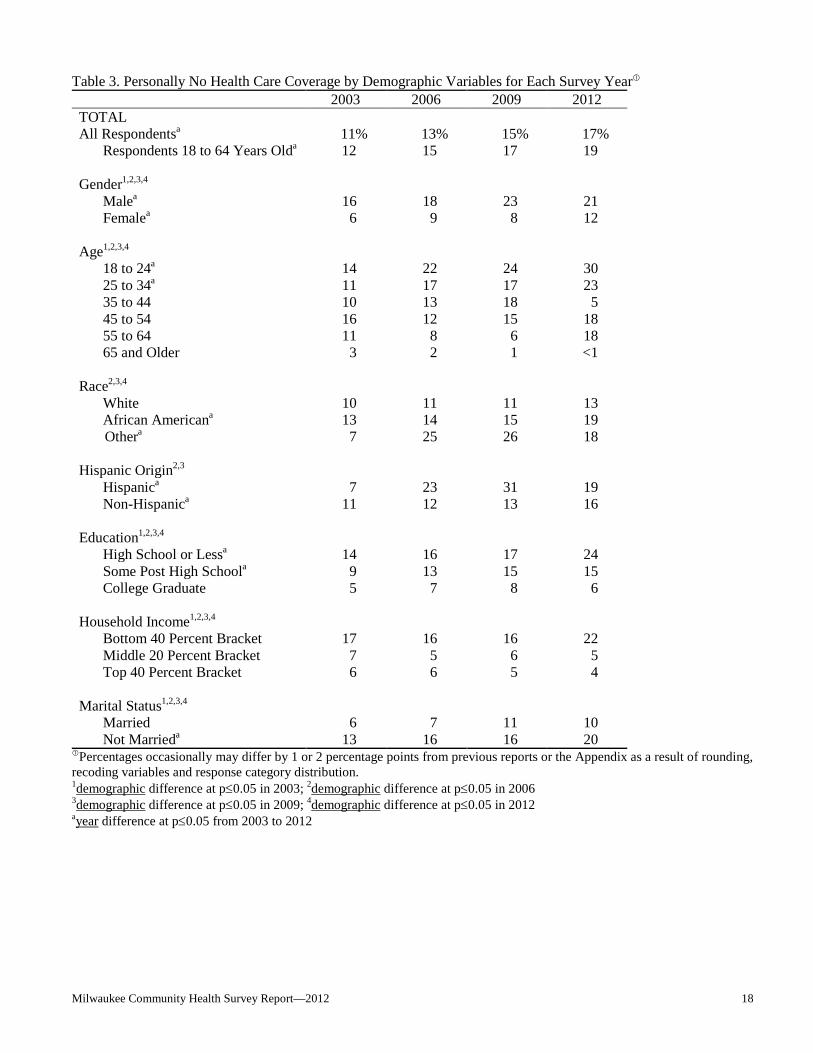
Table 3. Personally No Health Care Coverage by Demographic Variables for Each Survey Year 2003 2006 2009 2012 TOTAL All Respondentsa 11% 13% 15% 17% Respondents 18 to 64 Years Olda 12 15 17 19 Gender1,2,3,4 Malea 16 18 23 21 Femalea 6 9 8 12 Age1,2,3,4 18 to 24a 14 22 24 30 25 to 34a 11 17 17 23 35 to 44 10 13 18 5 45 to 54 16 12 15 18 55 to 64 11 8 6 18 65 and Older 3 2 1 <1 Race2,3,4 White 10 11 11 13 African Americana 13 14 15 19 Othera 7 25 26 18 Hispanic Origin2,3 Hispanica 7 23 31 19 Non-Hispanica 11 12 13 16 Education1,2,3,4 High School or Lessa 14 16 17 24 Some Post High Schoola 9 13 15 15
College Graduate 5 7 8 6 Household Income1,2,3,4 Bottom 40 Percent Bracket 17 16 16 22 Middle 20 Percent Bracket 7 5 6 5 Top 40 Percent Bracket 6 6 5 4 Marital Status1,2,3,4 Married 6 7 11 10 Not Marrieda 13 16 16 20
Percentages occasionally may differ by 1 or 2 percentage points from previous reports or the Appendix as a result of rounding, recoding variables and response category distribution.
1demographic difference at p≤0.05 in 2003; 2demographic difference at p≤0.05 in 2006 3demographic difference at p≤0.05 in 2009; 4demographic difference at p≤0.05 in 2012 ayear difference at p≤0.05 from 2003 to 2012
Milwaukee Community Health Survey Report—2012 19
Personally Not Covered in the Past 12 Months 2012 Findings • Twenty-two percent of respondents reported they were not covered by health insurance at least part of the time
in the past 12 months. • Male respondents were more likely to report they were not covered at least part of the year (27%) compared to
female respondents (18%).
• Forty-two percent of respondents 18 to 24 years old reported they were not covered compared to 12% of those 35 to 44 years old or 2% of respondents 65 and older.
• Twenty-six percent of African American respondents and 25% of respondents who were non-white and non-
African American reported they were not covered compared to 18% of white respondents.
• Hispanic respondents were more likely to report they were not covered compared to non-Hispanic respondents (36% and 21%, respectively).
• Thirty-one percent of respondents with a high school education or less reported they were not covered at least
part of the year compared to 21% of those with some post high school education or 9% of respondents with a college education.
• Twenty-eight percent of respondents in the bottom 40 percent household income bracket reported they were not
covered compared to 11% of those in the middle 20 percent income bracket or 5% of respondents in the top 40 percent household income bracket.
• Unmarried respondents were more likely to report they were not covered compared to married respondents
(25% and 15%, respectively). Year Comparisons • From 2009 to 2012, the overall percent statistically remained the same for respondents who reported no
personal health care insurance at least part of the time in the past 12 months. • In both study years, male respondents were more likely to report no coverage, with a noted decrease in 2012.
• In both study years, respondents 18 to 24 years old were more likely to report no coverage. From 2009 to 2012,
there was a noted decrease in the percent of respondents 35 to 44 years old reporting no coverage. • In 2009, respondents who were non-white and non-African American were more likely to report no coverage.
In 2012, respondents who were non-white were more likely to report no coverage. From 2009 to 2012, there was a noted decrease in the percent of respondents who were non-white and non-African American reporting no coverage.
• In both study years, Hispanic respondents were more likely to report no coverage. From 2009 to 2012, there
was a noted decrease in the percent of non-Hispanic respondents reporting no coverage.

Milwaukee Community Health Survey Report—2012 20
• In 2009, respondents with some post high school education or less were more likely to report no coverage at least part of the year. In 2012, respondents with a high school education or less were more likely to report no coverage. From 2009 to 2012, there was a noted decrease in the percent of respondents with a college education reporting no coverage.
• In both study years, respondents in the bottom 40 percent household income bracket were more likely to report
no coverage. • In both study years, unmarried respondents were more likely to report no coverage. From 2009 to 2012, there
was a noted decrease in the percent of married respondents reporting no coverage.

Milwaukee Community Health Survey Report—2012 21
Table 4. Personally Not Covered by Health Insurance in Past 12 Months by Demographic Variables for Each Survey Year
2009 2012 TOTAL 26% 22% Gender1,2 Malea 36 27 Female 16 18 Age1,2 18 to 24 38 42 25 to 34 33 29 35 to 44a 29 12 45 to 54 25 19 55 to 64 17 20 65 and Older 5 2 Race1,2 White 18 18 African American 28 26 Othera 43 25 Hispanic Origin1,2 Hispanic 43 36 Non-Hispanica 24 21 Education1,2 High School or Less 28 31 Some Post High School 27 21
College Graduatea 19 9 Household Income1,2 Bottom 40 Percent Bracket 30 28 Middle 20 Percent Bracket 14 11 Top 40 Percent Bracket 9 5 Marital Status1,2 Marrieda 22 15 Not Married 27 25
Percentages occasionally may differ by 1 or 2 percentage points from previous reports or the Appendix as a result of rounding, recoding variables and response category distribution.
1demographic difference at p≤0.05 in 2009 2demographic difference at p≤0.05 in 2012 ayear difference at p≤0.05 from 2009 to 2012 Someone in Household Not Covered in the Past 12 Months 2012 Findings • Twenty-five percent of all respondents indicated someone in their household was not covered by insurance at
least part of the time in the past 12 months.

Milwaukee Community Health Survey Report—2012 22
• Thirty-one percent of respondents in the bottom 40 percent household income bracket reported someone in their household was not covered in the past 12 months compared to 15% of those in the middle 20 percent income bracket or 5% of respondents in the top 40 percent household income bracket.
• Unmarried respondents were more likely to report someone in their household was not covered in the past 12
months compared to married respondents (28% and 18%, respectively). Year Comparisons • From 2003 to 2012, the overall percent statistically remained the same for respondents who reported someone
in their household was not covered at least part of the time in the past 12 months. • In all study years, respondents in the bottom 40 percent household income bracket were more likely to report
someone in their household was not covered in the past 12 months. From 2003 to 2012, there was a noted decrease in the percent of respondents in the top 60 percent household income bracket reporting someone in their household was not covered in the past 12 months.
• In all study years, unmarried respondents were more likely to report someone in their household was not
covered in the past 12 months. Table 5. Someone in Household Not Covered by Health Insurance in Past 12 Months by Demographic Variables for
Each Survey Year 2003 2006 2009 2012 TOTAL 27% 30% 30% 25% Household Income1,2,3,4 Bottom 40 Percent Bracket 37 39 35 31 Middle 20 Percent Bracketa 25 16 18 15 Top 40 Percent Bracketa 17 12 12 5 Marital Status1,2,3,4 Married 19 24 26 18 Not Married 32 32 32 28
Percentages occasionally may differ by 1 or 2 percentage points from previous reports or the Appendix as a result of rounding, recoding variables and response category distribution.
1demographic difference at p≤0.05 in 2003; 2demographic difference at p≤0.05 in 2006 3demographic difference at p≤0.05 in 2009; 4demographic difference at p≤0.05 in 2012 ayear difference at p≤0.05 from 2003 to 2012

Milwaukee Community Health Survey Report—2012 23
Health Care Coverage Overall Year Comparisons • From 2003 to 2012, the overall percent statistically increased for respondents 18 and older as well as for
respondents 18 to 64 years old who reported no current personal health care insurance. From 2009 to 2012, the overall percent statistically remained the same for respondents who reported no personal health care insurance at least part of the time in the past 12 months. From 2003 to 2012, the overall percent statistically remained the same for respondents who reported someone in the household was not covered at least part of the time in the past 12 months.
Figure 4. Health Care Coverage
25%30%30%
27%
17%15%13%11%
19%17%15%12%
26% 22%
0%
20%
40%
60%
80%
100%
2003 2006 2009 2012
Someone in HH notcovered in past 12months
Personally not currentlycovered (18 and older)
Personally not currentlycovered (18 to 64 yearsold)
Personally not covered inpast 12 months (18 andolder)

Milwaukee Community Health Survey Report—2012 24
Health Care Needed (Tables 6 - 8) KEY FINDINGS: In 2012, 15% of respondents reported that someone in their household had not taken their
prescribed medication due to prescription costs in the past 12 months; respondents in the bottom 60 percent household income bracket were more likely to report this. Thirteen percent of respondents reported that they did not get the medical care they needed in the last 12 months; respondents who were 18 to 24 years old, 45 to 64 years old, African American, in the bottom 40 percent household income bracket or unmarried were more likely to report this. Twenty-one percent of respondents reported that they did not get the dental care they needed in the last 12 months; respondents who were African American, in the bottom 40 percent household income bracket or unmarried were more likely to report this. Six percent of respondents reported that they did not get the mental health care they needed in the last 12 months; respondents who were 45 to 54 years old, non-white and non-African American, Hispanic or in the bottom 40 percent household income bracket were more likely to report this.
From 2006 to 2012, there was no statistical change in the overall percent of respondents reporting there was a time in the last 12 months they did not receive the medical care needed.
Prescription Medications Not Taken Due to Cost 2012 Findings • Fifteen percent of respondents reported that someone in their household had not taken their prescribed
medication due to prescription costs in the past 12 months. • Eighteen percent of respondents in the bottom 40 percent household income bracket and 16% of those in the
middle 20 percent income bracket reported someone not taking prescribed medication due to prescription costs compared to 8% of respondents in the top 40 percent household income bracket.
Table 6. Prescription Medications Not Taken Due to Cost in Past 12 Months by Demographic Variables for 2012 2012 TOTAL 15% Household Income1 Bottom 40 Percent Bracket 18 Middle 20 Percent Bracket 16 Top 40 Percent Bracket 8 Marital Status Married 13 Not Married 15 Children in Household Yes 15 No 15
Percentages occasionally may differ by 1 or 2 percentage points from the Appendix as a result of rounding, recoding variables and response category distribution. 1demographic difference at p≤0.05 in 2012
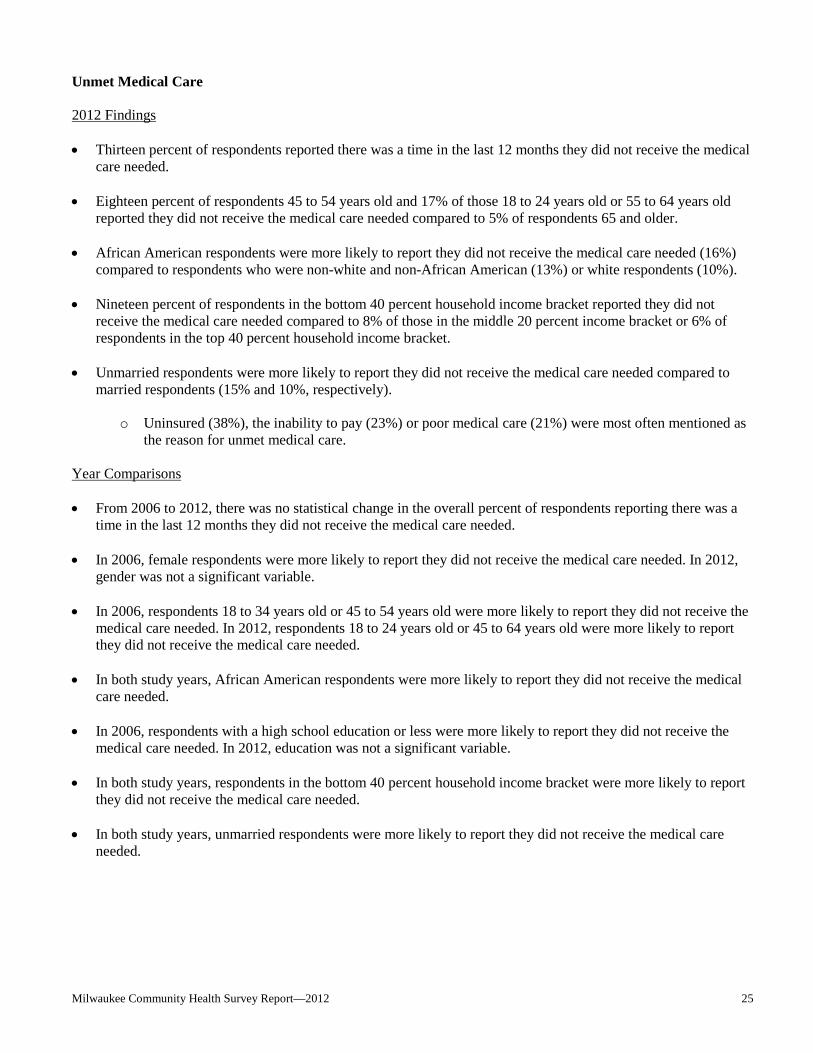
Milwaukee Community Health Survey Report—2012 25
Unmet Medical Care 2012 Findings • Thirteen percent of respondents reported there was a time in the last 12 months they did not receive the medical
care needed. • Eighteen percent of respondents 45 to 54 years old and 17% of those 18 to 24 years old or 55 to 64 years old
reported they did not receive the medical care needed compared to 5% of respondents 65 and older.
• African American respondents were more likely to report they did not receive the medical care needed (16%) compared to respondents who were non-white and non-African American (13%) or white respondents (10%).
• Nineteen percent of respondents in the bottom 40 percent household income bracket reported they did not
receive the medical care needed compared to 8% of those in the middle 20 percent income bracket or 6% of respondents in the top 40 percent household income bracket.
• Unmarried respondents were more likely to report they did not receive the medical care needed compared to
married respondents (15% and 10%, respectively).
o Uninsured (38%), the inability to pay (23%) or poor medical care (21%) were most often mentioned as the reason for unmet medical care.
Year Comparisons • From 2006 to 2012, there was no statistical change in the overall percent of respondents reporting there was a
time in the last 12 months they did not receive the medical care needed. • In 2006, female respondents were more likely to report they did not receive the medical care needed. In 2012,
gender was not a significant variable. • In 2006, respondents 18 to 34 years old or 45 to 54 years old were more likely to report they did not receive the
medical care needed. In 2012, respondents 18 to 24 years old or 45 to 64 years old were more likely to report they did not receive the medical care needed.
• In both study years, African American respondents were more likely to report they did not receive the medical
care needed.
• In 2006, respondents with a high school education or less were more likely to report they did not receive the medical care needed. In 2012, education was not a significant variable.
• In both study years, respondents in the bottom 40 percent household income bracket were more likely to report
they did not receive the medical care needed.
• In both study years, unmarried respondents were more likely to report they did not receive the medical care needed.
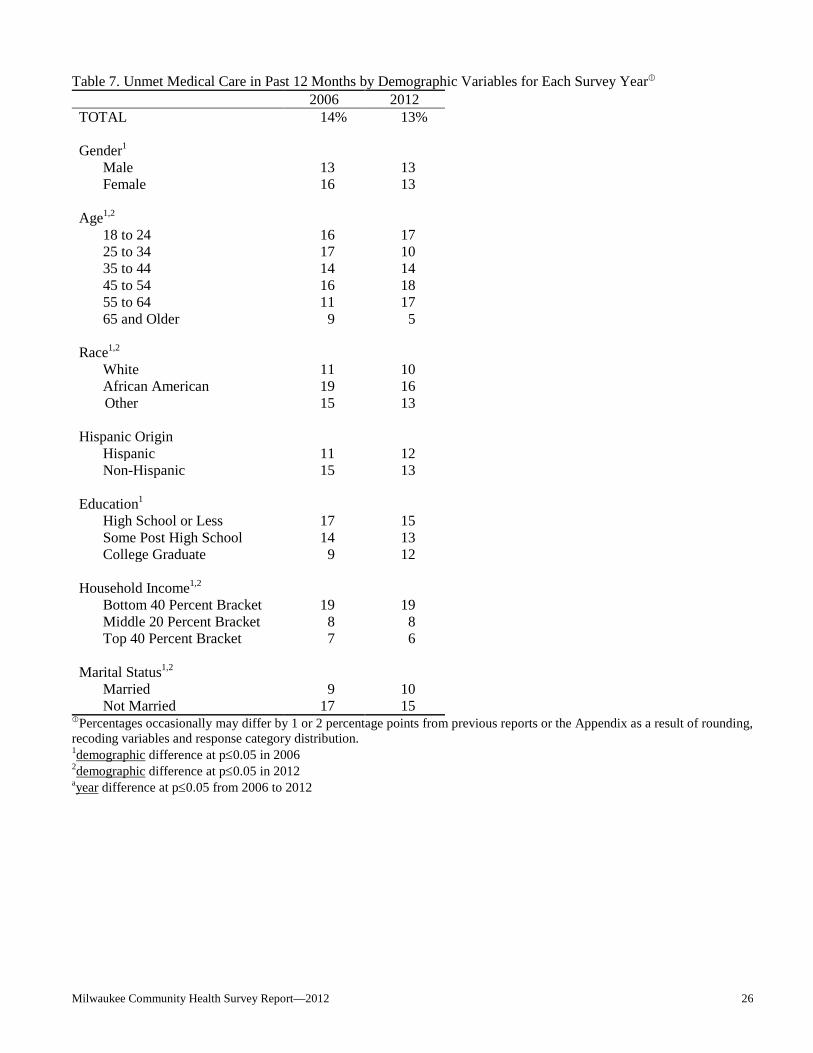
Milwaukee Community Health Survey Report—2012 26
Table 7. Unmet Medical Care in Past 12 Months by Demographic Variables for Each Survey Year 2006 2012 TOTAL 14% 13% Gender1 Male 13 13 Female 16 13 Age1,2 18 to 24 16 17 25 to 34 17 10 35 to 44 14 14 45 to 54 16 18 55 to 64 11 17 65 and Older 9 5 Race1,2 White 11 10 African American 19 16 Other 15 13 Hispanic Origin Hispanic 11 12 Non-Hispanic 15 13 Education1 High School or Less 17 15 Some Post High School 14 13
College Graduate 9 12 Household Income1,2 Bottom 40 Percent Bracket 19 19 Middle 20 Percent Bracket 8 8 Top 40 Percent Bracket 7 6 Marital Status1,2 Married 9 10 Not Married 17 15
Percentages occasionally may differ by 1 or 2 percentage points from previous reports or the Appendix as a result of rounding, recoding variables and response category distribution.
1demographic difference at p≤0.05 in 2006 2demographic difference at p≤0.05 in 2012 ayear difference at p≤0.05 from 2006 to 2012

Milwaukee Community Health Survey Report—2012 27
Unmet Dental and Mental Health Care 2012 Findings • Twenty-one percent of respondents reported there was a time in the last 12 months they did not receive the
dental care needed while 6% did not get the mental health care needed. • Respondents 45 to 54 years old were more likely to report they did not receive the mental health care needed
compared to all other age categories.
• African American respondents were more likely to report they did not receive the dental care needed. Respondents who were non-white and non-African American were more likely to report they did not receive the mental health care needed.
• Hispanic respondents were more likely to report they did not receive the mental health care needed compared to
non-Hispanic respondents.
• Respondents in the bottom 40 percent household income bracket were more likely to report they did not receive the dental care or mental health care needed.
• Unmarried respondents were more likely to report they did not receive the dental care needed compared to
married respondents.
o Uninsured or the inability to pay were most often mentioned as the reason for unmet dental care or mental health care.
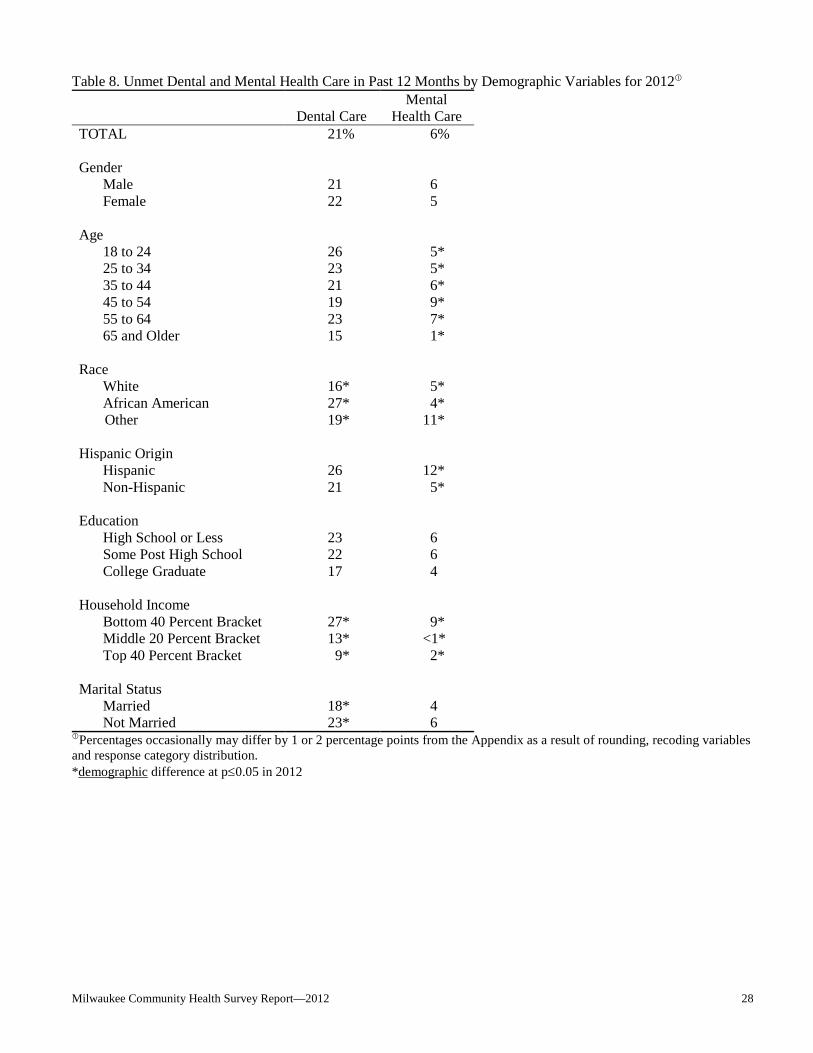
Milwaukee Community Health Survey Report—2012 28
Table 8. Unmet Dental and Mental Health Care in Past 12 Months by Demographic Variables for 2012
Dental Care Mental
Health Care TOTAL 21% 6% Gender Male 21 6 Female 22 5 Age 18 to 24 26 5* 25 to 34 23 5* 35 to 44 21 6* 45 to 54 19 9* 55 to 64 23 7* 65 and Older 15 1* Race White 16* 5* African American 27* 4* Other 19* 11* Hispanic Origin Hispanic 26 12* Non-Hispanic 21 5* Education High School or Less 23 6 Some Post High School 22 6
College Graduate 17 4 Household Income Bottom 40 Percent Bracket 27* 9* Middle 20 Percent Bracket 13* <1* Top 40 Percent Bracket 9* 2* Marital Status Married 18* 4 Not Married 23* 6
Percentages occasionally may differ by 1 or 2 percentage points from the Appendix as a result of rounding, recoding variables and response category distribution.
*demographic difference at p≤0.05 in 2012

Milwaukee Community Health Survey Report—2012 29
Health Information and Services (Figure 5; Tables 9 - 12) KEY FINDINGS: In 2012, 45% of respondents reported they receive most of their health information from a
doctor while 28% reported the internet. Respondents who were female, 65 and older or in the bottom 40 percent household income bracket were more likely to report they receive most of their health information from a doctor. Respondents who were male, 25 to 34 years old, non-white and non-African American, with a college education or in the middle 20 percent household income bracket were more likely to report they receive most of their health information from the internet. Sixty-five percent of respondents reported their primary place for health services was from a doctor’s or nurse practitioner’s office; respondents who were female, 65 and older, white, non-Hispanic, with a college education, in the top 60 percent household income bracket or married respondents were more likely to report this. Twenty-three percent of respondents had an advance care plan; respondents who were female, 65 and older, white, non-Hispanic, with a college education or in the top 40 percent household income bracket were more likely to report an advance care plan.
From 2003 to 2012, there was a statistical decrease in the overall percent of respondents reporting they receive most of their health information from a doctor while there was a statistical increase in the overall percent of respondents reporting the internet as their primary source. From 2006 to 2012, there was a statistical decrease in the overall percent of respondents reporting their primary place for health services was from a doctor’s or nurse practitioner’s office. From 2003 to 2012, there was no statistical change in the overall percent of respondents having an advance care plan.
Doctor as Health Information Source 2012 Findings • Forty-five percent of respondents reported they receive most of their health information from a doctor. • Female respondents were more likely to report doctor as their primary source of health information (51%)
compared to male respondents (39%).
• Sixty percent of respondents 65 and older reported doctor as their primary source of health information compared to 41% of those 18 to 24 years old or 33% of respondents 25 to 34 years old.
• Forty-eight percent of respondents in the bottom 40 percent household income bracket reported doctor as their
primary source compared to 40% of those in the middle 20 percent income bracket or 38% of respondents in the top 40 percent household income bracket.
Year Comparisons • From 2003 to 2012, there was a statistical decrease in the overall percent of respondents reporting they receive
most of their health information from a doctor. • In all study years, female respondents were more likely to report doctor as their primary source of health
information. From 2003 to 2012, there was a noted decrease in the percent of male respondents reporting doctor as their primary source of health information.
• In all study years, respondents 65 and older were more likely to report doctor as their primary source of health
information. From 2003 to 2012, there was a noted decrease in the percent of respondents 18 to 34 years old reporting doctor as their primary source of health information.
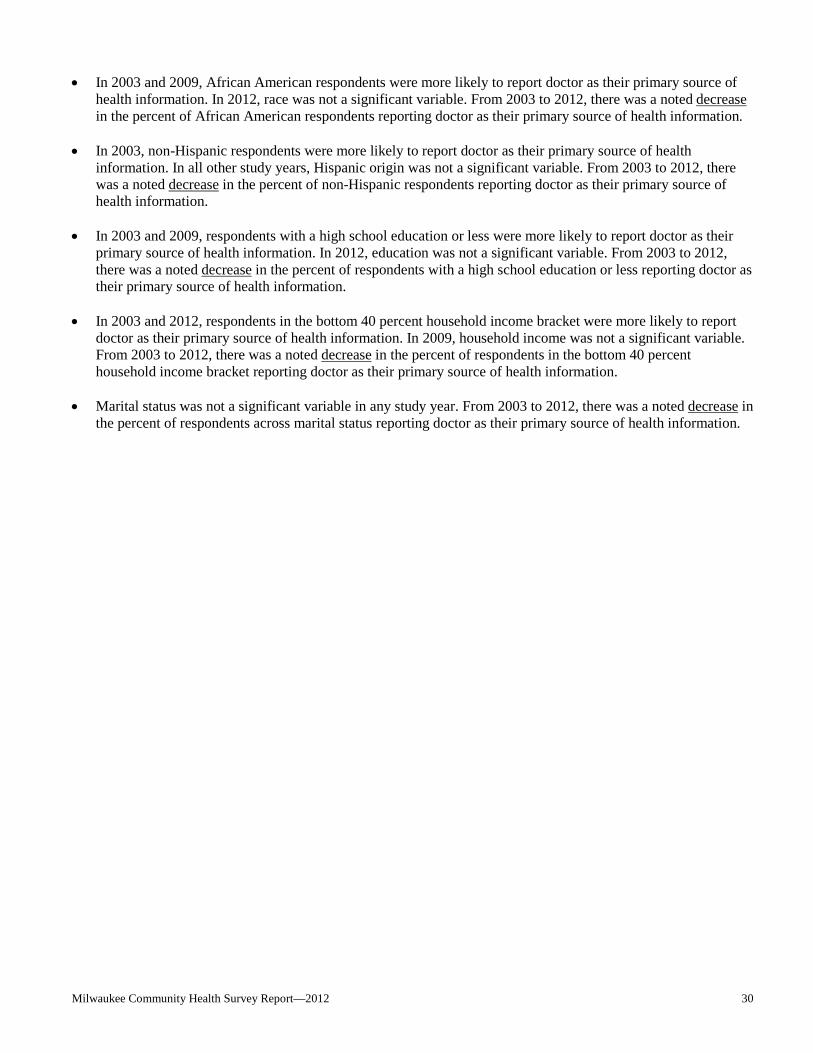
Milwaukee Community Health Survey Report—2012 30
• In 2003 and 2009, African American respondents were more likely to report doctor as their primary source of health information. In 2012, race was not a significant variable. From 2003 to 2012, there was a noted decrease in the percent of African American respondents reporting doctor as their primary source of health information.
• In 2003, non-Hispanic respondents were more likely to report doctor as their primary source of health
information. In all other study years, Hispanic origin was not a significant variable. From 2003 to 2012, there was a noted decrease in the percent of non-Hispanic respondents reporting doctor as their primary source of health information.
• In 2003 and 2009, respondents with a high school education or less were more likely to report doctor as their
primary source of health information. In 2012, education was not a significant variable. From 2003 to 2012, there was a noted decrease in the percent of respondents with a high school education or less reporting doctor as their primary source of health information.
• In 2003 and 2012, respondents in the bottom 40 percent household income bracket were more likely to report
doctor as their primary source of health information. In 2009, household income was not a significant variable. From 2003 to 2012, there was a noted decrease in the percent of respondents in the bottom 40 percent household income bracket reporting doctor as their primary source of health information.
• Marital status was not a significant variable in any study year. From 2003 to 2012, there was a noted decrease in
the percent of respondents across marital status reporting doctor as their primary source of health information.
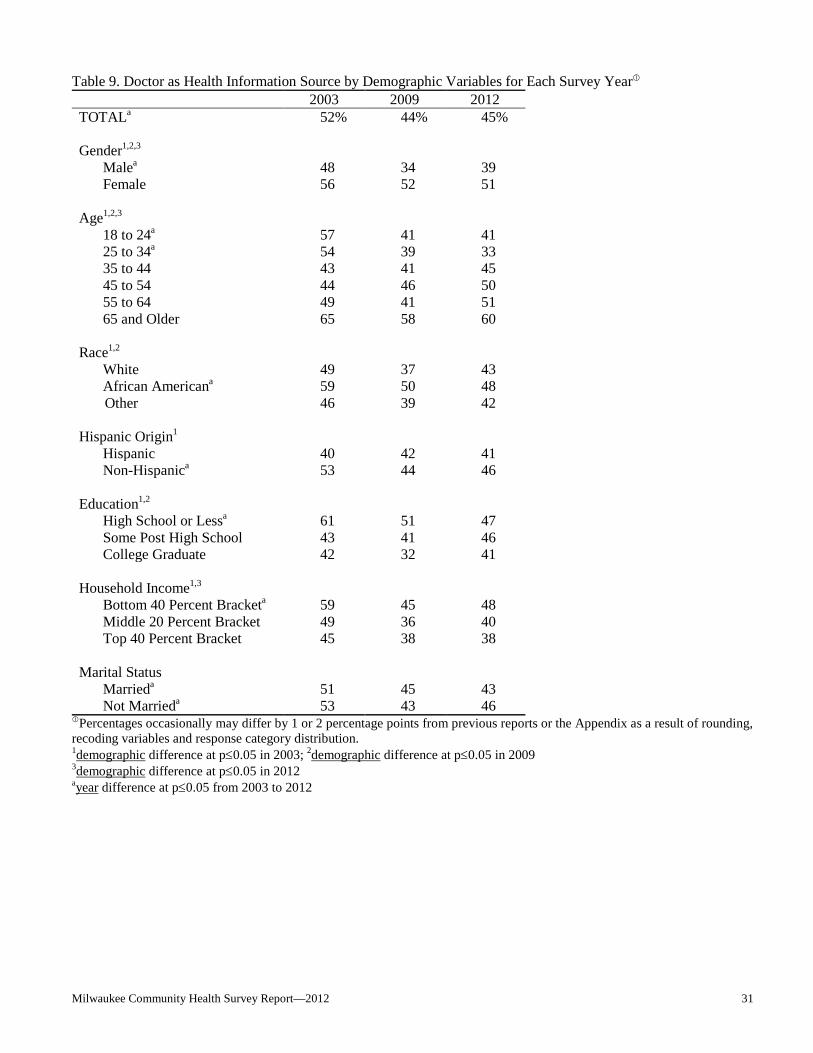
Milwaukee Community Health Survey Report—2012 31
Table 9. Doctor as Health Information Source by Demographic Variables for Each Survey Year 2003 2009 2012 TOTALa 52% 44% 45% Gender1,2,3 Malea 48 34 39 Female 56 52 51 Age1,2,3 18 to 24a 57 41 41 25 to 34a 54 39 33 35 to 44 43 41 45 45 to 54 44 46 50 55 to 64 49 41 51 65 and Older 65 58 60 Race1,2 White 49 37 43 African Americana 59 50 48 Other 46 39 42 Hispanic Origin1 Hispanic 40 42 41 Non-Hispanica 53 44 46 Education1,2 High School or Lessa 61 51 47 Some Post High School 43 41 46
College Graduate 42 32 41 Household Income1,3 Bottom 40 Percent Bracketa 59 45 48 Middle 20 Percent Bracket 49 36 40 Top 40 Percent Bracket 45 38 38 Marital Status Marrieda 51 45 43 Not Marrieda 53 43 46
Percentages occasionally may differ by 1 or 2 percentage points from previous reports or the Appendix as a result of rounding, recoding variables and response category distribution. 1demographic difference at p≤0.05 in 2003; 2demographic difference at p≤0.05 in 2009 3demographic difference at p≤0.05 in 2012 ayear difference at p≤0.05 from 2003 to 2012
Milwaukee Community Health Survey Report—2012 32
Internet as Health Information Source 2012 Findings • Twenty-eight percent of respondents reported they receive most of their health information from the internet. • Male respondents were more likely to report the internet as their primary source of health information (33%)
compared to female respondents (24%).
• Forty-four percent of respondents 25 to 34 years old reported the internet as their primary source of health information compared to 17% of those 55 to 64 years old or 5% of respondents 65 and older.
• Respondents who were non-white and non-African American were more likely to report the internet as their
primary source of health information (35%) compared to white respondents (31%) or African American respondents (23%).
• Thirty-eight percent of respondents with a college education reported the internet as their primary source
compared to 32% of those with some post high school education or 21% of respondents with a high school education or less.
• Forty percent of respondents in the middle 20 percent household income bracket reported the internet as their
primary source compared to 36% of those in the top 40 percent income bracket or 25% of respondents in the bottom 40 percent household income bracket.
Year Comparisons • From 2003 to 2012, there was a statistical increase in the overall percent of respondents reporting they receive
most of their health information from the internet. • In 2012, male respondents were more likely to report the internet as their primary source of health information.
In all other study years, gender was not a significant variable. From 2003 to 2012, there was a noted increase in the percent of respondents across gender reporting the internet as their primary source of health information.
• In 2003, respondents 18 to 54 years old were more likely to report the internet as their primary source of health
information. In 2009 and 2012, respondents 25 to 34 years old were more likely to report the internet as their primary source of health information. From 2003 to 2012, there was a noted increase in the percent of respondents across age reporting the internet as their primary source of health information.
• In all study years, respondents who were non-white and non-African American were more likely to report the
internet as their primary source of health information. From 2003 to 2012, there was a noted increase in the percent of respondents across race reporting the internet as their primary source of health information.
• In 2003, Hispanic respondents were more likely to report the internet as their primary source of health
information. In all other study years, Hispanic origin was not a significant variable. From 2003 to 2012, there was a noted increase in the percent of non-Hispanic respondents reporting the internet as their primary source of health information.
• In 2009 and 2012, respondents with a college education were more likely to report the internet as their primary
source of health information. In 2003, education was not a significant variable. From 2003 to 2012, there was a noted increase in the percent of respondents across education reporting the internet as their primary source of health information.

Milwaukee Community Health Survey Report—2012 33
• In 2003 and 2012, respondents in the middle 20 percent household income bracket were more likely to report the internet as their primary source. In 2009, respondents in the top 60 percent household income bracket were more likely to report the internet as their primary source. From 2003 to 2012, there was a noted increase in the percent of respondents across household income reporting the internet as their primary source of health information.
• In 2009, married respondents were more likely to report the internet as their primary source of health information. In all other study years, marital status was not a significant variable. From 2003 to 2012, there was a noted increase in the percent of respondents across marital status reporting the internet as their primary source.
Table 10. Internet as Health Information Source by Demographic Variables for Each Survey Year 2003 2009 2012 TOTALa 8% 21% 28% Gender3 Malea 8 23 33 Femalea 9 19 24 Age1,2,3 18 to 24a 11 21 37 25 to 34a 11 30 44 35 to 44a 11 26 30 45 to 54a 11 19 21 55 to 64a 3 17 17 65 and Oldera 0 4 5 Race1,2,3 Whitea 9 24 31 African Americana 6 17 23 Othera 21 28 35 Hispanic Origin1 Hispanic 23 20 29 Non-Hispanica 7 21 28 Education2,3 High School or Lessa 7 13 21 Some Post High Schoola 9 24 32
College Graduatea 11 32 38 Household Income1,2,3 Bottom 40 Percent Bracketa 5 19 25 Middle 20 Percent Bracketa 14 31 40 Top 40 Percent Bracketa 9 29 36 Marital Status2 Marrieda 9 26 30 Not Marrieda 8 18 28
Percentages occasionally may differ by 1 or 2 percentage points from previous reports or the Appendix as a result of rounding, recoding variables and response category distribution.
1demographic difference at p≤0.05 in 2003; 2demographic difference at p≤0.05 in 2009 3demographic difference at p≤0.05 in 2012 ayear difference at p≤0.05 from 2003 to 2012

Milwaukee Community Health Survey Report—2012 34
Primary Health Care Services 2012 Findings • Sixty-five percent of respondents reported they go to a doctor’s or nurse practitioner’s office when they are sick
or need health advice. Nine percent of respondents reported hospital emergency room while 8% reported public health clinic/community health center and 7% reported urgent care center. Six percent reported no usual place.
• Female respondents were more likely to report a doctor’s or nurse practitioner’s office (70%) compared to male
respondents (60%).
• Eighty-four percent of respondents 65 and older reported a doctor’s or nurse practitioner’s office compared to 64% of those 25 to 34 years old or 46% of respondents 18 to 24 years old.
• White respondents were more likely to report a doctor’s or nurse practitioner’s office (76%) compared to
African American respondents (59%) or respondents of another race (53%).
• Non-Hispanic respondents were more likely to report a doctor’s or nurse practitioner’s office compared to Hispanic respondents (67% and 52%, respectively).
• Seventy-three percent of respondents with a college education reported a doctor’s or nurse practitioner’s office
as their primary place for health services compared to 68% of those with some post high school education or 58% of respondents with a high school education or less.
• Eighty percent of respondents in the top 40 percent household income bracket and 79% of those in the middle
20 percent income bracket reported a doctor’s or nurse practitioner’s office compared to 58% of respondents in the bottom 40 percent household income bracket.
• Married respondents were more likely to report a doctor’s or nurse practitioner’s office compared to unmarried
respondents (74% and 62%, respectively). Year Comparisons • From 2006 to 2012, there was a statistical decrease in the overall percent of respondents reporting their primary
place for health services was from a doctor’s or nurse practitioner’s office. • In all study years, female respondents were more likely to report a doctor’s or nurse practitioner’s office. From
2006 to 2012, there was a noted decrease in the percent of respondents across gender reporting a doctor’s or nurse practitioner’s office as their primary place for health services.
• In all study years, respondents 65 and older were more likely to report a doctor’s or nurse practitioner’s office.
From 2006 to 2012, there was a noted decrease in the percent of respondents 18 to 24 years old or 55 to 64 years old reporting a doctor’s or nurse practitioner’s office.
• In all study years, white respondents were more likely to report a doctor’s or nurse practitioner’s office, with a
noted decrease in 2012.
• In all study years, non-Hispanic respondents were more likely to report a doctor’s or nurse practitioner’s office. From 2006 to 2012, there was a noted decrease in the percent of respondents across Hispanic origin reporting a doctor’s or nurse practitioner’s office.

Milwaukee Community Health Survey Report—2012 35
• In all study years, respondents with a college education were more likely to report a doctor’s or nurse practitioner’s office, with a noted decrease in 2012. From 2006 to 2012, there was a noted decrease in the percent of respondents with a high school education or less reporting a doctor’s or nurse practitioner’s office.
• In 2006 and 2009, respondents in the top 40 percent household income bracket were more likely to report a
doctor’s or nurse practitioner’s office. In 2012, respondents in the top 60 percent household income bracket were more likely to report a doctor’s or nurse practitioner’s office. From 2006 to 2012, there was a noted decrease in the percent of respondents who were in the bottom 40 percent household income bracket or in the top 40 percent household income bracket reporting a doctor’s or nurse practitioner’s office.
• In all study years, married respondents were more likely to report a doctor’s or nurse practitioner’s office. From 2006 to 2012, there was a noted decrease in the percent of respondents across gender reporting a doctor’s or nurse practitioner’s office.

Milwaukee Community Health Survey Report—2012 36
Table 11. Doctor’s or Nurse Practitioner’s Office as Primary Health Care Service by Demographic Variables for Each Survey Year
2006 2009 2012 TOTALa 74% 67% 65% Gender1,2,3 Malea 69 58 60 Femalea 78 74 70 Age1,2,3 18 to 24a 60 55 46 25 to 34 69 59 64 35 to 44 73 69 68 45 to 54 76 64 69 55 to 64a 80 77 69 65 and Older 88 82 84 Race1,2,3 Whitea 81 78 76 African American 64 64 59 Other 63 40 53 Hispanic Origin1,2,3 Hispanica 66 48 52 Non-Hispanica 74 68 67 Education1,2,3 High School or Lessa 68 62 58 Some Post High School 73 65 68
College Graduatea 84 78 73 Household Income1,2,3 Bottom 40 Percent Bracketa 68 62 58 Middle 20 Percent Bracket 81 76 79 Top 40 Percent Bracketa 86 86 80 Marital Status1,2,3 Marrieda 80 72 74 Not Marrieda 70 64 62
Percentages occasionally may differ by 1 or 2 percentage points from previous reports or the Appendix as a result of rounding, recoding variables and response category distribution.
1demographic difference at p≤0.05 in 2006; 2demographic difference at p≤0.05 in 2009 3demographic difference at p≤0.05 in 2012 ayear difference at p≤0.05 from 2006 to 2012 Advance Care Plan 2012 Findings • Twenty-three percent of respondents reported they had an advance care plan, living will or health care power of
attorney stating their end of life health care wishes.

Milwaukee Community Health Survey Report—2012 37
• Female respondents were more likely to report they had an advance care plan (25%) compared to male respondents (20%).
• Fifty-eight percent of respondents 65 and older reported they had an advance care plan compared to 14% of those 35 to 44 years old or 6% of respondents 18 to 24 years old.
• White respondents were more likely to report they had an advance care plan (26%) compared to African
American respondents (22%) or respondents of another race (15%).
• Non-Hispanic respondents were more likely to report they had an advance care plan compared to Hispanic respondents (25% and 9%, respectively).
• Twenty-eight percent of respondents with a college education reported they had an advance care plan compared
to 22% of those with some post high school education or 21% of respondents with a high school education or less.
• Thirty-one percent of respondents in the top 40 percent household income bracket reported they had an advance
care plan compared to 20% of respondents in the bottom 60 percent household income bracket. Year Comparisons • From 2003 to 2012, there was no statistical change in the overall percent of respondents having an advance care
plan. • In 2006 and 2012, female respondents were more likely to report having an advance care plan. In all other study
years, gender was not a significant variable. • In all study years, respondents 65 and older were more likely to report having an advance care plan, with a
noted increase in 2012. • In 2003, respondents who were white or African American were more likely to report having an advance care
plan. In 2006, 2009 and 2012, white respondents were more likely to report having an advance care plan.
• In all study years, non-Hispanic respondents were more likely to report having an advance care plan.
• In 2006, 2009 and 2012, respondents with a college education were more likely to report having an advance care plan. In 2003, education was not a significant variable.
• In 2006 and 2009, respondents in the middle 20 percent household income bracket were more likely to report
having an advance care plan. In 2012, respondents in the top 40 percent household income bracket were more likely to report having an advance care plan, with a noted increase since 2003. In 2003, household income was not a significant variable.
• In 2006, married respondents were more likely to report having an advance care plan. In all other study years,
marital status was not a significant variable.

Milwaukee Community Health Survey Report—2012 38
Table 12. Advance Care Plan by Demographic Variables for Each Survey Year, 2003 2006 2009 2012 TOTAL 25% 28% 26% 23% Gender2,4 Male 22 26 24 20 Female 27 30 26 25 Age1,2,3,4 18 to 24 7 7 13 6 25 to 34 21 19 19 16 35 to 44 21 23 24 14 45 to 54 30 28 19 26 55 to 64 30 37 33 31 65 and Oldera 43 64 52 58 Race1,2,3,4 White 26 32 33 26 African American 25 24 23 22 Other 12 19 10 15 Hispanic Origin1,2,3,4 Hispanic 13 17 16 9 Non-Hispanic 25 29 26 25 Education2,3,4 High School or Less 23 24 23 21 Some Post High School 25 29 25 22
College Graduate 27 34 31 28 Household Income2,3,4 Bottom 40 Percent Bracket 23 23 23 20 Middle 20 Percent Bracket 29 33 32 20 Top 40 Percent Bracketa 23 30 27 31 Marital Status2 Married 27 32 29 26 Not Married 23 25 24 22
Percentages occasionally may differ by 1 or 2 percentage points from previous reports or the Appendix as a result of rounding, recoding variables and response category distribution.
In 2006, “living will or health care power of attorney” was added. 1demographic difference at p≤0.05 in 2003; 2demographic difference at p≤0.05 in 2006 3demographic difference at p≤0.05 in 2009; 4demographic difference at p≤0.05 in 2012 ayear difference at p≤0.05 from 2003 to 2012
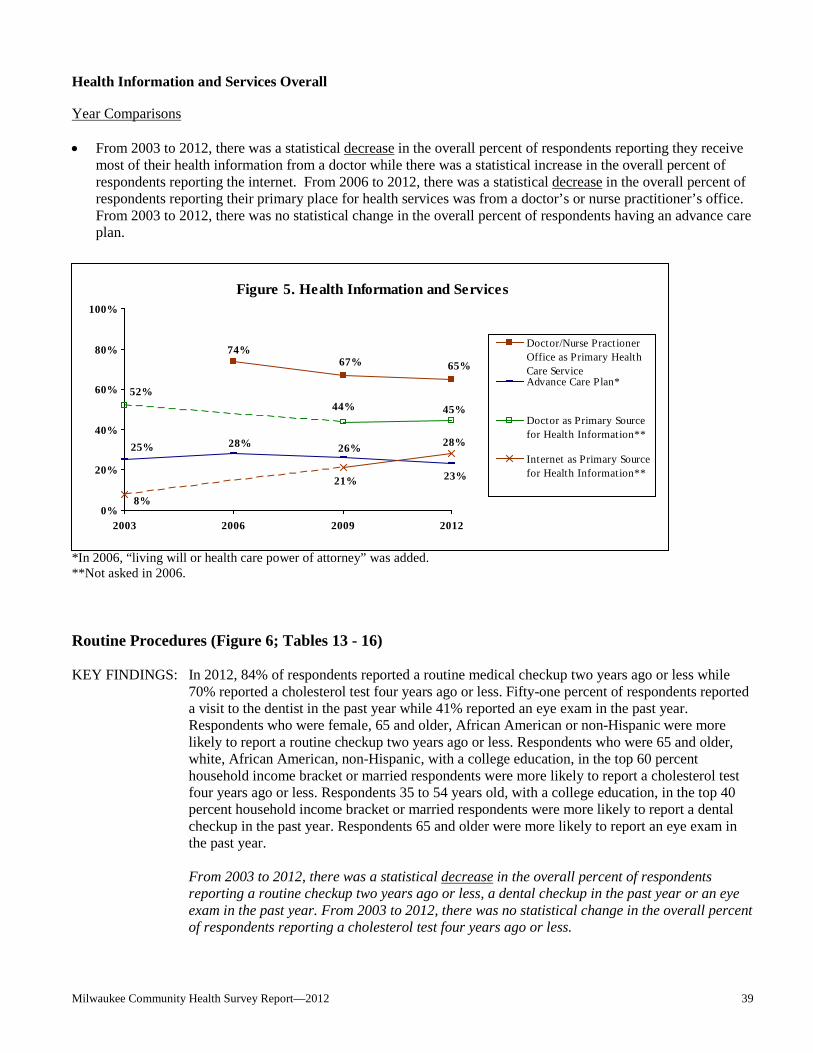
Milwaukee Community Health Survey Report—2012 39
Health Information and Services Overall Year Comparisons • From 2003 to 2012, there was a statistical decrease in the overall percent of respondents reporting they receive
most of their health information from a doctor while there was a statistical increase in the overall percent of respondents reporting the internet. From 2006 to 2012, there was a statistical decrease in the overall percent of respondents reporting their primary place for health services was from a doctor’s or nurse practitioner’s office. From 2003 to 2012, there was no statistical change in the overall percent of respondents having an advance care plan.
*In 2006, “living will or health care power of attorney” was added. **Not asked in 2006. Routine Procedures (Figure 6; Tables 13 - 16) KEY FINDINGS: In 2012, 84% of respondents reported a routine medical checkup two years ago or less while
70% reported a cholesterol test four years ago or less. Fifty-one percent of respondents reported a visit to the dentist in the past year while 41% reported an eye exam in the past year. Respondents who were female, 65 and older, African American or non-Hispanic were more likely to report a routine checkup two years ago or less. Respondents who were 65 and older, white, African American, non-Hispanic, with a college education, in the top 60 percent household income bracket or married respondents were more likely to report a cholesterol test four years ago or less. Respondents 35 to 54 years old, with a college education, in the top 40 percent household income bracket or married respondents were more likely to report a dental checkup in the past year. Respondents 65 and older were more likely to report an eye exam in the past year.
From 2003 to 2012, there was a statistical decrease in the overall percent of respondents reporting a routine checkup two years ago or less, a dental checkup in the past year or an eye exam in the past year. From 2003 to 2012, there was no statistical change in the overall percent of respondents reporting a cholesterol test four years ago or less.
Figure 5. Health Information and Services
44%
74%67% 65%
28% 26%
23%
25%
45%52%
21%
8%
28%
0%
20%
40%
60%
80%
100%
2003 2006 2009 2012
Doctor/Nurse PractionerOffice as Primary HealthCare ServiceAdvance Care Plan*
Doctor as Primary Sourcefor Health Information**
Internet as Primary Sourcefor Health Information**

Milwaukee Community Health Survey Report—2012 40
Routine Checkup In 2000, 65% of Wisconsin respondents reported in the past year they had a routine checkup, 14% reported past two years, 9% past five years and 11% five or more years ago. Nationally, 72% reported past year, 12% past two years, 7% past five years and 8% five or more years ago (2000 Behavioral Risk Factor Surveillance). 2012 Findings • Eighty-four percent of respondents reported they had a routine checkup in the past two years. • Female respondents were more likely to report a routine checkup in the past two years (89%) compared to male
respondents (78%).
• Ninety-three percent of respondents 65 and older reported a routine checkup in the past two years compared to 82% of those 18 to 24 years old or 75% of respondents 25 to 34 years old.
• African American respondents were more likely to report a routine checkup in the past two years (89%)
compared to respondents who were non-white and non-African American (82%) or white respondents (79%).
• Non-Hispanic respondents were more likely to report a routine checkup in the past two years compared to Hispanic respondents (85% and 77%, respectively).
Year Comparisons • From 2003 to 2012, there was a statistical decrease in the overall percent of respondents reporting a routine
checkup two years ago or less. • In all study years, female respondents were more likely to report a routine checkup two years ago or less, with a
noted decrease in 2012. • In 2003, respondents who were 18 to 24 years old were more likely to report a routine checkup two years ago or
less. In 2006, 2009 and 2012, respondents 65 and older were more likely to report a routine checkup two years ago or less. From 2003 to 2012, there was a noted decrease in the percent of respondents 18 to 34 years old reporting a routine checkup two years ago or less.
• In all study years, African American respondents were more likely to report a routine checkup two years ago or
less. From 2003 to 2012, there was a noted decrease in the percent of white respondents reporting a routine checkup two years ago or less.
• In 2009 and 2012, non-Hispanic respondents were more likely to report a routine checkup two years ago or less.
In all other study years, Hispanic origin was not a significant variable. From 2003 to 2012, there was a noted decrease in the percent of Hispanic respondents reporting a routine checkup two years ago or less.
• Education was not a significant variable in any study year. From 2003 to 2012, there was a noted decrease in
the percent of respondents with a high school education or less reporting a routine checkup two years ago or less.
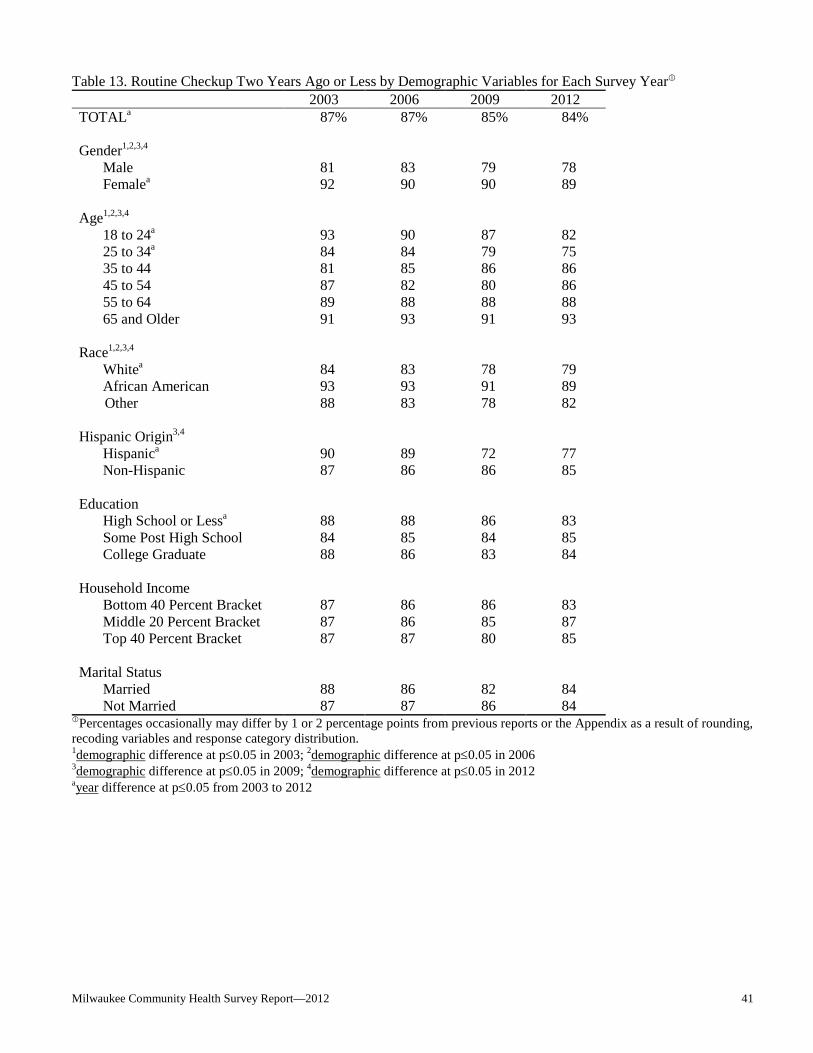
Milwaukee Community Health Survey Report—2012 41
Table 13. Routine Checkup Two Years Ago or Less by Demographic Variables for Each Survey Year 2003 2006 2009 2012 TOTALa 87% 87% 85% 84% Gender1,2,3,4 Male 81 83 79 78 Femalea 92 90 90 89 Age1,2,3,4 18 to 24a 93 90 87 82 25 to 34a 84 84 79 75 35 to 44 81 85 86 86 45 to 54 87 82 80 86 55 to 64 89 88 88 88 65 and Older 91 93 91 93 Race1,2,3,4 Whitea 84 83 78 79 African American 93 93 91 89 Other 88 83 78 82 Hispanic Origin3,4 Hispanica 90 89 72 77 Non-Hispanic 87 86 86 85 Education High School or Lessa 88 88 86 83 Some Post High School 84 85 84 85
College Graduate 88 86 83 84 Household Income Bottom 40 Percent Bracket 87 86 86 83 Middle 20 Percent Bracket 87 86 85 87 Top 40 Percent Bracket 87 87 80 85 Marital Status Married 88 86 82 84 Not Married 87 87 86 84
Percentages occasionally may differ by 1 or 2 percentage points from previous reports or the Appendix as a result of rounding, recoding variables and response category distribution.
1demographic difference at p≤0.05 in 2003; 2demographic difference at p≤0.05 in 2006 3demographic difference at p≤0.05 in 2009; 4demographic difference at p≤0.05 in 2012 ayear difference at p≤0.05 from 2003 to 2012

Milwaukee Community Health Survey Report—2012 42
Cholesterol Test The Healthy People 2020 goal for blood cholesterol screening within the preceding five years is 82%. (Objective HDS-6) In 2010, 77% of Wisconsin respondents and 77% of U.S. respondents reported they had their cholesterol checked within the past five years (2010 Behavioral Risk Factor Surveillance). 2012 Findings • Seventy percent of respondents reported having their cholesterol tested four years ago or less. Four percent
reported five or more years ago while 20% reported never having their cholesterol tested.
• Ninety percent of respondents 65 and older reported a cholesterol test four years ago or less compared to 64% of those 25 to 34 years old or 33% of respondents 18 to 24 years old.
• Seventy-five percent of white respondents and 72% of African American respondents reported a cholesterol test
four year ago or less compared to 48% of respondents of another race.
• Non-Hispanic respondents were more likely to report a cholesterol test four years ago or less compared to Hispanic respondents (73% and 52%, respectively).
• Seventy-eight percent of respondents with a college education reported a cholesterol test four years ago or less
compared to 71% of those with some post high school education or 65% of respondents with a high school education or less.
• Eighty-two percent of respondents in the top 40 percent household income bracket and 80% of those in the
middle 20 percent income bracket reported a cholesterol test four years ago or less compared to 67% of respondents in the bottom 40 percent household income bracket.
• Married respondents were more likely to report a cholesterol test four years ago or less compared to unmarried
respondents (75% and 68%, respectively). Year Comparisons • From 2003 to 2012, there was no statistical change in the overall percent of respondents who reported a
cholesterol test four years ago or less. • In 2006 and 2009, female respondents were more likely to report a cholesterol test four years ago or less. In all
other study years, gender was not a significant variable. • In 2003, 2006 and 2012, respondents 65 and older were more likely to report a cholesterol test four years ago or
less. In 2009, respondents 55 to 64 years old were more likely to report a cholesterol test four years ago or less. From 2003 to 2012, there was a noted decrease in the percent of respondents 18 to 24 years old reporting a cholesterol test four years ago or less.
• In all study years, respondents who were white or African American were more likely to report a cholesterol
test four years ago or less.
• In all study years, non-Hispanic respondents were more likely to report a cholesterol test four years ago or less.
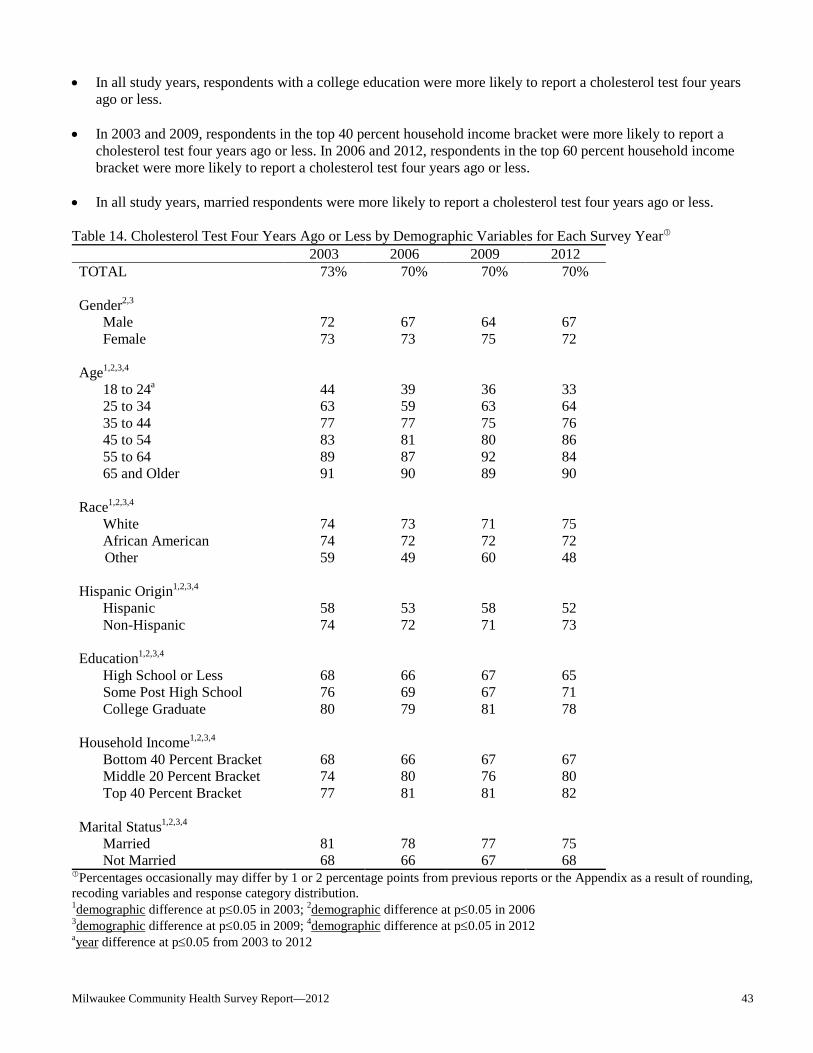
Milwaukee Community Health Survey Report—2012 43
• In all study years, respondents with a college education were more likely to report a cholesterol test four years ago or less.
• In 2003 and 2009, respondents in the top 40 percent household income bracket were more likely to report a cholesterol test four years ago or less. In 2006 and 2012, respondents in the top 60 percent household income bracket were more likely to report a cholesterol test four years ago or less.
• In all study years, married respondents were more likely to report a cholesterol test four years ago or less.
Table 14. Cholesterol Test Four Years Ago or Less by Demographic Variables for Each Survey Year 2003 2006 2009 2012 TOTAL 73% 70% 70% 70% Gender2,3 Male 72 67 64 67 Female 73 73 75 72 Age1,2,3,4 18 to 24a 44 39 36 33 25 to 34 63 59 63 64 35 to 44 77 77 75 76 45 to 54 83 81 80 86 55 to 64 89 87 92 84 65 and Older 91 90 89 90 Race1,2,3,4 White 74 73 71 75 African American 74 72 72 72 Other 59 49 60 48 Hispanic Origin1,2,3,4 Hispanic 58 53 58 52 Non-Hispanic 74 72 71 73 Education1,2,3,4 High School or Less 68 66 67 65 Some Post High School 76 69 67 71
College Graduate 80 79 81 78 Household Income1,2,3,4 Bottom 40 Percent Bracket 68 66 67 67 Middle 20 Percent Bracket 74 80 76 80 Top 40 Percent Bracket 77 81 81 82 Marital Status1,2,3,4 Married 81 78 77 75 Not Married 68 66 67 68
Percentages occasionally may differ by 1 or 2 percentage points from previous reports or the Appendix as a result of rounding, recoding variables and response category distribution.
1demographic difference at p≤0.05 in 2003; 2demographic difference at p≤0.05 in 2006 3demographic difference at p≤0.05 in 2009; 4demographic difference at p≤0.05 in 2012 ayear difference at p≤0.05 from 2003 to 2012

Milwaukee Community Health Survey Report—2012 44
Dental Checkup Counseling patients to visit a dental care provider on a regular basis as well as floss, use fluoride properly, et cetera is recommended.1 The Healthy People 2020 goal for an oral health care system visit in the past 12 months is 49%. (Objective OH-7) In 2010, 75% of Wisconsin respondents and 70% of U.S. respondents reported they visited the dentist or dental clinic within the past year for any reason (2010 Behavioral Risk Factor Surveillance). 2012 Findings • Fifty-one percent of respondents reported a dental visit in the past year. An additional 25% had a visit in the
past one to two years. • Sixty percent of respondents 35 to 44 years old and 59% of those 45 to 54 years old reported a dental checkup
in the past year compared to 42% of respondents 25 to 34 years old.
• Sixty-one percent of respondents with a college education reported a dental checkup in the past year compared to 48% of those with some post high school education or 46% of respondents with a high school education or less.
• Seventy-one percent of respondents in the top 40 percent household income bracket reported a dental checkup
in the past year compared to 58% of those in the middle 20 percent income bracket or 43% of respondents in the bottom 40 percent household income bracket.
• Married respondents were more likely to report a dental checkup in the past year compared to unmarried
respondents (59% and 47%, respectively). Year Comparisons • From 2003 to 2012, there was a statistical decrease in the overall percent of respondents who reported having a
dental checkup in the past year. • In 2009, female respondents were more likely to report a dental checkup. In all other study years, gender was
not a significant variable. From 2003 to 2012, there was a noted decrease in the percent of respondents across gender reporting a dental checkup.
• In 2003, respondents who were 18 to 24 years old or 35 to 44 years old were more likely to report a dental
checkup. In 2006, respondents 45 to 54 years old were more likely to report a dental checkup. In 2009, respondents 35 to 44 years old were more likely to report a dental checkup. In 2012, respondents 35 to 54 years old were more likely to report a dental checkup. From 2003 to 2012, there was a noted decrease in the percent of respondents who were 18 to 44 years old or 55 to 64 years old reporting a dental checkup.
• In 2003 and 2006, white respondents were more likely to report a dental checkup. In all other study years, race
was not a significant variable. From 2003 to 2012, there was a noted decrease in the percent of respondents who were white or African American reporting a dental checkup.
1 “Chapter 61: Counseling to Prevent Dental and Periodontal Diseases.” U.S. Preventive Services Task Force: Guide to Clinical Preventive Services. 2nd ed. Baltimore: Williams & Wilkins, 1996. Page 711.
Milwaukee Community Health Survey Report—2012 45
• In 2006, non-Hispanic respondents were more likely to report a dental checkup. In all other study years, Hispanic origin was not a significant variable. From 2003 to 2012, there was a noted decrease in the percent of respondents across Hispanic origin reporting a dental checkup.
• In all study years, respondents with a college education were more likely to report a dental checkup. From 2003
to 2012, there was a noted decrease in the percent of respondents across education reporting a dental checkup. • In 2003, respondents in the top 60 percent household income bracket were more likely to report a dental
checkup. In 2006, 2009 and 2012, respondents in the top 40 percent household income bracket were more likely to report a dental checkup. From 2003 to 2012, there was a noted decrease in the percent of respondents in the bottom 60 percent household income bracket reporting a dental checkup.
• In all study years, married respondents were more likely to report a dental checkup. From 2003 to 2012, there
was a noted decrease in the percent of respondents across marital status reporting a dental checkup.

Milwaukee Community Health Survey Report—2012 46
Table 15. Dental Checkup Less than One Year Ago by Demographic Variables for Each Survey Year 2003 2006 2009 2012 TOTALa 66% 58% 52% 51% Gender3 Malea 64 57 47 48 Femalea 67 60 58 53 Age1,2,3,4 18 to 24a 70 60 40 44 25 to 34a 66 52 56 42 35 to 44a 71 60 62 60 45 to 54 62 64 55 59 55 to 64a 63 60 52 50 65 and Older 57 58 44 54 Race1,2 Whitea 71 63 57 53 African Americana 57 56 50 48 Other 59 44 49 53 Hispanic Origin2 Hispanica 65 46 46 48 Non-Hispanica 66 60 53 51 Education1,2,3,4 High School or Lessa 60 52 44 46 Some Post High Schoola 66 61 53 48
College Graduatea 78 67 72 61 Household Income1,2,3,4 Bottom 40 Percent Bracketa 54 50 45 43 Middle 20 Percent Bracketa 76 70 63 58 Top 40 Percent Bracket 74 78 86 71 Marital Status1,2,3,4 Marrieda 74 69 61 59 Not Marrieda 61 53 49 47
Percentages occasionally may differ by 1 or 2 percentage points from previous reports or the Appendix as a result of rounding, recoding variables and response category distribution.
1demographic difference at p≤0.05 in 2003; 2demographic difference at p≤0.05 in 2006 3demographic difference at p≤0.05 in 2009; 4demographic difference at p≤0.05 in 2012 ayear difference at p≤0.05 from 2003 to 2012
Milwaukee Community Health Survey Report—2012 47
Eye Exam 2012 Findings • Forty-one percent of respondents had an eye exam in the past year while 28% reported one to two years ago. • Respondents 65 and older were more likely to report an eye exam in the past year (58%) compared to those 18
to 24 years old (39%) or respondents 25 to 34 years old (31%).
Year Comparisons • From 2003 to 2012, there was a statistical decrease in the overall percent of respondents who reported an eye
exam less than a year ago.
• In 2003 and 2009, female respondents were more likely to report an eye exam less than a year ago. In all other study years, gender was not a significant variable. From 2003 to 2012, there was a noted decrease in the percent of respondents across gender reporting an eye exam less than a year ago.
• In all study years, respondents 65 and older were more likely to report an eye exam less than a year ago. From
2003 to 2012, there was a noted decrease in the percent of respondents 25 to 34 years old reporting an eye exam less than a year ago.
• Race was not a significant variable in any study year. From 2003 to 2012, there was a noted decrease in the
percent of respondents who were white or African American reporting an eye exam less than a year ago.
• In 2003, non-Hispanic respondents were more likely to report an eye exam. In all other study years, Hispanic origin was not a significant variable. From 2003 to 2012, there was a noted decrease in the percent of non-Hispanic respondents reporting an eye exam less than a year ago.
• In 2006, respondents with some post high school education were more likely to report an eye exam less than a
year ago. In all other study years, education was not a significant variable. From 2003 to 2012, there was a noted decrease in the percent of respondents with a high school education or less reporting an eye exam less than a year ago.
• Household income was not a significant variable in any study year. From 2003 to 2012, there was a noted
decrease in the percent of respondents in the bottom 40 percent household income bracket reporting an eye exam less than a year ago.
• Marital status was not a significant variable in any study year. From 2003 to 2012, there was a noted decrease in
the percent of unmarried respondents reporting an eye exam less than a year ago.

Milwaukee Community Health Survey Report—2012 48
Table 16. Eye Exam Less than One Year Ago by Demographic Variables for Each Survey Year
2003 2006 2009 2012 TOTALa 50% 43% 40% 41% Gender1,3 Malea 46 41 36 40 Femalea 53 45 44 42 Age1,2,3,4 18 to 24 35 43 37 39 25 to 34a 50 38 39 31 35 to 44 45 40 32 40 45 to 54 53 42 36 43 55 to 64 50 40 47 44 65 and Older 66 60 56 58 Race Whitea 50 45 40 39 African Americana 52 42 41 42 Other 37 38 32 44 Hispanic Origin1 Hispanic 37 42 34 35 Non-Hispanica 51 43 41 42 Education2 High School or Lessa 48 41 38 37 Some Post High School 51 49 41 44
College Graduate 51 42 45 44 Household Income Bottom 40 Percent Bracketa 47 42 38 39 Middle 20 Percent Bracket 52 46 41 46 Top 40 Percent Bracket 49 44 48 43 Marital Status Married 52 41 40 45 Not Marrieda 48 44 40 39
Percentages occasionally may differ by 1 or 2 percentage points from previous reports or the Appendix as a result of rounding, recoding variables and response category distribution. 1demographic difference at p≤0.05 in 2003; 2demographic difference at p≤0.05 in 2006 3demographic difference at p≤0.05 in 2009; 4demographic difference at p≤0.05 in 2012 ayear difference at p≤0.05 from 2003 to 2012

Milwaukee Community Health Survey Report—2012 49
Routine Procedures Overall Year Comparisons • From 2003 to 2012, there was a statistical decrease in the overall percent of respondents reporting a routine
checkup two years ago or less, a dental checkup in the past year or an eye exam in the past year. From 2003 to 2012, there was no statistical change in the overall percent of respondents reporting a cholesterol test four years ago or less.
Vaccinations (Figure 7; Table 17 & 18) KEY FINDINGS: In 2012, 35% of respondents had a flu vaccination in the past year. Respondents who were
female, 65 and older, Hispanic, with a high school education or less or in the bottom 40 percent household income bracket were more likely to report a flu vaccination. Sixty-seven percent of respondents 65 and older had a pneumonia vaccination in their lifetime. From 2003 to 2012, there was no statistical change in the overall percent of respondents 18 and older who reported a flu vaccination in the past 12 months. From 2003 to 2012, there was a statistical decrease in the overall percent of respondents 65 and older who reported a flu vaccination in the past 12 months. From 2003 to 2012, there was no statistical change in the overall percent of respondents 65 and older who had a pneumonia vaccination.
Flu Vaccination The Healthy People 2020 goal for adults 18 to 64 years old having an annual influenza vaccination is 80% and for persons 65 and older is 90%. (Objectives IID-12.5 and 12.7) In 2010, 68% of Wisconsin respondents and 68% of U.S. respondents 65 and older reported a flu vaccination in the past 12 months (2010 Behavioral Risk Factor Surveillance).
Figure 6. Routine Procedures
84%87% 87% 85%
70%70%70%73%
52%58%
66%
51%
41%40%43%50%
0%
20%
40%
60%
80%
100%
2003 2006 2009 2012
Routine checkup (2 yrs.ago or less)
Cholesterol test (4 yrs.ago or less)Dental checkup (lessthan 1 yr. ago)
Eye exam (less than 1yr. ago)

Milwaukee Community Health Survey Report—2012 50
2012 Findings • Thirty-five percent of respondents had a flu shot or flu vaccine that was sprayed in their nose in the past 12
months. • Female respondents were more likely to report receiving a flu vaccination (38%) compared to male respondents
(31%). • Respondents 65 and older were more likely to report receiving a flu vaccination (60%) compared to those 25 to
34 years old (27%) or respondents 35 to 44 years old (25%).
• Hispanic respondents were more likely to report receiving a flu vaccination compared to non-Hispanic respondents (44% and 33%, respectively).
• Forty percent of respondents with a high school education or less reported a flu vaccination compared to 32% of
those with some post high school education or 28% of respondents with a college education.
• Thirty-six percent of respondents in the bottom 40 percent household income bracket reported a flu vaccination compared to 29% of those in the top 40 percent income bracket or 23% of respondents in the middle 20 percent household income bracket.
Year Comparisons • From 2003 to 2012, there was no statistical change in the overall percent of respondents 18 and older who
reported a flu vaccination in the past 12 months. From 2003 to 2012, there was a statistical decrease in the overall percent of respondents 65 and older who reported a flu vaccination in the past 12 months.
• In 2006, 2009 and 2012, female respondents were more likely to report a flu vaccination. In 2003, gender was
not a significant variable. • In all study years, respondents 65 and older were more likely to report a flu vaccination, with a noted decrease
in 2012. • In 2006, white respondents were more likely to report a flu vaccination. In all other study years, race was not a
significant variable.
• In 2006, non-Hispanic respondents were more likely to report a flu vaccination. In 2012, Hispanic respondents were more likely to report a flu vaccination, with a noted increase since 2003. In all other study years, Hispanic origin was not a significant variable.
• In 2009, respondents with a college education were more likely to report a flu vaccination. In 2012, respondents
with a high school education or less were more likely to report a flu vaccination. In all other study years, education was not a significant variable.
• In 2003 and 2012, respondents in the bottom 40 percent household income bracket were more likely to report a
flu vaccination. In all other study years, household income was not a significant variable. From 2003 to 2012, there was a noted decrease in the percent of respondents in the bottom 40 percent household income bracket reporting a flu vaccination.

Milwaukee Community Health Survey Report—2012 51
Table 17. Flu Vaccination by Demographic Variables for Each Survey Year, 2003 2006 2009 2012 TOTAL 36% 34% 38% 35% Gender2,3,4 Male 34 29 33 31 Female 37 39 42 38 Age1,2,3,4 18 to 24 32 24 33 32 25 to 34 25 20 30 27 35 to 44 25 27 26 25 45 to 54 28 35 38 34 55 to 64 46 45 44 41 65 and Oldera 71 69 65 60 Race2 White 36 38 41 32 African American 34 29 36 37 Other 34 29 31 32 Hispanic Origin2,4 Hispanica 28 27 34 44 Non-Hispanic 36 35 38 33 Education3,4 High School or Less 36 35 40 40 Some Post High School 36 35 30 32
College Graduate 34 32 44 28 Household Income1,4 Bottom 40 Percent Bracketa 43 34 36 36 Middle 20 Percent Bracket 31 34 35 23 Top 40 Percent Bracket 28 32 43 29 Marital Status Married 33 36 38 33 Not Married 37 33 38 35
Percentages occasionally may differ by 1 or 2 percentage points from previous reports or the Appendix as a result of rounding, recoding variables and response category distribution.
In 2006, “nasal spray” was added. 1demographic difference at p≤0.05 in 2003; 2demographic difference at p≤0.05 in 2006 3demographic difference at p≤0.05 in 2009; 4demographic difference at p≤0.05 in 2012 ayear difference at p≤0.05 from 2003 to 2012

Milwaukee Community Health Survey Report—2012 52
Pneumonia Vaccination The Healthy People 2020 goal for persons 65 and older ever having a pneumococcal vaccine is 90%. (Objective IID-13.1) In 2010, 73% of Wisconsin respondents and 69% of U.S. respondents 65 and older reported they received a pneumonia shot (2010 Behavioral Risk Factor Surveillance). 2012 Findings • Sixty-seven percent of respondents 65 and older reported they received a pneumonia vaccination in their lifetime. • There were no statistically significant differences between demographic variables and responses of receiving a
pneumonia vaccination in their lifetime. Year Comparisons • From 2003 to 2012, there was no statistical change in the overall percent of respondents who had a pneumonia
vaccination in their lifetime. • In 2003, 2006 and 2009, white respondents were more likely to report a pneumonia vaccination. In 2012, race
was not a significant variable. From 2003 to 2012, there was a noted increase in the percent of African American respondents reporting a pneumonia vaccination.
• In 2003, unmarried respondents were more likely to report a pneumonia vaccination. In all other study years,
marital status was not a significant variable. From 2003 to 2012, there was a noted increase in the percent of married respondents reporting a pneumonia vaccination.
Table 18. Pneumonia Vaccination Ever (65 and Older) by Demographic Variables for Each Survey Year,
2003 2006 2009 2012 TOTAL 58% 66% 64% 67% Gender Male 57 61 68 60 Female 58 70 63 71 Race1,2,3 White 65 71 76 63 African Americana 40 51 50 72 Education High School or Less 56 62 63 65 Some Post High School or More 60 73 70 70 Marital Status1 Marrieda 40 65 64 63 Not Married 64 67 65 68
Percentages occasionally may differ by 1 or 2 percentage points from previous reports or the Appendix as a result of rounding, recoding variables and response category distribution.
Other race, Hispanic origin and household income not included as a result of too few cases for statistical reliability. 1demographic difference at p≤0.05 in 2003; 2demographic difference at p≤0.05 in 2006 3demographic difference at p≤0.05 in 2009; 4demographic difference at p≤0.05 in 2012 ayear difference at p≤0.05 from 2003 to 2012
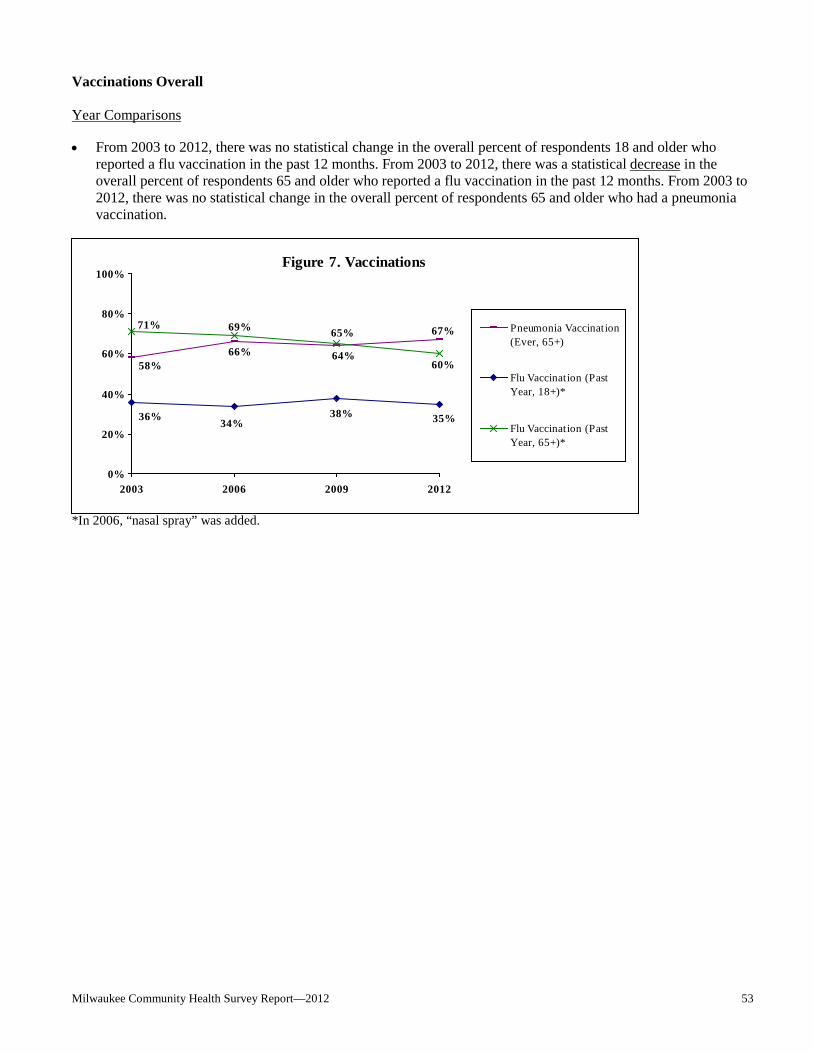
Milwaukee Community Health Survey Report—2012 53
Vaccinations Overall Year Comparisons • From 2003 to 2012, there was no statistical change in the overall percent of respondents 18 and older who
reported a flu vaccination in the past 12 months. From 2003 to 2012, there was a statistical decrease in the overall percent of respondents 65 and older who reported a flu vaccination in the past 12 months. From 2003 to 2012, there was no statistical change in the overall percent of respondents 65 and older who had a pneumonia vaccination.
*In 2006, “nasal spray” was added.
Figure 7. Vaccinations
67%
64%66%58%
35%34%38%36%
65%
60%
69%71%
0%
20%
40%
60%
80%
100%
2003 2006 2009 2012
Pneumonia Vaccination(Ever, 65+)
Flu Vaccination (PastYear, 18+)*
Flu Vaccination (PastYear, 65+)*

Milwaukee Community Health Survey Report—2012 54
Prevalence of Select Health Conditions (Figures 8 & 9; Tables 19 - 24) Respondents were asked a series of questions regarding if they had certain health conditions in the past three years. Current diagnosis of asthma was asked. KEY FINDINGS: In 2012, out of eight health conditions listed, the two most often mentioned in the past three
years were high blood pressure or high blood cholesterol (29% and 19%, respectively). Respondents who were female, 65 and older, African American, non-Hispanic, with a high school education or less, in the bottom 40 percent household income bracket, who were overweight or inactive were more likely to report high blood pressure. Respondents who were 65 and older, white, non-Hispanic, with a high school education or less, who were overweight or inactive were more likely to report high blood cholesterol. Respondents who were 65 and older, non-Hispanic, in the bottom 40 percent household income bracket, overweight or inactive were more likely to report heart disease/condition. Respondents who were female, 45 to 54 years old, with some post high school education or in the bottom 40 percent household income bracket were more likely to report a mental health condition. Respondents who were 65 and older, African American, with a high school education or less, in the bottom 40 percent household income bracket, who were overweight or inactive were more likely to report diabetes. Respondents who were female, 45 to 54 years old, non-white, with some post high school education or less, in the bottom 40 percent household income bracket or unmarried respondents were more likely to report current asthma.
From 2003 to 2012, there was a statistical increase in the overall percent of respondents who reported high blood pressure, diabetes or current asthma. From 2003 to 2012, there was no statistical change in the overall percent of respondents who reported high blood cholesterol, heart disease/condition or stroke. From 2009 to 2012, there was no statistical change in the overall percent of respondents who reported a mental health condition or cancer.
2012 Findings • Respondents were more likely to report high blood pressure (29%) or high blood cholesterol (19%) in the past
three years.
Figure 8. Health Conditions in Past Three Years for 2012
3%
9%
10%
14%
16%
19%
29%
2%
0% 20% 40% 60% 80% 100%
Stroke
Cancer
Heart Disease/Condition
Diabetes
Asthma (Current)
Mental Health Condition
High Blood Cholesterol
High Blood Pressure
Milwaukee Community Health Survey Report—2012 55
High Blood Pressure 2012 Findings • Twenty-nine percent of respondents reported high blood pressure in the past three years. • Female respondents were more likely to report high blood pressure (32%) compared to male respondents
(24%).
• Respondents 65 and older were more likely to report high blood pressure in the past three years (63%) compared to those 25 to 34 years old (11%) or respondents 18 to 24 years old (7%).
• African American respondents were more likely to report high blood pressure (37%) compared to white
respondents (23%) or respondents of another race (16%).
• Non-Hispanic respondents were more likely to report high blood pressure compared to Hispanic respondents (31% and 11%, respectively).
• Thirty-four percent of respondents with a high school education or less reported high blood pressure compared to 27% of those with some post high school education or 20% of respondents with a college education.
• Thirty-five percent of respondents in the bottom 40 percent household income bracket reported high blood
pressure compared to 20% of those in the middle 20 percent income bracket or 16% of respondents in the top 40 percent household income bracket.
• Thirty-five percent of overweight respondents reported high blood pressure compared to 15% of respondents who were not overweight.
• Inactive respondents were more likely to report high blood pressure (41%) compared to those who did an
insufficient amount of physical activity (31%) or respondents who met the recommended amount of physical activity (23%).
o Of the 342 respondents who reported high blood pressure, 96% had it under control through medication,
exercise or lifestyle changes.
Year Comparisons • From 2003 to 2012, there was a statistical increase in the overall percent of respondents who reported high
blood pressure. • In 2006, 2009 and 2012, female respondents were more likely to report high blood pressure. In 2003, gender
was not a significant variable. From 2003 to 2012, there was a noted increase in the percent of female respondents reporting high blood pressure.
• In all study years, respondents 65 and older were more likely to report high blood pressure. From 2003 to 2012,
there was a noted increase in the percent of respondents 45 to 64 years old reporting high blood pressure.
• In all study years, African American respondents were more likely to report high blood pressure, with a noted increase in 2012.
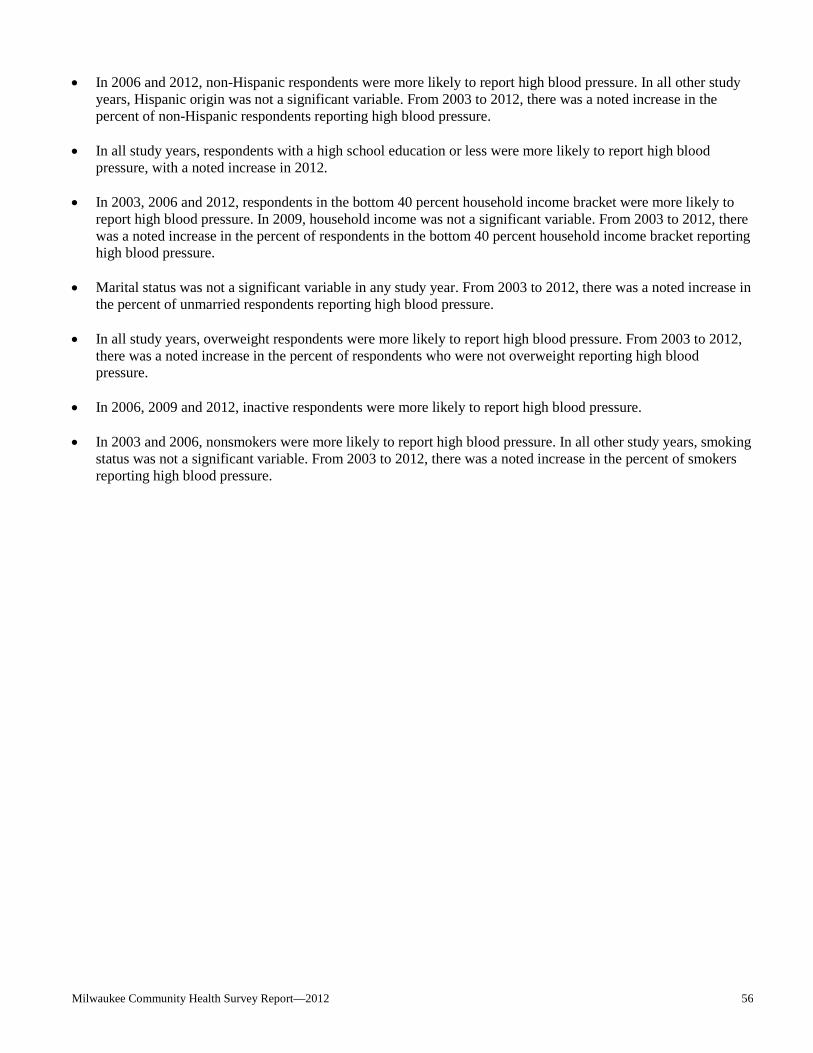
Milwaukee Community Health Survey Report—2012 56
• In 2006 and 2012, non-Hispanic respondents were more likely to report high blood pressure. In all other study years, Hispanic origin was not a significant variable. From 2003 to 2012, there was a noted increase in the percent of non-Hispanic respondents reporting high blood pressure.
• In all study years, respondents with a high school education or less were more likely to report high blood
pressure, with a noted increase in 2012. • In 2003, 2006 and 2012, respondents in the bottom 40 percent household income bracket were more likely to
report high blood pressure. In 2009, household income was not a significant variable. From 2003 to 2012, there was a noted increase in the percent of respondents in the bottom 40 percent household income bracket reporting high blood pressure.
• Marital status was not a significant variable in any study year. From 2003 to 2012, there was a noted increase in
the percent of unmarried respondents reporting high blood pressure. • In all study years, overweight respondents were more likely to report high blood pressure. From 2003 to 2012,
there was a noted increase in the percent of respondents who were not overweight reporting high blood pressure.
• In 2006, 2009 and 2012, inactive respondents were more likely to report high blood pressure. • In 2003 and 2006, nonsmokers were more likely to report high blood pressure. In all other study years, smoking
status was not a significant variable. From 2003 to 2012, there was a noted increase in the percent of smokers reporting high blood pressure.
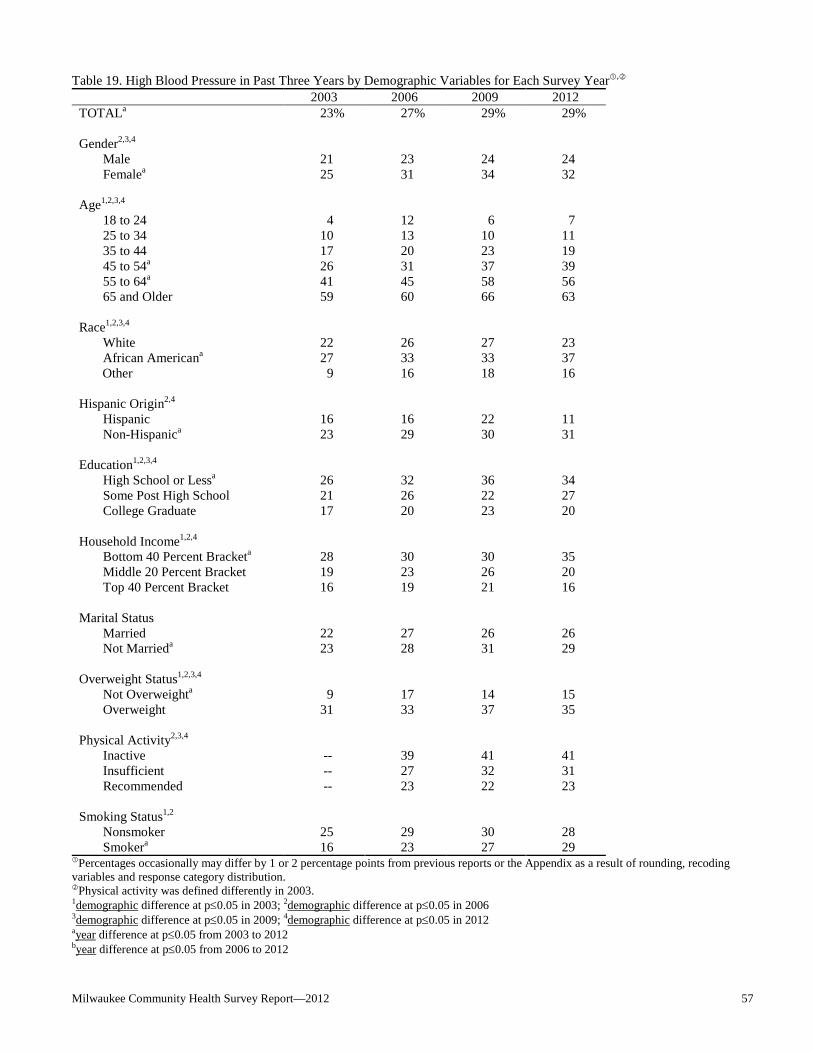
Milwaukee Community Health Survey Report—2012 57
Table 19. High Blood Pressure in Past Three Years by Demographic Variables for Each Survey Year,
2003 2006 2009 2012 TOTALa 23% 27% 29% 29% Gender2,3,4 Male 21 23 24 24 Femalea 25 31 34 32 Age1,2,3,4 18 to 24 4 12 6 7 25 to 34 10 13 10 11 35 to 44 17 20 23 19 45 to 54a 26 31 37 39 55 to 64a 41 45 58 56 65 and Older 59 60 66 63 Race1,2,3,4 White 22 26 27 23 African Americana 27 33 33 37 Other 9 16 18 16 Hispanic Origin2,4 Hispanic 16 16 22 11 Non-Hispanica 23 29 30 31 Education1,2,3,4 High School or Lessa 26 32 36 34 Some Post High School 21 26 22 27
College Graduate 17 20 23 20 Household Income1,2,4 Bottom 40 Percent Bracketa 28 30 30 35 Middle 20 Percent Bracket 19 23 26 20 Top 40 Percent Bracket 16 19 21 16 Marital Status Married 22 27 26 26 Not Marrieda 23 28 31 29 Overweight Status1,2,3,4 Not Overweighta 9 17 14 15 Overweight 31 33 37 35 Physical Activity2,3,4 Inactive -- 39 41 41 Insufficient -- 27 32 31 Recommended -- 23 22 23 Smoking Status1,2 Nonsmoker 25 29 30 28 Smokera 16 23 27 29
Percentages occasionally may differ by 1 or 2 percentage points from previous reports or the Appendix as a result of rounding, recoding variables and response category distribution. Physical activity was defined differently in 2003. 1demographic difference at p≤0.05 in 2003; 2demographic difference at p≤0.05 in 2006 3demographic difference at p≤0.05 in 2009; 4demographic difference at p≤0.05 in 2012 ayear difference at p≤0.05 from 2003 to 2012 byear difference at p≤0.05 from 2006 to 2012

Milwaukee Community Health Survey Report—2012 58
High Blood Cholesterol 2012 Findings • Nineteen percent of respondents reported high blood cholesterol in the past three years. • Forty-two percent of respondents 65 and older reported high blood cholesterol in the past three years compared
to 4% of those 25 to 34 years old or 2% of respondents 18 to 24 years old.
• White respondents were more likely to report high blood cholesterol (22%) compared to African American respondents (18%) or respondents of another race (13%).
• Non-Hispanic respondents were more likely to report high blood cholesterol compared to Hispanic respondents
(20% and 12%, respectively).
• Twenty-three percent of respondents with a high school education or less reported high blood cholesterol in the past three years compared to 17% of those with a college education or 14% of respondents with some post high school education.
• Overweight respondents were more likely to report high blood cholesterol (24%) compared to respondents who
were not overweight (9%).
• Inactive respondents were more likely to report high blood cholesterol in the past three years (33%) compared to those who did an insufficient amount of physical activity (22%) or respondents who met the recommended amount of physical activity (11%).
o Of the 225 respondents who reported high blood cholesterol, 84% had it under control through medication,
exercise or lifestyle changes. Respondents 65 and older were more likely to report they had their high blood cholesterol under control through medication, exercise or lifestyle changes.
Year Comparisons • From 2003 to 2012, there was no statistical change in the overall percent of respondents who reported high
blood cholesterol. • In all study years, respondents 65 and older were more likely to report high blood cholesterol. From 2003 to
2012, there was a noted increase in the percent of respondents 45 to 54 years old reporting high blood cholesterol.
• In 2003, 2006 and 2012, white respondents were more likely to report high blood cholesterol. In 2009, race was
not a significant variable. From 2003 to 2012, there was a noted increase in the percent of respondents who were non-white and non-African American reporting high blood cholesterol.
• In 2006 and 2012, non-Hispanic respondents were more likely to report high blood cholesterol. In all other
study years, Hispanic origin was not a significant variable. • In 2009 and 2012, respondents with a high school education or less were more likely to report high blood
cholesterol. In all other study years, education was not a significant variable. From 2003 to 2012, there was a noted increase in the percent of respondents with a high school education or less reporting high blood cholesterol.

Milwaukee Community Health Survey Report—2012 59
• Household income was not a significant variable in any study year. From 2003 to 2012, there was a noted increase in the percent of respondents in the middle 20 percent household income bracket reporting high blood cholesterol.
• In 2006, married respondents were more likely to report high blood cholesterol. In all other study years, marital
status was not a significant variable. • In all study years, overweight respondents were more likely to report high blood cholesterol. • In 2009 and 2012, inactive respondents were more likely to report high blood cholesterol. In 2006, physical
activity was not a significant variable. From 2006 to 2012, there was a noted increase in the percent of respondents who were inactive or who met the recommended amount of physical activity reporting high blood cholesterol.
• In 2003, nonsmokers were more likely to report high blood cholesterol. In all other study years, smoking status
was not a significant variable.

Milwaukee Community Health Survey Report—2012 60
Table 20. High Blood Cholesterol in Past Three Years by Demographic Variables for Each Survey Year,
2003 2006 2009 2012 TOTAL 17% 21% 21% 19% Gender Male 17 20 20 18 Female 17 21 21 20 Age1,2,3,4 18 to 24 2 8 2 2 25 to 34 7 7 8 4 35 to 44 13 15 22 15 45 to 54a 19 29 24 31 55 to 64 35 37 39 38 65 and Older 39 44 42 42 Race1,2,4 White 19 24 23 22 African American 15 19 20 18 Othera 5 10 14 13 Hispanic Origin2,4 Hispanic 11 12 18 12 Non-Hispanic 17 22 21 20 Education3,4 High School or Lessa 17 21 24 23 Some Post High School 18 23 14 14
College Graduate 16 19 21 17 Household Income Bottom 40 Percent Bracket 17 21 20 20 Middle 20 Percent Bracketa 16 23 24 25 Top 40 Percent Bracket 16 21 16 15 Marital Status2 Married 18 23 19 21 Not Married 16 19 21 18 Overweight Status1,2,3,4 Not Overweight 11 17 11 9 Overweight 21 23 25 24 Physical Activity3,4 Inactiveb -- 25 29 33 Insufficient -- 20 23 22 Recommendedb -- 19 14 11 Smoking Status1 Nonsmoker 19 21 20 19 Smoker 12 19 21 17
Percentages occasionally may differ by 1 or 2 percentage points from previous reports or the Appendix as a result of rounding, recoding variables and response category distribution. Physical activity was defined differently in 2003. 1demographic difference at p≤0.05 in 2003; 2demographic difference at p≤0.05 in 2006 3demographic difference at p≤0.05 in 2009; 4demographic difference at p≤0.05 in 2012 ayear difference at p≤0.05 from 2003 to 2012 byear difference at p≤0.05 from 2006 to 2012

Milwaukee Community Health Survey Report—2012 61
Heart Disease/Condition 2012 Findings • Nine percent of respondents reported heart disease or condition in the past three years. • Twenty percent of respondents 65 and older reported heart disease/condition compared to 1% of those 35 to 44
years old or 0% of respondents 18 to 24 years old.
• Non-Hispanic respondents were more likely to report heart disease/condition compared to Hispanic respondents (9% and 2%, respectively).
• Eleven percent of respondents in the bottom 40 percent household income bracket reported heart
disease/condition compared to 8% of those in the middle 20 percent income bracket or 3% of respondents in the top 40 percent household income bracket.
• Overweight respondents were more likely to report heart disease/condition (11%) compared to respondents who
were not overweight (4%).
• Inactive respondents were more likely to report heart disease/condition (14%) compared to those who did an insufficient amount of physical activity (10%) or respondents who met the recommended amount of physical activity (5%).
o Of the 101 respondents who reported heart disease/condition, 89% had it under control through medication,
exercise or lifestyle changes. Year Comparisons • From 2003 to 2012, there was no statistical change in the overall percent of respondents who reported heart
disease/condition. • Gender was not a significant variable in any study year. From 2003 to 2012, there was a noted increase in the
percent of male respondents reporting heart disease/condition.
• In all study years, respondents 65 and older were more likely to report heart disease/condition. From 2003 to 2012, there was a noted increase in the percent of respondents 45 to 54 years old reporting heart disease/condition.
• In 2003 and 2006, white respondents were more likely to report heart disease/condition. In all other study years,
race was not a significant variable. From 2003 to 2012, there was a noted increase in the percent of African American respondents reporting heart disease/condition.
• In 2006 and 2012, non-Hispanic respondents were more likely to report heart disease/condition. In all other
study years, Hispanic origin was not a significant variable. From 2003 to 2012, there was a noted decrease in the percent of Hispanic respondents and a noted increase in the percent of non-Hispanic respondents reporting heart disease/condition.
• In 2003 and 2009, respondents with a high school education or less were more likely to report heart
disease/condition. In all other study years, education was not a significant variable.
Milwaukee Community Health Survey Report—2012 62
• In all study years, respondents in the bottom 40 percent household income bracket were more likely to report heart disease/condition. From 2003 to 2012, there was a noted increase in the percent of respondents in the middle 20 percent household income bracket reporting heart disease/condition.
• In 2009, unmarried respondents were more likely to report heart disease/condition. In all other study years,
marital status was not a significant variable.
• In 2006 and 2012, overweight respondents were more likely to report heart disease/condition. In all other study years, overweight status was not a significant variable. From 2003 to 2012, there was a noted increase in the percent of overweight respondents reporting heart disease/condition.
• In 2006, 2009 and 2012, inactive respondents were more likely to report heart disease/condition. From 2006 to
2012, there was a noted increase in the percent of respondents who did an insufficient amount of physical activity reporting heart disease/condition.
• In 2003, nonsmokers were more likely to report heart disease/condition. In 2009, smokers were more likely to
report heart disease/condition. In all other study years, smoking status was not a significant variable. From 2003 to 2012, there was a noted increase in the percent of smokers reporting heart disease/condition.

Milwaukee Community Health Survey Report—2012 63
Table 21. Heart Disease/Condition in Past Three Years by Demographic Variables for Each Survey Year,
2003 2006 2009 2012 TOTAL 7% 8% 9% 9% Gender Malea 6 7 9 10 Female 8 8 9 7 Age1,2,3,4 18 to 24 2 1 2 0 25 to 34 3 4 3 6 35 to 44 3 3 7 1 45 to 54a 4 8 12 17 55 to 64 12 16 11 13 65 and Older 25 22 24 20 Race1,2 White 8 9 10 9 African Americana 6 7 8 9 Other 1 3 6 5 Hispanic Origin2,4 Hispanica 8 2 9 2 Non-Hispanica 7 8 9 9 Education1,3 High School or Less 9 9 11 10 Some Post High School 5 7 9 8
College Graduate 4 5 5 6 Household Income1,2,3,4 Bottom 40 Percent Bracket 10 9 11 11 Middle 20 Percent Bracketa 4 5 2 8 Top 40 Percent Bracket 5 4 3 3 Marital Status3 Married 6 7 5 6 Not Married 8 8 10 9 Overweight Status2,4 Not Overweight 5 6 9 4 Overweighta 8 9 9 11 Physical Activity2,3,4 Inactive -- 13 14 14 Insufficientb -- 6 8 10 Recommended -- 6 7 5 Smoking Status1,3 Nonsmoker 8 7 8 8 Smokera 4 8 11 9
Percentages occasionally may differ by 1 or 2 percentage points from previous reports or the Appendix as a result of rounding, recoding variables and response category distribution. Physical activity was defined differently in 2003. 1demographic difference at p≤0.05 in 2003; 2demographic difference at p≤0.05 in 2006 3demographic difference at p≤0.05 in 2009; 4demographic difference at p≤0.05 in 2012 ayear difference at p≤0.05 from 2003 to 2012 byear difference at p≤0.05 from 2006 to 2012
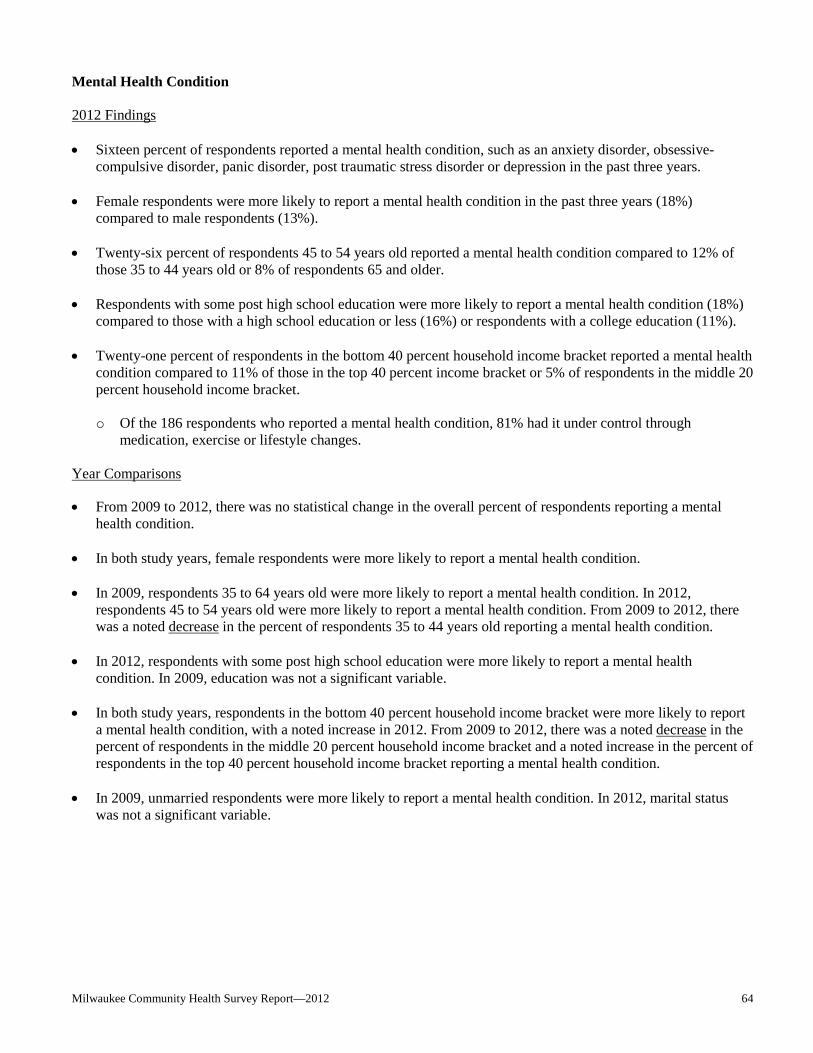
Milwaukee Community Health Survey Report—2012 64
Mental Health Condition 2012 Findings • Sixteen percent of respondents reported a mental health condition, such as an anxiety disorder, obsessive-
compulsive disorder, panic disorder, post traumatic stress disorder or depression in the past three years. • Female respondents were more likely to report a mental health condition in the past three years (18%)
compared to male respondents (13%).
• Twenty-six percent of respondents 45 to 54 years old reported a mental health condition compared to 12% of those 35 to 44 years old or 8% of respondents 65 and older.
• Respondents with some post high school education were more likely to report a mental health condition (18%)
compared to those with a high school education or less (16%) or respondents with a college education (11%).
• Twenty-one percent of respondents in the bottom 40 percent household income bracket reported a mental health condition compared to 11% of those in the top 40 percent income bracket or 5% of respondents in the middle 20 percent household income bracket.
o Of the 186 respondents who reported a mental health condition, 81% had it under control through
medication, exercise or lifestyle changes. Year Comparisons • From 2009 to 2012, there was no statistical change in the overall percent of respondents reporting a mental
health condition. • In both study years, female respondents were more likely to report a mental health condition.
• In 2009, respondents 35 to 64 years old were more likely to report a mental health condition. In 2012,
respondents 45 to 54 years old were more likely to report a mental health condition. From 2009 to 2012, there was a noted decrease in the percent of respondents 35 to 44 years old reporting a mental health condition.
• In 2012, respondents with some post high school education were more likely to report a mental health
condition. In 2009, education was not a significant variable.
• In both study years, respondents in the bottom 40 percent household income bracket were more likely to report a mental health condition, with a noted increase in 2012. From 2009 to 2012, there was a noted decrease in the percent of respondents in the middle 20 percent household income bracket and a noted increase in the percent of respondents in the top 40 percent household income bracket reporting a mental health condition.
• In 2009, unmarried respondents were more likely to report a mental health condition. In 2012, marital status
was not a significant variable.

Milwaukee Community Health Survey Report—2012 65
Table 22. Mental Health Condition in Past Three Years by Demographic Variables for Each Survey Year
2009 2012 TOTAL 14% 16% Gender1,2 Male 11 13 Female 16 18 Age1,2 18 to 24 8 14 25 to 34 11 14 35 to 44a 19 12 45 to 54 19 26 55 to 64 19 20 65 and Older 7 8 Race White 16 17 African American 12 15 Other 12 13 Hispanic Origin Hispanic 20 14 Non-Hispanic 13 16 Education2 High School or Less 15 16 Some Post High School 15 18
College Graduate 10 11 Household Income1,2 Bottom 40 Percent Bracketa 17 21 Middle 20 Percent Bracketa 12 5 Top 40 Percent Bracketa 5 11 Marital Status1 Married 10 13 Not Married 15 17
Percentages occasionally may differ by 1 or 2 percentage points from previous reports or the Appendix as a result of rounding, recoding variables and response category distribution.
1demographic difference at p≤0.05 in 2009 2demographic difference at p≤0.05 in 2012 ayear difference at p≤0.05 from 2009 to 2012
Milwaukee Community Health Survey Report—2012 66
Diabetes 2012 Findings • Ten percent of respondents reported diabetes in the past three years. • Twenty-five percent of respondents 65 and older reported diabetes in the past three years compared to 6% of
those 35 to 44 years old or 2% of respondents 18 to 34 years old.
• Fourteen percent of African American respondents reported diabetes compared to 7% of respondents who were white or of another race.
• Fourteen percent of respondents with a high school education or less reported diabetes compared to 9% of those
with some post high school education or 6% of respondents with a college education.
• Twelve percent of respondents in the bottom 40 percent household income bracket reported diabetes compared to 8% of those in the middle 20 percent income bracket or 3% of respondents in the top 40 percent household income bracket.
• Overweight respondents were more likely to report diabetes (13%) compared to respondents who were not
overweight (4%).
• Sixteen percent of inactive respondents reported diabetes compared to 12% of those who did an insufficient amount of physical activity or 6% of respondents who met the recommended amount of physical activity.
o Of the 123 respondents who reported diabetes, 90% had it under control through medication, exercise or
lifestyle changes. Male respondents were more likely to report they had their diabetes under control through medication, exercise or lifestyle changes.
Year Comparisons • From 2003 to 2012, there was a statistical increase in the overall percent of respondents who reported diabetes. • Gender was not a significant variable in any study year. From 2003 to 2012, there was a noted increase in the
percent of male respondents reporting diabetes.
• In 2003, 2009 and 2012, respondents 65 and older were more likely to report diabetes. In 2006, respondents 55 and older were more likely to report diabetes. From 2003 to 2012, there was a noted increase in the percent of respondents who were 18 to 24 years old or 45 to 54 years old reporting diabetes.
• In 2003 and 2012, African American respondents were more likely to report diabetes. In all other study years,
race was not a significant variable.
• In 2003, non-Hispanic respondents were more likely to report diabetes. In all other study years, Hispanic origin was not a significant variable. From 2003 to 2012, there was a noted increase in the percent of respondents across Hispanic origin reporting diabetes.

Milwaukee Community Health Survey Report—2012 67
• In 2003, respondents with some post high school education were more likely to report diabetes. In 2006, 2009 and 2012, respondents with a high school education or less were more likely to report diabetes. From 2003 to 2012, there was a noted increase in the percent of respondents with a high school education or less reporting diabetes.
• In 2003, 2006 and 2012, respondents in the bottom 40 percent household income bracket were more likely to
report diabetes. In 2009, household income was not a significant variable. From 2003 to 2012, there was a noted increase in the percent of respondents in the bottom 40 percent household income bracket reporting diabetes.
• Marital status was not a significant variable in any study year. From 2003 to 2012, there was a noted increase in the percent of unmarried respondents reporting diabetes.
• In all study years, overweight respondents were more likely to report diabetes. • In 2006, 2009 and 2012, inactive respondents were more likely to report diabetes. From 2006 to 2012, there was
a noted increase in the percent of respondents who did an insufficient amount of physical activity reporting diabetes.
• In 2003 and 2009, nonsmokers were more likely to report diabetes. In all other study years, smoking status was
not a significant variable. From 2003 to 2012, there was a noted increase in the percent of smokers reporting diabetes.

Milwaukee Community Health Survey Report—2012 68
Table 23. Diabetes in Past Three Years by Demographic Variables for Each Survey Year,
2003 2006 2009 2012 TOTALa 7% 8% 10% 10% Gender Malea 7 7 9 11 Female 7 9 11 10 Age1,2,3,4 18 to 24a 0 <1 <1 2 25 to 34 2 2 <1 2 35 to 44 4 7 7 6 45 to 54a 6 13 14 15 55 to 64 17 16 23 20 65 and Older 22 16 26 25 Race1,4 White 6 7 11 7 African American 10 10 10 14 Other 4 7 5 7 Hispanic Origin1 Hispanica 1 8 6 8 Non-Hispanica 7 8 10 10 Education1,2,3,4 High School or Lessa 7 10 12 14 Some Post High School 9 7 7 9
College Graduate 4 6 8 6 Household Income1,2,4 Bottom 40 Percent Bracketa 9 9 11 12 Middle 20 Percent Bracket 6 6 9 8 Top 40 Percent Bracket 3 6 5 3 Marital Status Married 6 8 9 10 Not Marrieda 8 8 10 10 Overweight Status1,2,3,4 Not Overweight 2 2 3 4 Overweight 10 11 13 13 Physical Activity2,3,4 Inactive -- 14 16 16 Insufficientb -- 9 11 12 Recommended -- 5 6 6 Smoking Status1,3 Nonsmoker 8 8 11 10 Smokera 5 7 7 10
Percentages occasionally may differ by 1 or 2 percentage points from previous reports or the Appendix as a result of rounding, recoding variables and response category distribution. Physical activity was defined differently in 2003. 1demographic difference at p≤0.05 in 2003; 2demographic difference at p≤0.05 in 2006 3demographic difference at p≤0.05 in 2009; 4demographic difference at p≤0.05 in 2012 ayear difference at p≤0.05 from 2003 to 2012 byear difference at p≤0.05 from 2006 to 2012
Milwaukee Community Health Survey Report—2012 69
Current Asthma In 2010, 8% of Wisconsin respondents and 9% of U.S. respondents reported they were told they currently have asthma (2010 Behavioral Risk Factor Surveillance). 2012 Findings • Fourteen percent of respondents reported they currently have asthma. • Female respondents were more likely to report current asthma (18%) compared to male respondents (8%).
• Eighteen percent of respondents 45 to 54 years old reported current asthma compared to 10% of those 65 and
older or 8% of respondents 25 to 34 years old.
• Seventeen percent of respondents who were non-white and non-African American and 16% of African American respondents reported current asthma compared to 10% of white respondents.
• Sixteen percent of respondents with a high school education or less and 15% of those with some post high
school education reported current asthma compared to 8% of respondents with a college education.
• Eighteen percent of respondents in the bottom 40 percent household income bracket reported current asthma compared to 7% of those in the top 40 percent income bracket or 3% of respondents in the middle 20 percent household income bracket.
• Unmarried respondents were more likely to report current asthma compared to married respondents (15% and
9%, respectively).
o Of the 162 respondents who reported current asthma, 93% had it under control through medication, exercise or lifestyle changes.
Year Comparisons • From 2003 to 2012, there was a statistical increase in the overall percent of respondents who reported current
asthma. • In all study years, female respondents were more likely to report current asthma, with a noted increase in 2012. • In 2006, respondents who were 18 to 34 years old or 55 to 64 years old were more likely to report current
asthma. In 2012, respondents 45 to 54 years old were more likely to report current asthma. In all other study years, age was not a significant variable. From 2003 to 2012, there was a noted increase in the percent of respondents 35 to 54 years old reporting current asthma.
• In 2003, respondents who were non-white and non-African American were more likely to report current
asthma. In 2009, African American respondents were more likely to report current asthma. In 2012, respondents who were non-white were more likely to report current asthma. In 2006, race was not a significant variable. From 2003 to 2012, there was a noted increase in the percent of African American respondents reporting current asthma.
• In 2003, Hispanic respondents were more likely to report current asthma. In all other study years, Hispanic
origin was not a significant variable. From 2003 to 2012, there was a noted increase in the percent of non-Hispanic respondents reporting current asthma.

Milwaukee Community Health Survey Report—2012 70
• In 2009, respondents with a high school education or less were more likely to report current asthma. In 2012, respondents with some post high school education or less were more likely to report current asthma, with a noted increase since 2003. In all other study years, education was not a significant variable.
• In 2006, 2009 and 2012, respondents in the bottom 40 percent household income bracket were more likely to
report current asthma. In 2003, household income was not a significant variable. From 2003 to 2012, there was a noted increase in the percent of respondents in the bottom 40 percent household income bracket and a noted decrease in the percent of respondents in the middle 20 percent household income bracket reporting current asthma.
• In 2003, 2006 and 2012, unmarried respondents were more likely to report current asthma. In 2009, marital
status was not a significant variable. From 2003 to 2012, there was a noted increase in the percent of unmarried respondents reporting current asthma.
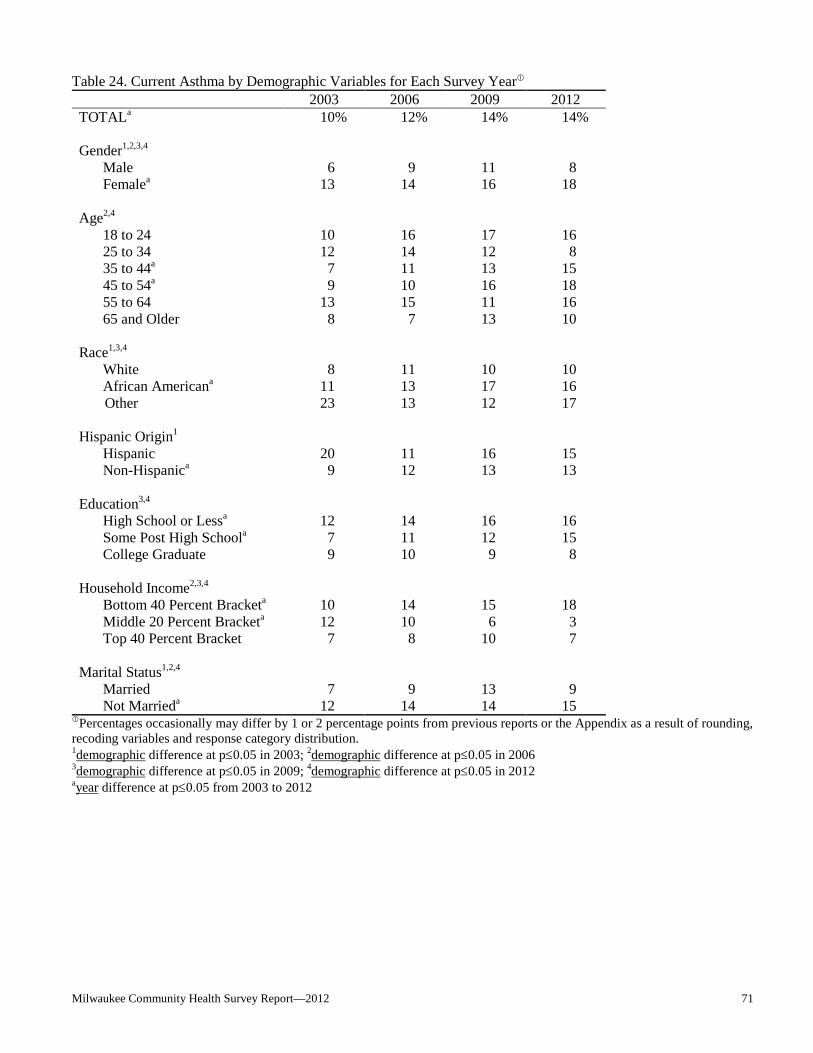
Milwaukee Community Health Survey Report—2012 71
Table 24. Current Asthma by Demographic Variables for Each Survey Year
2003 2006 2009 2012 TOTALa 10% 12% 14% 14% Gender1,2,3,4 Male 6 9 11 8 Femalea 13 14 16 18 Age2,4 18 to 24 10 16 17 16 25 to 34 12 14 12 8 35 to 44a 7 11 13 15 45 to 54a 9 10 16 18 55 to 64 13 15 11 16 65 and Older 8 7 13 10 Race1,3,4 White 8 11 10 10 African Americana 11 13 17 16 Other 23 13 12 17 Hispanic Origin1 Hispanic 20 11 16 15 Non-Hispanica 9 12 13 13 Education3,4 High School or Lessa 12 14 16 16 Some Post High Schoola 7 11 12 15
College Graduate 9 10 9 8 Household Income2,3,4 Bottom 40 Percent Bracketa 10 14 15 18 Middle 20 Percent Bracketa 12 10 6 3 Top 40 Percent Bracket 7 8 10 7 Marital Status1,2,4 Married 7 9 13 9 Not Marrieda 12 14 14 15
Percentages occasionally may differ by 1 or 2 percentage points from previous reports or the Appendix as a result of rounding, recoding variables and response category distribution.
1demographic difference at p≤0.05 in 2003; 2demographic difference at p≤0.05 in 2006 3demographic difference at p≤0.05 in 2009; 4demographic difference at p≤0.05 in 2012 ayear difference at p≤0.05 from 2003 to 2012

Milwaukee Community Health Survey Report—2012 72
Cancer 2012 Findings • Three percent of respondents reported they had cancer in the past three years.
o Breast cancer was most often mentioned (11 responses) followed by melanoma/skin cancer (8 responses). Five respondents reported prostate cancer while three respondents reported cervical cancer.
Year Comparisons • From 2009 to 2012, there was no statistical change in the overall percent of respondents who reported they had
cancer in the past three years. Stroke 2012 Findings • Two percent of respondents reported a stroke in the past three years. • No demographic comparisons were conducted as a result of the low percent of respondents reporting a stroke in
the past three years.
o Of the 24 respondents who reported a stroke, 96% had it under control through medication, exercise or lifestyle changes.
Year Comparisons • From 2003 to 2012, there was no statistical change in the overall percent of respondents reporting a stroke. • No demographic comparisons were conducted between years as a result of the low percent of respondents
reporting a stroke in all study years.

Milwaukee Community Health Survey Report—2012 73
Health Conditions Overall Year Comparisons • From 2003 to 2012, there was a statistical increase in the overall percent of respondents who reported high
blood pressure, diabetes or current asthma. From 2003 to 2012, there was no statistical change in the overall percent of respondents who reported high blood cholesterol, heart disease/condition or stroke. From 2009 to 2012, there was no statistical change in the overall percent of respondents who reported a mental health condition or cancer.
Figure 9. Health Conditions in Past Three Years
23%
27%29% 29%
19%21%21%
17%
9%9%8%
7%
16%14%
10%10%
12% 14%10%
3%
2%
3% 3%2%
0%
20%
40%
2003 2006 2009 2012
High Blood Pressure
High Blood Cholesterol
Heart Disease/Condition
Mental Health Condition
Diabetes
Asthma (current)
Cancer
Stroke
Milwaukee Community Health Survey Report—2012 74
Physical Well Being and Body Weight (Figures 10 & 11; Tables 25 - 28) KEY FINDINGS: In 2012, 33% of respondents did moderate physical activity five times a week for 30 minutes
while 25% did vigorous activity three times a week for 20 minutes. Combined, 46% met the recommended amount of physical activity; respondents who were 18 to 34 years old, non-white and non-African American, Hispanic, with at least some post high school education or unmarried respondents were more likely to report this. Sixty-six percent of respondents were classified as overweight. Respondents who were 45 to 54 years old, African American or Hispanic were more likely to be classified as overweight.
From 2003 to 2012, there was a statistical increase in the overall percent of respondents who reported moderate physical activity five times a week for at least 30 minutes. From 2006 to 2012, there was a statistical increase in the overall percent of respondents who reported vigorous physical activity three times a week for at least 20 minutes. From 2006 to 2012, there was no statistical change in the overall percent of respondents who met the recommended amount of physical activity. From 2003 to 2012, there was a statistical increase in the overall percent of respondents being overweight.
Moderate Physical Activity in Usual Week Moderate physical activity includes walking briskly, vacuuming, gardening or anything else that causes small increases in breathing or heart rate. In 2005, 42% of Wisconsin respondents and 33% of U.S. respondents did moderate physical activity at least five times a week for 30 or more minutes (2005 Behavioral Risk Factor Surveillance). 2012 Findings • Thirty-three percent of all respondents did moderate physical activity at least five times a week for 30 minutes
or more. Forty-eight percent did some moderate activity, while 17% did not do any moderate physical activity. • Respondents who were non-white and non-African American were more likely to meet the recommended
amount of moderate physical activity (42%) compared to white respondents (35%) or African American respondents (29%).
• Unmarried respondents were more likely to meet the recommended amount of moderate physical activity
compared to married respondents (35% and 29%, respectively).
Year Comparisons • From 2003 to 2012, there was a statistical increase in the overall percent of respondents who did the
recommended amount of moderate physical activity in a week. • Gender was not a significant variable in any study year. From 2003 to 2012, there was a noted increase in the
percent of female respondents meeting the recommended amount of moderate physical activity.

Milwaukee Community Health Survey Report—2012 75
• In 2003, respondents 18 to 24 years old were more likely to meet the recommended amount of moderate physical activity. In 2006, respondents 35 to 44 years old were more likely to meet the recommended amount of moderate physical activity. In 2009, respondents 18 to 34 years old were more likely to meet this. In 2012, age was not a significant variable. From 2003 to 2012, there was a noted increase in the percent of respondents who were 25 to 34 years old or 65 and older meeting the recommended amount of physical activity.
• In 2003 and 2012, respondents who were non-white and non-African American were more likely to meet the
recommended amount of moderate physical activity. In all other study years, race was not a significant variable. From 2003 to 2012, there was a noted increase in the percent of white respondents meeting the recommended amount of moderate physical activity.
• In 2003, Hispanic respondents were more likely to meet the recommended amount of moderate physical
activity. In 2006, non-Hispanic respondents were more likely to meet the recommended amount of moderate physical activity. In all other study years, Hispanic origin was not a significant variable. From 2003 to 2012, there was a noted increase in the percent of non-Hispanic respondents meeting the recommended amount of moderate physical activity.
• In 2006, respondents with a college education were more likely to meet the recommended amount of moderate
physical activity. In all other study years, education was not a significant variable. From 2003 to 2012, there was a noted increase in the percent of respondents with some post high school education or less meeting the recommended amount of moderate physical activity.
• In 2006, respondents in the top 60 percent household income bracket were more likely to meet the recommended amount of moderate physical activity. In all other study years, household income was not a significant variable. From 2003 to 2012, there was a noted increase in the percent of respondents in the bottom 40 percent household income bracket meeting the recommended amount of moderate physical activity.
• In 2012, unmarried respondents were more likely to meet the recommended amount of moderate physical
activity, with a noted increase since 2003. In all other study years, marital status was not a significant variable. • In 2006 and 2009, respondents who were not overweight were more likely to meet the recommended amount of
moderate physical activity. In all other study years, overweight status was not a significant variable. From 2003 to 2012, there was a noted increase in the percent of respondents across overweight status meeting the recommended amount of moderate physical activity.

Milwaukee Community Health Survey Report—2012 76
Table 25. Recommended Moderate Physical Activity by Demographic Variables for Each Survey Year, 2003 2006 2009 2012 TOTALa 27% 33% 31% 33% Gender Male 29 32 30 31 Femalea 25 33 31 35 Age1,2,3 18 to 24 31 29 35 34 25 to 34a 29 29 36 38 35 to 44 29 40 32 33 45 to 54 28 36 26 30 55 to 64 24 33 25 31 65 and Oldera 15 29 23 32 Race1,4 Whitea 23 34 30 35 African American 29 32 31 29 Other 45 28 34 42 Hispanic Origin1,2 Hispanic 45 25 30 36 Non-Hispanica 25 33 31 33 Education2 High School or Lessa 25 30 30 32 Some Post High Schoola 25 33 32 35
College Graduate 32 37 31 34 Household Income2 Bottom 40 Percent Bracketa 25 28 31 36 Middle 20 Percent Bracket 30 41 31 35 Top 40 Percent Bracket 27 41 29 30 Marital Status4 Married 27 35 32 29 Not Marrieda 27 31 30 35 Overweight Status2,3 Not Overweighta 28 36 38 37 Overweighta 25 31 28 32
Percentages occasionally may differ by 1 or 2 percentage points from previous reports or the Appendix as a result of rounding, recoding variables and response category distribution.
Recommended moderate physical activity is 5 times/30+ minutes in a week. 1demographic difference at p≤0.05 in 2003; 2demographic difference at p≤0.05 in 2006 3demographic difference at p≤0.05 in 2009; 4demographic difference at p≤0.05 in 2012 ayear difference at p≤0.05 from 2003 to 2012

Milwaukee Community Health Survey Report—2012 77
Vigorous Physical Activity in Usual Week Vigorous physical activity includes running, aerobics, heavy yard work, or anything else that causes large increases in breathing or heart rate. In 2009, 31% of Wisconsin respondents and 29% of U.S. respondents did vigorous physical activity at least three times a week for 20 or more minutes (2009 Behavioral Risk Factor Surveillance). 2012 Findings • Twenty-five percent of respondents reported they did vigorous physical activity at least three times a week for
20 minutes or more. Twenty percent did some vigorous physical activity while 55% did not do any vigorous physical activity.
• Male respondents were more likely to report vigorous physical activity (29%) compared to female respondents
(21%).
• Respondents 18 to 24 years old were more likely to report vigorous physical activity (39%) compared to those 55 to 64 years old (12%) or respondents 65 and older (7%).
• Hispanic respondents were more likely to report vigorous physical activity compared to non-Hispanic
respondents (32% and 24%, respectively).
• Thirty-three percent of respondents with a college education reported vigorous physical activity compared to 26% of those with some post high school education or 19% of respondents with a high school education or less.
• Unmarried respondents were more likely to report vigorous physical activity compared to married respondents
(27% and 18%, respectively).
Year Comparisons • From 2006 to 2012, there was a statistical increase in the overall percent of respondents who did the
recommended amount of vigorous physical activity in a week. • In all study years, male respondents were more likely to meet the recommended amount of vigorous physical
activity. From 2006 to 2012, there was a noted increase in the percent of female respondents meeting the recommended amount of vigorous physical activity.
• In 2006 and 2012, respondents 18 to 24 years old were more likely to meet the recommended amount of
vigorous physical activity. In 2009, respondents 18 to 34 years old were more likely to meet the recommended amount of vigorous physical activity. From 2006 to 2012, there was a noted increase in the percent of respondents 18 to 34 years old meeting the recommended amount of vigorous physical activity.
• In 2006, respondents who were non-African American were more likely to meet the recommended amount of
vigorous physical activity. In all other study years, race was not a significant variable. From 2006 to 2012, there was a noted increase in the percent of African American respondents meeting the recommended amount of vigorous physical activity.

Milwaukee Community Health Survey Report—2012 78
• In 2012, Hispanic respondents were more likely to meet the recommended amount of vigorous physical activity. In all other study years, Hispanic origin was not a significant variable. From 2006 to 2012, there was a noted increase in the percent of respondents across Hispanic origin meeting the recommended amount of vigorous physical activity.
• In 2006 and 2012, respondents with a college education were more likely to meet the recommended amount of
vigorous physical activity. In 2009, respondents with at least some post high school education were more likely to meet the recommended amount of vigorous physical activity. From 2006 to 2012, there was a noted increase in the percent of respondents with a high school education or less meeting the recommended amount of vigorous physical activity.
• In 2006 and 2009, respondents in the top 40 percent household income bracket were more likely to meet the
recommended amount of vigorous physical activity. In 2012, household income was not a significant variable. From 2006 to 2012, there was a noted increase in the percent of respondents in the bottom 40 percent household income bracket meeting the recommended amount of vigorous physical activity.
• In 2012, unmarried respondents were more likely to meet the recommended amount of vigorous physical activity, with a noted increase since 2006. In all other study years, marital status was not a significant variable.
• In 2006, respondents who were not overweight were more likely to meet the recommended amount of vigorous
physical activity. In all other study years, overweight status was not a significant variable. From 2006 to 2012, there was a noted increase in the percent of overweight respondents meeting the recommended amount of vigorous physical activity.

Milwaukee Community Health Survey Report—2012 79
Table 26. Recommended Vigorous Physical Activity by Demographic Variables for Each Survey Year, 2006 2009 2012 TOTALa 20% 18% 25% Gender1,2,3 Male 26 27 29 Femalea 15 11 21 Age1,2,3 18 to 24a 31 25 39 25 to 34a 22 27 35 35 to 44 25 18 28 45 to 54 17 17 14 55 to 64 16 8 12 65 and Older 7 6 7 Race1 White 23 21 25 African Americana 16 16 23 Other 23 23 30 Hispanic Origin3 Hispanica 22 19 32 Non-Hispanica 20 18 24 Education1,2,3 High School or Lessa 15 13 19 Some Post High School 20 24 26
College Graduate 30 23 33 Household Income1,2 Bottom 40 Percent Bracketa 17 16 23 Middle 20 Percent Bracket 22 21 21 Top 40 Percent Bracket 35 28 30 Marital Status3 Married 21 21 18 Not Marrieda 20 17 27 Overweight Status1 Not Overweight 23 21 26 Overweighta 19 17 24
Percentages occasionally may differ by 1 or 2 percentage points from previous reports or the Appendix as a result of rounding, recoding variables and response category distribution.
Recommended vigorous physical activity is 3 times/20+ minutes in a week. 1demographic difference at p≤0.05 in 2006; 2demographic difference at p≤0.05 in 2009 3demographic difference at p≤0.05 in 2012 ayear difference at p≤05 from 2006 to 2012

Milwaukee Community Health Survey Report—2012 80
Combined Recommended Amount of Physical Activity in Typical Week The recommended amount of physical activity by the Centers for Disease Control is moderate physical activity for at least 30 minutes on five or more days of the week or vigorous physical activity for at least 20 minutes on three or more days of the week. Moderate physical activity includes walking briskly, vacuuming, gardening or anything else that causes small increases in breathing or heart rate. Vigorous physical activity includes running, aerobics, heavy yard work, or anything else that causes large increases in breathing or heart rate. Insufficient physical activity includes participation in either activity, but not for the duration or the frequency recommended. Inactive respondents reported no moderate or vigorous physical activity in a typical week. In 2009, 53% of Wisconsin respondents and 51% of U.S. respondents met the recommended amount of physical activity (30+ minutes of moderate physical activity five days per week or 20+ minutes of vigorous physical activity three days per week) (2009 Behavioral Risk Factor Surveillance). 2012 Findings • Forty-six percent of respondents reported meeting the recommended amount of physical activity in a typical week
(moderate activity 5 times/week for 30 minutes or vigorous activity 3 times/week for 20 minutes). Forty percent did an insufficient amount of physical activity while 14% did no physical activity in a typical week.
*Recommended physical activity is moderate activity 5 times/30+ minutes in a week or vigorous activity 3 times/20+ minutes in a week. • Fifty-six percent of respondents 25 to 34 years and 55% of those 18 to 24 years old met the recommended
amount of physical activity compared to 35% of respondents 65 and older.
• Respondents who were non-white and non-African American were more likely to meet the recommended amount of physical activity (54%) compared to white respondents (48%) or African American respondents (42%).
• Hispanic respondents were more likely to meet the recommended amount of physical activity compared to non-
Hispanic respondents (56% and 45%, respectively).
• Fifty-one percent of respondents with a college education and 49% of those with some post high school education met the recommended amount of physical activity compared to 41% of respondents with a high school education or less.
Figure 10. Physical Activity/Week for 2012*
Inactive14%
Insufficient40%
Recommended46%

Milwaukee Community Health Survey Report—2012 81
• Unmarried respondents were more likely to meet the recommended amount of physical activity compared to married respondents (50% and 38%, respectively).
Year Comparisons • From 2006 to 2012, there was no statistical change in the overall percent of respondents who met the
recommended amount of physical activity in a week. • In 2006, male respondents were more likely to meet the recommended amount of physical activity. In all other
study years, gender was not a significant variable. From 2006 to 2012, there was a noted increase in the percent of female respondents meeting the recommended amount of physical activity.
• In 2006, respondents 35 to 44 years old were more likely to meet the recommended amount of physical activity.
In 2009 and 2012, respondents 18 to 34 years old were more likely to meet the recommended amount of physical activity. From 2006 to 2012, there was a noted increase in the percent of respondents 25 to 34 years old meeting the recommended amount of physical activity.
• In 2006, white respondents were more likely to meet the recommended amount of physical activity. In 2012,
respondents who were non-white and non-African American were more likely to meet the recommended amount of physical activity, with a noted increase since 2006. In 2009, race was not a significant variable.
• In 2012, Hispanic respondents were more likely to meet the recommended amount of physical activity, with a
noted increase since 2006. In all other study years, Hispanic origin was not a significant variable.
• In 2006, respondents with a college education were more likely to meet the recommended amount of physical activity. In 2012, respondents with at least some post high school education were more likely to meet the recommended amount of physical activity. In 2009, education was not a significant variable.
• In 2006, respondents in the top 40 percent household income bracket were more likely to meet the
recommended amount of physical activity. In all other study years, household income was not a significant variable. From 2006 to 2012, there was a noted increase in the percent of respondents in the bottom 40 percent household income bracket and a noted decrease in the percent of respondents in the top 40 percent household income bracket meeting the recommended amount of physical activity.
• In 2012, unmarried respondents were more likely to meet the recommended amount of physical activity, with a
noted increase since 2006. In all other study years, marital status was not a significant variable. From 2006 to 2012, there was a noted decrease in the percent of married respondents meeting the recommended amount of physical activity.
• In 2006 and 2009, respondents who were not overweight were more likely to meet the recommended amount of
physical activity. In 2012, overweight status was not a significant variable.
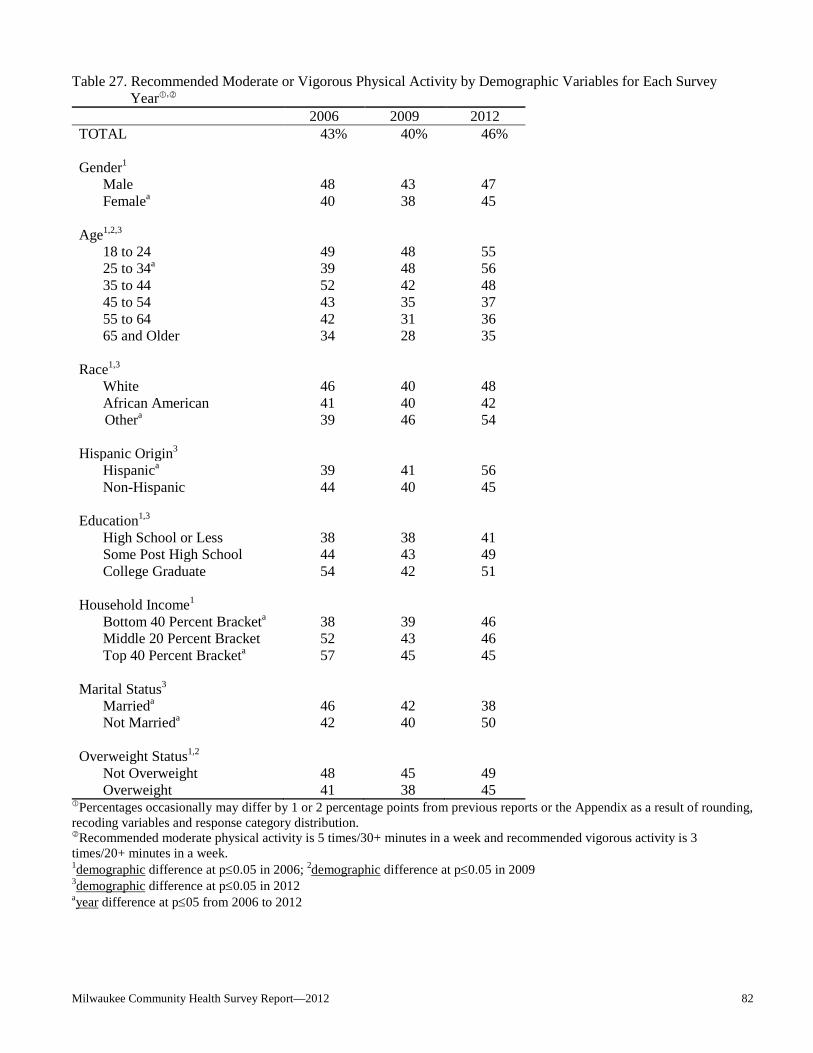
Milwaukee Community Health Survey Report—2012 82
Table 27. Recommended Moderate or Vigorous Physical Activity by Demographic Variables for Each Survey Year,
2006 2009 2012 TOTAL 43% 40% 46% Gender1 Male 48 43 47 Femalea 40 38 45 Age1,2,3 18 to 24 49 48 55 25 to 34a 39 48 56 35 to 44 52 42 48 45 to 54 43 35 37 55 to 64 42 31 36 65 and Older 34 28 35 Race1,3 White 46 40 48 African American 41 40 42 Othera 39 46 54 Hispanic Origin3 Hispanica 39 41 56 Non-Hispanic 44 40 45 Education1,3 High School or Less 38 38 41 Some Post High School 44 43 49
College Graduate 54 42 51 Household Income1 Bottom 40 Percent Bracketa 38 39 46 Middle 20 Percent Bracket 52 43 46 Top 40 Percent Bracketa 57 45 45 Marital Status3 Marrieda 46 42 38 Not Marrieda 42 40 50 Overweight Status1,2 Not Overweight 48 45 49 Overweight 41 38 45
Percentages occasionally may differ by 1 or 2 percentage points from previous reports or the Appendix as a result of rounding, recoding variables and response category distribution.
Recommended moderate physical activity is 5 times/30+ minutes in a week and recommended vigorous activity is 3 times/20+ minutes in a week. 1demographic difference at p≤0.05 in 2006; 2demographic difference at p≤0.05 in 2009 3demographic difference at p≤0.05 in 2012 ayear difference at p≤05 from 2006 to 2012

Milwaukee Community Health Survey Report—2012 83
Body Weight Being overweight contributes to many health problems. One nationally used definition of overweight status developed by the CDC is when a person’s body mass index (BMI) is greater than or equal to 25.0. A BMI of 30.0 or more is considered obese. Body Mass Index is calculated by using kilograms/meter2. Throughout the report, the category “overweight” includes both overweight and obese respondents. The Healthy People 2020 goal for healthy weight is 34%. As a result, the unhealthy weight goal is 66%. (Objective NWS-8) The Healthy People 2020 goal for obesity is 31%. (Objective NWS-9) In 2010, 64% of Wisconsin respondents were classified as at least overweight (37% overweight, 27% obese). In the U.S., 64% were classified as at least overweight (36% overweight and 28% obese) (2010 Behavioral Risk Factor Surveillance). 2012 Findings • According to the definition, 66% of respondents were overweight. • Respondents 45 to 54 years old were more likely to be overweight (80%) compared to respondents 18 to 24
years old (47%).
• African American respondents were more likely to be overweight (72%) compared to respondents who were non-white and non-African American (67%) or white respondents (60%).
• Hispanic respondents were more likely to be overweight compared to non-Hispanic respondents (75% and 65%,
respectively). Year Comparisons • From 2003 to 2012, there was a statistical increase in the overall percent of respondents being overweight. • Gender was not a significant variable in any study year. From 2003 to 2012, there was a noted increase in the
percent of female respondents being overweight. • In 2003, respondents 55 to 64 years old were more likely to be overweight. In 2006, respondents 45 to 64 years
old were more likely to be overweight. In 2009, respondents 35 to 64 years old were more likely to be overweight. In 2012, respondents 45 to 54 years old were more likely to be overweight, with a noted increase since 2003.
• In 2003 and 2012, African American respondents were more likely to be overweight. In 2006, respondents who
were non-white and non-African American were more likely to be overweight. In 2009, respondents who were non-white were more likely to be overweight.
• In 2003, 2006 and 2012, Hispanic respondents were more likely to be overweight. In 2009, Hispanic origin was
not a significant variable.
• In 2006, respondents with a high school education or less were more likely to be overweight. In all other study years, education was not a significant variable.
Milwaukee Community Health Survey Report—2012 84
• In 2003, respondents in the middle 20 percent household income bracket were more likely to be overweight. In 2006, respondents in the bottom 40 percent household income bracket were more likely to be overweight. In all other study years, household income was not a significant variable. From 2003 to 2012, there was a noted increase in the percent of respondents in the top 40 percent household income bracket being overweight.
• Marital status was not a significant variable in any study year. From 2003 to 2012, there was a noted increase in
the percent of unmarried respondents being overweight. • In 2006, respondents who did not meet the recommended amount of physical activity were more likely to be
overweight. In 2009, inactive respondents were more likely to be overweight. In 2012, physical activity was not a significant variable.
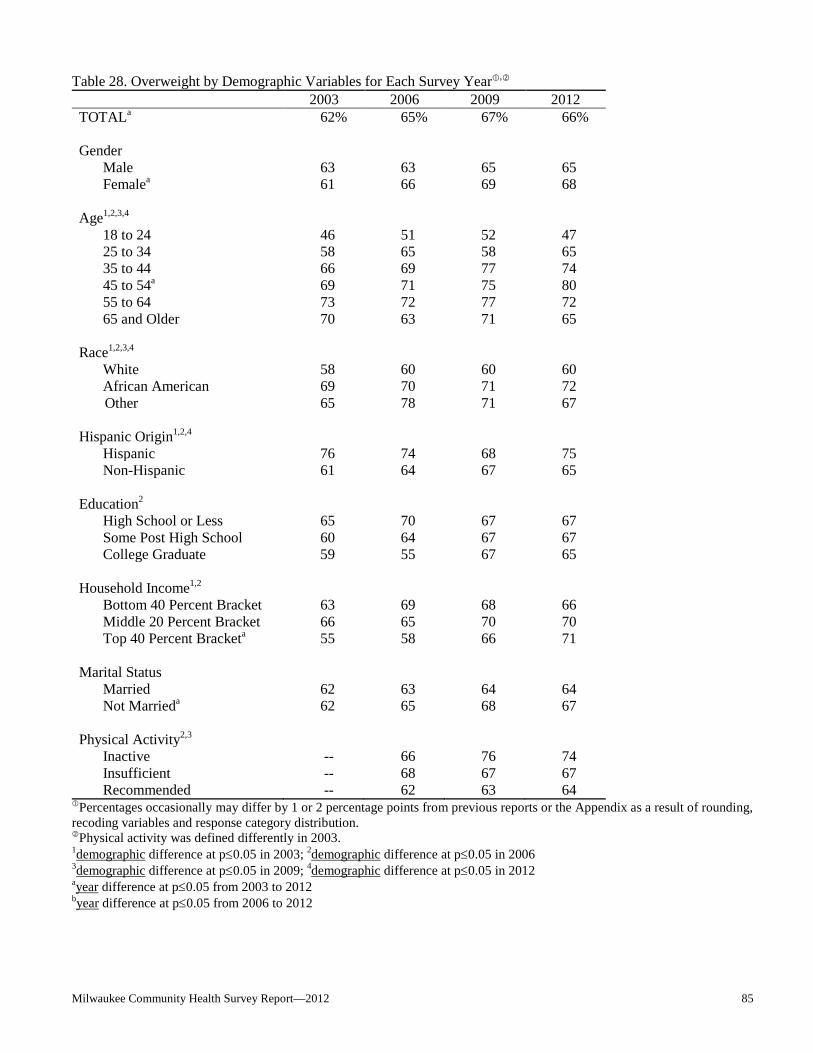
Milwaukee Community Health Survey Report—2012 85
Table 28. Overweight by Demographic Variables for Each Survey Year, 2003 2006 2009 2012 TOTALa 62% 65% 67% 66% Gender Male 63 63 65 65 Femalea 61 66 69 68 Age1,2,3,4 18 to 24 46 51 52 47 25 to 34 58 65 58 65 35 to 44 66 69 77 74 45 to 54a 69 71 75 80 55 to 64 73 72 77 72 65 and Older 70 63 71 65 Race1,2,3,4 White 58 60 60 60 African American 69 70 71 72 Other 65 78 71 67 Hispanic Origin1,2,4 Hispanic 76 74 68 75 Non-Hispanic 61 64 67 65 Education2 High School or Less 65 70 67 67 Some Post High School 60 64 67 67
College Graduate 59 55 67 65 Household Income1,2 Bottom 40 Percent Bracket 63 69 68 66 Middle 20 Percent Bracket 66 65 70 70 Top 40 Percent Bracketa 55 58 66 71 Marital Status Married 62 63 64 64 Not Marrieda 62 65 68 67 Physical Activity2,3 Inactive -- 66 76 74 Insufficient -- 68 67 67 Recommended -- 62 63 64
Percentages occasionally may differ by 1 or 2 percentage points from previous reports or the Appendix as a result of rounding, recoding variables and response category distribution.
Physical activity was defined differently in 2003. 1demographic difference at p≤0.05 in 2003; 2demographic difference at p≤0.05 in 2006 3demographic difference at p≤0.05 in 2009; 4demographic difference at p≤0.05 in 2012 ayear difference at p≤0.05 from 2003 to 2012 byear difference at p≤0.05 from 2006 to 2012

Milwaukee Community Health Survey Report—2012 86
Physical Well Being and Body Weight Overall Year Comparisons • From 2003 to 2012, there was a statistical increase in the overall percent of respondents who reported moderate
physical activity five times a week for at least 30 minutes. From 2006 to 2012, there was a statistical increase in the overall percent of respondents who reported vigorous physical activity three times a week for at least 20 minutes. From 2006 to 2012, there was no statistical change in the overall percent of respondents who met the recommended amount of physical activity. From 2003 to 2012, there was a statistical increase in the overall percent of respondents being overweight.
Nutrition (Figure 12; Tables 29 & 30) KEY FINDINGS: In 2012, 61% of respondents reported two or more servings of fruit while 25% reported three or
more servings of vegetables on an average day. Respondents who were female, non-African American, Hispanic or who met the recommended amount of physical activity were more likely to report at least two servings of fruit. Respondents who were female, 35 to 44 years old, non-Hispanic, with a college education, in the top 40 percent household income bracket or overweight were more likely to report at least three servings of vegetables on an average day.
From 2003 to 2012, there was no statistical change in the overall percent of respondents who reported at least two servings of fruit on an average day. From 2003 to 2012, there was a statistical decrease in the overall percent of respondents who reported at least three servings of vegetables on an average day.
Figure 11. Physical Well Being and Body Weight
66%67%65%62%
33%33%
27% 31%
20% 18%25%
46%43% 40%
0%
20%
40%
60%
80%
100%
2003 2006 2009 2012
Overweight
Moderate Activity (5x/30+min/week)Vigorous Activity (3x/20+min/week)
Recommended PhysicalActivity (Mod or Vig)

Milwaukee Community Health Survey Report—2012 87
Fruit Consumption Based on the USDA dietary guidelines, at a minimum, adults should have two servings of fruit each day. Age, gender and activity level may increase the recommended number of servings. 2012 Findings • Sixty-one percent of respondents reported at least two servings of fruit on an average day. • Female respondents were more likely to report at least two servings of fruit a day (64%) compared to male
respondents (57%).
• Sixty-five percent of respondents who were non-white and non-African American and 64% of white respondents reported at least two servings of fruit a day compared to 57% of African American respondents.
• Hispanic respondents were more likely to report at least two servings of fruit a day compared to non-Hispanic
respondents (68% and 60%, respectively).
• Sixty-four percent of respondents who met the recommended amount of physical activity reported at least two servings of fruit a day compared to 59% of those who did an insufficient amount of physical activity or 52% of inactive respondents.
Year Comparisons • From 2003 to 2012, there was no statistical change in the overall percent of respondents who reported two or
more servings of fruit on an average day. • In all study years, female respondents were more likely to report at least two servings of fruit per day. • In 2003 and 2009, respondents 25 to 34 years old were more likely to report at least two servings of fruit per
day. In 2006, respondents 18 to 24 years old were more likely to report at least two servings of fruit per day. In 2012, age was not a significant variable. From 2003 to 2012, there was a noted increase in the percent of respondents 18 to 24 years old and a noted decrease in the percent of respondents 25 to 34 years old or 65 and older reporting at least two or more servings of fruit.
• In 2006 and 2012, respondents who were non-African American were more likely to report at least two servings
of fruit per day. In 2009, respondents who were white or African American were more likely to report at least two servings of fruit per day. In 2003, race was not a significant variable.
• In 2012, Hispanic respondents were more likely to report at least two servings of fruit per day. In all other study
years, Hispanic origin was not a significant variable.
• In 2003, 2006 and 2009, respondents with a college education were more likely to report two or more servings of fruit. In 2012, education was not a significant variable. From 2003 to 2012, there was a noted decrease in the percent of respondents with a college education reporting at least two or more servings of fruit.
• In 2006 and 2009, respondents in the top 40 percent household income bracket were more likely to report at
least two servings of fruit. In all other study years, household income was not a significant variable.
Milwaukee Community Health Survey Report—2012 88
• In 2003, married respondents were more likely to report at least two servings of fruit. In all other study years, marital status was not a significant variable. From 2003 to 2012, there was a noted decrease in the percent of married respondents reporting at least two or more servings of fruit.
• In 2006, respondents who did at least some amount of physical activity were more likely to report at least two
servings of fruit. In 2009 and 2012, respondents who met the recommended amount of physical activity were more likely to report at least two servings of fruit. From 2006 to 2012, there was a noted increase in the percent of inactive respondents reporting at least two or more servings of fruit.
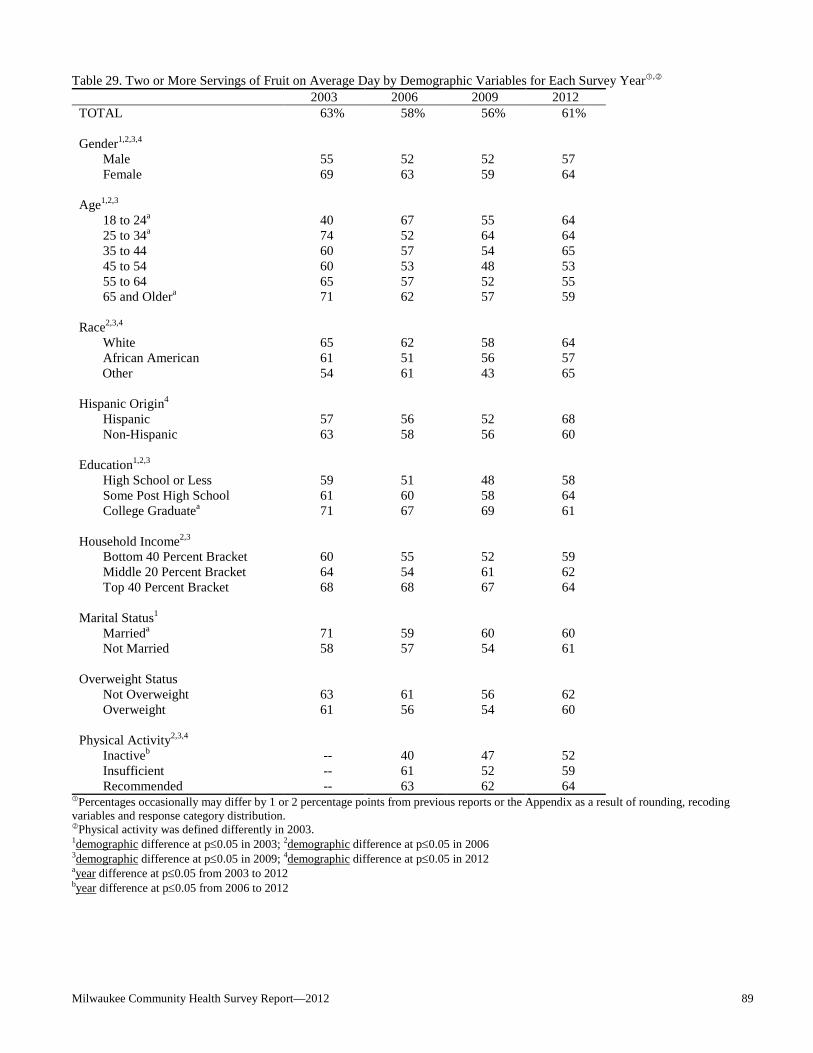
Milwaukee Community Health Survey Report—2012 89
Table 29. Two or More Servings of Fruit on Average Day by Demographic Variables for Each Survey Year,
2003 2006 2009 2012 TOTAL 63% 58% 56% 61% Gender1,2,3,4 Male 55 52 52 57 Female 69 63 59 64 Age1,2,3 18 to 24a 40 67 55 64 25 to 34a 74 52 64 64 35 to 44 60 57 54 65 45 to 54 60 53 48 53 55 to 64 65 57 52 55 65 and Oldera 71 62 57 59 Race2,3,4 White 65 62 58 64 African American 61 51 56 57 Other 54 61 43 65 Hispanic Origin4 Hispanic 57 56 52 68 Non-Hispanic 63 58 56 60 Education1,2,3 High School or Less 59 51 48 58 Some Post High School 61 60 58 64
College Graduatea 71 67 69 61 Household Income2,3 Bottom 40 Percent Bracket 60 55 52 59 Middle 20 Percent Bracket 64 54 61 62 Top 40 Percent Bracket 68 68 67 64 Marital Status1 Marrieda 71 59 60 60 Not Married 58 57 54 61 Overweight Status Not Overweight 63 61 56 62 Overweight 61 56 54 60 Physical Activity2,3,4 Inactiveb -- 40 47 52 Insufficient -- 61 52 59 Recommended -- 63 62 64
Percentages occasionally may differ by 1 or 2 percentage points from previous reports or the Appendix as a result of rounding, recoding variables and response category distribution. Physical activity was defined differently in 2003. 1demographic difference at p≤0.05 in 2003; 2demographic difference at p≤0.05 in 2006 3demographic difference at p≤0.05 in 2009; 4demographic difference at p≤0.05 in 2012 ayear difference at p≤0.05 from 2003 to 2012 byear difference at p≤0.05 from 2006 to 2012

Milwaukee Community Health Survey Report—2012 90
Vegetable Consumption Based on the USDA dietary guidelines, at a minimum, adults should have three servings of vegetables each day. Age, gender and activity level may increase the recommended number of servings. 2012 Findings • Twenty-five percent of respondents reported three or more servings of vegetables on an average day. • Female respondents were more likely to report at least three servings of vegetables a day (28%) compared to
male respondents (22%). • Respondents 35 to 44 years old were more likely to report at least three servings of vegetables a day (40%)
compared to those 18 to 24 years old (19%) or respondents 55 to 64 years old (17%).
• Non-Hispanic respondents were more likely to report at least three servings of vegetables a day compared to Hispanic respondents (27% and 12%, respectively).
• Thirty-seven percent of college respondents reported at least three servings of vegetables a day compared to
27% of those with some post high school education or 17% of respondents with a high school education or less.
• Thirty-nine percent of respondents in the top 40 percent household income bracket reported at least three servings of vegetables a day compared to 24% of those in the bottom 40 percent income bracket or 20% of respondents in the middle 20 percent household income bracket.
• Overweight respondents were more likely to report at least three servings of vegetables a day (27%) compared
to respondents who were not overweight (22%). Year Comparisons • From 2003 to 2012, there was a statistical decrease in the overall percent of respondents who reported three or
more servings of vegetables on an average day. • In 2003, 2006 and 2012, female respondents were more likely to report at least three vegetable servings per day.
In 2009, gender was not a significant variable. • In 2012, respondents 35 to 44 years old were more likely to report at least three servings of vegetables, with a
noted increase since 2003. In all other study years, age was not a significant variable. From 2003 to 2012, there was a noted decrease in the percent of respondents who were 25 to 34 years old or 55 to 64 years old reporting at least three vegetable servings per day.
• In 2003, 2006 and 2009, white respondents were more likely to report at least three servings of vegetables per
day. In 2012, race was not a significant variable.
• In 2009 and 2012, non-Hispanic respondents were more likely to report at least three servings of vegetables per day. In all other study years, Hispanic origin was not a significant variable. From 2003 to 2012, there was a noted decrease in the percent of Hispanic respondents reporting at least three vegetable servings per day.
• In all study years, respondents with a college education were more likely to report at least three servings of
vegetables. From 2003 to 2012, there was a noted decrease in the percent of respondents with a high school education or less reporting at least three vegetable servings per day.
Milwaukee Community Health Survey Report—2012 91
• In 2003, 2006 and 2012, respondents in the top 40 percent household income bracket were more likely to report at least three servings of vegetables. In 2009, household income was not a significant variable.
• In 2003 and 2009, married respondents were more likely to report at least three servings of vegetables. In all
other study years, marital status was not a significant variable.
• In 2012, overweight respondents were more likely to report at least three servings of vegetables. In all other study years, overweight status was not a significant variable. From 2003 to 2012, there was a noted decrease in the percent of respondents who were not overweight reporting at least three vegetable servings per day.
• In 2006 and 2009, respondents who met the recommended amount of physical activity were more likely to report at least three servings of vegetables. In 2012, physical activity was not a significant variable. From 2006 to 2012, there was a noted increase in the percent of inactive respondents reporting at least three vegetable servings per day.

Milwaukee Community Health Survey Report—2012 92
Table 30. Three or More Servings of Vegetables on Average Day by Demographic Variables for Each Survey Year,
2003 2006 2009 2012 TOTALa 29% 22% 20% 25% Gender1,2,4 Male 25 16 19 22 Female 32 27 21 28 Age4 18 to 24 25 18 19 19 25 to 34a 36 22 21 25 35 to 44a 24 24 23 40 45 to 54 27 26 19 28 55 to 64a 28 22 17 17 65 and Older 28 19 16 20 Race1,2,3 White 32 25 25 27 African American 24 19 19 24 Other 27 20 9 24 Hispanic Origin3,4 Hispanica 25 20 7 12 Non-Hispanic 29 22 21 27 Education1,2,3,4 High School or Lessa 25 16 14 17 Some Post High School 27 25 21 27
College Graduate 37 31 31 37 Household Income1,2,4 Bottom 40 Percent Bracket 24 18 18 24 Middle 20 Percent Bracket 29 25 22 20 Top 40 Percent Bracket 37 33 26 39 Marital Status1,3 Married 33 23 24 28 Not Married 26 22 18 24 Overweight Status4 Not Overweighta 31 22 20 22 Overweight 27 22 20 27 Physical Activity2,3 Inactiveb -- 15 13 24 Insufficient -- 22 18 25 Recommended -- 26 26 26
Percentages occasionally may differ by 1 or 2 percentage points from previous reports or the Appendix as a result of rounding, recoding variables and response category distribution. Physical activity was defined differently in 2003. 1demographic difference at p≤0.05 in 2003; 2demographic difference at p≤0.05 in 2006 3demographic difference at p≤0.05 in 2009; 4demographic difference at p≤0.05 in 2012 ayear difference at p≤0.05 from 2003 to 2012 byear difference at p≤0.05 from 2006 to 2012

Milwaukee Community Health Survey Report—2012 93
Nutrition Overall Year Comparisons • From 2003 to 2012, there was no statistical change in the overall percent of respondents who reported at least
two servings of fruit on an average day. From 2003 to 2012, there was a statistical decrease in the overall percent of respondents who reported at least three servings of vegetables on an average day.
Women’s Health (Figure 13; Tables 31 & 32) KEY FINDINGS: In 2012, 77% of female respondents 50 and older reported a mammogram within the past two
years. Sixty-four percent of female respondents 65 and older had a bone density scan. Eighty-five percent of female respondents 18 to 65 years old reported a pap smear within the past three years; respondents who were 35 to 44 years old, African American, non-Hispanic or in the top 40 percent household income bracket were more likely to report this.
From 2003 to 2012, there was no statistical change in the overall percent of respondents 50 and older who reported having a mammogram within the past two years. From 2006 to 2012, there was no statistical change in the overall percent of respondents 65 and older who reported a bone density scan. From 2003 to 2012, there was a statistical decrease in the overall percent of respondents 18 to 65 years old who reported having a pap smear within the past three years.
Figure 12. Fruit and Vegetable Consumption on an Average Day
61%56%58%
63%
25%22%29%
20%
0%
20%
40%
60%
80%
100%
2003 2006 2009 2012
Fruit (Two or moreservings)Vegetable (Three ormore servings)

Milwaukee Community Health Survey Report—2012 94
Mammogram Routine screening for breast cancer every one to two years with mammography is recommended for women 50 to 74 years old.2 In 2010, 80% of Wisconsin women and 78% of U.S. women 50 and older reported a mammogram within the past two years (2010 Behavioral Risk Factor Surveillance). 2012 Findings • Seventy-seven percent of female respondents 50 and older had a mammogram within the past two years. Three
percent reported never. • There were no statistically significant differences between demographic variables and responses of a
mammogram within the past two years. Year Comparisons • From 2003 to 2012, there was no statistical change in the overall percent of respondents who reported having a
mammogram within the past two years.
• In 2003 and 2006, African American respondents were more likely to report a mammogram within the past two years. In all other study years, race was not a significant variable.
• In 2003, respondents with a high school education or less were more likely to report a mammogram within the past two years. In all other study years, education was not a significant variable. From 2003 to 2012, there was a noted decrease in the percent of respondents with a high school education or less reporting a mammogram within the past two years.
• In 2006, respondents in the top 60 percent household income bracket were more likely to report a mammogram
within the past two years. In all other study years, household income was not a significant variable.
• In 2006, married respondents were more likely to report a mammogram within the past two years. In all other study years, marital status was not a significant variable.
2“Screening for Breast Cancer.” U.S. Preventive Services Task Force: The Guide to Clinical Preventive Services, 2009. Agency for Healthcare Research and Quality, 2009.

Milwaukee Community Health Survey Report—2012 95
Table 31. Mammogram Within Past Two Years by Demographic Variables for Each Survey Year (Respondents 50 and Older),
2003 2006 2009 2012 TOTAL 82% 76% 76% 77% Race1,2 White 78 72 70 71 African American 90 84 81 82 Education1 High School or Lessa 87 75 72 74
Some Post High School or More 74 77 79 80 Household Income2 Bottom 40 Percent Bracket 81 71 78 74 Top 60 Percent Bracket 82 86 84 83 Marital Status2 Married 84 82 81 84 Not Married 81 72 74 74
Percentages occasionally may differ by 1 or 2 percentage points from previous reports or the Appendix as a result of rounding, recoding variables and response category distribution.
Other race and Hispanic origin not included as a result of too few cases for statistical reliability. 1demographic difference at p≤0.05 in 2003; 2demographic difference at p≤0.05 in 2006 3demographic difference at p≤0.05 in 2009; 4demographic difference at p≤0.05 in 2012
ayear difference at p≤0.05 from 2003 to 2012 Bone Density Scan 2012 Findings • Sixty-four percent of the 88 female respondents 65 and older had a bone density scan to determine if they are at
risk for fractures or are in the early stages of osteoporosis. • No demographic comparisons were conducted as a result of the low percent of respondents who were asked this
question.
Year Comparisons • From 2006 to 2012, there was no statistical change in the overall percent of respondents who reported having a
bone density scan.
• No demographic comparisons were conducted between years a a result of the low percent of respondents who were asked this question.

Milwaukee Community Health Survey Report—2012 96
Pap Smear Routine screening for cervical cancer with Papanicolaou (Pap) testing is recommended for all women who are or have been sexually active and who have a cervix. Pap smears should begin with the onset of sexual activity or at age 21 and should be repeated at least every three years. There is insufficient evidence to recommend for or against an upper age limit for Pap testing, but recommendations can be made on other grounds to discontinue regular testing after age 65 in women who have had regular previous screenings in which the smears have been consistently normal.3 The Healthy People 2020 goal for women 21 to 65 years old having a pap test within the past three years is 93%. (Objective C-15) In 2010, 85% of Wisconsin women and 81% of U.S. women 18 and older reported a pap smear within the past three years (2010 Behavioral Risk Factor Surveillance). 2012 Findings • A total of 85% of respondents 18 to 65 years old with a cervix reported they had a pap smear within the past
three years.
• Respondents 35 to 44 years old were more likely to report a pap smear within the past three years (98%) compared to those 55 to 65 years old (76%) or respondents 18 to 24 years old (74%).
• African American respondents were more likely to report a pap smear within the past three years (92%)
compared to white respondents (81%) or respondents of another race (74%).
• Non-Hispanic respondents were more likely to report a pap smear within the past three years compared to Hispanic respondents (87% and 75%, respectively).
• Respondents in the top 40 percent household income bracket were more likely to report a pap smear within the
past three years (93%) compared to those in the bottom 40 percent income bracket (87%) or respondents in the middle 20 percent household income bracket (76%).
Year Comparisons • From 2003 to 2012, there was a statistical decrease in the overall percent of respondents who reported a pap
smear within the past three years. • In 2003 and 2006, respondents 25 to 44 years old were more likely to report a pap smear within the past three
years. In 2009, respondents 25 to 34 years old were more likely to report a pap smear within the past three years. In 2012, respondents 35 to 44 years old were more likely to report this. From 2003 to 2012, there was a noted decrease in the percent of respondents 18 to 24 years old reporting a pap smear within the past three years.
• In 2003, 2009 and 2012, African American respondents were more likely to report a pap smear within the past
three years. In 2006, race was not a significant variable. From 2003 to 2012, there was a noted decrease in the percent of white respondents reporting a pap smear within the past three years.
3“Screening for Cervical Cancer.” U.S. Preventive Services Task Force: The Guide to Clinical Preventive Services, 2005. Agency for Healthcare Research and Quality, 2005. Pages 26 - 31.

Milwaukee Community Health Survey Report—2012 97
• In 2012, non-Hispanic respondents were more likely to report a pap smear within the past three years. In all other study years, Hispanic origin was not a significant variable in any study year.
• In 2006, respondents with a college education were more likely to report a pap smear within the past three
years. In all other study years, education was not a significant variable. From 2003 to 2012, there was a noted decrease in the percent of respondents with a high school education or less reporting a pap smear within the past three years.
• In 2012, respondents in the top 40 percent household income bracket were more likely to report a pap smear
within the past three years. In all other study years, household income was not a significant variable. From 2003 to 2012, there was a noted decrease in the percent of respondents in the middle 20 percent household income bracket reporting a pap smear within the past three years.
• In 2006, married respondents were more likely to report a pap smear within the past three years. In all other
study years, marital status was not a significant variable. From 2003 to 2012, there was a noted decrease in the percent of unmarried respondents reporting a pap smear within the past three years.
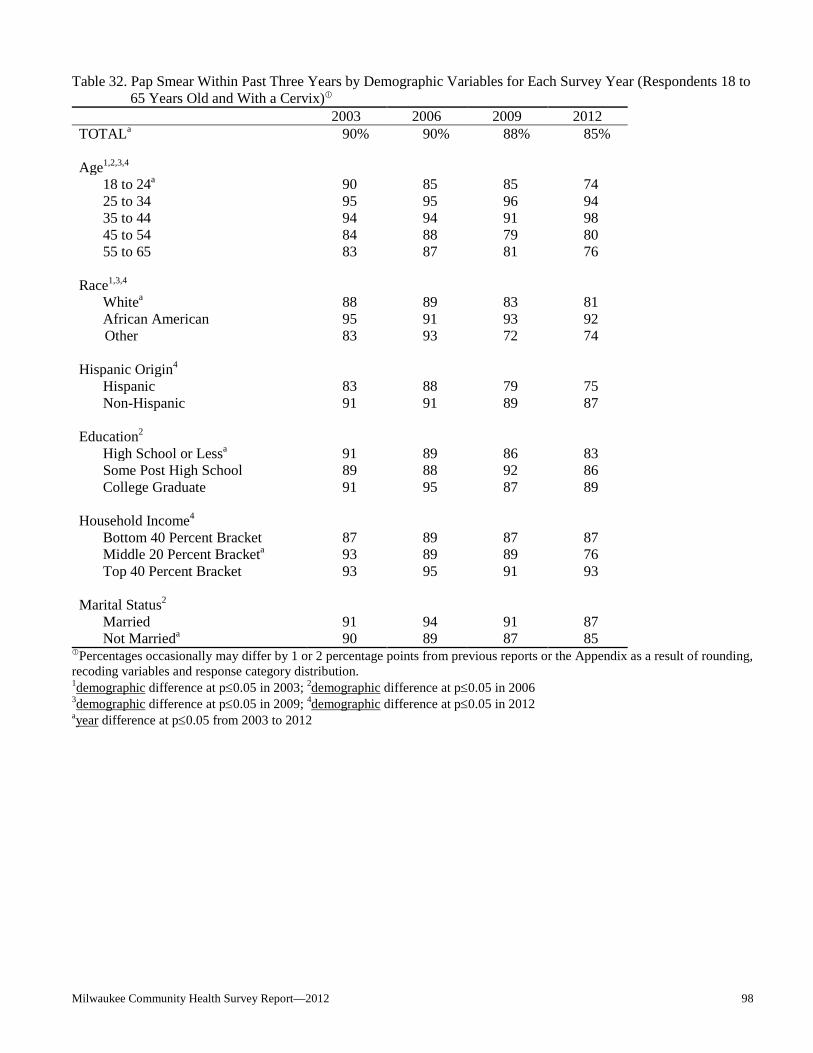
Milwaukee Community Health Survey Report—2012 98
Table 32. Pap Smear Within Past Three Years by Demographic Variables for Each Survey Year (Respondents 18 to 65 Years Old and With a Cervix)
2003 2006 2009 2012 TOTALa 90% 90% 88% 85% Age1,2,3,4 18 to 24a 90 85 85 74 25 to 34 95 95 96 94 35 to 44 94 94 91 98 45 to 54 84 88 79 80 55 to 65 83 87 81 76 Race1,3,4 Whitea 88 89 83 81 African American 95 91 93 92 Other 83 93 72 74 Hispanic Origin4 Hispanic 83 88 79 75 Non-Hispanic 91 91 89 87 Education2 High School or Lessa 91 89 86 83 Some Post High School 89 88 92 86
College Graduate 91 95 87 89 Household Income4 Bottom 40 Percent Bracket 87 89 87 87 Middle 20 Percent Bracketa 93 89 89 76 Top 40 Percent Bracket 93 95 91 93 Marital Status2 Married 91 94 91 87 Not Marrieda 90 89 87 85
Percentages occasionally may differ by 1 or 2 percentage points from previous reports or the Appendix as a result of rounding, recoding variables and response category distribution.
1demographic difference at p≤0.05 in 2003; 2demographic difference at p≤0.05 in 2006 3demographic difference at p≤0.05 in 2009; 4demographic difference at p≤0.05 in 2012
ayear difference at p≤0.05 from 2003 to 2012

Milwaukee Community Health Survey Report—2012 99
Women’s Health Tests Overall Year Comparisons • From 2003 to 2012, there was no statistical change in the overall percent of respondents 50 and older who
reported having a mammogram within the past two years. From 2006 to 2012, there was no statistical change in the overall percent of respondents 65 and older who reported a bone density scan. From 2003 to 2012, there was a statistical decrease in the overall percent of respondents 18 to 65 years old who reported having a pap smear within the past three years.
Men’s Health (Figure 14; Table 33) KEY FINDINGS: In 2012, 45% of male respondents 40 and older had a prostate cancer screening within the past
two years with either a digital rectal exam (DRE) or a prostate-specific antigen (PSA) test. Respondents who were 50 and older or African American were more likely to report this.
From 2006 to 2012, there was a statistical decrease in the overall percent of male respondents 40 and older who reported a prostate cancer screening within the past two years.
Prostate Cancer Screening The U.S. Preventive Services Task Force concludes there is insufficient evidence for or against routine screening for prostate cancer with a prostate-specific antigen (PSA) test or a digital rectal examination (DRE).4
4“Screening for Prostate Cancer.” U.S. Preventive Services Task Force: The Guide to Clinical Preventive Services, 2005. Agency for Healthcare Research and Quality, 2005. Pages 43 - 45.
Figure 13. Women's Health Tests
85%90% 88%90%
77%76%76%82%
71%71%72%80%
64%64%60%
0%
20%
40%
60%
80%
100%
2003 2006 2009 2012
Pap Smear - within past 3 yrs. (18to 65 yrs. old)
Mammogram - within past 2 yrs.(50 and older)
Mammogram - within past 2 yrs.(40 and older)
Bone Density Scan (65 and older)
Milwaukee Community Health Survey Report—2012 100
2012 Findings • Forty-five percent of male respondents 40 and older had a prostate cancer screening within the past two years.
Twenty-eight percent of male respondents never had a prostate cancer screening. • Fifty-nine percent of male respondents 50 and older reported a prostate cancer screen within the past two years
compared to 22% of male respondents 40 to 49 years old.
• African American respondents were more likely to report a prostate cancer screen within the past two years (54%) compared to white respondents (39%).
Year Comparisons In 2006 and 2009, men were asked separate questions about their most recent digital rectal exam and their most recent prostate-specific antigen test. In 2012, both tests were combined into one prostate cancer screening question. • From 2006 to 2012, there was a statistical decrease in the overall percent of male respondents 40 and older who
reported a prostate cancer screening within the past two years.
• In all study years, respondents 50 and older were more likely to report a prostate cancer screen in the past two years. From 2006 to 2012, there was a noted decrease in the percent of respondents across age reporting a screen within the past two years.
• In 2009 and 2012, African American respondents were more likely to report a prostate cancer screen in the past
two years. In 2006, race was not a significant variable. From 2006 to 2012, there was a noted decrease in the percent of white respondents reporting a prostate screen in the past two years.
• Education was not a significant variable in any study year. From 2006 to 2012, there was a noted decrease in
the percent of respondents across education reporting a prostate cancer screen within the past two years.
• Household income was not a significant variable in any study year. From 2006 to 2012, there was a noted decrease in the percent of respondents in the bottom 40 percent household income bracket reporting a prostate cancer screen within the past two years.
• In 2006 and 2009, married respondents were more likely to report a prostate cancer screen in the past two years.
In 2012, marital status was not a significant variable. From 2006 to 2012, there was a noted decrease in the percent of respondents across marital status reporting a prostate screen in the past two years.
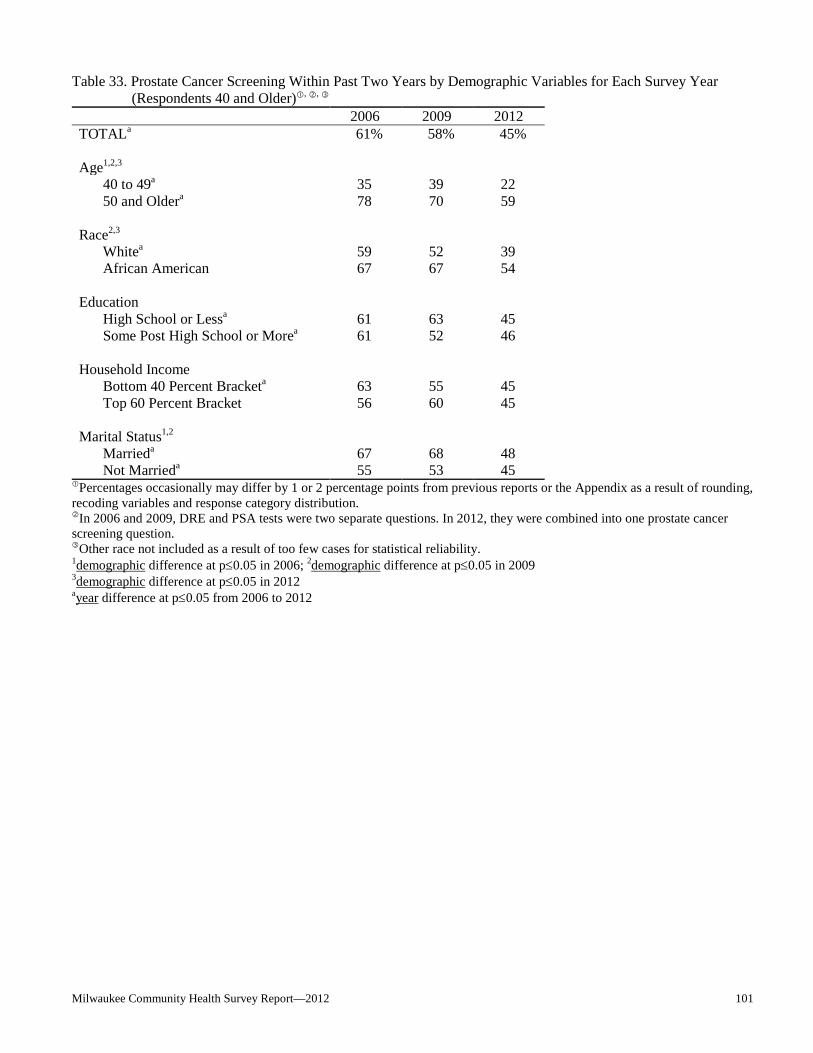
Milwaukee Community Health Survey Report—2012 101
Table 33. Prostate Cancer Screening Within Past Two Years by Demographic Variables for Each Survey Year (Respondents 40 and Older), ,
2006 2009 2012 TOTALa 61% 58% 45% Age1,2,3 40 to 49a 35 39 22 50 and Oldera 78 70 59 Race2,3 Whitea 59 52 39 African American 67 67 54 Education High School or Lessa 61 63 45
Some Post High School or Morea 61 52 46 Household Income Bottom 40 Percent Bracketa 63 55 45 Top 60 Percent Bracket 56 60 45 Marital Status1,2 Marrieda 67 68 48 Not Marrieda 55 53 45
Percentages occasionally may differ by 1 or 2 percentage points from previous reports or the Appendix as a result of rounding, recoding variables and response category distribution. In 2006 and 2009, DRE and PSA tests were two separate questions. In 2012, they were combined into one prostate cancer screening question. Other race not included as a result of too few cases for statistical reliability. 1demographic difference at p≤0.05 in 2006; 2demographic difference at p≤0.05 in 2009 3demographic difference at p≤0.05 in 2012
ayear difference at p≤0.05 from 2006 to 2012

Milwaukee Community Health Survey Report—2012 102
Men’s Health Overall Year Comparisons • From 2006 to 2012, there was a statistical decrease in the overall percent of male respondents 40 and older who
reported a prostate cancer screening within the past two years.
*In 2006 and 2009, DRE and PSA tests were two separate questions. In 2012, they were combined into one prostate cancer screening question. Colorectal Cancer Screening (Figure 15; Tables 34 - 37) KEY FINDINGS: In 2012, 15% of respondents 50 and older reported a blood stool test within the past year.
Twelve percent of respondents 50 and older reported a sigmoidoscopy within the past five years while 59% reported a colonoscopy within the past ten years. This results in 65% of respondents meeting current colorectal cancer screening recommendations; African American respondents were more likely to report this.
From 2003 to 2012, there was a statistical decrease in the overall percent of respondents who reported a blood stool test within the past year. From 2009 to 2012, there was no statistical change in the overall percent of respondents who reported a sigmoidoscopy within the past five years or a colonoscopy within the past ten years. From 2009 to 2012, there was a statistical increase in the overall percent of respondents who reported at least one of these tests in the recommended time frame.
Blood Stool Test 2012 Findings • Fifteen percent of respondents 50 and older had a blood stool test within the past year. Fifty percent reported
never.
Figure 14. Prostate Cancer Screening in Past Two Years(Male Respondents 40 and Older)*
61%58%
45%
0%
20%
40%
60%
80%
100%
2006 2009 2012
Milwaukee Community Health Survey Report—2012 103
• Unmarried respondents were more likely to report a blood stool test within the past year compared to married respondents (17% and 9%, respectively).
Year Comparisons • From 2003 to 2012, there was a statistical decrease in the overall percent of respondents who reported a blood
stool test within the past year. • In 2003, male respondents were more likely to report a blood stool test within the past year. In all other study
years, gender was not a significant variable. From 2003 to 2012, there was a noted decrease in the percent of respondents across gender reporting a blood stool test within the past year.
• In 2006, African American respondents were more likely to report a blood stool test within the past year. In all
other study years, race was not a significant variable. From 2003 to 2012, there was a noted decrease in the percent of respondents across race reporting a blood stool test within the past year.
• Education was not a significant variable in any study year. From 2003 to 2012, there was a noted decrease in
the percent of respondents across education reporting a blood stool test within the past year.
• Household income was not a significant variable in any study year. From 2003 to 2012, there was a noted decrease in the percent of respondents across household income reporting a blood stool test within the past year.
• In 2012, unmarried respondents were more likely to report a blood stool test within the past year. In all other study years, marital status was not a significant variable. From 2003 to 2012, there was a noted decrease in the percent of respondents across marital status reporting a blood stool test within the past year.
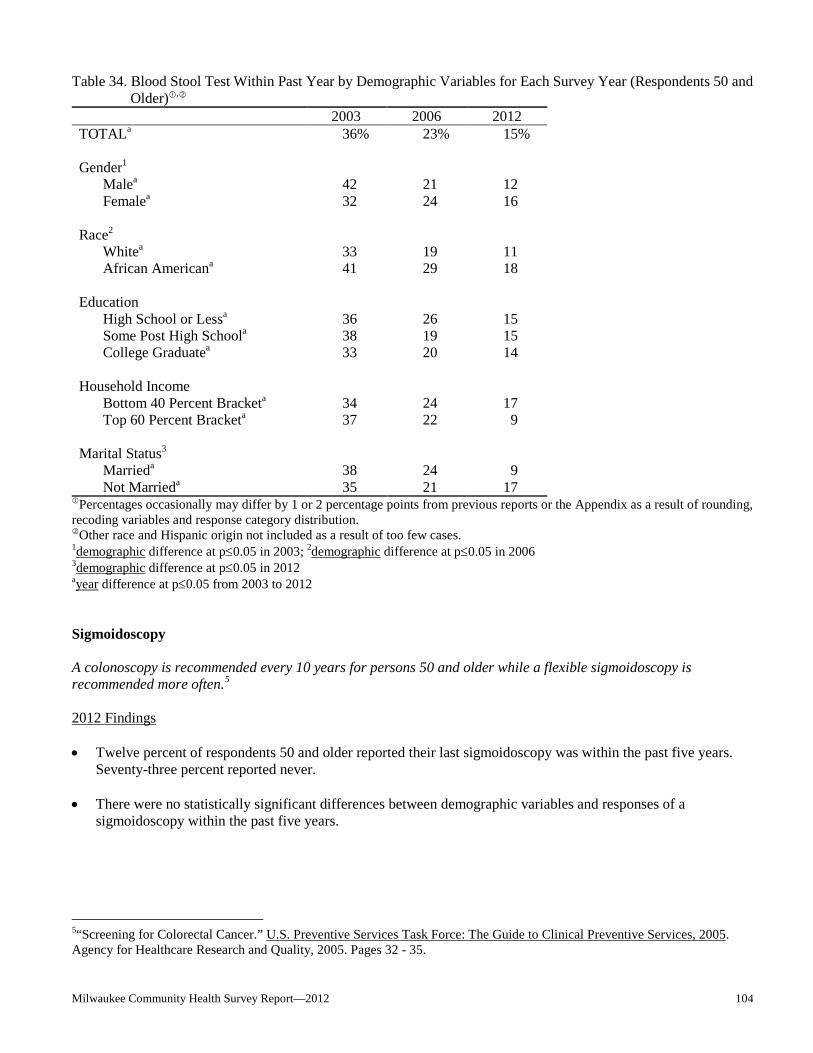
Milwaukee Community Health Survey Report—2012 104
Table 34. Blood Stool Test Within Past Year by Demographic Variables for Each Survey Year (Respondents 50 and Older),
2003 2006 2012 TOTALa 36% 23% 15% Gender1 Malea 42 21 12 Femalea 32 24 16 Race2 Whitea 33 19 11 African Americana 41 29 18 Education High School or Lessa 36 26 15 Some Post High Schoola 38 19 15
College Graduatea 33 20 14 Household Income Bottom 40 Percent Bracketa 34 24 17 Top 60 Percent Bracketa 37 22 9 Marital Status3 Marrieda 38 24 9 Not Marrieda 35 21 17
Percentages occasionally may differ by 1 or 2 percentage points from previous reports or the Appendix as a result of rounding, recoding variables and response category distribution.
Other race and Hispanic origin not included as a result of too few cases. 1demographic difference at p≤0.05 in 2003; 2demographic difference at p≤0.05 in 2006 3demographic difference at p≤0.05 in 2012 ayear difference at p≤0.05 from 2003 to 2012 Sigmoidoscopy A colonoscopy is recommended every 10 years for persons 50 and older while a flexible sigmoidoscopy is recommended more often.5 2012 Findings • Twelve percent of respondents 50 and older reported their last sigmoidoscopy was within the past five years.
Seventy-three percent reported never. • There were no statistically significant differences between demographic variables and responses of a
sigmoidoscopy within the past five years.
5“Screening for Colorectal Cancer.” U.S. Preventive Services Task Force: The Guide to Clinical Preventive Services, 2005. Agency for Healthcare Research and Quality, 2005. Pages 32 - 35.
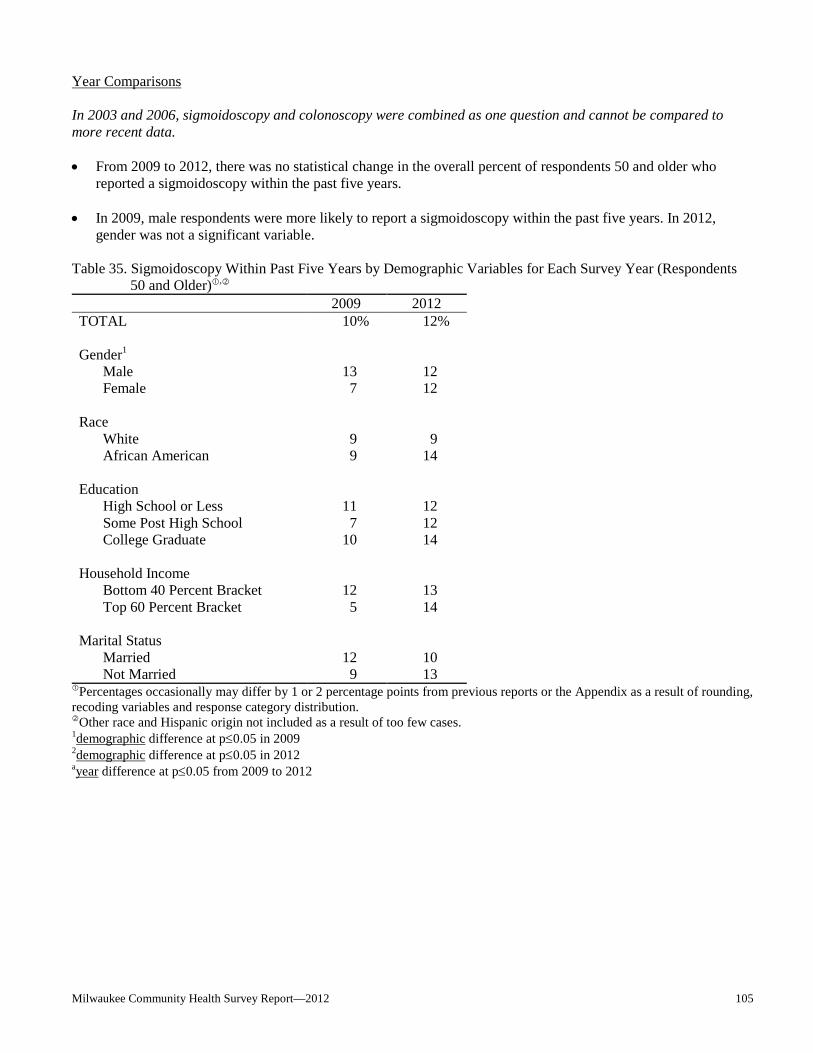
Milwaukee Community Health Survey Report—2012 105
Year Comparisons In 2003 and 2006, sigmoidoscopy and colonoscopy were combined as one question and cannot be compared to more recent data. • From 2009 to 2012, there was no statistical change in the overall percent of respondents 50 and older who
reported a sigmoidoscopy within the past five years. • In 2009, male respondents were more likely to report a sigmoidoscopy within the past five years. In 2012,
gender was not a significant variable. Table 35. Sigmoidoscopy Within Past Five Years by Demographic Variables for Each Survey Year (Respondents
50 and Older),
2009 2012 TOTAL 10% 12% Gender1 Male 13 12 Female 7 12 Race White 9 9 African American 9 14 Education High School or Less 11 12 Some Post High School 7 12
College Graduate 10 14 Household Income Bottom 40 Percent Bracket 12 13 Top 60 Percent Bracket 5 14 Marital Status Married 12 10 Not Married 9 13
Percentages occasionally may differ by 1 or 2 percentage points from previous reports or the Appendix as a result of rounding, recoding variables and response category distribution.
Other race and Hispanic origin not included as a result of too few cases. 1demographic difference at p≤0.05 in 2009 2demographic difference at p≤0.05 in 2012 ayear difference at p≤0.05 from 2009 to 2012
Milwaukee Community Health Survey Report—2012 106
Colonoscopy A colonoscopy is recommended every 10 years for persons 50 and older while a flexible sigmoidoscopy is recommended more often.6 2012 Findings • Fifty-nine percent of respondents 50 and older had a colonoscopy within the past ten years. Thirty-four percent
reported never. • There were no statistically significant differences between demographic variables and responses of a
colonoscopy within the past ten years. Year Comparisons In 2003 and 2006, sigmoidoscopy and colonoscopy were combined as one question and cannot be compared to more recent data. • From 2009 to 2012, there was no statistical change in the overall percent of respondents 50 and older who
reported a colonoscopy within the past ten years. • In 2009, respondents in the top 60 percent household income bracket were more likely to report a colonoscopy
within the past ten years. In 2012, household income was not a significant variable. • In 2009, married respondents were more likely to report a colonoscopy within the past ten years. In 2012,
marital status was not a significant variable.
6“Screening for Colorectal Cancer.” U.S. Preventive Services Task Force: The Guide to Clinical Preventive Services, 2005. Agency for Healthcare Research and Quality, 2005. Pages 32 - 35.

Milwaukee Community Health Survey Report—2012 107
Table 36. Colonoscopy Within Past Ten Years by Demographic Variables for Each Survey Year (Respondents 50 and Older),
2009 2012 TOTAL 54% 59% Gender Male 54 58 Female 53 60 Race White 54 54 African American 54 64 Education High School or Less 50 54 Some Post High School 58 64
College Graduate 59 66 Household Income1 Bottom 40 Percent Bracket 50 59 Top 60 Percent Bracket 64 67 Marital Status1 Married 62 65 Not Married 51 56
Percentages occasionally may differ by 1 or 2 percentage points from previous reports or the Appendix as a result of rounding, recoding variables and response category distribution.
Other race and Hispanic origin not included as a result of too few cases. 1demographic difference at p≤0.05 in 2009 2demographic difference at p≤0.05 in 2012 ayear difference at p≤0.05 from 2009 to 2012 Colorectal Cancer Screening Recommendation Met The Healthy People 2020 goal for meeting the colorectal cancer screening recommendation is 71%. (Objective C-16) 2012 Findings • Sixty-five percent of respondents 50 and older had one of the three tests in the time frame recommended (blood
stool test within the past year, sigmoidoscopy within the past five years, or colonoscopy within the past 10 years).
• African American respondents were more likely to report a colorectal cancer screen in the recommended time
frame (70%) compared to white respondents (60%).
Year Comparisons • From 2009 to 2012, there was a statistical increase in the overall percent of respondents 50 and older who
reported a colorectal cancer screen in the recommended time frame.

Milwaukee Community Health Survey Report—2012 108
• Gender was not a significant variable in any study year. From 2009 to 2012, there was a noted increase in the percent of female respondents reporting a colorectal cancer screen in the recommended time frame.
• In 2012, African American respondents were more likely to report a colorectal cancer screen in the recommended time frame, with a noted increase since 2009. In 2009, race was not a significant variable.
• Household income was not a significant variable in any study year. From 2009 to 2012, there was a noted
increase in the percent of respondents in the bottom 40 percent household income bracket reporting a colorectal cancer screen in the recommended time frame.
• In 2009, married respondents were more likely to report a colorectal cancer screen in the recommended time
frame. In 2012, marital status was not a significant variable. From 2009 to 2012, there was a noted increase in the percent of unmarried respondents reporting a colorectal cancer screen in the recommended time frame.
Table 37. Colorectal Cancer Screening in Recommended Time Frame by Demographic Variables for Each Survey Year (Respondents 50 and Older),,
2009 2012 TOTALa 57% 65% Gender Male 58 63 Femalea 56 67 Race2 White 57 60 African Americana 56 70 Education High School or Less 54 60 Some Post High School 59 69
College Graduate 63 72 Household Income Bottom 40 Percent Bracketa 54 63 Top 60 Percent Bracket 66 73 Marital Status1 Married 66 69 Not Marrieda 53 63
Percentages occasionally may differ by 1 or 2 percentage points from previous reports or the Appendix as a result of rounding, recoding variables and response category distribution. In 2009, blood stool test was not asked. Other race and Hispanic origin not included as a result of too few cases. 1demographic difference at p≤0.05 in 2009 2demographic difference at p≤0.05 in 2012 ayear difference at p≤0.05 from 2009 to 2012

Milwaukee Community Health Survey Report—2012 109
Colorectal Cancer Screenings Overall Year Comparisons • From 2003 to 2012, there was a statistical decrease in the overall percent of respondents who reported a blood
stool test within the past year. From 2009 to 2012, there was no statistical change in the overall percent of respondents who reported a sigmoidoscopy within the past five years or a colonoscopy within the past ten years. From 2009 to 2012, there was a statistical increase in the overall percent of respondents who reported at least one of these tests in the recommended time frame.
*Not asked in 2009. Tobacco Use (Figures 16 & 17; Tables 38 - 41) KEY FINDINGS: In 2012, 28% of respondents were current smokers; respondents who were male, 25 to 34 years
old, African American, non-Hispanic, with a high school education or less, in the bottom 40 percent household income bracket or unmarried respondents were more likely to be a smoker. Eight percent of respondents reported other tobacco use such as cigars, pipes, chewing tobacco or snuff in the past 30 days; respondents who were male, 25 to 44 years old, white, with a college education or in the top 40 percent household income bracket were more likely to report this. In the past 12 months, 66% of current smokers quit smoking for one day or longer because they were trying to quit. Eighty-three percent of current smokers who saw a health professional in the past year reported the professional advised them to quit smoking; respondents who were 35 to 54 years old or married were more likely to report this.
From 2003 to 2012, there was no statistical change in the overall percent of respondents who were current smokers. From 2003 to 2012, there was a statistical increase in the overall percent of current smokers who reported they quit smoking for one day or longer in the past 12 months because they were trying to quit. From 2006 to 2012, there was no statistical change in the overall percent of current smokers who reported their health professional advised them to quit smoking.
Figure 15. Colorectal Cancer Screenings(Respondents 50 and Older)
57%65%
59%54%
10% 12%
36%
23%15%
0%
20%
40%
60%
80%
100%
2003 2006 2009 2012
At Least One Testwithin RecommendedTime Frame
Colonoscopy (withinpast 10 yrs.)
Sigmoidoscopy (withinpast 5 yrs.)
Blood Stool Test (pastyear)*

Milwaukee Community Health Survey Report—2012 110
Current Smokers The Healthy People 2020 goal for adult smoking is 12%. (Objective TU-1.1) In 2010, 19% of Wisconsin respondents were current smokers while 17% of U.S. respondents were current smokers (2010 Behavioral Risk Factor Surveillance). 2012 Findings • Twenty-eight percent of respondents were current smokers (20% every day and 8% some days). • Male respondents were more likely to be current smokers (34%) compared to female respondents (23%).
• Thirty-nine percent of respondents 25 to 34 years old were current smokers compared to 22% of those 18 to 24
years old or 14% of respondents 65 and older.
• African American respondents were more likely to be current smokers (32%) compared to white respondents (26%) or respondents of another race (20%).
• Non-Hispanic respondents were more likely to be current smokers compared to Hispanic respondents (29% and
18%, respectively).
• Thirty-five percent of respondents with a high school education or less were current smokers compared to 28% of those with some post high school education or 15% of respondents with a college education.
• Thirty-six percent of respondents in the bottom 40 percent household income bracket were current smokers
compared to 20% of those in the middle 20 percent income bracket or 12% of respondents in the top 40 percent household income bracket.
• Unmarried respondents were more likely to be current smokers compared to married respondents (31% and
21%, respectively). Year Comparisons • From 2003 to 2012, there was no statistical change in the overall percent of respondents who were current
smokers. • In 2006, 2009 and 2012, male respondents were more likely to report they were a current smoker. In 2003,
gender was not a significant variable. • In 2003 and 2006, respondents 25 to 54 years old were more likely to report they were a current smoker. In
2009, respondents 35 to 54 years old were more likely to report they were a current smoker. In 2012, respondents 25 to 34 years old were more likely to report they were a current smoker. From 2003 to 2012, there was a noted decrease in the percent of respondents 35 to 44 years old who were current smokers.
• In 2012, African American respondents were more likely to report they were a current smoker. In all other
study years, race was not a significant variable.
• In 2009, Hispanic respondents were more likely to report they were a current smoker. In 2012, non-Hispanic respondents were more likely to report they were a current smoker. In all other study years, Hispanic origin was not a significant variable.

Milwaukee Community Health Survey Report—2012 111
• In 2003, 2009 and 2012, respondents with a high school education or less were more likely to be a current smoker. In 2006, respondents with some post high school education or less were more likely to be a current smoker.
• In all study years, respondents in the bottom 40 percent household income bracket were more likely to be a
current smoker. From 2003 to 2012, there was a noted decrease in the percent of respondents in the top 40 percent household income bracket who were current smokers.
• In all study years, unmarried respondents were more likely to report they were a current smoker.

Milwaukee Community Health Survey Report—2012 112
Table 38. Current Smokers by Demographic Variables for Each Survey Year 2003 2006 2009 2012 TOTAL 28% 29% 29% 28% Gender2,3,4 Male 30 33 34 34 Female 27 26 25 23 Age1,2,3,4 18 to 24 27 29 26 22 25 to 34 34 34 30 39 35 to 44a 36 33 37 24 45 to 54 32 35 36 30 55 to 64 29 26 27 34 65 and Older 10 13 15 14 Race4 White 27 28 25 26 African American 31 30 30 32 Other 27 30 35 20 Hispanic Origin3,4 Hispanic 23 31 43 18 Non-Hispanic 29 29 28 29 Education1,2,3,4 High School or Less 33 34 36 35 Some Post High School 28 32 28 28
College Graduate 17 17 14 15 Household Income1,2,3,4 Bottom 40 Percent Bracket 32 34 33 36 Middle 20 Percent Bracket 27 25 21 20 Top 40 Percent Bracketa 24 18 14 12 Marital Status1,2,3,4 Married 23 24 23 21 Not Married 31 32 32 31
Percentages occasionally may differ by 1 or 2 percentage points from previous reports or the Appendix as a result of rounding, recoding variables and response category distribution.
1demographic difference at p≤0.05 in 2003; 2demographic difference at p≤0.05 in 2006 3demographic difference at p≤0.05 in 2009; 4demographic difference at p≤0.05 in 2012 ayear difference at p≤0.05 from 2003 to 2012
Milwaukee Community Health Survey Report—2012 113
Other Tobacco Use in Past 30 Days 2012 Findings • Eight percent of respondents reported they used other tobacco products such as cigars, pipes, chewing tobacco
or snuff in the past 30 days. • Male respondents were more likely to report other tobacco use in the past month (13%) compared to female
respondents (2%).
• Thirteen percent of respondents 35 to 44 years old and 12% of those 25 to 34 years old reported other tobacco use in the past month compared to less than one percent of respondents 65 and older.
• White respondents were more likely to report other tobacco use in the past month (11%) compared to
respondents who were non-white and non-African American (6%) or African American respondents (5%).
• Thirteen percent of respondents with a college education reported other tobacco use in the past month compared to 7% of those with some post high school education or 5% of respondents with a high school education or less.
• Seventeen percent of respondents in the top 40 percent household income bracket reported other tobacco use in
the past month compared to 8% of those in the middle 20 percent income bracket or 6% of respondents in the bottom 40 percent household income bracket.

Milwaukee Community Health Survey Report—2012 114
Table 39. Other Tobacco Use in Past 30 Days by Demographic Variables for 2012 2012 TOTAL 8% Gender1 Male 13 Female 2 Age1 18 to 24 4 25 to 34 12 35 to 44 13 45 to 54 7 55 to 64 5 65 and Older <1 Race1 White 11 African American 5 Other 6 Hispanic Origin Hispanic 6 Non-Hispanic 8 Education1 High School or Less 5 Some Post High School 7
College Graduate 13 Household Income1 Bottom 40 Percent Bracket 6 Middle 20 Percent Bracket 8 Top 40 Percent Bracket 17 Marital Status Married 8 Not Married 7
Percentages occasionally may differ by 1 or 2 percentage points from the Appendix as a result of rounding, recoding variables and response category distribution. 1demographic difference at p≤0.05 in 2012

Milwaukee Community Health Survey Report—2012 115
Tobacco Use Overall Year Comparisons • From 2003 to 2012, there was no statistical change in the overall percent of respondents who were current
smokers.
Quit Smoking for at Least One Day in Past 12 Months as a Result of Trying to Quit The Healthy People 2020 goal for current smokers to have tried quitting for at least one day is 80%. (Objective TU-4.1) In 2005, 49% of Wisconsin respondents reported they quit smoking for at least one day because they were trying to quit while 56% of U.S. respondents reported a cessation attempt for at least one day (2005 Behavioral Risk Factor Surveillance). 2012 Findings
Of current smokers…
o Sixty-six percent of the 333 current smokers reported they quit smoking for one day or longer in the past year because they were trying to quit.
o There were no statistically significant differences between demographic variables and responses of
quitting smoking for one day or longer because they were trying to quit. Year Comparisons
o From 2003 to 2012, there was a statistical increase in the overall percent of respondents who reported they quit smoking for one day or longer because they were trying to quit.
o Gender was not a significant variable in any study year. From 2003 to 2012, there was a noted increase
in the percent of male respondents reporting they quit smoking for at least one day.
Figure 16. Tobacco Use(Past 30 Days)
29% 28%28% 29%
8%
0%
20%
40%
60%
80%
100%
2003 2006 2009 2012
Current SmokerO ther Tobacco Products
Milwaukee Community Health Survey Report—2012 116
o In 2003, respondents 18 to 34 years old were more likely to report they quit smoking for at least one day. In 2006, respondents 18 to 24 years old were more likely to report they quit smoking for at least one day. In all other study years, age was not a significant variable. From 2003 to 2012, there was a noted increase in the percent of respondents 35 to 54 years old reporting they quit smoking for at least one day.
o In 2003, 2006 and 2009, African American respondents were more likely to report they quit smoking
for one day or longer because they were trying to quit. In 2012, race was not a significant variable. From 2003 to 2012, there was a noted increase in the percent of white respondents reporting they quit smoking for at least one day.
o Education was not a significant variable in any study year. From 2003 to 2012, there was a noted
increase in the percent of respondents across education reporting they quit smoking for at least one day. o Household income was not a significant variable in any study year. From 2003 to 2012, there was a
noted increase in the percent of respondents across household income reporting they quit smoking for at least one day.
o Marital status was not a significant variable in any study year. From 2003 to 2012, there was a noted
increase in the percent of unmarried respondents reporting they quit smoking for at least one day.

Milwaukee Community Health Survey Report—2012 117
Table 40. Current Smokers Quit Smoking for One Day or Longer in Past Year by Demographic Variables for Each Survey Year,
2003 2006 2009 2012 TOTALa 53% 55% 58% 66% Gender Malea 51 58 60 69 Female 54 53 56 63 Age1,2 18 to 24 65 67 61 78 25 to 34 67 59 53 64 35 to 44a 53 49 60 73 45 to 54a 30 51 59 68 55 and Older 42 49 59 56 Race1,2,3 Whitea 45 50 50 62 African American 63 60 67 68 Education High School or Lessa 52 54 57 67 Some Post High School or Morea 53 57 60 66 Household Income Bottom 40 Percent Bracketa 57 51 57 68 Top 60 Percent Bracketa 47 59 69 65 Marital Status Married 50 53 67 63 Not Marrieda 54 56 56 67
Percentages occasionally may differ by 1 or 2 percentage points from previous reports or the Appendix as a result of rounding, recoding variables and response category distribution.
Other race and Hispanic origin not included as a result of too few cases for statistical reliability. 1demographic difference at p≤0.05 in 2003; 2demographic difference at p≤0.05 in 2006 3demographic difference at p≤0.05 in 2009; 4demographic difference at p≤0.05 in 2012 ayear difference at p≤0.05 from 2003 to 2012

Milwaukee Community Health Survey Report—2012 118
Doctor, Nurse or Other Health Professional Advised Respondent to Quit 2012 Findings
Of current smokers who have seen a health professional in the past 12 months…
o Eighty-three percent of the 236 current smokers who have seen a health professional in the past 12 months reported their health professional advised them to quit smoking.
o Ninety-three percent of respondents 45 to 54 years old and 92% of those 35 to 44 years old reported a
health professional advised them to quit smoking in the past year compared to 71% of respondents 25 to 34 years old.
o Married respondents were more likely to report a health professional advised them to quit smoking in
the past year compared to unmarried respondents (93% and 80%, respectively). Year Comparisons
o From 2006 to 2012, there was no statistical change in the overall percent of respondents who reported
their health professional advised them to quit smoking. o In 2009, female respondents were more likely to report a health professional advised them to quit
smoking in the past year. In all other study years, gender was not a significant variable. o In 2009, respondents 25 to 44 years old were more likely to report a health professional advised them to
quit smoking in the past year. In 2012, respondents 35 to 54 years old were more likely to report a health professional advised them to quit smoking in the past year. In 2006, age was not a significant variable. From 2006 to 2012, there was a noted increase in the percent of respondents 45 to 54 years old reporting a health professional advised them to quit smoking in the past year.
o In 2012, married respondents were more likely to report a health professional advised them to quit
smoking in the past year. In all other study years, marital status was not a significant variable.

Milwaukee Community Health Survey Report—2012 119
Table 41. Doctor, Nurse or Other Health Professional Advised Respondent to Quit Smoking in Past Year by Demographic Variables for Each Survey Year,
2006 2009 2012 TOTAL 78% 72% 83% Gender2 Male 76 63 82 Female 79 82 84 Age2,3 18 to 24 86 45 76 25 to 34 70 78 71 35 to 44 77 78 92 45 to 54a 79 74 93 55 and Older 82 74 87 Race White 80 68 84 African American 75 73 83 Education High School or Less 78 72 82 Some Post High School or More 78 73 84 Household Income Bottom 40 Percent Bracket 78 73 85 Top 60 Percent Bracket 78 76 80 Marital Status3 Married 84 71 93 Not Married 76 73 80
Percentages occasionally may differ by 1 or 2 percentage points from previous reports or the Appendix as a result of rounding, recoding variables and response category distribution. Other race and Hispanic origin not included as a result of too few cases for statistical reliability. 1demographic difference at p≤0.05 in 2006; 2demographic difference at p≤0.05 in 2009 3demographic difference at p≤0.05 in 2012 ayear difference at p≤0.05 from 2006 to 2012
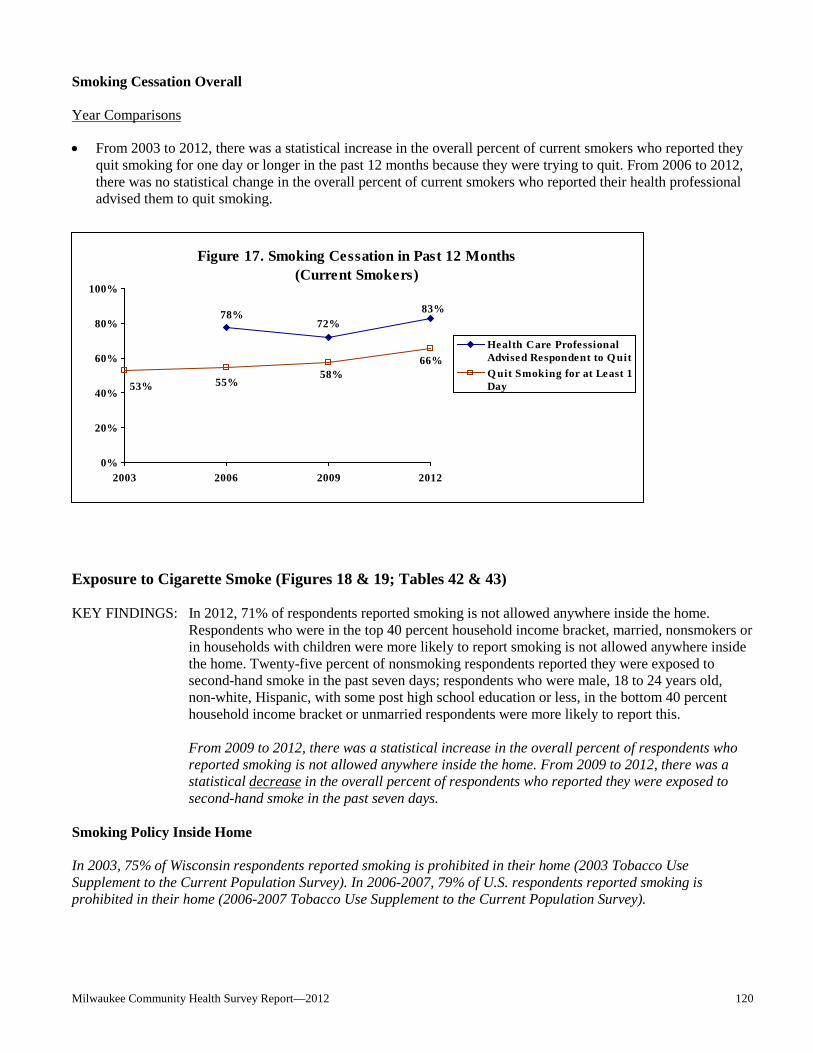
Milwaukee Community Health Survey Report—2012 120
Smoking Cessation Overall Year Comparisons • From 2003 to 2012, there was a statistical increase in the overall percent of current smokers who reported they
quit smoking for one day or longer in the past 12 months because they were trying to quit. From 2006 to 2012, there was no statistical change in the overall percent of current smokers who reported their health professional advised them to quit smoking.
Exposure to Cigarette Smoke (Figures 18 & 19; Tables 42 & 43) KEY FINDINGS: In 2012, 71% of respondents reported smoking is not allowed anywhere inside the home.
Respondents who were in the top 40 percent household income bracket, married, nonsmokers or in households with children were more likely to report smoking is not allowed anywhere inside the home. Twenty-five percent of nonsmoking respondents reported they were exposed to second-hand smoke in the past seven days; respondents who were male, 18 to 24 years old, non-white, Hispanic, with some post high school education or less, in the bottom 40 percent household income bracket or unmarried respondents were more likely to report this.
From 2009 to 2012, there was a statistical increase in the overall percent of respondents who reported smoking is not allowed anywhere inside the home. From 2009 to 2012, there was a statistical decrease in the overall percent of respondents who reported they were exposed to second-hand smoke in the past seven days.
Smoking Policy Inside Home In 2003, 75% of Wisconsin respondents reported smoking is prohibited in their home (2003 Tobacco Use Supplement to the Current Population Survey). In 2006-2007, 79% of U.S. respondents reported smoking is prohibited in their home (2006-2007 Tobacco Use Supplement to the Current Population Survey).
Figure 17. Smoking Cessation in Past 12 Months(Current Smokers)
83%78%72%
66%58%
55%53%
0%
20%
40%
60%
80%
100%
2003 2006 2009 2012
Health Care ProfessionalAdvised Respondent to Q uitQ uit Smoking for at Least 1Day

Milwaukee Community Health Survey Report—2012 121
2012 Findings • Seventy-one percent of respondents reported smoking is not allowed anywhere inside the home while 11%
reported smoking is allowed in some places or at some times. Four percent reported smoking is allowed anywhere inside the home. Thirteen percent of respondents reported there are no rules about smoking inside the home.
Figure 18. Smoking Policy Inside Home for 2012
Not Allowed Anywhere71%
No Rules About Smoking
13%Not Sure
<1%
Allowed Anywhere4%
Allowed Some Places/Some Times
11%
• Eighty-six percent of respondents in the top 40 percent household income bracket reported smoking is not
allowed in the home compared to 75% of those in the middle 20 percent income bracket or 65% of respondents in the bottom 40 percent household income bracket.
• Married respondents were more likely to report smoking is not allowed in the home compared to unmarried respondents (79% and 68%, respectively).
• Eighty-three percent of nonsmokers reported smoking is not allowed in the home compared to 42% of smokers.
• Respondents in households with children were more likely to report smoking is not allowed in the home (79%)
compared to respondents in households without children (66%). Year Comparisons • From 2009 to 2012, there was a statistical increase in the overall percent of respondents who reported smoking
is not allowed anywhere inside the home. • In both study years, respondents in the top 40 percent household income bracket were more likely to report
smoking is not allowed in the home. From 2009 to 2012, there was a noted increase in the percent of respondents in the bottom 40 percent household income bracket who reported smoking is not allowed in the home.
• In both study years, married respondents were more likely to report smoking is not allowed in the home. From
2009 to 2012, there was a noted increase in the percent of respondents across marital status who reported smoking is not allowed in the home.
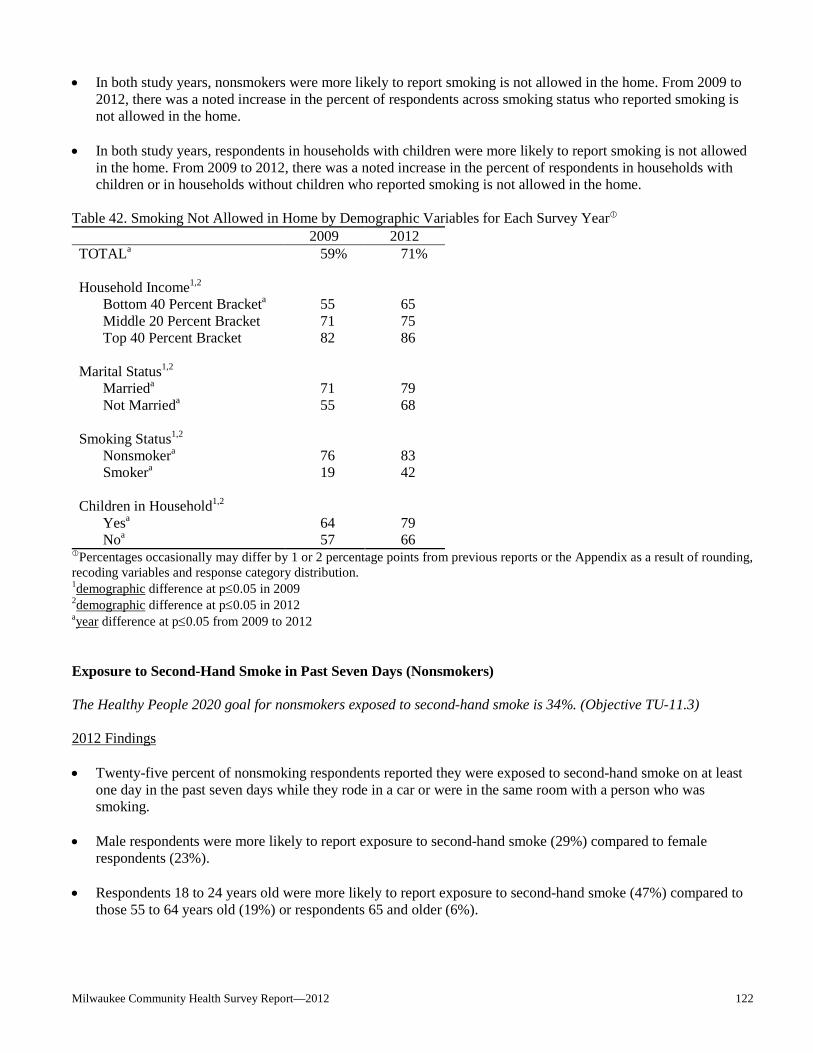
Milwaukee Community Health Survey Report—2012 122
• In both study years, nonsmokers were more likely to report smoking is not allowed in the home. From 2009 to 2012, there was a noted increase in the percent of respondents across smoking status who reported smoking is not allowed in the home.
• In both study years, respondents in households with children were more likely to report smoking is not allowed
in the home. From 2009 to 2012, there was a noted increase in the percent of respondents in households with children or in households without children who reported smoking is not allowed in the home.
Table 42. Smoking Not Allowed in Home by Demographic Variables for Each Survey Year 2009 2012 TOTALa 59% 71% Household Income1,2 Bottom 40 Percent Bracketa 55 65 Middle 20 Percent Bracket 71 75 Top 40 Percent Bracket 82 86 Marital Status1,2 Marrieda 71 79 Not Marrieda 55 68 Smoking Status1,2 Nonsmokera 76 83 Smokera 19 42 Children in Household1,2 Yesa 64 79 Noa 57 66
Percentages occasionally may differ by 1 or 2 percentage points from previous reports or the Appendix as a result of rounding, recoding variables and response category distribution.
1demographic difference at p≤0.05 in 2009 2demographic difference at p≤0.05 in 2012 ayear difference at p≤0.05 from 2009 to 2012 Exposure to Second-Hand Smoke in Past Seven Days (Nonsmokers) The Healthy People 2020 goal for nonsmokers exposed to second-hand smoke is 34%. (Objective TU-11.3) 2012 Findings • Twenty-five percent of nonsmoking respondents reported they were exposed to second-hand smoke on at least
one day in the past seven days while they rode in a car or were in the same room with a person who was smoking.
• Male respondents were more likely to report exposure to second-hand smoke (29%) compared to female
respondents (23%).
• Respondents 18 to 24 years old were more likely to report exposure to second-hand smoke (47%) compared to those 55 to 64 years old (19%) or respondents 65 and older (6%).
Milwaukee Community Health Survey Report—2012 123
• Twenty-nine percent of African American respondents and 28% of respondents who were non-white and non-African American reported exposure to second-hand smoke compared to 20% of white respondents.
• Hispanic respondents were more likely to report exposure to second-hand smoke compared to non-Hispanic
respondents (37% and 24%, respectively). • Thirty percent of respondents with a high school education or less and 29% of those with some post high school
education reported exposure to second-hand smoke compared to 16% of respondents with a college education.
• Twenty-eight percent of respondents in the bottom 40 percent household income bracket reported exposure to second-hand smoke compared to 23% of those in the middle 20 percent income bracket or 19% of respondents in the top 40 percent household income bracket.
• Unmarried respondents were more likely to report exposure to second-hand smoke compared to married
respondents (29% and 18%, respectively). Year Comparisons • From 2009 to 2012, there was a statistical decrease in the overall percent of respondents who reported exposure
to second-hand smoke in the past seven days. • In 2012, male respondents were more likely to report second-hand smoke exposure. In 2009, gender was not a
significant variable. From 2009 to 2012, there was a noted decrease in the percent of female respondents reporting second-hand smoke exposure.
• In both study years, respondents 18 to 24 years old were more likely to report second-hand smoke exposure.
From 2009 to 2012, there was a noted decrease in the percent of respondents 25 to 44 years old reporting exposure.
• In 2009, respondents who were non-white and non-African American were more likely to report second-hand
smoke exposure. In 2012, respondents who were non-white were more likely to report second-hand smoke exposure. From 2009 to 2012, there was a noted decrease in the percent of respondents who were non-white and non-African American reporting exposure.
• In 2012, Hispanic respondents were more likely to report second-hand smoke exposure. In 2009, Hispanic
origin was not a significant variable. From 2009 to 2012, there was a noted decrease in the percent of non-Hispanic respondents reporting exposure.
• In 2012, respondents with some post high school education or less were more likely to report second-hand
smoke exposure. In 2009, education was not a significant variable. From 2009 to 2012, there was a noted decrease in the percent of respondents with a college education reporting exposure.
• In 2012, respondents in the bottom 40 percent household income bracket were more likely to report second-
hand smoke exposure, with a noted decrease since 2009. In 2009, household income was not a significant variable.
• In 2012, unmarried respondents were more likely to report second-hand smoke exposure. In 2009, marital status
was not a significant variable. From 2009 to 2012, there was a noted decrease in the percent of married respondents reporting exposure.

Milwaukee Community Health Survey Report—2012 124
Table 43. Nonsmokers’ Exposure to Second-Hand Smoke in the Past Seven Days by Demographic Variables for Each Survey Year
2009 2012 TOTALa 32% 25% Gender2 Male 32 29 Femalea 33 23 Age1,2 18 to 24 49 47 25 to 34a 45 29 35 to 44a 31 21 45 to 54 27 25 55 to 64 23 19 65 and Older 12 6 Race1,2 White 25 20 African American 36 29 Othera 47 28 Hispanic Origin2 Hispanic 40 37 Non-Hispanica 32 24 Education2 High School or Less 33 30 Some Post High School 35 29
College Graduatea 30 16 Household Income2 Bottom 40 Percent Bracketa 35 28 Middle 20 Percent Bracket 32 23 Top 40 Percent Bracket 28 19 Marital Status2 Marrieda 30 18 Not Married 34 29
Percentages occasionally may differ by 1 or 2 percentage points from previous reports or the Appendix as a result of rounding, recoding variables and response category distribution. 1demographic difference at p≤0.05 in 2009 2demographic difference at p≤0.05 in 2012 ayear difference at p≤0.05 from 2009 to 2012

Milwaukee Community Health Survey Report—2012 125
Exposure to Cigarette Smoke Overall Year Comparisons • From 2009 to 2012, there was a statistical increase in the overall percent of respondents who reported smoking
is not allowed anywhere inside the home. From 2009 to 2012, there was a statistical decrease in the overall percent of respondents who reported they were exposed to second-hand smoke in the past seven days.
Alcohol Use (Figure 20; Tables 44 & 45) KEY FINDINGS: In 2012, 32% of respondents were binge drinkers in the past month. Respondents who were
male, 25 to 34 years old, white, with a college education or in the top 40 percent household income bracket were more likely to have binged at least once in the past month. Two percent reported they had been a driver or a passenger in the past month when the driver perhaps had too much to drink.
From 2003 to 2012, there was a statistical increase in the overall percent of respondents who reported binge drinking in the past month. From 2003 to 2012, there was no statistical change in the overall percent of respondents who reported in the past month they were a driver or passenger when the driver perhaps had too much to drink.
Binge Drinking in Past Month Binge drinking definitions vary. Currently, the Centers for Disease Control (CDC) defines binge drinking as four or more drinks per occasion for females and five or more drinks per occasion for males to account for weight and metabolism differences. Previously, the CDC defined binge drinking as five or more drinks at one time, regardless of gender. In 2012, Milwaukee defined binge drinking as four or more drinks for females and five or more drinks for males. The Healthy People 2020 goal for adult binge drinking (5 or more drinks) is 24%. (Objective SA-14.3)
Figure 19. Exposure to Cigarette Smoke
71%
59%
25%32%
0%
20%
40%
60%
80%
100%
2009 2012
Smoking Not Allowed in Home
Nonsmokers Exposed toSecond-Hand Smoke (past 7days)
Milwaukee Community Health Survey Report—2012 126
In 2010, 22% of Wisconsin respondents reported binge drinking in the past month (females having four or more drinks on one occasion, males having five or more drinks on one occasion). Fifteen percent of U.S. respondents reported binge drinking in the past month (2010 Behavioral Risk Factor Surveillance). 2012 Findings • Thirty-two percent of all respondents binged in the past month (four or more drinks for females and five or
more drinks for males). • Male respondents were more likely to have binged in the past month (38%) compared to female respondents
(27%).
• Respondents 25 to 34 years old were more likely to have binged in the past month (49%) compared to those 55 to 64 years old (20%) or respondents 65 and older (9%).
• White respondents were more likely to have binged in the past month (37%) compared to respondents who
were non-white (30%).
• Thirty-nine percent of respondents with a college education binged in the past month compared to 33% of those with some post high school education or 29% of respondents with a high school education or less.
• Forty-six percent of respondents in the top 40 percent household income bracket binged in the past month
compared to 33% of those in the middle 20 percent income bracket or 31% of respondents in the bottom 40 percent household income bracket.
Year Comparisons In 2003 and 2012, the Milwaukee Health Survey defined binge drinking as four or more drinks per occasion for females and five or more drinks per occasion for males. In all other study years the definition was five or more drinks, regardless of gender. • From 2003 to 2012, there was a statistical increase in the overall percent of respondents who binged. • In all study years, male respondents were more likely to have binged. From 2003 to 2012, there was a noted
increase in the percent of respondents across gender reporting binge drinking. • In 2003, respondents 18 to 24 years old were more likely to have binged. In 2006, 2009 and 2012, respondents
25 to 34 years old were more likely to have binged. From 2003 to 2012, there was a noted increase in the percent of respondents 25 to 54 years old or 65 and older who reported binge drinking.
• In 2003, respondents who were non-African American were more likely to have binged. In 2006, respondents
who were non-white and non-African American were more likely to have binged. In 2009 and 2012, white respondents were more likely to have binged. From 2003 to 2012, there was a noted increase in the percent of respondents who were white or African American reporting binge drinking.
• In 2006 and 2009, Hispanic respondents were more likely to have binged. In all other study years, Hispanic
origin was not a significant variable. From 2003 to 2012, there was a noted increase in the percent of respondents across Hispanic origin who reported binge drinking.

Milwaukee Community Health Survey Report—2012 127
• In 2003, respondents with some post high school education were more likely to have binged. In 2006, respondents with at least some post high school education were more likely to have binged. In 2009 and 2012, respondents with a college education were more likely to have binged. From 2003 to 2012, there was a noted increase in the percent of respondents with a high school education or less or with a college education reporting binge drinking.
• In 2006, respondents in the top 60 percent household income bracket were more likely to have binged. In 2009
and 2012, respondents in the top 40 percent household income bracket were more likely to have binged. In 2003, household income was not a significant variable. From 2003 to 2012, there was a noted increase in the percent of respondents across household income who reported binge drinking.
• Marital status was not a significant variable in any study year. From 2003 to 2012, there was a noted increase in
the percent of respondents across marital status reporting binge drinking.

Milwaukee Community Health Survey Report—2012 128
Table 44. Binge Drinking in Past Month by Demographic Variables for Each Survey Year, 2003 2006 2009 2012 TOTALa 17% 20% 19% 32% Gender1,2,3,4 Malea 25 29 27 38 Femalea 9 11 12 27 Age1,2,3,4 18 to 24 27 20 20 34 25 to 34a 24 29 31 49 35 to 44a 18 24 22 45 45 to 54a 14 21 14 24 55 to 64 12 11 10 20 65 and Oldera 2 5 7 9 Race1,2,3,4 Whitea 20 21 28 37 African Americana 11 14 12 30 Other 20 28 20 30 Hispanic Origin2,3 Hispanica 18 29 29 32 Non-Hispanica 17 19 18 32 Education1,2,3,4 High School or Lessa 13 16 16 29 Some Post High School 28 24 17 33
College Graduatea 13 23 27 39 Household Income2,3,4 Bottom 40 Percent Bracketa 17 17 14 31 Middle 20 Percent Bracketa 18 25 27 33 Top 40 Percent Bracketa 15 26 37 46 Marital Status Marrieda 15 20 19 29 Not Marrieda 18 20 19 34
Percentages occasionally may differ by 1 or 2 percentage points from previous reports or the Appendix as a result of rounding, recoding variables and response category distribution.
In 2003 and 2012, “4 or more drinks on an occasion” for females and “5 or more drinks on an occasion” for males was used; in all other study years, “5 or more drinks on an occasion” was used for both males and females. 1demographic difference at p≤0.05 in 2003; 2demographic difference at p≤0.05 in 2006 3demographic difference at p≤0.05 in 2009; 4demographic difference at p≤0.05 in 2012 ayear difference at p≤0.05 from 2003 to 2012
Milwaukee Community Health Survey Report—2012 129
Driver or Passenger in Vehicle When Driver Perhaps Had Too Much to Drink in Past Month 2012 Findings • Two percent of respondents reported in the past month they were a driver or passenger when the driver perhaps
had too much alcohol to drink. • No demographic comparisons were conducted as a result of the low percent of respondents who reported they
were a driver or passenger when the driver perhaps had too much to drink. Year Comparisons • From 2003 to 2012, there was no statistical change in the overall percent of respondents who reported they were
a driver or passenger in the past month when the driver perhaps had too much to drink.
• In 2006 and 2009, male respondents were more likely to report they were a driver or passenger in a vehicle when the driver perhaps had too much alcohol to drink. In 2003, gender was not a significant variable.
• In 2006, respondents 18 to 24 years old were more likely to report they were a driver or passenger in a vehicle
when the driver perhaps had too much alcohol to drink. In 2009, respondents 25 to 34 years old were more likely to report they were a driver or passenger in a vehicle when the driver perhaps had too much alcohol to drink. In 2003, age was not a significant variable.
• In 2009, respondents in the top 60 percent household income bracket were more likely to report they were a
driver or passenger in a vehicle when the driver perhaps had too much alcohol to drink. In 2003 and 2006, household income was not a significant variable.
• In 2009, unmarried respondents were more likely to report they were a driver or passenger in a vehicle when the
driver perhaps had too much alcohol to drink. In 2003 and 2006, marital status was not a significant variable.

Milwaukee Community Health Survey Report—2012 130
Table 45. Driver or Passenger in Vehicle When Driver Perhaps Had Too Much to Drink by Demographic Variables for Each Survey Year
2003 2006 2009 2012 TOTAL 3% 4% 4% 2% Gender2,3 Male 3 6 6 -- Female 3 2 2 -- Age2,3 18 to 24 3 7 4 -- 25 to 34 5 5 7 -- 35 to 44 4 5 3 -- 45 to 54 3 3 3 -- 55 to 64 3 2 <1 -- 65 and Older 2 <1 0 -- Race White 3 3 4 -- African American 4 5 3 -- Other 5 5 2 -- Hispanic Origin Hispanic 4 3 5 -- Non-Hispanic 3 4 4 -- Education High School or Less 3 4 3 -- Some Post High School 4 2 3 --
College Graduate 3 5 6 -- Household Income3 Bottom 40 Percent Bracket 4 4 3 -- Middle 20 Percent Bracket 2 3 7 -- Top 40 Percent Bracket 4 3 6 -- Marital Status3 Married 3 3 2 -- Not Married 4 4 4 --
Percentages occasionally may differ by 1 or 2 percentage points from previous reports or the Appendix as a result of rounding, recoding variables and response category distribution. Data is not shown as a result of insufficient statistical reliability due to the low percentage reporting this. 1demographic difference at p≤0.05 in 2003; 2demographic difference at p≤0.05 in 2006 3demographic difference at p≤0.05 in 2009; 4demographic difference at p≤0.05 in 2012
ayear difference at p≤0.05 from 2003 to 2012

Milwaukee Community Health Survey Report—2012 131
Alcohol Use Overall Year Comparisons • From 2003 to 2012, there was a statistical increase in the overall percent of respondents who reported binge
drinking in the past month. From 2003 to 2012, there was no statistical change in the overall percent of respondents who reported in the past month they were a driver or passenger when the driver perhaps had too much to drink.
*In 2003 and 2012, “4 or more drinks on an occasion” for females and “5 or more drinks on an occasion” for males were used; in all other study years, “5 or more drinks on an occasion” was used for both males and females. Household Problems (Figure 21; Table 46) KEY FINDINGS: In 2012, 3% of respondents reported someone in their household experienced a legal, social,
personal or physical problem in the past year in connection with drinking. Two percent of respondents reported someone in their household experienced a problem in connection with marijuana use. One percent of respondents each reported misuse of prescription drugs/over-the-counter drugs or a household problem with gambling. Less than one percent reported someone in their household experienced a problem in connection with cocaine/heroin/other street drugs.
From 2006 to 2012, there was no statistical change in the overall percent of respondents reporting they, or someone in their household, experienced some kind of problem, such as legal, social, personal or physical, in connection with drinking in the past year.
Figure 20. Alcohol Usein Past Month
32%
19%20%17%
2%4%4%3%0%
20%
40%
60%
80%
100%
2003 2006 2009 2012
Binge Drinking*
Driver/Passenger When DriverPerhaps Had Too Much to Drink
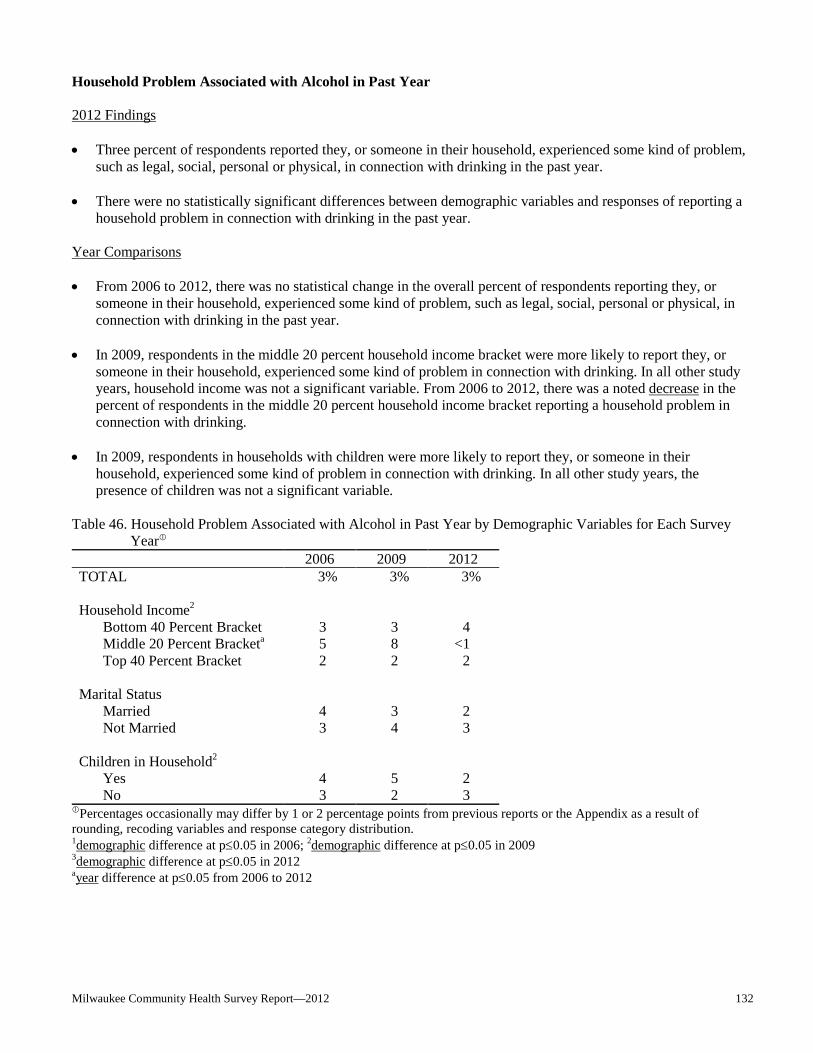
Milwaukee Community Health Survey Report—2012 132
Household Problem Associated with Alcohol in Past Year 2012 Findings • Three percent of respondents reported they, or someone in their household, experienced some kind of problem,
such as legal, social, personal or physical, in connection with drinking in the past year. • There were no statistically significant differences between demographic variables and responses of reporting a
household problem in connection with drinking in the past year. Year Comparisons • From 2006 to 2012, there was no statistical change in the overall percent of respondents reporting they, or
someone in their household, experienced some kind of problem, such as legal, social, personal or physical, in connection with drinking in the past year.
• In 2009, respondents in the middle 20 percent household income bracket were more likely to report they, or
someone in their household, experienced some kind of problem in connection with drinking. In all other study years, household income was not a significant variable. From 2006 to 2012, there was a noted decrease in the percent of respondents in the middle 20 percent household income bracket reporting a household problem in connection with drinking.
• In 2009, respondents in households with children were more likely to report they, or someone in their
household, experienced some kind of problem in connection with drinking. In all other study years, the presence of children was not a significant variable.
Table 46. Household Problem Associated with Alcohol in Past Year by Demographic Variables for Each Survey
Year
2006 2009 2012 TOTAL 3% 3% 3% Household Income2 Bottom 40 Percent Bracket 3 3 4 Middle 20 Percent Bracketa 5 8 <1 Top 40 Percent Bracket 2 2 2 Marital Status Married 4 3 2 Not Married 3 4 3 Children in Household2 Yes 4 5 2 No 3 2 3 Percentages occasionally may differ by 1 or 2 percentage points from previous reports or the Appendix as a result of rounding, recoding variables and response category distribution. 1demographic difference at p≤0.05 in 2006; 2demographic difference at p≤0.05 in 2009 3demographic difference at p≤0.05 in 2012 ayear difference at p≤0.05 from 2006 to 2012

Milwaukee Community Health Survey Report—2012 133
Other Household Problems in Past Year 2012 Findings • Two percent of respondents reported someone in their household experienced some kind of problem, such as
legal, social, personal or physical, in connection with marijuana use. One percent of respondents each reported a household problem with the misuse of prescription drugs/over-the-counter drugs or gambling while less than one percent of respondents reported a household problem with cocaine/heroin/other street drugs.
• No demographic comparisons were conducted as a result of too few respondents reporting a household problem
with any of the behaviors listed. Household Problems Overall Year Comparisons • From 2006 to 2012, there was no statistical change in the overall percent of respondents reporting they, or
someone in their household, experienced some kind of problem, such as legal, social, personal or physical, in connection with drinking in the past year.
Figure 21. Household Problems in Past Year
3%3%3%
2%1%
<1%0%
10%
20%
30%
2006 2009 2012
Drinking Alcohol
Marijuana
Misuse of Prescription Drugs orOver-the-Counter DrugsGambling
Cocaine, Heroin or Other StreetDrugs
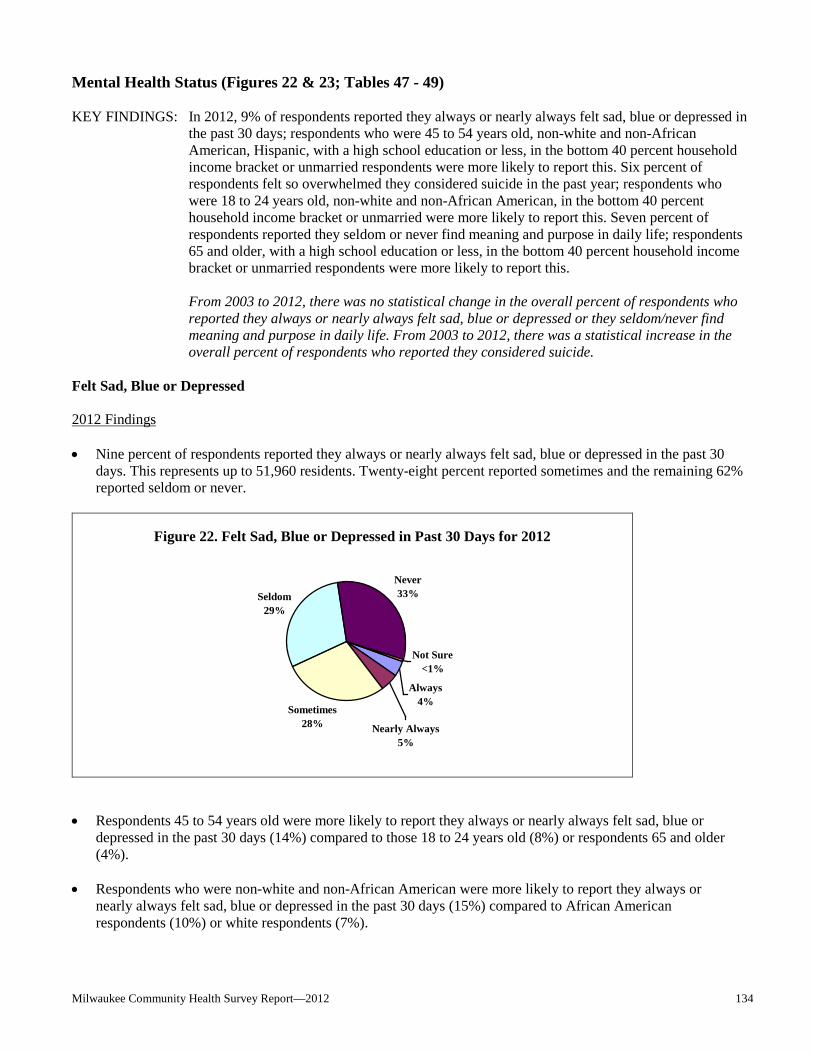
Milwaukee Community Health Survey Report—2012 134
Mental Health Status (Figures 22 & 23; Tables 47 - 49) KEY FINDINGS: In 2012, 9% of respondents reported they always or nearly always felt sad, blue or depressed in
the past 30 days; respondents who were 45 to 54 years old, non-white and non-African American, Hispanic, with a high school education or less, in the bottom 40 percent household income bracket or unmarried respondents were more likely to report this. Six percent of respondents felt so overwhelmed they considered suicide in the past year; respondents who were 18 to 24 years old, non-white and non-African American, in the bottom 40 percent household income bracket or unmarried were more likely to report this. Seven percent of respondents reported they seldom or never find meaning and purpose in daily life; respondents 65 and older, with a high school education or less, in the bottom 40 percent household income bracket or unmarried respondents were more likely to report this.
From 2003 to 2012, there was no statistical change in the overall percent of respondents who reported they always or nearly always felt sad, blue or depressed or they seldom/never find meaning and purpose in daily life. From 2003 to 2012, there was a statistical increase in the overall percent of respondents who reported they considered suicide.
Felt Sad, Blue or Depressed 2012 Findings • Nine percent of respondents reported they always or nearly always felt sad, blue or depressed in the past 30
days. This represents up to 51,960 residents. Twenty-eight percent reported sometimes and the remaining 62% reported seldom or never.
Figure 22. Felt Sad, Blue or Depressed in Past 30 Days for 2012
Always4%
Sometimes28%
Seldom29%
Never33%
Nearly Always5%
Not Sure<1%
• Respondents 45 to 54 years old were more likely to report they always or nearly always felt sad, blue or
depressed in the past 30 days (14%) compared to those 18 to 24 years old (8%) or respondents 65 and older (4%).
• Respondents who were non-white and non-African American were more likely to report they always or nearly always felt sad, blue or depressed in the past 30 days (15%) compared to African American respondents (10%) or white respondents (7%).

Milwaukee Community Health Survey Report—2012 135
• Hispanic respondents were more likely to report they always or nearly always felt sad, blue or depressed in the past 30 days compared to non-Hispanic respondents (17% and 8%, respectively).
• Fifteen percent of respondents with a high school education or less reported they always or nearly always felt
sad, blue or depressed in the past 30 days compared to 6% of those with some post high school education or 4% of respondents with a college education.
• Fourteen percent of respondents in the bottom 40 percent household income bracket reported they always or
nearly always felt sad, blue or depressed compared to 4% of those in the top 40 percent income bracket or less than one percent of respondents in the middle 20 percent household income bracket.
• Unmarried respondents were more likely to report they always or nearly always felt sad, blue or depressed compared to married respondents (11% and 5%, respectively).
Year Comparisons • From 2003 to 2012, there was no statistical change in the overall percent of respondents who reported in the
past 30 days they always or nearly always felt sad, blue or depressed.
• In 2003, female respondents were more likely to report they always or nearly always felt sad, blue or depressed. In all other study years, gender was not a significant variable.
• In 2006, 2009 and 2012, respondents 45 to 54 years old were more likely to report they always or nearly always
felt sad, blue or depressed. In 2003, age was not a significant variable. • In 2003, respondents who were non-white were more likely to report they always or nearly always felt sad, blue
or depressed. In 2006, African American respondents were more likely to report they always or nearly always felt sad, blue or depressed. In 2009 and 2012, respondents who were non-white and non-African American were more likely to report they always or nearly always felt sad, blue or depressed.
• In 2012, Hispanic respondents were more likely to report they always or nearly always felt sad, blue or
depressed. In all other study years, Hispanic origin was not a significant variable.
• In 2003, 2006 and 2012, respondents with a high school education or less were more likely to report they always or nearly always felt sad, blue or depressed in the past 30 days. In 2009, respondents with some post high school education or less were more likely to report they always or nearly always felt sad, blue or depressed.
• In all study years, respondents in the bottom 40 percent household income bracket were more likely to report
they always or nearly always felt sad, blue or depressed. From 2003 to 2012, there was a noted decrease in the percent of respondents in the middle 20 percent household income bracket reporting they always or nearly always felt sad, blue or depressed.
• In 2006, 2009 and 2012, unmarried respondents were more likely to report they always or nearly always felt
sad, blue or depressed. In 2003, marital status was not a significant variable.

Milwaukee Community Health Survey Report—2012 136
Table 47. Always/Nearly Always Felt Sad, Blue or Depressed in Past 30 Days by Demographic Variables for Each Survey Year
2003 2006 2009 2012 TOTAL 9% 10% 9% 9% Gender1 Male 6 9 8 8 Female 10 11 10 10 Age2,3,4 18 to 24 8 8 10 8 25 to 34 6 11 5 10 35 to 44 10 11 10 9 45 to 54 14 13 16 14 55 to 64 8 9 12 11 65 and Older 6 6 5 4 Race1,2,3,4 White 6 7 7 7 African American 12 14 9 10 Other 11 11 17 15 Hispanic Origin4 Hispanic 12 10 14 17 Non-Hispanic 8 10 9 8 Education1,2,3,4 High School or Less 11 14 11 15 Some Post High School 7 8 10 6
College Graduate 4 3 4 4 Household Income1,2,3,4 Bottom 40 Percent Bracket 11 13 12 14 Middle 20 Percent Bracketa 9 2 7 <1 Top 40 Percent Bracket 3 2 0 4 Marital Status2,3,4 Married 7 6 4 5 Not Married 9 11 11 11
Percentages occasionally may differ by 1 or 2 percentage points from previous reports or the Appendix as a result of rounding, recoding variables and response category distribution.
1demographic difference at p≤0.05 in 2003; 2demographic difference at p≤0.05 in 2006 3demographic difference at p≤0.05 in 2009; 4demographic difference at p≤0.05 in 2012 ayear difference at p≤0.05 from 2003 to 2012
Milwaukee Community Health Survey Report—2012 137
Considered Suicide All respondents were asked if they have felt so overwhelmed that they considered suicide in the past year. The survey did not ask how seriously, how often or how recent suicide was considered. 2012 Findings • Six percent of respondents reported they felt so overwhelmed in the past year that they considered suicide.
Although this is a small percent, it represents up to 38,970 residents who may have considered suicide in the past year.
• Respondents 18 to 24 years old were more likely to report they considered suicide in the past year (11%)
compared to respondents 65 and older (1%). • Respondents who were non-white and non-African American were more likely to report they considered suicide
in the past year (12%) compared to African American respondents (6%) or white respondents (5%).
• Eight percent of respondents in the bottom 40 percent household income bracket reported they considered suicide in the past year compared to 4% of those in the top 40 percent income bracket or less than one percent of respondents in the middle 20 percent household income bracket.
• Unmarried respondents were more likely to report they considered suicide in the past year compared to married
respondents (8% and 3%, respectively). Year Comparisons • From 2003 to 2012, there was a statistical increase in the overall percent of respondents who reported they
considered suicide in the past year. • In 2003, female respondents were more likely to report they considered suicide in the past year. In all other
study years, gender was not a significant variable. From 2003 to 2012, there was a noted increase in the percent of male respondents reporting they considered suicide in the past year.
• In 2006, respondents 35 to 44 years old were more likely to report they considered suicide in the past year. In
2009, respondents 45 to 54 years old were more likely to report they considered suicide. In 2012, respondents 18 to 24 years old were more likely to report they considered suicide in the past year, with a noted increase since 2003. In 2003, age was not a significant variable. From 2003 to 2012, there was a noted increase in the percent of respondents 35 to 44 years old reporting they considered suicide in the past year.
• In 2012, respondents who were non-white and non-African American were more likely to report they
considered suicide in the past year, with a noted increase since 2003. In all other study years, race was not a significant variable. From 2003 to 2012, there was a noted increase in the percent of African American respondents reporting they considered suicide in the past year.
• Hispanic origin was not a significant variable in any study year. From 2003 to 2012, there was a noted increase
in the percent of non-Hispanic respondents reporting they considered suicide in the past year.
• Education was not a significant variable in any study year. From 2003 to 2012, there was a noted increase in the percent of respondents with a high school education or less or with a college education reporting they considered suicide in the past year.

Milwaukee Community Health Survey Report—2012 138
• In all study years, respondents in the bottom 40 percent household income bracket were more likely to report they considered suicide in the past year.
• In 2006, 2009 and 2012, unmarried respondents were more likely to report they considered suicide in the past
year. In 2003, marital status was not a significant variable. From 2003 to 2012, there was a noted increase in the percent of unmarried respondents reporting they considered suicide in the past year.
Table 48. Considered Suicide in the Past Year by Demographic Variables for Each Survey Year 2003 2006 2009 2012 TOTALa 4% 7% 7% 6% Gender1 Malea 2 7 7 6 Female 5 8 6 6 Age2,3,4 18 to 24a 4 8 7 11 25 to 34 5 8 3 4 35 to 44a 3 10 7 8 45 to 54 5 8 13 8 55 to 64 6 4 8 4 65 and Older 1 2 3 1 Race4 White 5 6 6 5 African Americana 3 8 7 6 Othera 4 8 6 12 Hispanic Origin Hispanic 2 8 9 8 Non-Hispanica 4 7 6 6 Education High School or Lessa 4 8 7 7 Some Post High School 5 8 8 5
College Graduatea 2 6 4 6 Household Income1,2,3,4 Bottom 40 Percent Bracket 6 9 8 8 Middle 20 Percent Bracket 2 4 5 <1 Top 40 Percent Bracket 2 5 1 4 Marital Status2,3,4 Married 2 5 4 3 Not Marrieda 5 8 8 8
Percentages occasionally may differ by 1 or 2 percentage points from previous reports or the Appendix as a result of rounding, recoding variables and response category distribution.
1demographic difference at p≤0.05 in 2003; 2demographic difference at p≤0.05 in 2006 3demographic difference at p≤0.05 in 2009; 4demographic difference at p≤0.05 in 2012 ayear difference at p≤0.05 from 2003 to 2012

Milwaukee Community Health Survey Report—2012 139
Find Meaning and Purpose in Daily Life 2012 Findings • A total of 7% of respondents reported they seldom or never find meaning and purpose in daily life. Fifty percent
of respondents reported they always find meaning and purpose while an additional 24% reported nearly always.
• Respondents 65 and older were more likely to report they seldom or never find meaning and purpose in daily life (13%) compared to respondents 35 to 44 years old (3%).
• Ten percent of respondents with a high school education or less reported they seldom or never find meaning and purpose in daily life compared to 6% of those with some post high school education or 2% of respondents with a college education.
• Eight percent of respondents in the bottom 40 percent household income bracket reported they seldom or never
find meaning and purpose in daily life compared to 3% of those in the top 40 percent income bracket or 2% of respondents in the middle 20 percent household income bracket.
• Unmarried respondents were more likely to report they seldom or never find meaning and purpose in daily life
compared to married respondents (8% and 5%, respectively). Year Comparisons • From 2003 to 2012, there was no statistical change in the overall percent of respondents who reported they
seldom or never find meaning and purpose in daily life. • In 2003 and 2006, male respondents were more likely to report they seldom/never find meaning and purpose in
daily life. In all other study years, gender was not a significant variable.
• In 2009, respondents 45 to 54 years old were more likely to report they seldom/never find meaning and purpose in daily life. In 2012, respondents 65 and older were more likely to report they seldom/never find meaning and purpose in daily life. In all other study years, age was not a significant variable.
• In 2006 and 2009, respondents who were non-white and non-African American were more likely to report they
seldom/never find meaning and purpose in daily life. In all other study years, race was not a significant variable.
• In 2003, Hispanic respondents were more likely to report they seldom/never find meaning and purpose in daily
life. In all other study years, Hispanic origin was not a significant variable.
• In all study years, respondents with a high school education or less were more likely to report they seldom/never find meaning and purpose in daily life.
• In all study years, respondents in the bottom 40 percent household income bracket were more likely to report
they seldom/never find meaning and purpose in daily life.
• In 2006, 2009 and 2012, unmarried respondents were more likely to report they seldom/never find meaning and purpose in daily life. In 2003, marital status was not a significant variable.

Milwaukee Community Health Survey Report—2012 140
Table 49. Seldom/Never Find Meaning and Purpose in Daily Life by Demographic Variables for Each Survey Year
2003 2006 2009 2012 TOTAL 7% 6% 7% 7% Gender1,2 Male 8 7 8 9 Female 5 5 6 6 Age3,4 18 to 24 7 5 5 7 25 to 34 6 6 3 7 35 to 44 6 6 6 3 45 to 54 5 6 12 7 55 to 64 6 8 7 8 65 and Older 8 6 8 13 Race2,3 White 7 5 6 6 African American 6 7 6 9 Other 5 9 13 5 Hispanic Origin1 Hispanic 13 9 9 8 Non-Hispanic 6 6 6 7 Education1,2,3,4 High School or Less 9 8 9 10 Some Post High School 5 6 4 6
College Graduate 4 2 4 2 Household Income1,2,3,4 Bottom 40 Percent Bracket 9 8 9 8 Middle 20 Percent Bracket 6 2 3 2 Top 40 Percent Bracket 5 <1 1 3 Marital Status2,3,4 Married 6 4 3 5 Not Married 7 8 8 8
Percentages occasionally may differ by 1 or 2 percentage points from previous reports or the Appendix as a result of rounding, recoding variables and response category distribution.
1demographic difference at p≤0.05 in 2003; 2demographic difference at p≤0.05 in 2006 3demographic difference at p≤0.05 in 2009; 4demographic difference at p≤0.05 in 2012
ayear difference at p≤0.05 from 2003 to 2012

Milwaukee Community Health Survey Report—2012 141
Mental Health Status Overall Year Comparisons • From 2003 to 2012, there was no statistical change in the overall percent of respondents who reported they
always or nearly always felt sad, blue or depressed or they seldom/never find meaning and purpose in daily life. From 2003 to 2012, there was a statistical increase in the overall percent of respondents who reported they considered suicide.
Personal Safety Issues (Figure 24; Tables 50 - 52) KEY FINDINGS: In 2012, 8% of respondents reported someone made them afraid for their personal safety in the
past year; respondents who were non-Hispanic or with at least some post high school education were more likely to report this. Four percent of respondents reported they had been pushed, kicked, slapped or hit in the past year; respondents who were male or unmarried were more likely to report this. A total of 10% reported at least one of these two situations; respondents who were non-Hispanic or with some post high school education were more likely to report this.
From 2003 to 2012, there was no statistical change in the overall percent of respondents reporting they were afraid for their personal safety or they were pushed, kicked, slapped or hit. From 2003 to 2012, there was no statistical change in the overall percent of respondents reporting at least one of the two personal safety issues.
Afraid for Personal Safety 2012 Findings • Eight percent of respondents reported someone made them afraid for their personal safety in the past year. • Non-Hispanic respondents were more likely to report someone made them afraid for their personal safety in the
past year compared to Hispanic respondents (9% and 3%, respectively).
Figure 23. Mental Health Status
9%10% 9%9%
7%6%
7%6%7%
7%
4%0%
10%
20%
30%
40%
2003 2006 2009 2012
Felt sad, blue, depressed always/nearlyalways (past 30 days)
Find meaning & purpose in daily lifeseldom/never
Considered suicide (past year)

Milwaukee Community Health Survey Report—2012 142
• Ten percent of respondents with at least some post high school education reported someone made them afraid for their personal safety in the past year compared to 5% of respondents with a high school education or less.
o Fifty-four percent of respondents who were afraid for their personal safety in the past year reported it
was a stranger who made them afraid. Sixteen percent reported an acquaintance while 10% of respondents reported a boyfriend/girlfriend.
Year Comparisons • From 2003 to 2012, there was no statistical change in the overall percent of respondents who reported they were
afraid for their personal safety. • In 2006, male respondents were more likely to report being afraid for their personal safety. In all other study
years, gender was not a significant variable.
• In 2006, respondents who were 18 to 24 years old or 45 to 54 years old were more likely to report being afraid for their personal safety. In all other study years, age was not a significant variable.
• In 2012, non-Hispanic respondents were more likely to report being afraid for their personal safety. In all other
study years, Hispanic origin was not a significant variable.
• In 2006 and 2012, respondents with at least some post high school education were more likely to report being afraid for their personal safety. In all other study years, education was not a significant variable.
• In 2006 and 2009, unmarried respondents were more likely to report being afraid for their personal safety. In all
other study years, marital status was not a significant variable.

Milwaukee Community Health Survey Report—2012 143
Table 50. Afraid for Personal Safety by Demographic Variables for Each Survey Year
2003 2006 2009 2012 TOTAL 7% 13% 10% 8% Gender2 Male 6 14 10 8 Female 8 11 10 8 Age2 18 to 24 10 17 6 7 25 to 34 6 12 10 6 35 to 44 8 15 10 9 45 to 54 6 17 15 8 55 to 64 9 11 12 14 65 and Older 4 4 7 5 Race White 7 13 12 9 African American 7 12 9 6 Other 6 13 7 8 Hispanic Origin4 Hispanic 5 11 8 3 Non-Hispanic 7 13 10 9 Education2,4 High School or Less 6 11 9 5 Some Post High School 8 14 11 10
College Graduate 8 15 10 10 Household Income Bottom 40 Percent Bracket 7 13 11 9 Middle 20 Percent Bracket 6 11 10 6 Top 40 Percent Bracket 8 13 7 8 Marital Status2,3 Married 6 9 7 7 Not Married 8 15 11 8 Percentages occasionally may differ by 1 or 2 percentage points from previous reports or the Appendix as a result of rounding, recoding variables and response category distribution. 1demographic difference at p≤0.05 in 2003; 2demographic difference at p≤0.05 in 2006 3demographic difference at p≤0.05 in 2009; 4demographic difference at p≤0.05 in 2012 ayear difference at p≤0.05 from 2003 to 2012

Milwaukee Community Health Survey Report—2012 144
Pushed, Kicked, Slapped or Hit 2012 Findings • Four percent of respondents reported they were pushed, kicked, slapped or hit in the past year. • Male respondents were more likely to report they were pushed, kicked, slapped or hit in the past year (6%)
compared to female respondents (3%).
• Unmarried respondents were more likely to report they were pushed, kicked, slapped or hit in the past year compared to married respondents (5% and 1%, respectively).
o Thirty-four percent of respondents who were pushed, kicked, slapped or hit in the past year reported it
was a stranger who did it to them. Twenty-seven percent reported it was a friend while 17% reported an acquaintance.
Year Comparisons • From 2003 to 2012, there was no statistical change in the overall percent of respondents who reported they were
pushed, kicked, slapped or hit in the past year. • In all study years, male respondents were more likely to report they were pushed, kicked, slapped or hit in the
past year.
• In 2003, 2006 and 2009, respondents 18 to 24 years old were more likely to report they were pushed, kicked, slapped or hit in the past year. In 2012, age was not a significant variable. From 2003 to 2012, there was a noted decrease in the percent of respondents 18 to 24 years old reporting they were pushed, kicked, slapped or hit in the past year.
• In 2003, respondents who were non-white and non-African American were more likely to report they were
pushed, kicked, slapped or hit in the past year. In 2006, respondents who were African American or non-white and non-African American were more likely to report they were pushed, kicked, slapped or hit in the past year. In all other study years, race was not a significant variable. From 2003 to 2012, there was a noted decrease in the percent of respondents who were non-white and non-African American reporting they were pushed, kicked, slapped or hit in the past year.
• In 2003, respondents with some post high school education were more likely to report they were pushed,
kicked, slapped or hit in the past year. In all other study years, education was not a significant variable. From 2003 to 2012, there was a noted decrease in the percent of respondents with some post high school education and a noted increase in the percent of respondents with a college education reporting they were pushed, kicked, slapped or hit in the past year.
• In 2003, respondents in the bottom 40 percent household income bracket were more likely to report they were
pushed, kicked, slapped or hit in the past year. In 2006, respondents in the bottom 40 percent household income bracket or in the top 40 percent household income bracket were more likely to report they were pushed, kicked, slapped or hit in the past year. In all other study years, household income was not a significant variable.
• In all study years, unmarried respondents were more likely to report they were pushed, kicked, slapped or hit in
the past year.
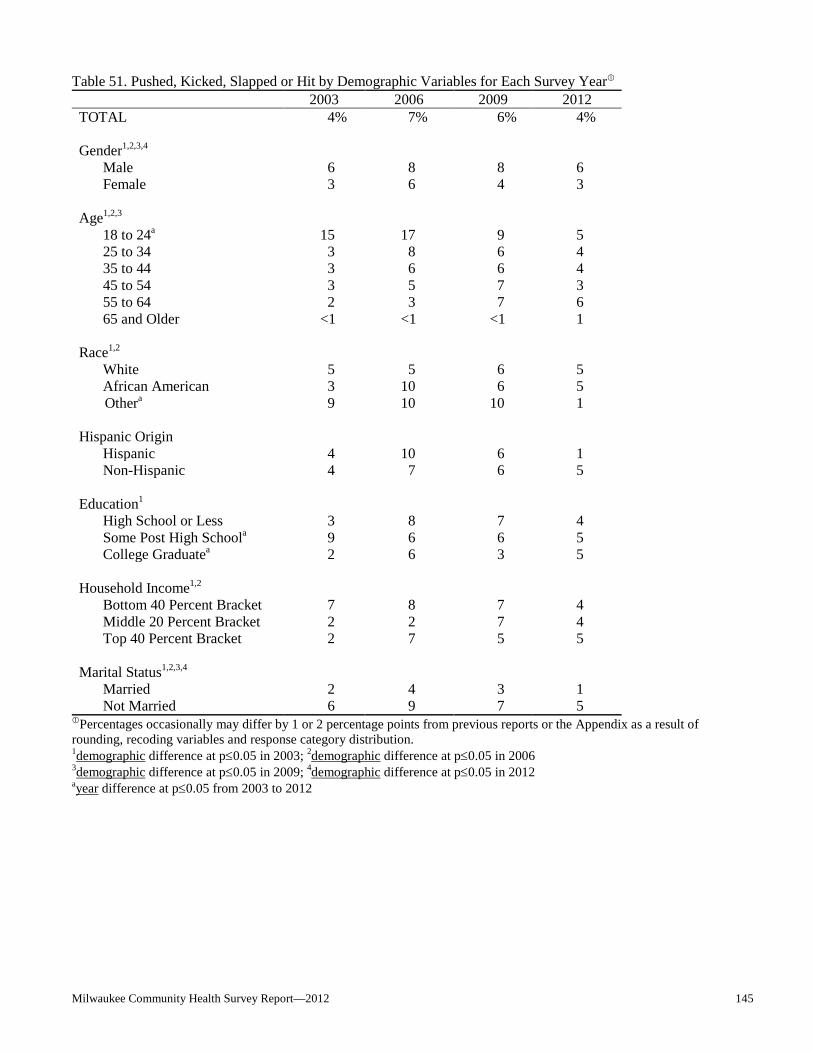
Milwaukee Community Health Survey Report—2012 145
Table 51. Pushed, Kicked, Slapped or Hit by Demographic Variables for Each Survey Year
2003 2006 2009 2012 TOTAL 4% 7% 6% 4% Gender1,2,3,4 Male 6 8 8 6 Female 3 6 4 3 Age1,2,3 18 to 24a 15 17 9 5 25 to 34 3 8 6 4 35 to 44 3 6 6 4 45 to 54 3 5 7 3 55 to 64 2 3 7 6 65 and Older <1 <1 <1 1 Race1,2 White 5 5 6 5 African American 3 10 6 5 Othera 9 10 10 1 Hispanic Origin Hispanic 4 10 6 1 Non-Hispanic 4 7 6 5 Education1 High School or Less 3 8 7 4 Some Post High Schoola 9 6 6 5
College Graduatea 2 6 3 5 Household Income1,2 Bottom 40 Percent Bracket 7 8 7 4 Middle 20 Percent Bracket 2 2 7 4 Top 40 Percent Bracket 2 7 5 5 Marital Status1,2,3,4 Married 2 4 3 1 Not Married 6 9 7 5 Percentages occasionally may differ by 1 or 2 percentage points from previous reports or the Appendix as a result of rounding, recoding variables and response category distribution. 1demographic difference at p≤0.05 in 2003; 2demographic difference at p≤0.05 in 2006 3demographic difference at p≤0.05 in 2009; 4demographic difference at p≤0.05 in 2012 ayear difference at p≤0.05 from 2003 to 2012

Milwaukee Community Health Survey Report—2012 146
Combined Personal Safety Issues 2012 Findings • A total of 10% of all respondents reported at least one of the two issues. • Non-Hispanic respondents were more likely to report at least one of the personal safety issues compared to
Hispanic respondents (11% and 4%, respectively).
• Thirteen percent of respondents with some post high school education reported at least one of the personal safety issues compared to 11% of those with a college education or 8% of respondents with a high school education or less.
Year Comparisons • From 2003 to 2012, there was no statistical change in the overall percent of respondents who reported at least
one of the personal safety issues. • In 2006 and 2009, male respondents were more likely to report at least one of the personal safety issues. In all
other study years, gender was not a significant variable.
• In 2003 and 2006, respondents 18 to 24 years old were more likely to report at least one of the personal safety issues. In 2009, respondents 45 to 54 years old were more likely to report at least one of the personal safety issues. In 2012, age was not a significant variable. From 2003 to 2012, there was a noted decrease in the percent of respondents 18 to 24 years old reporting at least one of the personal safety issues.
• In 2012, non-Hispanic respondents were more likely to report at least one of the personal safety issues. In all
other study years, Hispanic origin was not a significant variable.
• In 2003 and 2012, respondents with some post high school education were more likely to report at least one of the personal safety issues. In all other study years, education was not a significant variable.
• In 2003, 2006 and 2009, unmarried respondents were more likely to report at least one of the personal safety
issues. In 2012, marital status was not a significant variable.

Milwaukee Community Health Survey Report—2012 147
Table 52. At Least One of the Personal Safety Issues by Demographic Variables for Each Survey Year 2003 2006 2009 2012 TOTAL 10% 16% 13% 10% Gender2,3 Male 12 19 16 10 Female 9 13 11 10 Age1,2,3 18 to 24a 21 23 12 10 25 to 34 9 16 13 9 35 to 44 9 16 13 11 45 to 54 8 20 19 10 55 to 64 11 13 15 16 65 and Older 4 4 7 5 Race White 11 15 15 11 African American 8 17 12 9 Other 10 18 14 9 Hispanic Origin4 Hispanic 7 17 11 4 Non-Hispanic 10 16 13 11 Education1,4 High School or Less 8 15 13 8 Some Post High School 16 15 14 13
College Graduate 9 18 12 11 Household Income Bottom 40 Percent Bracket 11 17 14 11 Middle 20 Percent Bracket 7 12 14 9 Top 40 Percent Bracket 10 15 9 10 Marital Status1,2,3 Married 7 10 9 8 Not Married 12 19 15 11
Percentages occasionally may differ by 1 or 2 percentage points from previous reports or the Appendix as a result of rounding, recoding variables and response category distribution.
1demographic difference at p≤0.05 in 2003; 2demographic difference at p≤0.05 in 2006 3demographic difference at p≤0.05 in 2009; 4demographic difference at p≤0.05 in 2012 ayear difference at p≤0.05 from 2003 to 2012

Milwaukee Community Health Survey Report—2012 148
Personal Safety Issues Overall Year Comparisons • From 2003 to 2012, there was no statistical change in the overall percent of respondents reporting they were
afraid for their personal safety or they were pushed, kicked, slapped or hit. From 2003 to 2012, there was no statistical change in the overall percent of respondents reporting at least one of the two personal safety issues.
Children in Household (Tables 53 - 58) KEY FINDINGS: In 2012, a random child was selected for the respondent to talk about the child’s health issues.
Eighty-eight percent of respondents reported they have one or more persons they think of as their child’s personal doctor or nurse, with 96% reporting their child visited their personal doctor or nurse for preventive care during the past 12 months. Ten percent of respondents reported there was a time in the last 12 months their child did not receive the dental care needed. Three percent of respondents reported their child did not receive the medical care needed while 2% reported their child did not visit a specialist they needed to see. Seventy-five percent of respondents reported their 5 to 17 year old child ate two or more servings of fruit on an average day while 31% reported three or more servings of vegetables. Sixty-six percent of respondents reported their 5 to 17 year old child was physically active five times a week for 60 minutes. Fourteen percent of respondents reported their child currently had asthma, with 46% of them having had an asthma attack in the past year. Four percent of respondents with a child two years old or younger reported their infant child slept in a bed with them or with another person. Eight percent of respondents reported their 8 to 17 year old child always or nearly always felt unhappy, sad or depressed in the past six months. Six percent of respondents reported their child was seldom or never safe in their community or neighborhood. Twenty-three percent reported their 8 to 17 year old child experienced some form of bullying in the past 12 months. Eighteen percent reported verbal bullying, 11% reported physical bullying and 2% reported cyber bullying.
Figure 24. Personal Safety Issues in Past Year
8%10%
13%
7%4%6%7%4%
10%13%
16%
10%
0%
20%
40%
2003 2006 2009 2012
Someone made you afraid foryour personal safety
Someone pushed, kicked,slapped or hit you
At least 1 of the 2 issues
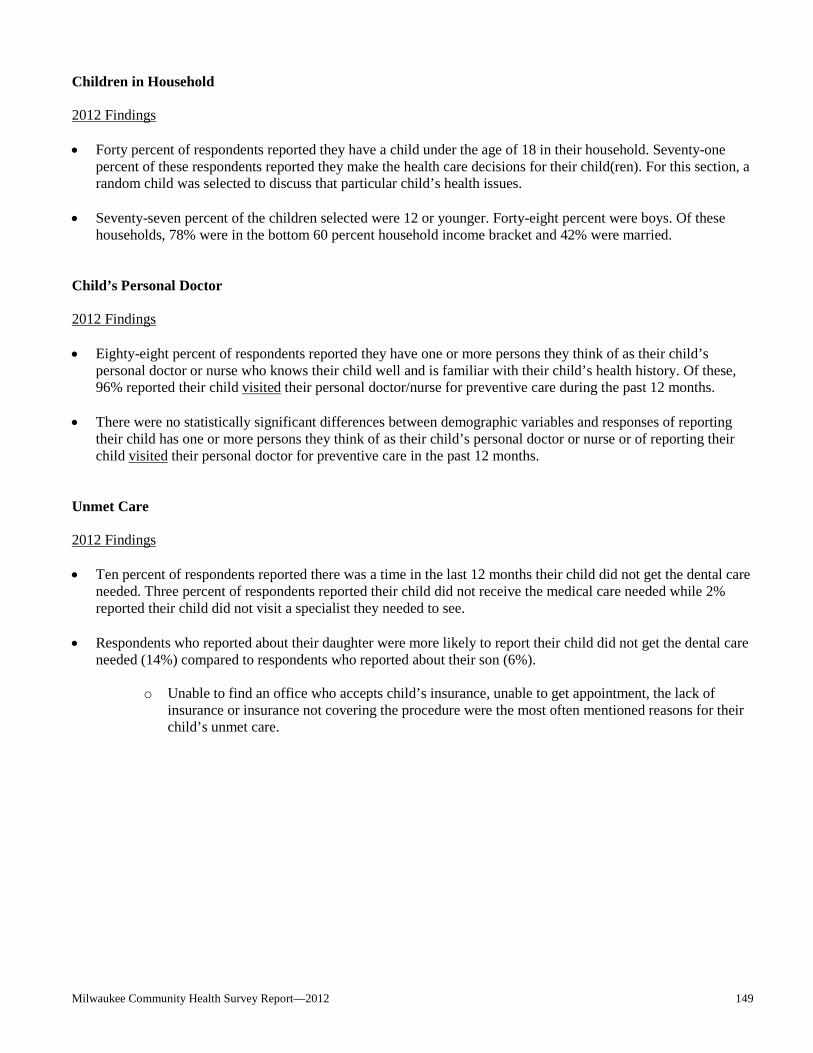
Milwaukee Community Health Survey Report—2012 149
Children in Household 2012 Findings • Forty percent of respondents reported they have a child under the age of 18 in their household. Seventy-one
percent of these respondents reported they make the health care decisions for their child(ren). For this section, a random child was selected to discuss that particular child’s health issues.
• Seventy-seven percent of the children selected were 12 or younger. Forty-eight percent were boys. Of these
households, 78% were in the bottom 60 percent household income bracket and 42% were married. Child’s Personal Doctor 2012 Findings • Eighty-eight percent of respondents reported they have one or more persons they think of as their child’s
personal doctor or nurse who knows their child well and is familiar with their child’s health history. Of these, 96% reported their child visited their personal doctor/nurse for preventive care during the past 12 months.
• There were no statistically significant differences between demographic variables and responses of reporting
their child has one or more persons they think of as their child’s personal doctor or nurse or of reporting their child visited their personal doctor for preventive care in the past 12 months.
Unmet Care 2012 Findings • Ten percent of respondents reported there was a time in the last 12 months their child did not get the dental care
needed. Three percent of respondents reported their child did not receive the medical care needed while 2% reported their child did not visit a specialist they needed to see.
• Respondents who reported about their daughter were more likely to report their child did not get the dental care
needed (14%) compared to respondents who reported about their son (6%).
o Unable to find an office who accepts child’s insurance, unable to get appointment, the lack of insurance or insurance not covering the procedure were the most often mentioned reasons for their child’s unmet care.
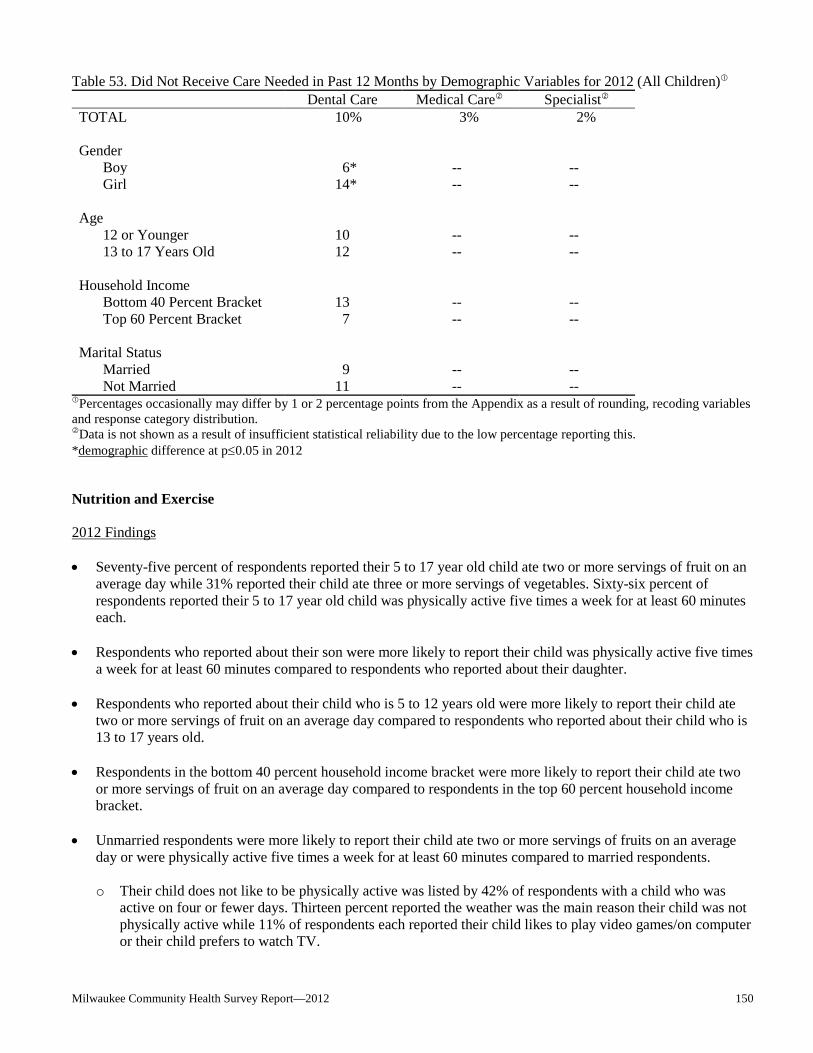
Milwaukee Community Health Survey Report—2012 150
Table 53. Did Not Receive Care Needed in Past 12 Months by Demographic Variables for 2012 (All Children)
Dental Care Medical Care Specialist TOTAL 10% 3% 2% Gender Boy 6* -- -- Girl 14* -- -- Age 12 or Younger 10 -- -- 13 to 17 Years Old 12 -- -- Household Income Bottom 40 Percent Bracket 13 -- -- Top 60 Percent Bracket 7 -- -- Marital Status Married 9 -- -- Not Married 11 -- --
Percentages occasionally may differ by 1 or 2 percentage points from the Appendix as a result of rounding, recoding variables and response category distribution. Data is not shown as a result of insufficient statistical reliability due to the low percentage reporting this.
*demographic difference at p≤0.05 in 2012 Nutrition and Exercise 2012 Findings • Seventy-five percent of respondents reported their 5 to 17 year old child ate two or more servings of fruit on an
average day while 31% reported their child ate three or more servings of vegetables. Sixty-six percent of respondents reported their 5 to 17 year old child was physically active five times a week for at least 60 minutes each.
• Respondents who reported about their son were more likely to report their child was physically active five times a week for at least 60 minutes compared to respondents who reported about their daughter.
• Respondents who reported about their child who is 5 to 12 years old were more likely to report their child ate
two or more servings of fruit on an average day compared to respondents who reported about their child who is 13 to 17 years old.
• Respondents in the bottom 40 percent household income bracket were more likely to report their child ate two
or more servings of fruit on an average day compared to respondents in the top 60 percent household income bracket.
• Unmarried respondents were more likely to report their child ate two or more servings of fruits on an average
day or were physically active five times a week for at least 60 minutes compared to married respondents.
o Their child does not like to be physically active was listed by 42% of respondents with a child who was active on four or fewer days. Thirteen percent reported the weather was the main reason their child was not physically active while 11% of respondents each reported their child likes to play video games/on computer or their child prefers to watch TV.

Milwaukee Community Health Survey Report—2012 151
Table 54. Nutrition and Exercise by Demographic Variables for 2012 (Children 5 to 17 Years Old) Fruit (2 or More
Servings) Vegetables (3 or More Servings)
Physically Active (5x/Week/60 Min)
TOTAL 75% 31% 66% Gender Boy 79 33 73* Girl 71 30 58* Age 5 to 12 Years Old 80* 29 69 13 to 17 Years Old 66* 35 59 Household Income Bottom 40 Percent Bracket 80* 32 70 Top 60 Percent Bracket 68* 31 58 Marital Status Married 67* 33 53* Not Married 80* 30 75*
Percentages occasionally may differ by 1 or 2 percentage points from the Appendix as a result of rounding, recoding variables and response category distribution.
*demographic difference at p≤0.05 in 2012
Current Asthma 2012 Findings • Fourteen percent of respondents reported their child currently had asthma. • Nineteen percent of respondents in the bottom 40 percent household income bracket reported their child
currently has asthma compared to 6% of those in the top 60 percent household income bracket.
• Unmarried respondents were more likely to report their child currently has asthma compared to married respondents (17% and 9%, respectively).
o Forty-six percent of respondents reported in the past 12 months their child had an asthma attack that limited
his or her activity more than usual or where they sought medical care.

Milwaukee Community Health Survey Report—2012 152
Table 55. Current Asthma by Demographic Variables for 2012 (All Children) 2012 TOTAL 14% Gender Boy 15 Girl 13 Age 12 or Younger 13 13 to 17 Years Old 16 Household Income1 Bottom 40 Percent Bracket 19 Top 60 Percent Bracket 6 Marital Status1 Married 9 Not Married 17
Percentages occasionally may differ by 1 or 2 percentage points from the Appendix as a result of rounding, recoding variables and response category distribution. 1demographic difference at p≤0.05 in 2012 Child’s Sleeping Arrangement 2012 Findings • Four percent of respondents with a toddler child (2 years old or younger) reported as an infant, their child slept
with them or with another person.
• No demographic comparisons were conducted as a result of the low percent of respondents who were asked this question.
Child’s Emotional Well-Being 2012 Findings • Eight percent of respondents reported their 8 to 17 year old child always or nearly always felt unhappy, sad or
depressed in the past six months. • There were no statistically significant differences between demographic variables and responses of their child
always or nearly always felt unhappy, sad or depressed in the past six months.

Milwaukee Community Health Survey Report—2012 153
Table 56. Child Always/Nearly Always Felt Unhappy, Sad or Depressed by Demographic Variables for 2012 (Children 8 to 17 Years Old)
2012 TOTAL 8% Gender Boy 8 Girl 8 Age 8 to 12 Years Old 4 13 to 17 Years Old 12 Household Income Bottom 40 Percent Bracket 7 Top 60 Percent Bracket 8 Marital Status Married 7 Not Married 8
Percentages occasionally may differ by 1 or 2 percentage points from the Appendix as a result of rounding, recoding variables and response category distribution. 1demographic difference at p≤0.05 in 2012 Neighborhood Safety for Child 2012 Findings • Six percent of respondents reported their child is seldom/never safe in their community or neighborhood. • Respondents who reported about their son were more likely to report their child is seldom/never safe in their
community or neighborhood (9%) compared to respondents who reported about their daughter (3%).
• Fourteen percent of respondents who reported about their child who is 13 to 17 years old reported their child is seldom/never safe in their community or neighborhood compared to 4% of respondents who reported about their child who is 12 or younger.
• Eight percent of respondents in the bottom 40 percent household income bracket reported their child is
seldom/never safe compared to 2% of respondents in the top 60 percent household income bracket.
• Unmarried respondents were more likely to report their child is seldom/never safe in their community or neighborhood compared to married respondents (8% and 3%, respectively).

Milwaukee Community Health Survey Report—2012 154
Table 57. Child Seldom/Never Safe in Community or Neighborhood by Demographic Variables for 2012 (All Children)
2012 TOTAL 6% Gender1 Boy 9 Girl 3 Age1 12 or Younger 4 13 to 17 Years Old 14 Household Income1 Bottom 40 Percent Bracket 8 Top 60 Percent Bracket 2 Marital Status1 Married 3 Not Married 8
Percentages occasionally may differ by 1 or 2 percentage points from the Appendix as a result of rounding, recoding variables and response category distribution. 1demographic difference at p≤0.05 in 2012 Child Experienced Bullying 2012 Findings • Twenty-three percent of respondents reported their 8 to 17 year old child experienced some form of bullying.
More specifically, 18% reported their child was verbally bullied, for example, mean rumors said or kept out of a group. Eleven percent of respondents reported their child was physically bullied, for example, being hit or kicked. Two percent reported their child was cyber or electronically bullied, for example, teased, taunted, humiliated or threatened by email, cell phone, Facebook postings, texts or other electronic methods.
• There were no statistically significant differences between demographic variables and responses of their 8 to 17
year old child experiencing some form of bullying.
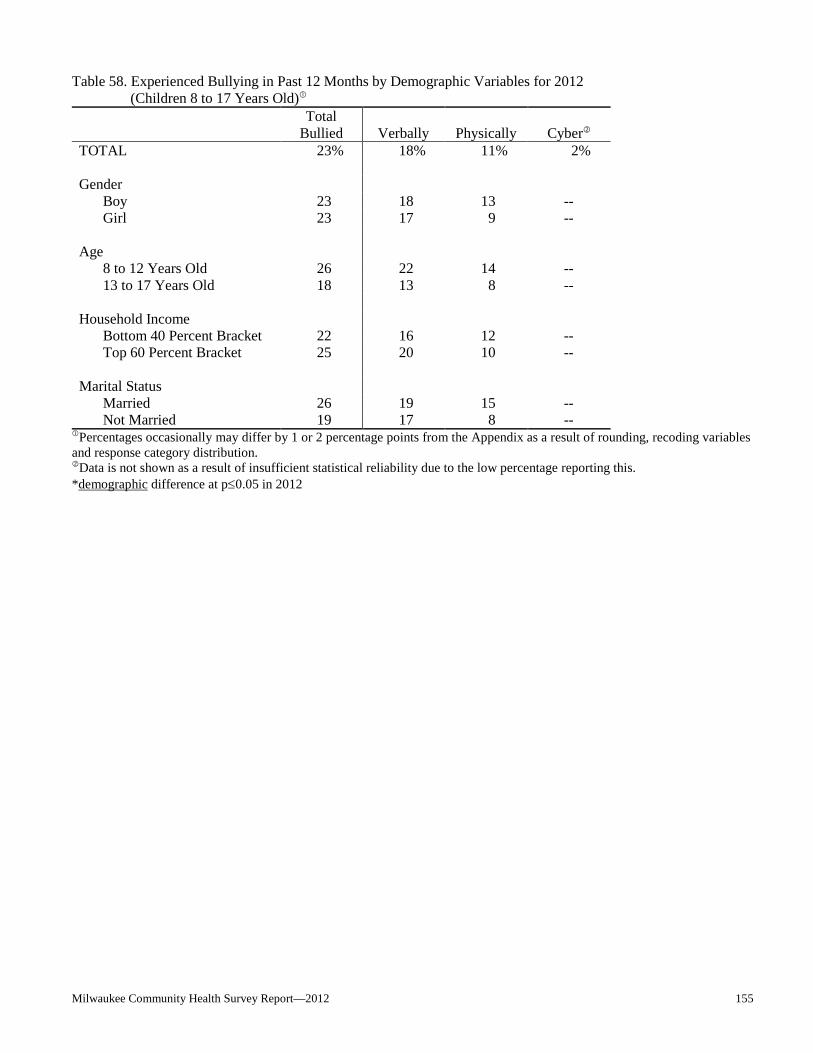
Milwaukee Community Health Survey Report—2012 155
Table 58. Experienced Bullying in Past 12 Months by Demographic Variables for 2012
(Children 8 to 17 Years Old)
Total Bullied
Verbally
Physically
Cyber
TOTAL 23% 18% 11% 2% Gender Boy 23 18 13 -- Girl 23 17 9 -- Age 8 to 12 Years Old 26 22 14 -- 13 to 17 Years Old 18 13 8 -- Household Income Bottom 40 Percent Bracket 22 16 12 -- Top 60 Percent Bracket 25 20 10 -- Marital Status Married 26 19 15 -- Not Married 19 17 8 --
Percentages occasionally may differ by 1 or 2 percentage points from the Appendix as a result of rounding, recoding variables and response category distribution. Data is not shown as a result of insufficient statistical reliability due to the low percentage reporting this.
*demographic difference at p≤0.05 in 2012

Milwaukee Community Health Survey Report—2012 156
Community Health Issues (Figures 25 & 26; Tables 59 - 66) KEY FINDINGS: In 2012, respondents were asked to pick the top three health issues in the area out of eight listed.
The most often cited were alcohol or drug use (57%), violence (56%) and chronic diseases (50%). Respondents who were non-white and non-African American, in the top 40 percent household income bracket or married were more likely to report alcohol or drug use as a top community health issue. Respondents with a college education were more likely to report violence. Respondents who were white, with at least some post high school education or in the top 40 percent household income bracket were more likely to report chronic diseases. Respondents who were 18 to 24 years old, non-white and non-African American, Hispanic, with some post high school education or less, in the bottom 40 percent household income bracket or unmarried respondents were more likely to report teen pregnancy. Respondents who were 18 to 24 years old, African American, with some post high school education, in the bottom 40 percent household income bracket or unmarried respondents were more likely to report infectious diseases as a top community health issue. Respondents who were 35 to 44 years old or non-Hispanic were more likely to report mental health or depression. Respondents who were female, white, with at least some post high school education, in the middle 20 percent household income bracket or married respondents were more likely to report infant mortality. Respondents who were female, Hispanic, with a high school education or less or with a college education were more likely to report lead poisoning as a top community health issue.
From 2006 to 2012, there was a statistical increase in the overall percent of respondents who reported alcohol/drug use or infant mortality as a top community health issue. From 2006 to 2012, there was a statistical decrease in the overall percent of respondents who reported teen pregnancy, infectious diseases, mental health/depression or lead poisoning. From 2006 to 2012, there was no statistical change in the overall percent of respondents who reported violence or chronic diseases as a top community health issue.
2012 Findings • Respondents were given a list of eight health issues that some communities face and were asked to select the
three largest in Milwaukee. Respondents were more likely to select alcohol or drug use (57%), violence (56%) or chronic diseases like diabetes, cancer or obesity (50%).
Figure 25. Community Health Issues for 2012
20%
21%
29%
36%
50%
56%
57%
3%
0% 20% 40% 60% 80% 100%
Lead Poisoning
Infant Mortality
Mental Health or Depression
Infectious Diseases
Teen Pregnancy
Chronic Diseases
Violence
Alcohol or Drug Use
Milwaukee Community Health Survey Report—2012 157
Alcohol or Drug Use 2012 Findings • Fifty-seven percent of respondents reported alcohol or drug use as a top community health issue. • Respondents who were non-white and non-African American were more likely to report alcohol or drug use as
one of the three health issues (68%) compared to white respondents (59%) or African American respondents (52%).
• Sixty-nine percent of respondents in the top 40 percent household income bracket reported alcohol or drug use
as a top community health issue compared to 62% of those in the middle 20 percent income bracket or 56% of respondents in the bottom 40 percent household income bracket.
• Married respondents were more likely to report alcohol or drug use compared to unmarried respondents (65% and 54%, respectively).
Year Comparisons • From 2006 to 2012, there was a statistical increase in the overall percent of respondents who reported alcohol or
drug use as a top community health issue. • Gender was not a significant variable in any study year. From 2006 to 2012, there was a noted increase in the
percent of respondents across gender reporting alcohol or drug use.
• Age was not a significant variable in any study year. From 2006 to 2012, there was a noted increase in the percent of respondents 18 to 54 years old reporting alcohol or drug use as a top community health issue.
• In 2006 and 2009, white respondents were more likely to report alcohol or drug use. In 2012, respondents who
were non-white and non-African American were more likely to report alcohol or drug use, with a noted increase since 2006. From 2006 to 2012, there was a noted increase in the percent of white respondents reporting alcohol or drug use.
• Hispanic origin was not a significant variable in any study year. From 2006 to 2012, there was a noted increase in the percent of respondents across Hispanic origin reporting alcohol or drug use.
• Education was not a significant variable in any study year. From 2006 to 2012, there was a noted increase in the
percent of respondents across education reporting alcohol or drug use as a top community health issue. • In 2006, respondents in the middle 20 percent household income bracket were more likely to report alcohol or
drug use. In 2012, respondents in the top 40 percent household income bracket were more likely to report alcohol or drug use, with a noted increase since 2006. In 2009, household income was not a significant variable. From 2006 to 2012, there was a noted increase in the percent of respondents in the bottom 40 percent household income bracket reporting alcohol or drug use.
• In 2012, married respondents were more likely to report alcohol or drug use. In all other study years, marital
status was not a significant variable. From 2006 to 2012, there was a noted increase in the percent of respondents across marital status reporting alcohol or drug use.

Milwaukee Community Health Survey Report—2012 158
Table 59. Alcohol or Drug Use as Community Health Issue by Demographic Variables for Each Survey Year 2006 2009 2012 TOTALa 49% 62% 57% Gender Malea 47 64 59 Femalea 50 59 56 Age 18 to 24a 48 60 58 25 to 34a 46 57 56 35 to 44a 52 63 66 45 to 54a 46 61 58 55 to 64 52 63 53 65 and Older 51 70 51 Race1,2,3 Whitea 51 68 59 African American 49 58 52 Othera 37 61 68 Hispanic Origin Hispanica 45 55 59 Non-Hispanica 49 62 57 Education High School or Lessa 49 61 57 Some Post High Schoola 48 64 55
College Graduatea 48 61 60 Household Income1,3 Bottom 40 Percent Bracketa 47 63 56 Middle 20 Percent Bracket 57 58 62 Top 40 Percent Bracketa 49 64 69 Marital Status3 Marrieda 51 60 65 Not Marrieda 48 62 54
Percentages occasionally may differ by 1 or 2 percentage points from previous reports or the Appendix as a result of rounding, recoding variables and response category distribution.
1demographic difference at p≤0.05 in 2006; 2demographic difference at p≤0.05 in 2009 3demographic difference at p≤0.05 in 2012 ayear difference at p≤0.05 from 2006 to 2012
Milwaukee Community Health Survey Report—2012 159
Violence 2012 Findings • Fifty-six percent of respondents reported violence as a top community health issue. • Sixty-one percent of respondents with a college education reported violence as a top community health issue
compared to 56% of those with some post high school education or 53% of respondents with a high school education or less.
Year Comparisons • From 2006 to 2012, there was no statistical change in the overall percent of respondents who reported violence
as a top community health issue. • In 2009, male respondents were more likely to report violence. In all other study years, gender was not a
significant variable.
• In 2006, respondents 35 to 44 years old were more likely to report violence. In all other study years, age was not a significant variable. From 2006 to 2012, there was a noted decrease in the percent of respondents 35 to 44 years old reporting violence as a top community health issue.
• In 2006 and 2009, white respondents were more likely to report violence. In 2012, race was not a significant
variable. From 2006 to 2012, there was a noted increase in the percent of respondents who were non-white and non-African American reporting violence.
• In 2006, non-Hispanic respondents were more likely to report violence. In all other study years, Hispanic origin was not a significant variable.
• In 2006 and 2012, respondents with a college education were more likely to report violence. In 2009, education
was not a significant variable. From 2006 to 2012, there was a noted decrease in the percent of respondents with a college education reporting violence as a top community health issue.
• In 2006, respondents in the middle 20 percent household income bracket were more likely to report violence. In
all other study years, household income was not a significant variable. From 2006 to 2012, there was a noted decrease in the percent of respondents in the middle 20 percent household income bracket reporting violence.
• In 2009, married respondents were more likely to report violence. In all other study years, marital status was not
a significant variable.

Milwaukee Community Health Survey Report—2012 160
Table 60. Violence as Community Health Issue by Demographic Variables for Each Survey Year 2006 2009 2012 TOTAL 58% 57% 56% Gender2 Male 59 62 57 Female 58 53 55 Age1 18 to 24 51 55 56 25 to 34 61 61 58 35 to 44a 65 56 53 45 to 54 60 56 58 55 to 64 63 62 61 65 and Older 51 55 47 Race1,2 White 61 62 56 African American 57 54 54 Othera 49 55 61 Hispanic Origin1 Hispanic 51 58 59 Non-Hispanic 59 57 55 Education1,3 High School or Less 54 57 53 Some Post High School 57 59 56
College Graduatea 69 57 61 Household Income1 Bottom 40 Percent Bracket 58 57 58 Middle 20 Percent Bracketa 66 55 50 Top 40 Percent Bracket 60 60 55 Marital Status2 Married 61 64 59 Not Married 57 54 55
Percentages occasionally may differ by 1 or 2 percentage points from previous reports or the Appendix as a result of rounding, recoding variables and response category distribution.
1demographic difference at p≤0.05 in 2006; 2demographic difference at p≤0.05 in 2009 3demographic difference at p≤0.05 in 2012 ayear difference at p≤0.05 from 2006 to 2012

Milwaukee Community Health Survey Report—2012 161
Chronic Diseases 2012 Findings • Fifty percent of respondents reported chronic diseases like diabetes, cancer or obesity as a top community
health issue. • White respondents were more likely to report chronic diseases (55%) compared to African American
respondents (49%) or respondents of another race (36%).
• Fifty-six percent of respondents with a college education and 54% of those with some post high school education reported chronic diseases as a top community health issue compared to 43% of respondents with a high school education or less.
• Sixty-one percent of respondents in the top 40 percent household income bracket reported chronic diseases
compared to 50% of those in the middle 20 percent income bracket or 48% of respondents in the bottom 40 percent household income bracket.
Year Comparisons • From 2006 to 2012, there was no statistical change in the overall percent of respondents who reported chronic
diseases as a top community health issue. • In 2006, respondents 35 to 54 years old were more likely to report chronic diseases. In all other study years, age
was not a significant variable.
• In 2006 and 2012, white respondents were more likely to report chronic diseases. In 2009, race was not a significant variable.
• In 2006, respondents with a college education were more likely to report chronic diseases as a top community health issue. In 2012, respondents with at least some post high school education were more likely to report chronic diseases. In 2009, education was not a significant variable. From 2006 to 2012, there was a noted increase in the percent of respondents with some post high school education reporting chronic diseases.
• In 2006 and 2012, respondents in the top 40 percent household income bracket were more likely to report
chronic diseases. In 2009, respondents in the middle 20 percent household income bracket were more likely to report chronic diseases.
• In 2006, married respondents were more likely to report chronic diseases as a top community health issue. In all
other study years, marital status was not a significant variable.
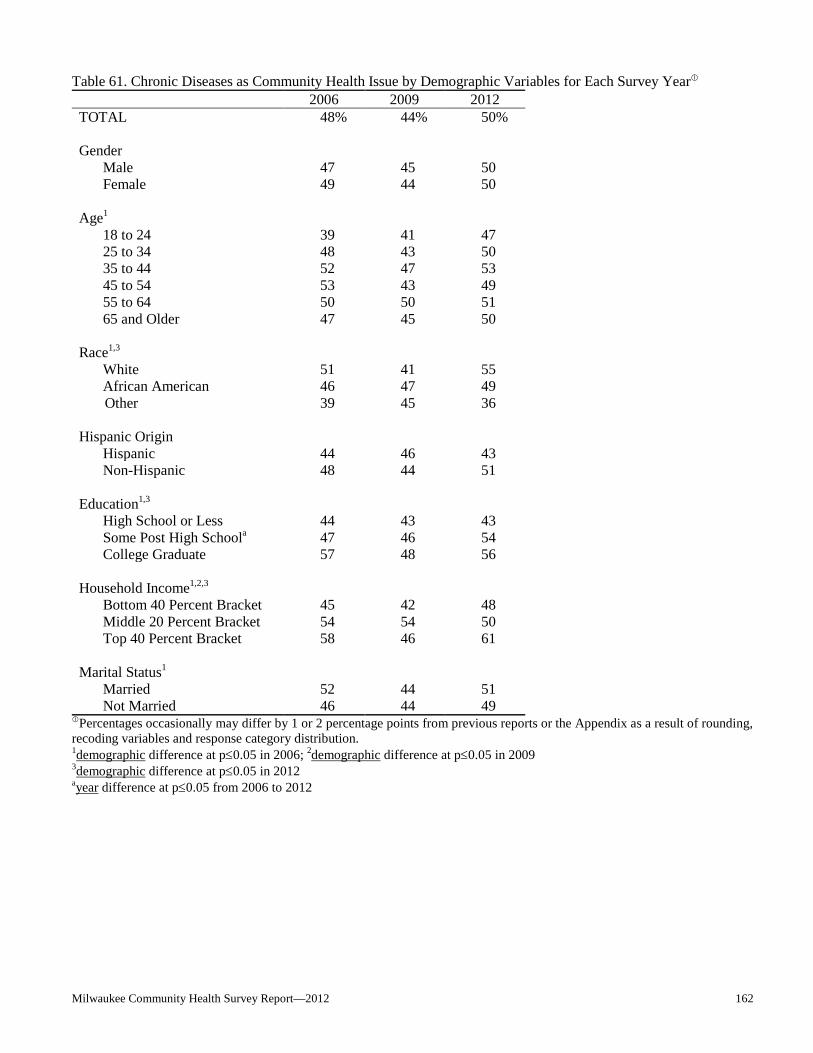
Milwaukee Community Health Survey Report—2012 162
Table 61. Chronic Diseases as Community Health Issue by Demographic Variables for Each Survey Year 2006 2009 2012 TOTAL 48% 44% 50% Gender Male 47 45 50 Female 49 44 50 Age1 18 to 24 39 41 47 25 to 34 48 43 50 35 to 44 52 47 53 45 to 54 53 43 49 55 to 64 50 50 51 65 and Older 47 45 50 Race1,3 White 51 41 55 African American 46 47 49 Other 39 45 36 Hispanic Origin Hispanic 44 46 43 Non-Hispanic 48 44 51 Education1,3 High School or Less 44 43 43 Some Post High Schoola 47 46 54
College Graduate 57 48 56 Household Income1,2,3 Bottom 40 Percent Bracket 45 42 48 Middle 20 Percent Bracket 54 54 50 Top 40 Percent Bracket 58 46 61 Marital Status1 Married 52 44 51 Not Married 46 44 49
Percentages occasionally may differ by 1 or 2 percentage points from previous reports or the Appendix as a result of rounding, recoding variables and response category distribution.
1demographic difference at p≤0.05 in 2006; 2demographic difference at p≤0.05 in 2009 3demographic difference at p≤0.05 in 2012 ayear difference at p≤0.05 from 2006 to 2012

Milwaukee Community Health Survey Report—2012 163
Teen Pregnancy 2012 Findings • Thirty-six percent of respondents reported teen pregnancy as a top community health issue. • Respondents 18 to 24 years old were more likely to report teen pregnancy (54%) compared to respondents who
were 35 to 44 years old or 55 and older (27% each).
• Respondents who were non-white and non-African American were more likely to report teen pregnancy as a top community health issue (44%) compared to African American respondents (40%) or white respondents (30%).
• Hispanic respondents were more likely to report teen pregnancy compared to non-Hispanic respondents (50%
and 35%, respectively).
• Forty percent of respondents with some post high school education and 39% of those with a high school education or less reported teen pregnancy compared to 28% of respondents with a college education.
• Thirty-eight percent of respondents in the bottom 40 percent household income bracket reported teen pregnancy
compared to 33% of those in the middle 20 percent income bracket or 28% of respondents in the top 40 percent household income bracket.
• Unmarried respondents were more likely to report teen pregnancy as a top community health issue compared to married respondents (40% and 28%, respectively).
Year Comparisons • From 2006 to 2012, there was a statistical decrease in the overall percent of respondents who reported teen
pregnancy as a top community health issue. • In 2006 and 2009, female respondents were more likely to report teen pregnancy. In 2012, gender was not a
significant variable. From 2006 to 2012, there was a noted decrease in the percent of respondents across gender reporting teen pregnancy.
• In all study years, respondents 18 to 24 years old were more likely to report teen pregnancy. From 2006 to
2012, there was a noted decrease in the percent of respondents 35 and older reporting teen pregnancy.
• In 2006, African American respondents were more likely to report teen pregnancy. In 2012, respondents who were non-white and non-African American were more likely to report teen pregnancy. In 2009, race was not a significant variable. From 2006 to 2012, there was a noted decrease in the percent of respondents who were white or African American reporting teen pregnancy.
• In 2012, Hispanic respondents were more likely to report teen pregnancy. In all other study years, Hispanic origin was not a significant variable. From 2006 to 2012, there was a noted decrease in the percent of non-Hispanic respondents reporting teen pregnancy.
• In 2012, respondents with some post high school education or less were more likely to report teen pregnancy. In
all other study years, education was not a significant variable. From 2006 to 2012, there was a noted decrease in the percent of respondents with a high school education or less or with a college education reporting teen pregnancy as a top health issue.

Milwaukee Community Health Survey Report—2012 164
• In 2012, respondents in the bottom 40 percent household income bracket were more likely to report teen pregnancy. In all other study years, household income was not a significant variable. From 2006 to 2012, there was a noted decrease in the percent of respondents across household income reporting teen pregnancy.
• In 2006 and 2012, unmarried respondents were more likely to report teen pregnancy. In 2009, marital status was
not a significant variable. From 2006 to 2012, there was a noted decrease in the percent of respondents across marital status reporting teen pregnancy.
Table 62. Teen Pregnancy as Community Health Issue by Demographic Variables for Each Survey Year 2006 2009 2012 TOTALa 46% 50% 36% Gender1,2 Malea 40 46 34 Femalea 51 54 39 Age1,2,3 18 to 24 59 65 54 25 to 34 43 53 42 35 to 44a 42 49 27 45 to 54a 46 48 34 55 to 64a 44 43 27 65 and Oldera 41 41 27 Race1,3 Whitea 42 46 30 African Americana 54 53 40 Other 38 50 44 Hispanic Origin3 Hispanic 41 57 50 Non-Hispanica 46 50 35 Education3 High School or Lessa 46 49 39 Some Post High School 45 54 40
College Graduatea 47 49 28 Household Income3 Bottom 40 Percent Bracketa 47 53 38 Middle 20 Percent Bracketa 45 50 33 Top 40 Percent Bracketa 43 45 28 Marital Status1,3 Marrieda 42 47 28 Not Marrieda 48 52 40
Percentages occasionally may differ by 1 or 2 percentage points from previous reports or the Appendix as a result of rounding, recoding variables and response category distribution. 1demographic difference at p≤0.05 in 2006; 2demographic difference at p≤0.05 in 2009 3demographic difference at p≤0.05 in 2012 ayear difference at p≤0.05 from 2006 to 2012

Milwaukee Community Health Survey Report—2012 165
Infectious Diseases 2012 Findings • Twenty-nine percent of respondents reported infectious diseases like whooping cough, tuberculosis or sexually
transmitted diseases as a top community health issue. • Respondents 18 to 24 years old were more likely to report infectious diseases (42%) compared to those 35 to 44
years old (24%) or respondents 65 and older (17%).
• African American respondents were more likely to report infectious diseases as a top community health issue (39%) compared to respondents who were non-white and non-African American (25%) or white respondents (19%).
• Respondents with some post high school education reported infectious diseases (34%) compared to those with a
high school education or less (28%) or respondents with a college education (25%).
• Thirty-two percent of respondents in the bottom 40 percent household income bracket reported infectious diseases as a top community health issue compared to 29% of those in the middle 20 percent income bracket or 19% of respondents in the top 40 percent household income bracket.
• Unmarried respondents were more likely to report infectious diseases compared to married respondents (32% and 21%, respectively).
Year Comparisons • From 2006 to 2012, there was a statistical decrease in the overall percent of respondents who reported
infectious diseases as a top community health issue. • In 2006 and 2009, male respondents were more likely to report infectious diseases. In 2012, gender was not a
significant variable. From 2006 to 2012, there was a noted decrease in the percent of male respondents reporting infectious diseases.
• In all study years, respondents 18 to 24 years old were more likely to report infectious diseases. From 2006 to
2012, there was a noted decrease in the percent of respondents 35 to 44 years old reporting infectious diseases.
• In all study years, African American respondents were more likely to report infectious diseases as a top community health issue. From 2006 to 2012, there was a noted decrease in the percent of white respondents reporting infectious diseases.
• In 2006 and 2012, respondents with some post high school education were more likely to report infectious diseases. In 2009, education was not a significant variable. From 2006 to 2012, there was a noted decrease in the percent of respondents with a high school education or less reporting infectious diseases.
• In 2006 and 2012, respondents in the bottom 40 percent household income bracket were more likely to report
infectious diseases. In 2009, household income was not a significant variable. From 2006 to 2012, there was a noted decrease in the percent of respondents in the top 40 percent household income bracket reporting infectious diseases.

Milwaukee Community Health Survey Report—2012 166
• In 2006 and 2012, unmarried respondents were more likely to report infectious diseases. In 2009, marital status was not a significant variable. From 2006 to 2012, there was a noted decrease in the percent of married respondents reporting infectious diseases as a top community health issue.
Table 63. Infectious Diseases as Community Health Issue by Demographic Variables for Each Survey Year 2006 2009 2012 TOTALa 33% 31% 29% Gender1,2 Malea 36 34 29 Female 30 28 29 Age1,2,3 18 to 24 49 43 42 25 to 34 35 38 33 35 to 44a 34 30 24 45 to 54 27 28 27 55 to 64 23 25 25 65 and Older 22 17 17 Race1,2,3 Whitea 28 23 19 African American 40 37 39 Other 34 32 25 Hispanic Origin Hispanic 38 27 29 Non-Hispanic 32 31 29 Education1,3 High School or Lessa 33 32 28 Some Post High School 37 33 34
College Graduate 25 26 25 Household Income1,3 Bottom 40 Percent Bracket 36 33 32 Middle 20 Percent Bracket 22 27 29 Top 40 Percent Bracketa 27 29 19 Marital Status1,3 Marrieda 28 31 21 Not Married 35 31 32
Percentages occasionally may differ by 1 or 2 percentage points from previous reports or the Appendix as a result of rounding, recoding variables and response category distribution.
1demographic difference at p≤0.05 in 2006; 2demographic difference at p≤0.05 in 2009 3demographic difference at p≤0.05 in 2012 ayear difference at p≤0.05 from 2006 to 2012
Milwaukee Community Health Survey Report—2012 167
Mental Health or Depression 2012 Findings • Twenty-one percent of respondents reported mental health or depression as a top community health issue. • Respondents 35 to 44 years old were more likely to report mental health or depression as a top community
health issue (30%) compared to those 18 to 24 years old (15%) or respondents 65 and older (14%).
• Non-Hispanic respondents were more likely to report mental health or depression compared to Hispanic respondents (22% and 12%, respectively).
Year Comparisons • From 2006 to 2012, there was a statistical decrease in the overall percent of respondents who reported mental
health or depression as a top community health issue. • Gender was not a significant variable in any study year. From 2006 to 2012, there was a noted decrease in the
percent of respondents across gender reporting mental health or depression.
• In 2009, respondents 45 to 54 years old were more likely to report mental health or depression as a top community health issue. In 2012, respondents 35 to 44 years old were more likely to report mental health or depression. In 2006, age was not a significant variable. From 2006 to 2012, there was a noted decrease in the percent of respondents who were 25 to 34 years old or 65 and older reporting mental health or depression.
• Race was not a significant variable in any study year. From 2006 to 2012, there was a noted decrease in the
percent of white respondents reporting mental health or depression.
• In 2012, non-Hispanic respondents were more likely to report mental health or depression. In all other study years, Hispanic origin was not a significant variable. From 2006 to 2012, there was a noted decrease in the percent of respondents across Hispanic origin reporting mental health or depression.
• Education was not a significant variable in any study year. From 2006 to 2012, there was a noted decrease in
the percent of respondents with some post high school education or less reporting mental health or depression. • Household income was not a significant variable in any study year. From 2006 to 2012, there was a noted
decrease in the percent of respondents in the bottom 40 percent household income bracket reporting mental health or depression as a top community health issue.
• Marital status was not a significant variable in any study year. From 2006 to 2012, there was a noted decrease in
the percent of respondents across marital status reporting mental health or depression.

Milwaukee Community Health Survey Report—2012 168
Table 64. Mental Health or Depression as Community Health Issue by Demographic Variables for Each Survey Year
2006 2009 2012 TOTALa 25% 19% 21% Gender Malea 24 17 19 Femalea 27 20 22 Age2,3 18 to 24 20 17 15 25 to 34a 25 14 16 35 to 44 24 20 30 45 to 54 29 26 25 55 to 64 29 21 24 65 and Oldera 26 16 14 Race Whitea 26 20 20 African American 23 18 21 Other 29 16 20 Hispanic Origin3 Hispanica 25 18 12 Non-Hispanica 25 19 22 Education High School or Lessa 24 18 19 Some Post High Schoola 27 18 20
College Graduate 27 20 25 Household Income Bottom 40 Percent Bracketa 26 19 20 Middle 20 Percent Bracket 23 16 20 Top 40 Percent Bracket 29 20 27 Marital Status Marrieda 26 17 20 Not Marrieda 25 19 21
Percentages occasionally may differ by 1 or 2 percentage points from previous reports or the Appendix as a result of rounding, recoding variables and response category distribution.
1demographic difference at p≤0.05 in 2006; 2demographic difference at p≤0.05 in 2009 3demographic difference at p≤0.05 in 2012 ayear difference at p≤0.05 from 2006 to 2012

Milwaukee Community Health Survey Report—2012 169
Infant Mortality 2012 Findings • Twenty percent of respondents reported infant mortality as a top community health issue. • Female respondents were more likely to report infant mortality (24%) compared to male respondents (16%).
• White respondents were more likely to report infant mortality as a top community health issue (25%) compared
to respondents who were non-white and non-African American (20%) or African American respondents (16%).
• Twenty-six percent of respondents with a college education and 24% of those with some post high school education reported infant mortality compared to 13% of respondents with a high school education or less.
• Twenty-nine percent of respondents in the middle 20 percent household income bracket reported infant
mortality compared to 23% of those in the top 40 percent income bracket or 18% of respondents in the bottom 40 percent household income bracket.
• Married respondents were more likely to report infant mortality as a top community health issue compared to unmarried respondents (27% and 17%, respectively).
Year Comparisons • From 2006 to 2012, there was a statistical increase in the overall percent of respondents who reported infant
mortality as a top community health issue. • In 2009 and 2012, female respondents were more likely to report infant mortality. In 2006, gender was not a
significant variable. From 2006 to 2012, there was a noted increase in the percent of respondents across gender reporting infant mortality.
• In 2006, respondents who were 25 to 34 years old or 55 to 64 years old were more likely to report infant
mortality as a top community health issue. In 2009, respondents 35 to 44 years old were more likely to report infant mortality. In 2012, age was not a significant variable. From 2006 to 2012, there was a noted increase in the percent of respondents across age reporting infant mortality.
• In 2006 and 2012, white respondents were more likely to report infant mortality. In 2009, race was not a
significant variable. From 2006 to 2012, there was a noted increase in the percent of respondents across race reporting infant mortality.
• Hispanic origin was not a significant variable in any study year. From 2006 to 2012, there was a noted increase in the percent of respondents across Hispanic origin reporting infant mortality.
• In 2012, respondents with at least some post high school education were more likely to report infant mortality
as a top community health issue. In all other study years, education was not a significant variable. From 2006 to 2012, there was a noted increase in the percent of respondents across education reporting infant mortality.
• In 2012, respondents in the middle 20 percent household income bracket were more likely to report infant
mortality. In all other study years, household income was not a significant variable. From 2006 to 2012, there was a noted increase in the percent of respondents across household income reporting infant mortality.
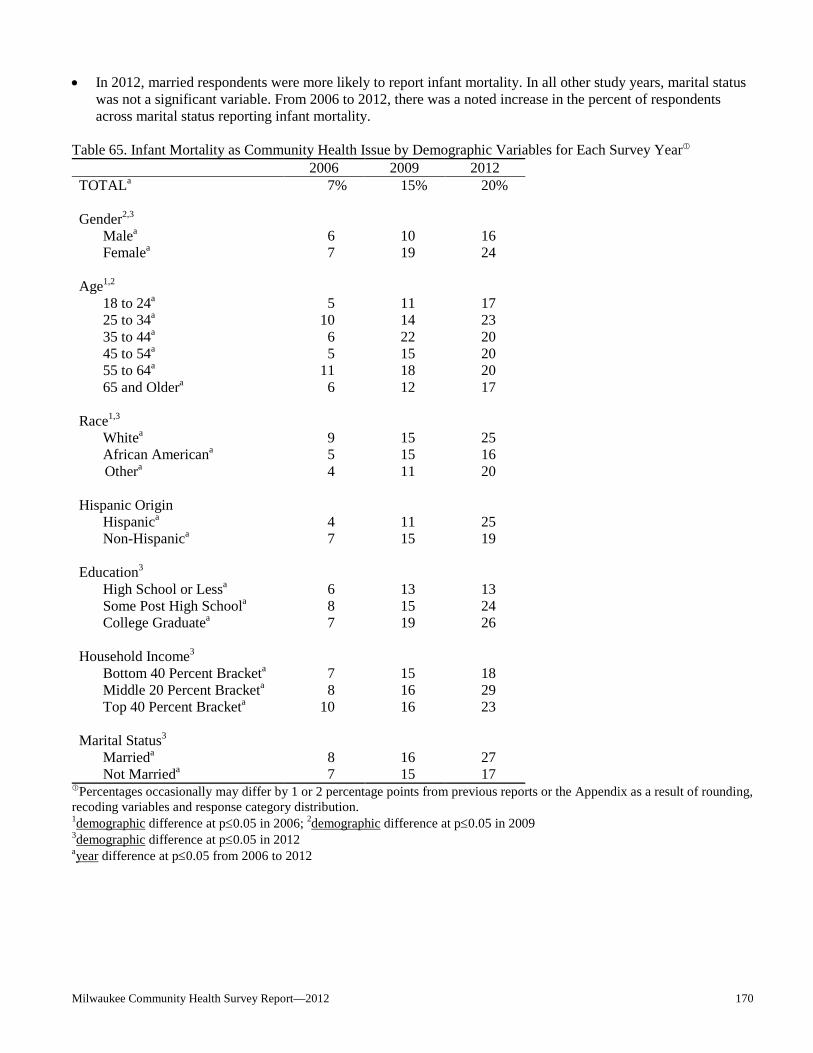
Milwaukee Community Health Survey Report—2012 170
• In 2012, married respondents were more likely to report infant mortality. In all other study years, marital status was not a significant variable. From 2006 to 2012, there was a noted increase in the percent of respondents across marital status reporting infant mortality.
Table 65. Infant Mortality as Community Health Issue by Demographic Variables for Each Survey Year 2006 2009 2012 TOTALa 7% 15% 20% Gender2,3 Malea 6 10 16 Femalea 7 19 24 Age1,2 18 to 24a 5 11 17 25 to 34a 10 14 23 35 to 44a 6 22 20 45 to 54a 5 15 20 55 to 64a 11 18 20 65 and Oldera 6 12 17 Race1,3 Whitea 9 15 25 African Americana 5 15 16 Othera 4 11 20 Hispanic Origin Hispanica 4 11 25 Non-Hispanica 7 15 19 Education3 High School or Lessa 6 13 13 Some Post High Schoola 8 15 24
College Graduatea 7 19 26 Household Income3 Bottom 40 Percent Bracketa 7 15 18 Middle 20 Percent Bracketa 8 16 29 Top 40 Percent Bracketa 10 16 23 Marital Status3 Marrieda 8 16 27 Not Marrieda 7 15 17
Percentages occasionally may differ by 1 or 2 percentage points from previous reports or the Appendix as a result of rounding, recoding variables and response category distribution.
1demographic difference at p≤0.05 in 2006; 2demographic difference at p≤0.05 in 2009 3demographic difference at p≤0.05 in 2012 ayear difference at p≤0.05 from 2006 to 2012

Milwaukee Community Health Survey Report—2012 171
Lead Poisoning 2012 Findings • Three percent of respondents reported lead poisoning as a top community health issue. • Female respondents were more likely to report lead poisoning (4%) compared to male respondents (2%).
• Hispanic respondents were more likely to report lead poisoning as a top community health issue compared to
non-Hispanic respondents (6% and 2%, respectively).
• Four percent of respondents with a high school education or less and 3% of those with a college education reported lead poisoning compared to 1% of respondents with some post high school education.
Year Comparisons • From 2006 to 2012, there was a statistical decrease in the overall percent of respondents who reported lead
poisoning as a top community health issue. • In 2006 and 2012, female respondents were more likely to report lead poisoning. In 2009, gender was not a
significant variable. From 2006 to 2012, there was a noted decrease in the percent of female respondents reporting lead poisoning.
• Age was not a significant variable in any study year. From 2006 to 2012, there was a noted decrease in the
percent of respondents 35 to 44 years old reporting lead poisoning as a top community health issue.
• Race was not a significant variable in any study year. From 2006 to 2012, there was a noted decrease in the percent of African American respondents reporting lead poisoning.
• In 2009 and 2012, Hispanic respondents were more likely to report lead poisoning. In 2006, Hispanic origin was not a significant variable. From 2006 to 2012, there was a noted decrease in the percent of non-Hispanic respondents reporting lead poisoning.
• In 2012, respondents with a high school education or less or with a college education were more likely to report
lead poisoning as a top community health issue. In all other study years, education was not a significant variable. From 2006 to 2012, there was a noted decrease in the percent of respondents with at least some post high school education reporting lead poisoning.
• Household income was not a significant variable in any study year. From 2006 to 2012, there was a noted
decrease in the percent of respondents in the bottom 40 percent household income bracket reporting lead poisoning.
• Marital status was not a significant variable in any study year. From 2006 to 2012, there was a noted decrease in
the percent of unmarried respondents reporting lead poisoning as a top community health issue.

Milwaukee Community Health Survey Report—2012 172
Table 66. Lead Poisoning as Community Health Issue by Demographic Variables for Each Survey Year 2006 2009 2012 TOTALa 5% 6% 3% Gender1,3 Male 3 6 2 Femalea 7 6 4 Age 18 to 24 5 6 2 25 to 34 6 9 5 35 to 44a 6 5 1 45 to 54 5 4 3 55 to 64 4 5 3 65 and Older 5 4 3 Race White 5 7 3 African Americana 5 5 2 Other 5 5 3 Hispanic Origin2,3 Hispanic 4 15 6 Non-Hispanica 5 5 2 Education3 High School or Less 5 7 4 Some Post High Schoola 4 5 1
College Graduatea 6 5 3 Household Income Bottom 40 Percent Bracketa 5 5 3 Middle 20 Percent Bracket 6 5 2 Top 40 Percent Bracket 6 9 2 Marital Status Married 4 7 3 Not Marrieda 6 5 3
Percentages occasionally may differ by 1 or 2 percentage points from previous reports or the Appendix as a result of rounding, recoding variables and response category distribution.
1demographic difference at p≤0.05 in 2006; 2demographic difference at p≤0.05 in 2009 3demographic difference at p≤0.05 in 2012 ayear difference at p≤0.05 from 2006 to 2012
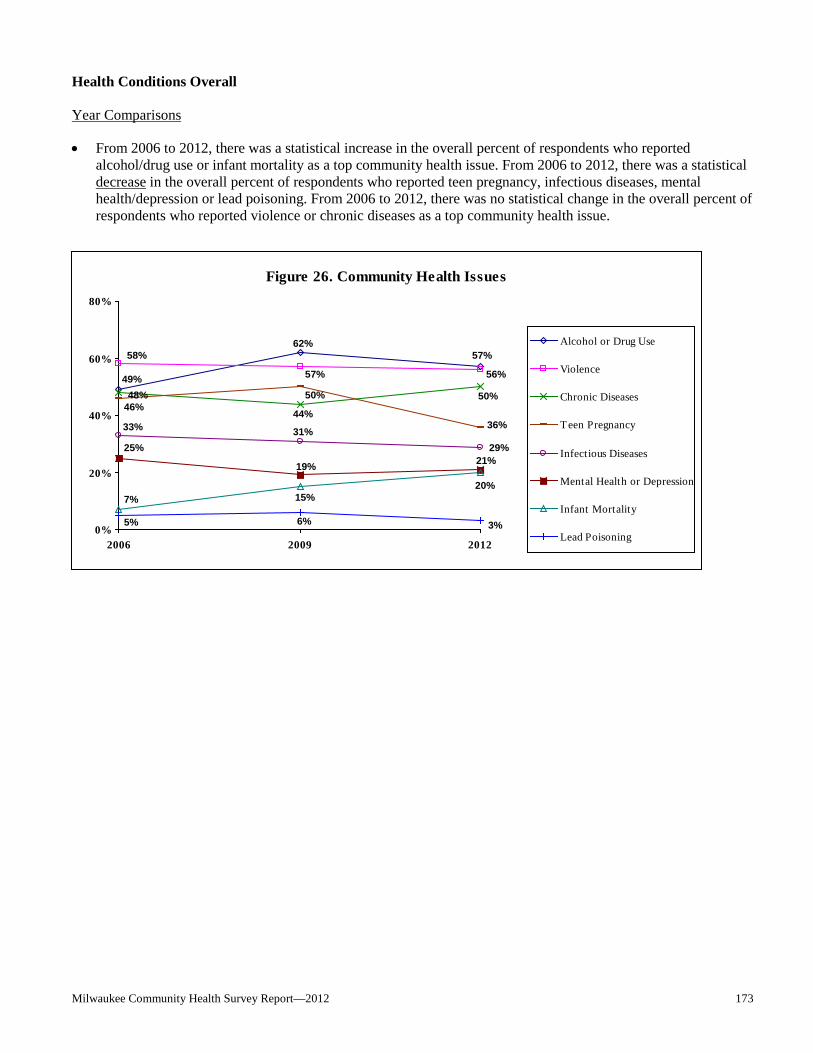
Milwaukee Community Health Survey Report—2012 173
Health Conditions Overall Year Comparisons • From 2006 to 2012, there was a statistical increase in the overall percent of respondents who reported
alcohol/drug use or infant mortality as a top community health issue. From 2006 to 2012, there was a statistical decrease in the overall percent of respondents who reported teen pregnancy, infectious diseases, mental health/depression or lead poisoning. From 2006 to 2012, there was no statistical change in the overall percent of respondents who reported violence or chronic diseases as a top community health issue.
Figure 26. Community Health Issues
29%
49%
62%57%
56%57%
58%
50%
44%
48%
36%
50%46%
31%33%
21%19%
25%
20%15%7%
6% 3%5%0%
20%
40%
60%
80%
2006 2009 2012
Alcohol or Drug Use
Violence
Chronic Diseases
Teen Pregnancy
Infectious Diseases
Mental Health or Depression
Infant Mortality
Lead Poisoning

Milwaukee Community Health Survey Report—2012 174
APPENDIX A: QUESTIONNAIRE FREQUENCIES

Milwaukee Community Health Survey Report—2012 175
MILWAUKEE COMMUNITY HEALTH SURVEY
Conducted: June 20, 2012 through November 7, 2012 [Some totals may be more or less than 100% due to rounding and response category distribution. Percentages in the report and in the Appendix may differ by one or two percentage points as a result of combining several response categories for report analysis.]
1. Generally speaking, would you say that your own health is…?
Poor .................................................................... 6% Fair ..................................................................... 18 Good .................................................................. 28 Very good .......................................................... 32 Excellent ............................................................ 15 Not sure.............................................................. <1
2. Currently, what is your primary type of health care coverage?
No health care coverage..................................... 17% An employer sponsored insurance plan ............. 38 Private insurance bought directly from an insurance agent or insurance company .............. 7 Medicaid including medical assistance, Title 19 or Badger Care ..................................... 22 Medicare ............................................................ 15 Or something else .............................................. <1 Not sure.............................................................. 1
3. Did you have health insurance during all, part or none of the past 12 months?
All ...................................................................... 77% Part ..................................................................... 9 None .................................................................. 13 Not sure.............................................................. <1
4. Did everyone in your household have health insurance during all, part or none of the past 12 months?
All ...................................................................... 72% Part ..................................................................... 9 None .................................................................. 16 Not sure.............................................................. 3
5. In the last 12 months, have you or anyone in your household not taken prescribed medication due to prescription
costs?
Yes ..................................................................... 15% No ...................................................................... 84 Not sure.............................................................. <1

Milwaukee Community Health Survey Report—2012 176
6. Was there a time during the last 12 months that you felt you did not get the medical care you needed?
Yes ..................................................................... 13% →CONTINUE WITH Q7 No ...................................................................... 87 →GO TO Q8 Not sure.............................................................. <1 →GO TO Q8
7. Why did you not receive the medical care you thought you needed? [161 Respondents; More than 1 response
accepted]
Uninsured........................................................................... 38% Cannot afford to pay .......................................................... 23 Poor medical care .............................................................. 21 Co-payments too high ........................................................ 10 Insurance did not cover it .................................................. 7 Unable to get appointment ................................................. 4 Not enough time ................................................................ 4 Other (2% or less) .............................................................. 4
8. Was there a time during the last 12 months that you felt you did not get the dental care you needed?
Yes ..................................................................... 21% →CONTINUE WITH Q9 No ...................................................................... 78 →GO TO Q10 Not sure.............................................................. <1 →GO TO Q10
9. Why did you not receive the dental care you thought you needed? [257 Respondents; More than 1 response
accepted]
Uninsured........................................................................... 45% Cannot afford to pay .......................................................... 21 Unable to find a dentist to take Medicaid or other insurance ..............................................................
12
Insurance did not cover it .................................................. 11 Unable to get appointment ................................................. 9 Poor dental care ................................................................. 5 Co-payments too high ........................................................ 4 Don’t know where to go .................................................... 4 Other (2% or less) .............................................................. 5
10. Was there a time during the last 12 months that you felt you did not get the mental health care you needed?
Yes ..................................................................... 6% →CONTINUE WITH Q11 No ...................................................................... 94 →GO TO Q12 Not sure.............................................................. <1 →GO TO Q12

Milwaukee Community Health Survey Report—2012 177
11. Why did you not receive the mental health care you thought you needed? [67 Respondents; More than 1 response accepted]
Uninsured........................................................................... 46% Cannot afford to pay .......................................................... 36 Poor mental health care ..................................................... 13 Insurance did not cover it .................................................. 11 Not enough time ................................................................ 4 Inconvenient hours ............................................................ 3 Other (2% or less) .............................................................. 2 Not sure.............................................................................. 3
12. From which source do you get most of your health information?
Doctor ................................................................................ 45% Internet ............................................................................... 28 Other health professional ................................................... 7 Family/friends .................................................................... 4 TV ...................................................................................... 3 Work .................................................................................. 3 Health newsletter ............................................................... 3 Myself/family member in health care field ....................... 2 All others (1% or less) ....................................................... 3 Not sure.............................................................................. <1
13. When you are sick or need advice about your health, to which one of the following places do you usually go?
Doctor’s or nurse practitioner’s office ............................... 65% Public health clinic or community health center ............... 8 Hospital outpatient department .......................................... 3 Hospital emergency room .................................................. 9 Urgent care center .............................................................. 7 Some other kind of place ................................................... 1 No usual place ................................................................... 6 Not sure.............................................................................. <1
14. Do you have an advance health care plan, living will or health care power of attorney stating your end of life
health care wishes?
Yes ..................................................................... 23% No ...................................................................... 76 Not sure.............................................................. 1
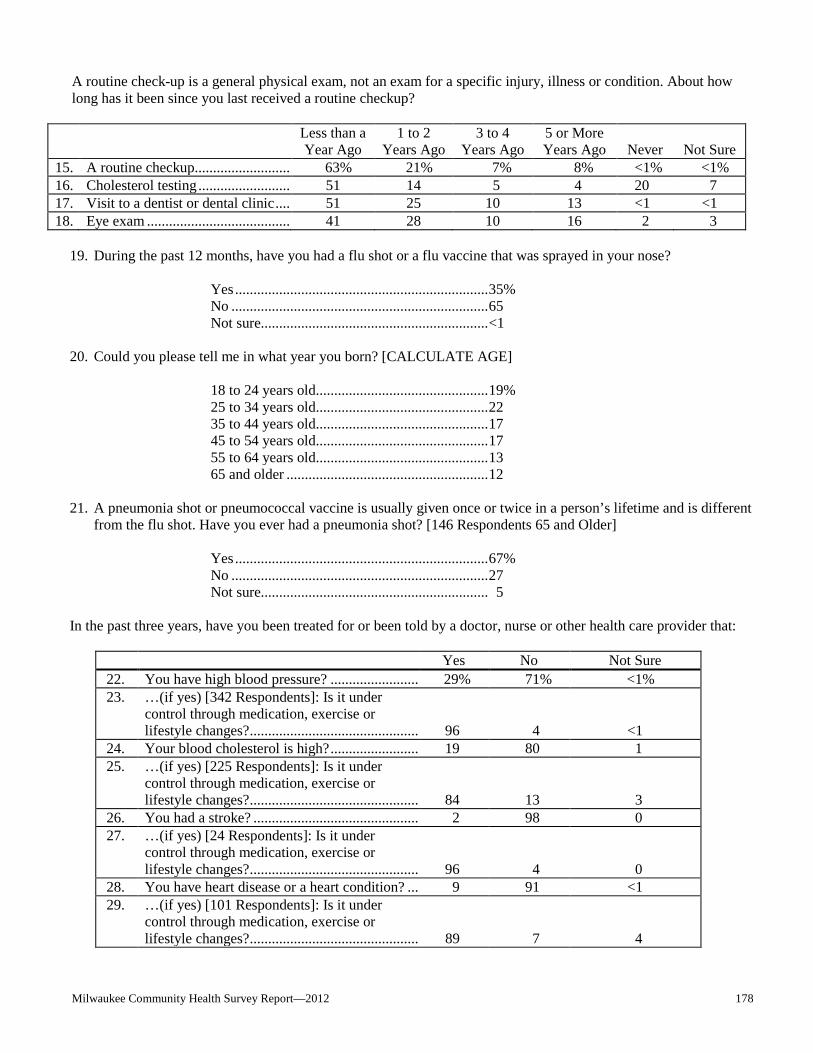
Milwaukee Community Health Survey Report—2012 178
A routine check-up is a general physical exam, not an exam for a specific injury, illness or condition. About how long has it been since you last received a routine checkup?
Less than a Year Ago
1 to 2 Years Ago
3 to 4 Years Ago
5 or More Years Ago
Never
Not Sure
15. A routine checkup .......................... 63% 21% 7% 8% <1% <1% 16. Cholesterol testing ......................... 51 14 5 4 20 7 17. Visit to a dentist or dental clinic .... 51 25 10 13 <1 <1 18. Eye exam ....................................... 41 28 10 16 2 3
19. During the past 12 months, have you had a flu shot or a flu vaccine that was sprayed in your nose?
Yes ..................................................................... 35% No ...................................................................... 65 Not sure.............................................................. <1
20. Could you please tell me in what year you born? [CALCULATE AGE]
18 to 24 years old ............................................... 19% 25 to 34 years old ............................................... 22 35 to 44 years old ............................................... 17 45 to 54 years old ............................................... 17 55 to 64 years old ............................................... 13 65 and older ....................................................... 12
21. A pneumonia shot or pneumococcal vaccine is usually given once or twice in a person’s lifetime and is different
from the flu shot. Have you ever had a pneumonia shot? [146 Respondents 65 and Older]
Yes ..................................................................... 67% No ...................................................................... 27 Not sure.............................................................. 5
In the past three years, have you been treated for or been told by a doctor, nurse or other health care provider that:
Yes No Not Sure 22. You have high blood pressure? ........................ 29% 71% <1% 23. …(if yes) [342 Respondents]: Is it under
control through medication, exercise or lifestyle changes? ..............................................
96
4
<1 24. Your blood cholesterol is high? ........................ 19 80 1 25. …(if yes) [225 Respondents]: Is it under
control through medication, exercise or lifestyle changes? ..............................................
84
13
3 26. You had a stroke? ............................................. 2 98 0 27. …(if yes) [24 Respondents]: Is it under
control through medication, exercise or lifestyle changes? ..............................................
96
4
0 28. You have heart disease or a heart condition? ... 9 91 <1 29. …(if yes) [101 Respondents]: Is it under
control through medication, exercise or lifestyle changes? ..............................................
89
7
4

Milwaukee Community Health Survey Report—2012 179
Yes No Not Sure
30. You had a mental health condition, such as an anxiety disorder, obsessive-compulsive disorder, panic disorder, post traumatic stress disorder or depression? ..................................... 16% 84% <1%
31. …(if yes) [186 Respondents]: Is it under control through medication, exercise or lifestyle changes? ..............................................
81
18
<1 32. You have cancer?.............................................. 3 97 <1 33. …(if yes) [39 Respondents; Multiple
responses accepted]: What type of cancer? ...... Breast ..................................... 11 respondents Melanoma/skin ......................... 8 respondents Prostate ..................................... 5 respondents Cervical .................................... 3 respondents Colon ........................................ 2 respondents Uterine ..................................... 2 respondents All others (1 response each) ..... 8 respondents
34. You have diabetes (men) You have diabetes not associated with a pregnancy (women) .......................................... 10 89 <1
35. …(if yes) [123 Respondents]: Is it under control through medication, exercise or lifestyle changes? ..............................................
90
8
<1 36. Do you currently have asthma? ........................ 14 86 <1 37. …(if yes) [162 Respondents]: Is it under
control through medication, exercise or lifestyle changes? ..............................................
93
7
0
38. On an average day, how many servings of fruit do you eat or drink? One serving is ½ cup of canned or cooked
fruit, 1 medium piece of fruit or 6 ounces of juice.
One or fewer servings ........................................ 39% Two servings...................................................... 30 Three or more servings ...................................... 30 Not sure.............................................................. 0
39. On an average day, how many servings of vegetables do you eat? One serving is ½ cup of cooked or raw
vegetable or 6 ounces of juice.
One or fewer servings ........................................ 50% Two servings...................................................... 25 Three or more servings ...................................... 25 Not sure.............................................................. 0
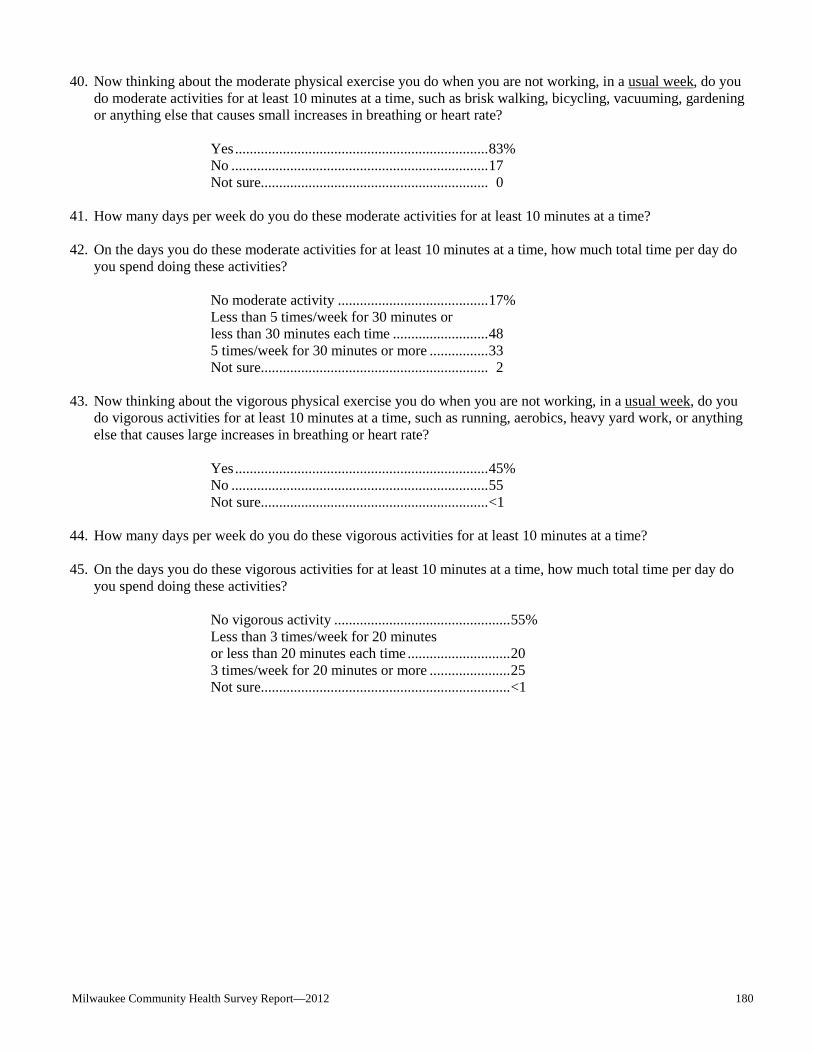
Milwaukee Community Health Survey Report—2012 180
40. Now thinking about the moderate physical exercise you do when you are not working, in a usual week, do you do moderate activities for at least 10 minutes at a time, such as brisk walking, bicycling, vacuuming, gardening or anything else that causes small increases in breathing or heart rate?
Yes ..................................................................... 83% No ...................................................................... 17 Not sure.............................................................. 0
41. How many days per week do you do these moderate activities for at least 10 minutes at a time?
42. On the days you do these moderate activities for at least 10 minutes at a time, how much total time per day do
you spend doing these activities?
No moderate activity ......................................... 17% Less than 5 times/week for 30 minutes or less than 30 minutes each time .......................... 48 5 times/week for 30 minutes or more ................ 33 Not sure.............................................................. 2
43. Now thinking about the vigorous physical exercise you do when you are not working, in a usual week, do you
do vigorous activities for at least 10 minutes at a time, such as running, aerobics, heavy yard work, or anything else that causes large increases in breathing or heart rate?
Yes ..................................................................... 45% No ...................................................................... 55 Not sure.............................................................. <1
44. How many days per week do you do these vigorous activities for at least 10 minutes at a time?
45. On the days you do these vigorous activities for at least 10 minutes at a time, how much total time per day do
you spend doing these activities?
No vigorous activity ................................................ 55% Less than 3 times/week for 20 minutes or less than 20 minutes each time ............................ 20 3 times/week for 20 minutes or more ...................... 25 Not sure.................................................................... <1

Milwaukee Community Health Survey Report—2012 181
Q46 THROUGH Q48 FEMALES ONLY
Now I have some questions about women’s health.
46. A mammogram is an x-ray of each breast to look for breast cancer. How long has it been since you had your last mammogram? [218 Respondents 50 and Older]
Within the past year (anytime less than 12 months ago) ........... 61% Within the past 2 years (1 year, but less than 2 years ago) ........ 16 Within the past 3 years (2 years, but less than 3 years ago) ..... 7 Within the past 5 years (3 years, but less than 5 years ago) ...... 4 5 or more years ago ................................................................... 8 Never ......................................................................................... 3 Not sure ..................................................................................... 1
47. A bone density scan helps determine if you are at risk for fractures or are in the early stages of osteoporosis.
Have you ever had a bone density scan? [88 Respondents 65 and Older]
Yes ............................................................................. 64% No .............................................................................. 32 Not sure...................................................................... 5
48. A pap smear is a test for cancer of the cervix. If you have not had a hysterectomy, how long has it been since
you had your last pap smear? [522 Respondents 18 to 65 years old]
Within the past year (anytime less than 12 months ago) ........... 61% Within the past 2 years (1 year, but less than 2 years ago) ........ 19 Within the past 3 years (2 years, but less than 3 years ago) ..... 6 Within the past 5 years (3 years, but less than 5 years ago) ...... 4 5 or more years ago ................................................................... 5 Never ......................................................................................... 6 Not sure ..................................................................................... <1
Q49 MALES 40 AND OLDER ONLY
49. There are two prostate cancer screenings. One is a digital rectal exam where a doctor, nurse, or other health
professional places a gloved finger into the rectum to feel the size, shape, and hardness of the prostate gland while the other is a Prostate-Specific Antigen test, also known as a PSA test, which is a blood test for prostate cancer. How long has it been since you had your last prostate cancer screening? [278 Respondents 40 and Older]
Within the past year (anytime less than 12 months ago) ........... 33% Within the past 2 years (1 year, but less than 2 years ago) ........ 12 Within the past 3 years (2 years, but less than 3 years ago) ..... 4 Within the past 5 years (3 years, but less than 5 years ago) ...... 6 5 or more years ago ................................................................... 15 Never ......................................................................................... 28 Not sure ..................................................................................... 2

Milwaukee Community Health Survey Report—2012 182
MALE & FEMALE RESPONDENTS 50 AND OLDER 50. A blood stool test is a test that may use a special kit at home to determine whether the stool contains blood. How
long has it been since you had a blood stool test? [396 Respondents 50 and Older]
Within the past year (anytime less than 12 months ago) ........... 15% Within the past 2 years (1 year, but less than 2 years ago) ........ 9 Within the past 5 years (2 years, but less than 5 years ago) ...... 11 5 years ago or more ................................................................... 11 Never ......................................................................................... 50 Not sure ..................................................................................... 5
51. A sigmoidoscopy is where a flexible tube is inserted into the rectum to view the bowel for signs of cancer or
other health problems. How long has it been since you had your last sigmoidoscopy? [394 Respondents 50 and Older]
Within the past year (anytime less than 12 months ago) ........... 4% Within the past 2 years (1 year, but less than 2 years ago) ........ 3 Within the past 5 years (2 years, but less than 5 years ago) ...... 5 Within the past 10 years (5 years but less than 10 years ago) ... 4 10 years ago or more ................................................................. 4 Never ......................................................................................... 73 Not sure ..................................................................................... 7
52. A colonoscopy is similar to a sigmoidoscopy, but uses a longer tube, and you are usually given medication
through a needle in your arm to make you sleepy and told to have someone else drive you home after the test. How long has it been since you had your last colonoscopy? [396 Respondents 50 and Older]
Within the past year (anytime less than 12 months ago) ........... 14% Within the past 2 years (1 year, but less than 2 years ago) ........ 15 Within the past 5 years (2 years, but less than 5 years ago) ...... 21 Within the past 10 years (5 years but less than 10 years ago) ... 9 10 years ago or more ................................................................. 4 Never ......................................................................................... 34 Not sure ..................................................................................... 2
ALL RESPONDENTS
53. During the past 30 days, about how often would you say you felt sad, blue, or depressed?
Never ................................................................. 32% Seldom ............................................................... 29 Sometimes ......................................................... 28 Nearly always .................................................... 5 Always ............................................................... 4 Not sure.............................................................. <1

Milwaukee Community Health Survey Report—2012 183
54. How often would you say you find meaning and purpose in your daily life?
Never ................................................................. 3% Seldom ............................................................... 4 Sometimes ......................................................... 19 Nearly always .................................................... 24 Always ............................................................... 50 Not sure.............................................................. <1
55. In the past year have you ever felt so overwhelmed that you considered suicide?
Yes ..................................................................... 6% No ...................................................................... 94 Not sure.............................................................. <1
Now I’d like to ask you about alcohol. An alcoholic drink is one can or bottle of beer, one glass of wine, one can or bottle of wine cooler, one cocktail or one shot of liquor.
56. Considering all types of alcoholic beverages, how many times during the past month did you have [five or more
drinks (males); four or more drinks (females)] on an occasion?
None .................................................................. 67% One time ............................................................ 9 Two or more times ............................................. 23 Not sure.............................................................. <1
57. In the past 30 days, did you drive or ride when the driver had perhaps too much alcohol to drink?
Yes ..................................................................... 2% No ...................................................................... 98 Not sure.............................................................. <1
During the past year, has ANYONE IN YOUR HOUSEHOLD, INCLUDING YOURSELF, experienced any kind of problem such as legal, social, personal, physical or medical in connection with…?
Yes No Not Sure 58. Drinking alcohol ............................................... 3% 97% <1% 59. Marijuana .......................................................... 2 98 <1 60. Cocaine, heroin or other street drugs ................ <1 99 <1 61. Misuse of prescription drugs or over-the-
counter drugs .................................................... 1
99
0
62. Gambling .......................................................... 1 99 <1

Milwaukee Community Health Survey Report—2012 184
Now I’d like to talk to you about cigarettes and tobacco….
63. Do you now smoke cigarettes every day, some days or not at all?
Every day ........................................................... 20% Some days .......................................................... 8 Not at all ............................................................ 72 →GO TO Q67 Not sure.............................................................. 0 →GO TO Q67
64. During the past 12 months, have you stopped smoking for one day or longer because you were trying to quit?
[333 Current Smokers]
Yes ..................................................................... 66% No ...................................................................... 33 Not sure.............................................................. <1
65. In the past 12 months, have you seen a doctor, nurse or other health professional? [333 Current Smokers]
Yes ..................................................................... 71% →CONTINUE WITH Q66 No ...................................................................... 29 →GO TO Q67 Not sure.............................................................. 0 →GO TO Q67
66. In the past 12 months, has a doctor, nurse or other health professional advised you to quit smoking? [236 Current Smokers]
Yes ..................................................................... 83% No ...................................................................... 17 Not sure.............................................................. 0
67. Which statement best describes the rules about smoking inside your home…
Smoking is not allowed anywhere inside your home .. 71% Smoking is allowed in some places or at some times .. 11 Smoking is allowed anywhere inside your home or .... 4 There are no rules about smoking inside your home ... 13 Not sure........................................................................ <1
68. In the past seven days, how many days were you in the same room or did you ride in a car with someone who
was smoking cigarettes? [866 Nonsmokers]
0 days ................................................................. 74% 1 to 3 days .......................................................... 15 4 to 6 days .......................................................... 5 All 7 days ........................................................... 5 Not sure.............................................................. <1
69. In the past 30 days, did you use other tobacco products such as cigars, pipes, chewing tobacco or snuff?
Yes ..................................................................... 8% No ...................................................................... 93 Not sure.............................................................. 0
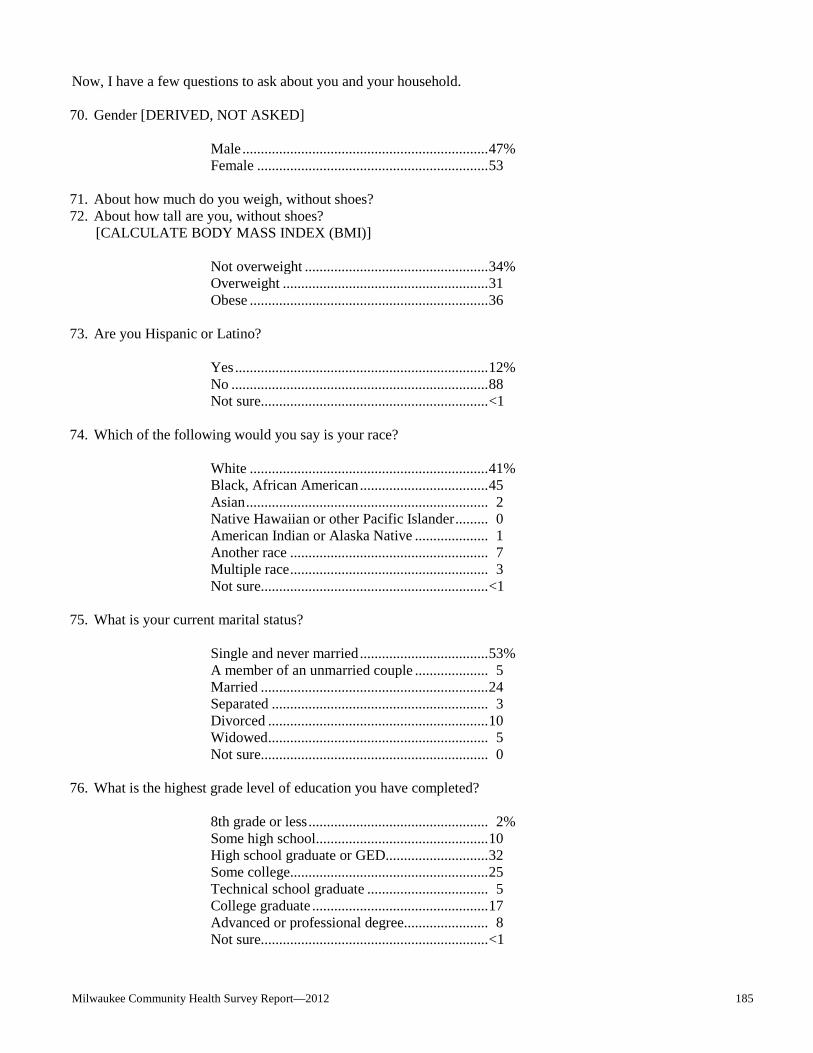
Milwaukee Community Health Survey Report—2012 185
Now, I have a few questions to ask about you and your household.
70. Gender [DERIVED, NOT ASKED]
Male ................................................................... 47% Female ............................................................... 53
71. About how much do you weigh, without shoes? 72. About how tall are you, without shoes? [CALCULATE BODY MASS INDEX (BMI)]
Not overweight .................................................. 34% Overweight ........................................................ 31 Obese ................................................................. 36
73. Are you Hispanic or Latino?
Yes ..................................................................... 12% No ...................................................................... 88 Not sure.............................................................. <1
74. Which of the following would you say is your race?
White ................................................................. 41% Black, African American ................................... 45 Asian .................................................................. 2 Native Hawaiian or other Pacific Islander ......... 0 American Indian or Alaska Native .................... 1 Another race ...................................................... 7 Multiple race ...................................................... 3 Not sure.............................................................. <1
75. What is your current marital status?
Single and never married ................................... 53% A member of an unmarried couple .................... 5 Married .............................................................. 24 Separated ........................................................... 3 Divorced ............................................................ 10 Widowed ............................................................ 5 Not sure.............................................................. 0
76. What is the highest grade level of education you have completed?
8th grade or less ................................................. 2% Some high school ............................................... 10 High school graduate or GED............................ 32 Some college ...................................................... 25 Technical school graduate ................................. 5 College graduate ................................................ 17 Advanced or professional degree ....................... 8 Not sure.............................................................. <1

Milwaukee Community Health Survey Report—2012 186
77. What county do you live in? [FILTER]
Milwaukee ......................................................... 100% 78. What city, town or village do you legally reside in? [FILTER]
Milwaukee city .................................................. 100% 79. What is the zip code of your primary residence?
53215 ................................................................. 10% 53218 ................................................................. 8 53206 ................................................................. 7 53209 ................................................................. 7 53216 ................................................................. 7 53202 ................................................................. 6 53210 ................................................................. 6 53212 ................................................................. 6 53222 ................................................................. 5 53204 ................................................................. 4 53208 ................................................................. 4 53225 ................................................................. 4 All others (3% or less) ....................................... 25
Q80 THROUGH Q82 LANDLINE SAMPLE ONLY [FOR SAMPLING PURPOSES] 80. Do you have more than one telephone number in your household? Do not include cell phones or numbers that
are only used by a computer or fax machine.
81. How many of these telephone numbers are residential numbers? 82. Do you have a cell phone that you use mainly for personal use?
83. What is your annual household income before taxes?
Less than $10,000 .............................................. 19% $10,000 to $20,000 ............................................ 14 $20,001 to $30,000 ............................................ 13 $30,001 to $40,000 ............................................ 10 $40,001 to $50,000 ............................................ 5 $50,001 to $60,000 ............................................ 6 $60,001 to $75,000 ............................................ 5 $75,001 to $90,000 ............................................ 3 $90,001 to $105,000 .......................................... 3 $105,001 to $120,000 ........................................ 1 $120,001 to $135,000 ........................................ 1 Over $135,000 ................................................... 3 Not sure.............................................................. 10 No answer .......................................................... 5
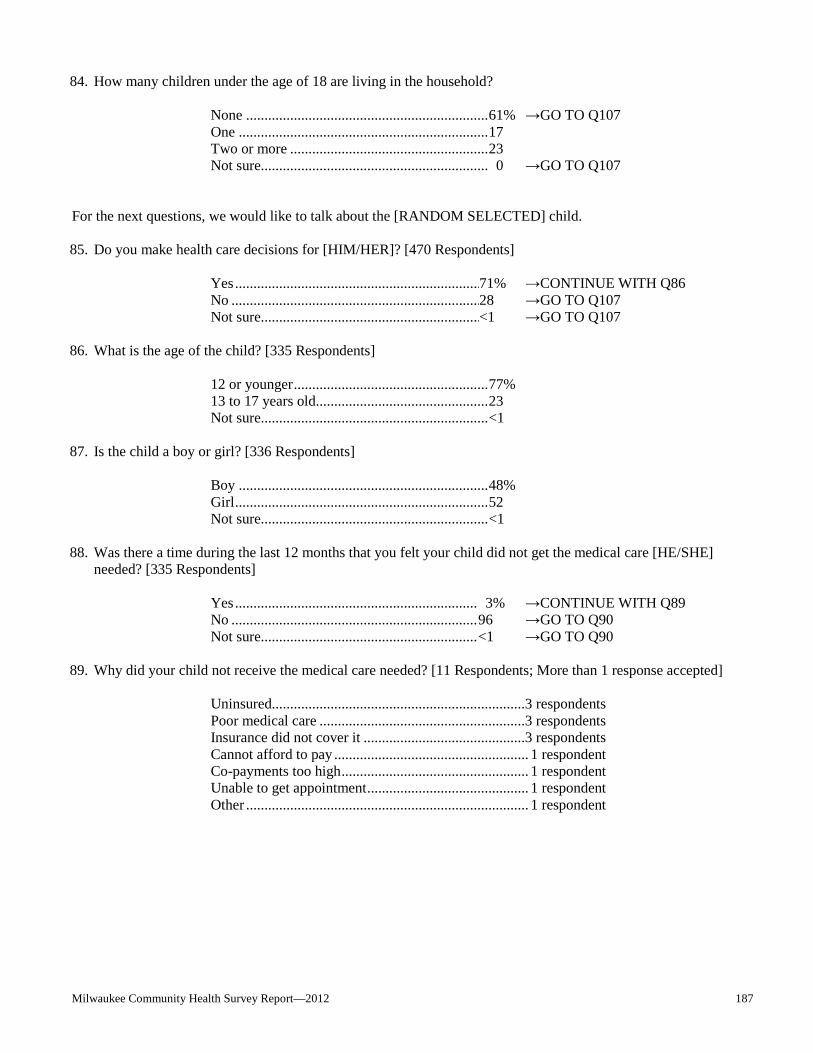
Milwaukee Community Health Survey Report—2012 187
84. How many children under the age of 18 are living in the household?
None .................................................................. 61% →GO TO Q107 One .................................................................... 17 Two or more ...................................................... 23 Not sure.............................................................. 0 →GO TO Q107
For the next questions, we would like to talk about the [RANDOM SELECTED] child.
85. Do you make health care decisions for [HIM/HER]? [470 Respondents]
Yes ................................................................... 71% →CONTINUE WITH Q86 No .................................................................... 28 →GO TO Q107 Not sure............................................................ <1 →GO TO Q107
86. What is the age of the child? [335 Respondents]
12 or younger ..................................................... 77% 13 to 17 years old ............................................... 23 Not sure.............................................................. <1
87. Is the child a boy or girl? [336 Respondents]
Boy .................................................................... 48% Girl ..................................................................... 52 Not sure.............................................................. <1
88. Was there a time during the last 12 months that you felt your child did not get the medical care [HE/SHE]
needed? [335 Respondents]
Yes ................................................................... 3% →CONTINUE WITH Q89 No .................................................................... 96 →GO TO Q90 Not sure............................................................ <1 →GO TO Q90
89. Why did your child not receive the medical care needed? [11 Respondents; More than 1 response accepted]
Uninsured.....................................................................3 respondents Poor medical care ........................................................3 respondents Insurance did not cover it ............................................3 respondents Cannot afford to pay ..................................................... 1 respondent Co-payments too high ................................................... 1 respondent Unable to get appointment ............................................ 1 respondent Other ............................................................................. 1 respondent

Milwaukee Community Health Survey Report—2012 188
90. A personal doctor or nurse is a health professional who knows your child well, and is familiar with your child’s health history. This can be a general doctor, a pediatrician, a specialist, a nurse practitioner or a physician assistant. Do you have one or more persons you think of as your child’s personal doctor or nurse? [336 Respondents]
Yes .................................................................... 88% →CONTINUE WITH Q91 No ..................................................................... 11 →GO TO Q92 Not sure............................................................. <1 →GO TO Q92
91. Preventive care visits include things like a well-child check, a routine physical exam, immunizations, lead or
other health screening tests. During the past 12 months, did [HE/SHE] visit their personal doctor or nurse for preventive care? [297 Respondents]
Yes ..................................................................... 96% No ...................................................................... 4 Not sure.............................................................. <1
92. Specialists are doctors like surgeons, heart doctors, allergists, psychiatrists, skin doctors and others who
specialize in one area of health care. Was there a time during the past 12 months your child needed to see a specialist but did not? [336 Respondents]
Yes ..................................................................... 2% →CONTINUE WITH Q93 No ...................................................................... 98 →GO TO Q94 Not sure.............................................................. <1 →GO TO Q94
93. Why did your child not see a specialist needed? [6 Respondents; More than 1 response accepted]
Unable to get appointment ...........................................3 respondents Insurance did not cover it ............................................. 1 respondent Not enough time ........................................................... 1 respondent Specialty physician not in area ..................................... 1 respondent Don’t know where to go ............................................... 1 respondent
94. Was there a time during the last 12 months that you felt your child did not get the dental care [HE/SHE]
needed? [335 Respondents]
Yes ..................................................................... 10% →CONTINUE WITH Q95 No ...................................................................... 89 →GO TO Q96 Not sure.............................................................. <1 →GO TO Q96
95. Why did your child not receive the dental care needed? [35 Respondents; More than 1 response accepted]
Can’t find dentist who accepts child’s insurance.......15 respondents Unable to get appointment .........................................13 respondents No dental insurance .....................................................5 respondents Cannot afford to pay ....................................................3 respondents Don’t know where to go ..............................................3 respondents Health plan problem/insurance did not cover it ...........2 respondents Dentist/specialist not in area ......................................... 1 respondent

Milwaukee Community Health Survey Report—2012 189
96. Does your child have asthma? [335 Respondents]
Yes ..................................................................... 14% →CONTINUE WITH Q97 No ...................................................................... 86 →GO TO Q98 Not sure.............................................................. <1 →GO TO Q98
97. Asthma attacks, sometimes called episodes, refer to periods of worsening asthma symptoms that make the child
limit his or her activity more than usual, or make you seek medical care. During the past 12 months, has your child had an episode of asthma or an asthma attack? [46 Respondents]
Yes ..................................................................... 46% No ...................................................................... 54 Not sure.............................................................. 0
98. When your child was an infant of less than one year old, where did [HE/SHE] usually sleep? [73 Children 2 years old or younger]
Crib or bassinette ............................................... 89% Swing ................................................................. 0 Pack n’ Play ....................................................... 5 Couch or chair ................................................... 0 Car ..................................................................... 0 Car seat .............................................................. 0 Floor .................................................................. 0 In bed with you or another person ..................... 4 Not sure.............................................................. 1
99. How often do you feel your child is safe in your community or neighborhood? [335 Respondents]
Always ............................................................... 50% Nearly always .................................................... 25 Sometimes ......................................................... 18 Seldom ............................................................... 1 Never ................................................................. 4 Not sure.............................................................. <1
100. During the past 6 months, how often was your child unhappy, sad or depressed? [172 Children 8 to 17 years old]
Always ............................................................... 2% Nearly always .................................................... 5 Sometimes ......................................................... 35 Seldom ............................................................... 24 Never ................................................................. 31 Not sure.............................................................. 2
101. During the past 12 months, has your child experienced any bullying? [173 Children 8 to 17 years old]
Yes ..................................................................... 23% No ...................................................................... 77 Not sure.............................................................. <1
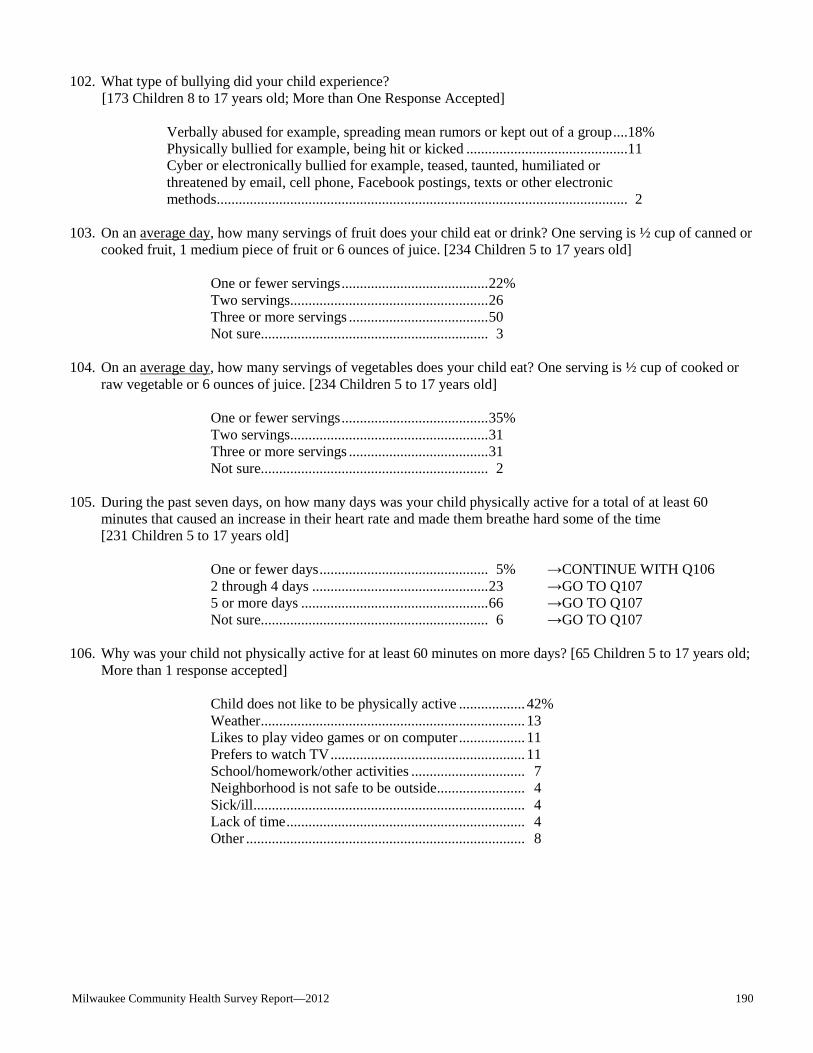
Milwaukee Community Health Survey Report—2012 190
102. What type of bullying did your child experience? [173 Children 8 to 17 years old; More than One Response Accepted]
Verbally abused for example, spreading mean rumors or kept out of a group .... 18% Physically bullied for example, being hit or kicked ............................................ 11 Cyber or electronically bullied for example, teased, taunted, humiliated or threatened by email, cell phone, Facebook postings, texts or other electronic methods ................................................................................................................ 2
103. On an average day, how many servings of fruit does your child eat or drink? One serving is ½ cup of canned or
cooked fruit, 1 medium piece of fruit or 6 ounces of juice. [234 Children 5 to 17 years old]
One or fewer servings ........................................ 22% Two servings...................................................... 26 Three or more servings ...................................... 50 Not sure.............................................................. 3
104. On an average day, how many servings of vegetables does your child eat? One serving is ½ cup of cooked or
raw vegetable or 6 ounces of juice. [234 Children 5 to 17 years old]
One or fewer servings ........................................ 35% Two servings...................................................... 31 Three or more servings ...................................... 31 Not sure.............................................................. 2
105. During the past seven days, on how many days was your child physically active for a total of at least 60
minutes that caused an increase in their heart rate and made them breathe hard some of the time [231 Children 5 to 17 years old]
One or fewer days .............................................. 5% →CONTINUE WITH Q106 2 through 4 days ................................................ 23 →GO TO Q107 5 or more days ................................................... 66 →GO TO Q107 Not sure.............................................................. 6 →GO TO Q107
106. Why was your child not physically active for at least 60 minutes on more days? [65 Children 5 to 17 years old;
More than 1 response accepted]
Child does not like to be physically active ................... 42% Weather ......................................................................... 13 Likes to play video games or on computer ................... 11 Prefers to watch TV ...................................................... 11 School/homework/other activities ................................ 7 Neighborhood is not safe to be outside ......................... 4 Sick/ill ........................................................................... 4 Lack of time .................................................................. 4 Other ............................................................................. 8

Milwaukee Community Health Survey Report—2012 191
The next series of questions deal with personal safety issues. 107. During the past year has anyone made you afraid for your personal safety?
Yes ..................................................................... 8% →CONTINUE WITH Q108 No ...................................................................... 92 →GO TO Q109 Not sure.............................................................. 0 →GO TO Q109
108. What relationship is this person or people to you? For example, a spouse, spouse who is now separated, ex-
spouse, boyfriend or girlfriend, parent, brother or sister, child, friend, acquaintance, a stranger, or someone else? Again, I want to assure you that all your responses are strictly confidential. [95 Respondents; More than 1 response accepted]
Stranger ............................................................... 54% Acquaintance ...................................................... 16 Boyfriend or girlfriend ........................................ 10 Friend .................................................................. 4 Child ................................................................... 4 Spouse ................................................................. 3 Separated spouse ................................................. 2 Ex-spouse............................................................ 2 Brother or sister .................................................. 2 Someone else ...................................................... 3 Not sure............................................................... 1
109. During the past year has anyone pushed, kicked, slapped, hit or otherwise hurt you?
Yes ..................................................................... 4% →CONTINUE WITH Q110 No ...................................................................... 96 →GO TO Q111 Not sure.............................................................. <1 →GO TO Q111
110. What relationship is this person or people to you? For example, a spouse, spouse who is now separated, ex-
spouse, boyfriend or girlfriend, parent, brother or sister, child, friend, acquaintance, a stranger, or someone else? [50 Respondents; More than 1 response accepted]
Stranger ............................................................... 34% Friend .................................................................. 27 Acquaintance ...................................................... 17 Child ................................................................... 7 Boyfriend or girlfriend ........................................ 6 Ex-spouse............................................................ 4 Brother or sister .................................................. 2 Someone else ...................................................... 3

Milwaukee Community Health Survey Report—2012 192
111. Finally, I will read you a list of health issues that some communities face. Please tell me the 3 largest health concerns in Milwaukee.
Alcohol or drug use ............................................................. 57% Violence ............................................................................... 56 Chronic diseases like diabetes, cancer or obesity ................ 50 Teen pregnancy .................................................................... 36 Infectious diseases such as whooping cough, tuberculosis, or sexually transmitted diseases .....................
29
Mental health or depression ................................................. 21 Infant mortality .................................................................... 20 Lead poisoning .................................................................... 3
Milwaukee Community Health Survey Report—2012 193
APPENDIX B: SURVEY METHODOLOGY

Milwaukee Community Health Survey Report—2012 194
SURVEY METHODOLOGY 2012 Community Health Survey The 2012 Milwaukee Community Health Survey was conducted from June 20 through November 7, 2012. A total of 1,200 respondents were scientifically selected so that the survey would be representative of all adults 18 and older. The sampling strategy was two-fold. 1) A random-digit-dial landline sample of telephone numbers which included listed and unlisted numbers. The respondent within each household was randomly selected by computer based on the number of adults in the household (n=744). 2) A cell-phone only sample where the person answering the phone was selected as the respondent (n=456). For the landline sample, weighting was based on the number of adults in the household and the number of residential phone numbers, excluding fax and computer lines, to take into account the probability of selection. For the cell-phone only sample, it was assumed the respondent was the primary cell phone user. Combined, post-stratification was conducted by sex and age to reflect the 2010 census proportion of these characteristics in the area. With a sample size of 1,200, the margin of error is ±3%. The margin of error for smaller subgroups is larger. 2009 Community Health Survey The 2009 Milwaukee Community Health Survey was conducted from October 12, 2009 through January 26, 2010. One thousand two hundred respondents were scientifically selected so that the survey would be representative of all adults 18 and older. The sampling strategy was two-fold. 1) A random-digit-dial landline sample of telephone numbers which included both listed and unlisted numbers. The respondent within each household was randomly selected by computer based on the number of adults in the household (n=900). 2) A cell-phone only sample where the person answering the phone was selected as the respondent (n=300). A reimbursement of $20 was offered to respondents to cover the cost of incoming minutes. For the landline sample, weighting was based on the number of adults in the household and the number of residential phone numbers, excluding fax and computer lines, to take into account the probability of selection. For the cell-phone only sample, it was assumed the respondent was the primary cell phone user. Combined, post-stratification was conducted by sex and age to reflect the 2000 census proportion of these characteristics in the area. With a sample size of 1,200, the margin of error is ±3%. The margin of error for smaller subgroups is larger. 2006 Community Health Survey The 2006 Milwaukee Community Health Survey was conducted from March 14 through August 11, 2006. A total of 2,000 random adults 18 and older within the community were interviewed by telephone. The sample of random telephone numbers included both listed and unlisted numbers. Respondents within each household were randomly selected by computer based on the number of adults in the household. At least 8 attempts were made to contact a respondent. Survey respondents were weighted based on the number of adults in the household and the number of residential phone numbers, excluding fax and computer lines, to take into account the probability of selection. Post-stratification was also done by sex and age to reflect the 2000 census proportion of these characteristics in the area. With a sample size of 2,000, the margin of error is ±2%. The margin of error for smaller subgroups is larger. 2003 Community Health Survey The 2003 Milwaukee Community Health Survey was conducted from February 22 through June 10, 2003. A total of 1,200 random adults 18 and older within the community were interviewed by telephone. The sample of random telephone numbers included both listed and unlisted numbers. At least 8 attempts were made to contact a respondent. Post-stratification was done by sex and age to reflect the 2000 census proportion of these characteristics in the area. With a sample size of 1,200, the margin of error is ±3%. The margin of error for smaller subgroups is larger.