community innovation survey 2010 synthesis … · unit g-4: innovation and ... 3.1.6 processing...
TRANSCRIPT
EUROPEAN COMMISSION EUROSTAT
Directorate G :Global Business Statistics Unit G-4: Innovation and information society
COMMUNITY INNOVATION SURVEY 2010
SYNTHESIS QUALITY REPORT
Contents 1 Introduction ..................................................................................................................................1 2 Methodological overview..............................................................................................................1 3 Quality assessment .......................................................................................................................8 3.1 Relevance ........................................................................................................................................8 3.1.1 User groups, user needs, user satisfaction .............................................................................8 3.1.2 Completeness........................................................................................................................9 3.1.3 Sampling errors ....................................................................................................................9 3.1.4 Coverage errors ..................................................................................................................10 3.1.5 Measurement errors ...........................................................................................................11 3.1.6 Processing errors ................................................................................................................12 3.1.7 Non-response errors ...........................................................................................................12 3.1.8 Comparison with CIS 2008 ..................................................................................................15 3.2 Timeliness and punctuality............................................................................................................16 3.3 Accessibility and clarity .................................................................................................................17 3.4 Comparability................................................................................................................................17 3.4.1 Methodological deviations...................................................................................................17 3.4.2 Comparability over time......................................................................................................20 3.5 Coherence .....................................................................................................................................21 3.5.1 Coherence with Structural Business Statistics .....................................................................21 4 Conclusions..................................................................................................................................23
Tables: Table 1. CIS 2010 statistics, activities covered by the countries....................................................................................................................2 Table 2. CIS 2010 statistics, overview of survey type and other sampling and response characteristics .................................4 Table 3. CIS 2010 statistics, data collection methods ..........................................................................................................................................6 Table 4. CIS 2010 statistics, coefficients of variation for five key indicators ........................................................................................ 10 Table 5. CIS 2010 statistics, ‘frame’ misclassification rate (%) by size class ........................................................................................ 11 Table 6. CIS 2010 statistics, imputation rates (%) for five key indicators ............................................................................................. 14 Table 7. CIS 2010 statistics, means of CIS 2010 dissemination ................................................................................................................... 17 Table 8. CIS 2010 statistics, deviations reported on the harmonised questionnaire........................................................................ 18 Table 9. CIS 2010 statistics, comparison between CIS 2010 and CIS 2008 data (relative difference) ..................................... 21 Table 10. CIS 2010 statistics, comparison between SBS and CIS 2010 data (relative differences) ........................................... 22 Figures: Figure 1. CIS 2010 statistics, unit response rate (%)........................................................................................................................................ 13 Figure 2. CIS 2010 and CIS 2008 statistics, response rates (%) in CIS 2008 and CIS 2010 ........................................................... 15 Figure 3. CIS 2010 statistics, national publication of first and/or provisional and final results ................................................. 16
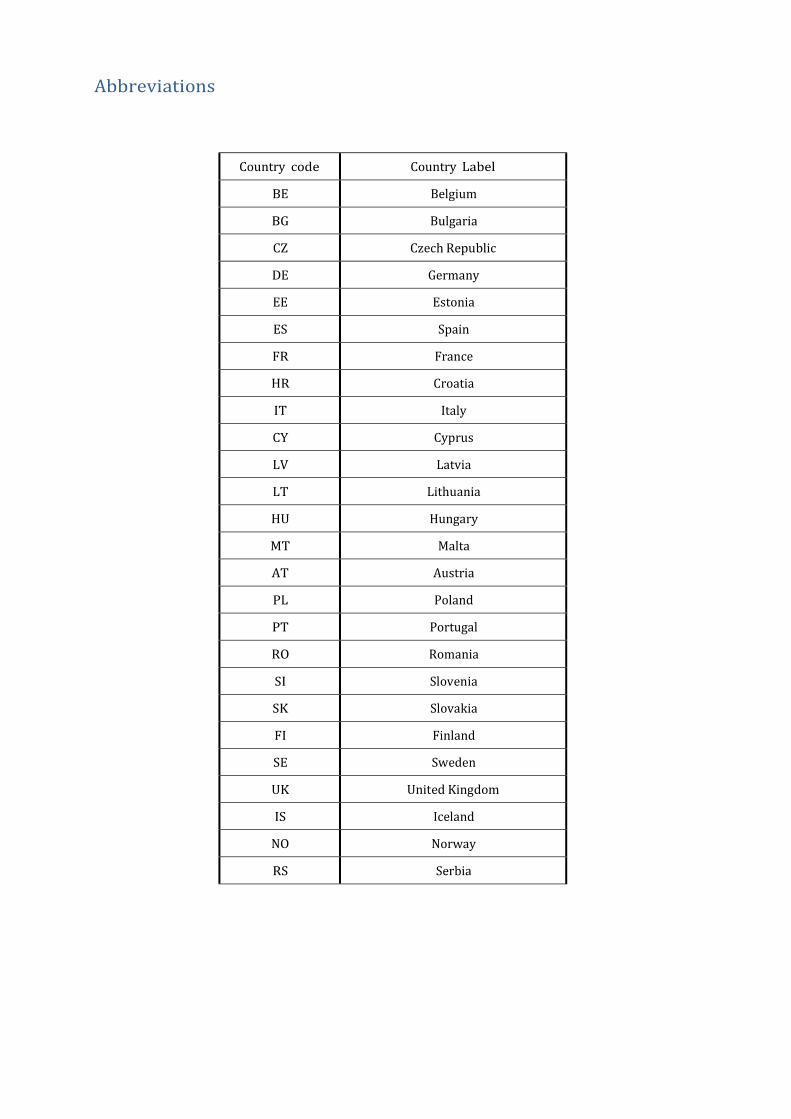
Abbreviations Country code Country Label BE Belgium BG Bulgaria CZ Czech Republic DE Germany EE Estonia ES Spain FR France HR Croatia IT Italy CY Cyprus LV Latvia LT Lithuania HU Hungary MT Malta AT Austria PL Poland PT Portugal RO Romania SI Slovenia SK Slovakia FI Finland SE Sweden UK United Kingdom IS Iceland NO Norway RS Serbia

1
1 Introduction The present report is the synthesis of the national quality reports on CIS 2010 provided by the countries participating to CIS 2010 (version of 9th December 2013). Unless otherwise indicated, the assessment and all the statements have been performed solely on the basis of these quality reports. This synthesis document makes an overall assessment of the main aspects of quality reported on the 2010 data collection on innovation statistics. CIS 2010 had 31 participating countries (all the EU 27 Member States (except Greece), Iceland, Norway, Croatia, Serbia and Turkey). Most results were reported for the reference period 2008-2010. CIS 2010 also follows the recommendations of the Oslo Manual and reports indicators on four types of innovation: product, process, organisational and marketing. Eurostat received on voluntary basis 26 national quality reports, which are summarised in the present synthesis. The report is organised as follows: Chapter 2 gives a short methodological overview of the production of national CIS 2010 statistics. Chapter 3 makes an assessment of the quality of innovation statistics according to the quality dimensions defined by Eurostat. Finally, Chapter 4 summarises the findings of this synthesis report.
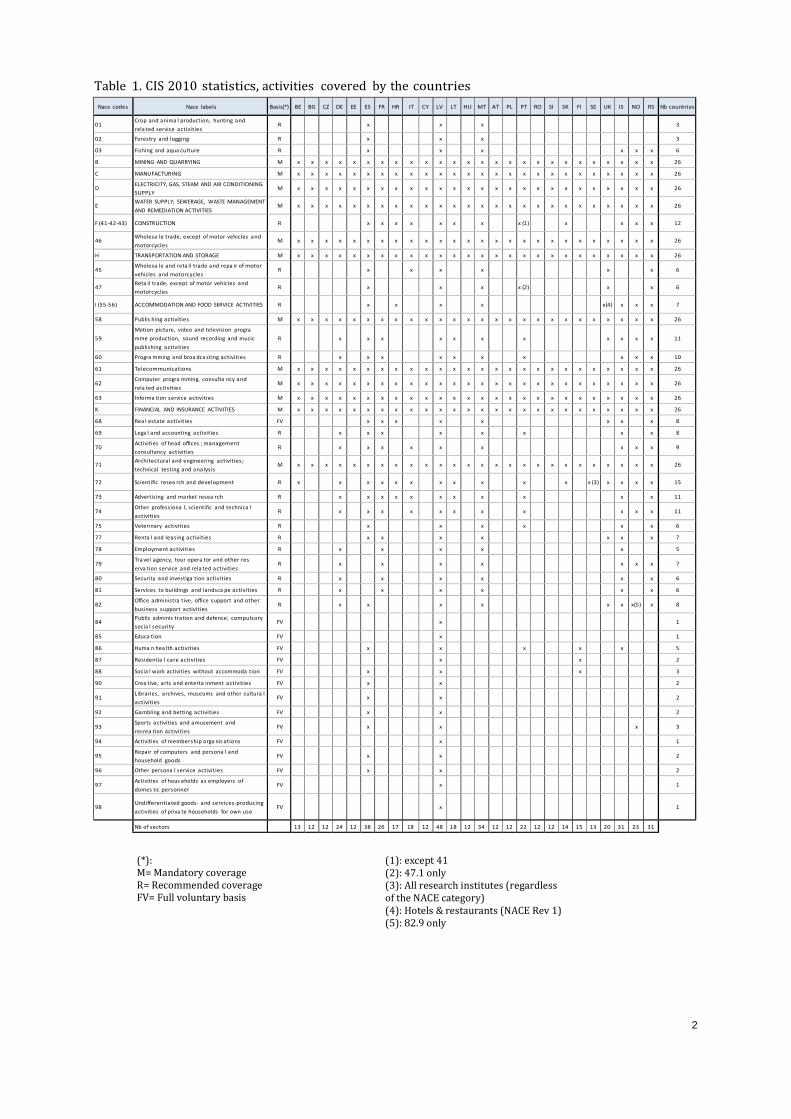
2 Methodological overview The collection of the CIS 2010 statistics at national level was made following the Commission Regulation No.1450/20041 implementing Decision No. 1608/2003 concerning the production and development of Community statistics on innovation. The Regulation lists the variables to be collected and specifies the sectors (CORE NACE coverage) and the breakdowns by size class of the results. In addition, the methodological guidelines proposed by Eurostat provide specific information on the implementation of the CIS 2010, the computation of the indicators and the transmission rules to Eurostat. The target population for CIS 2010 was all enterprises in NACE Rev.2 sections B, C, D, E, H, K and in the NACE Rev. 2 divisions 46, 58, 61, 62, 63 and 71. The core population of NACE categories to be included in the survey on a mandatory basis was set according to annex IV of the Commission Regulation No. 973/2007. All countries covered the core population of NACE sections. Amongst the countries that delivered the quality report, more than half (17 in 26 countries) covered in addition a number of NACE divisions from the non-core activities (i.e. recommended but not mandatory activities). In particular, Latvia and Malta covered all these non-core activities. Serbia, Spain and Iceland also covered many of them (see Table 1). Amongst non-core activities, the most often covered sectors were “Scientific Research and Development” (NACE 72) and Construction section. Finally, Latvia, Spain, Portugal, Finland, United Kingdom, Iceland, Norway and Serbia also included some NACE divisions on full voluntary basis (outside the recommended and mandatory target population). Table 1 shows the NACE divisions covered in CIS 2010.
1 The new Regulation (Commission Regulation No 995/2012) is applicable from CIS 2012 onwards.
2
Table 1. CIS 2010 statistics, activities covered by the countries
Nace codes Nace labels Basis(*) BE BG CZ DE EE ES FR HR IT CY LV LT HU MT AT PL PT RO SI SK FI SE UK IS NO RS Nb countries
01 Crop a nd a nima l production, hunting a nd
rela ted service a ctivities R x x x 3
02 Forestry a nd logging R x x x 3
03 Fishing and aqua culture R x x x x x x 6
B MINING AND QUARRYING M x x x x x x x x x x x x x x x x x x x x x x x x x x 26
C MANUFACTURING M x x x x x x x x x x x x x x x x x x x x x x x x x x 26
D ELECTRICITY, GAS, STEAM AND AIR CONDITIONING
SUPPLY M x x x x x x x x x x x x x x x x x x x x x x x x x x 26
E WATER SUPPLY; SEWERAGE, WASTE MANAGEMENT
AND REMEDIATION ACTIVITIES M x x x x x x x x x x x x x x x x x x x x x x x x x x 26
F (41-42-43) CONSTRUCTION R x x x x x x x x (1) x x x x 12
46 Wholesa le tra de, except of motor vehicles a nd
motorcycles M x x x x x x x x x x x x x x x x x x x x x x x x x x 26
H TRANSPORTATION AND STORAGE M x x x x x x x x x x x x x x x x x x x x x x x x x x 26
45 Wholesa le a nd reta il tra de a nd repa ir of motor vehicles a nd motorcycles
R x x x x x x 6
47 Reta il trade, except of motor vehicles a nd
motorcycles R x x x x (2) x x 6
I (55-56) ACCOMMODATION AND FOOD SERVICE ACTIVITIES R x x x x x(4) x x x 7
58 Publis hing a ctivities M x x x x x x x x x x x x x x x x x x x x x x x x x x 26
59
Motion picture, video and television progra
mme production, sound recording a nd music
publishing a ctivities
R x x x x x x x
x
x
x
x 11
60 Progra mming a nd broa dca sting a ctivities R x x x x x x x x x x 10
61 Telecommunications M x x x x x x x x x x x x x x x x x x x x x x x x x x 26
62 Computer progra mming, consulta ncy a nd
rela ted a ctivities M x x x x x x x x x x x x x x x x x x x x x x x x x x 26
63 Informa tion s ervice a ctivities M x x x x x x x x x x x x x x x x x x x x x x x x x x 26
K FINANCIAL AND INSURANCE ACTIVITIES M x x x x x x x x x x x x x x x x x x x x x x x x x x 26
68 Rea l estate a ctivities FV x x x x x x x x 8
69 Lega l a nd a ccounting a ctivities R x x x x x x x x 8
70 Activities of head offices ; ma nagement consultancy a ctivities
R x x x x x x x x x 9
71 Architectura l a nd engineering a ctivities; technical testing a nd a na lysis
M x x x x x x x x x x x x x x x x x x x x x x x x x x 26
72 Scientific resea rch and development R x x x x x x x x x x x x (3) x x x x 15
73 Advertising and ma rket resea rch R x x x x x x x x x x x 11
74 Other professiona l, scientific a nd technica l a ctivities
R x x x x x x x x x x x 11
75 Veterinary activities R x x x x x x 6
77 Renta l a nd lea sing activities R x x x x x x x 7
78 Employment a ctivities R x x x x x 5
79 Tra vel a gency, tour opera tor a nd other res
erva tion service a nd rela ted a ctivitiesR x x x x x x x 7
80 Security a nd investiga tion a ctivities R x x x x x x 6
81 Services to buildings a nd la ndsca pe a ctivities R x x x x x x 6
82 Office a dministra tive, office s upport and other business s upport a ctivities
R x x x x x x x(5) x 8
84 Public a dminis tra tion a nd defence; compulsory
socia l s ecurity FV x 1
85 Educa tion FV x 1
86 Huma n hea lth activities FV x x x x x 5
87 Residentia l ca re a ctivities FV x x 2
88 Socia l work activities without accommoda tion FV x x x 3
90 Crea tive, a rts a nd enterta inment a ctivities FV x x 2
91 Libraries, a rchives, museums and other cultura l a ctivities
FV x x 2
92 Ga mbling a nd betting activities FV x x 2
93 Sports a ctivities a nd a musement a nd
recrea tion activities FV x x x 3
94 Activities of membership orga nis ations FV x 1
95 Repair of computers a nd persona l a nd
household goods FV x x 2
96 Other persona l service a ctivities FV x x 2
97 Activities of hous eholds a s employers of domes tic personnel
FV x 1
98
Undifferentia ted goods- a nd services-producing
a ctivities of priva te households for own use
FV x 1
Nb of sectors 13 12 12 24 12 38 26 17 18 12 48 18 12 34 12 12 22 12 12 14 15 13 20 31 23 31
(*): M= Mandatory coverage R= Recommended coverage FV= Full voluntary basis (1): except 41 (2): 47.1 only (3): All research institutes (regardless of the NACE category) (4): Hotels & restaurants (NACE Rev 1) (5): 82.9 only
3
As regards the breakdown of enterprises into size classes, the Regulation defines the following three classes depending on the number of employees in the enterprise: 10-49 employees, 50-249 employees and 250 or more employees. All countries were in compliance with this division. Some of them used more detailed breakdowns than requested in the Regulation to obtain more detailed results; it’s the case of Germany, Estonia, France and United Kingdom. In few countries, enterprises with less than 10 employees have been encompassed and distinguished in the target population (Germany, Iceland and Norway). The following deviations have been reported: DE: eight size classes were created (i.e. 5-9, 10-19, 20-49, 50-99, 100-249, 250-499, 500-999, 1000 and more employees), EE: the sample was broken down in five size-classes (i.e. 10–19, 20–49, 50–99, 100–249, and 250+), FR: one size class (10-49) was split into two categories (i.e. 10-19, 20-49, 50-249 and 250+), IT: CIS 2010 size classes were defined by the number of employed persons and not by the number of employees, PT: deviations were reported for two groups of NACE divisions i.e. NACE 86 (only enterprises with 50 employees or more were considered) and NACE 42, 43, 47.1, 59 and 60 (only enterprises with 250 employees or more were considered), UK: four size classes were used (10-49, 50-99, 100-249 and 250+), IS: four size classes were used (1-9, 10-49, 50-249 and 250+), NO: the sample was broken down by four size classes: 5-9, 10-49, 50-249 and 250+; except NACE groups F and H, which only included enterprises with 20 employees or more.
In all countries the statistical unit in the CIS survey was the enterprise. Finally, the reference period was in compliance with the recommendations. Therefore, in all countries, CIS 2010 covered the 3-years reference period from 2008 to 2010. Regarding the innovation activities, only the number of enterprises engaged in innovation activities in 2010 was reported by Spain while a 3-year reference period (2008-2010) was recommended for this variable.
Survey methodology The majority of the countries carried out a combination of sample survey and census of the enterprises included in the frame population. Three countries (Bulgaria, Malta and Poland) used exclusively census. In most of the cases where a combination of sampling with census was used, the employment size class was the main variables used to define a threshold. Usually larger enterprises were enumerated, while smaller enterprises were sampled. The threshold to separate ‘large’ from ‘small’ enterprises can be as high as 500 employees (for Germany only), for half of the countries it is 250 employees, for Spain, it is 200, for Hungary and Romania it is 100 employees, while for 6 countries (Belgium, Estonia, Slovenia, Iceland, Norway and Croatia) it is set to 50 employees, with the exception of Cyprus with 20 employees. Moreover, some countries implement census to previously known R&D performers or to specific NACE groups/classes, irrespective of the size class. Table 2 below gives an overview of the survey type, sample size, number of respondents and population size. Moreover, this table presents sample and response rates provided by the countries. There is separate reporting on the gross and on the net sample size, net sample representing the initial (gross) sample excluding the ineligible units. The net sample coincides with the term ‘realized’/final sample.

4
Table 2. CIS 2010 statistics, overview of survey type and other sampling and response characteristics
Countries
Survey type Gross (initial) sample Net (realised/ final) sample
Number of units with a response in the realised sample Population size Sample rate (%) Un- weighted response rate (%) BE Combination census/sampling 8,657 8,400 3,893 14,321 59.0 45.0 BG Census - - 14,230 - - 97.6 CZ Combination census/sampling 6,229 5,736 5,151 24,926 23.0 89.8 DE Combination census/sampling 22,179 - 5,113 127,073 17.8 23.1 EE Combination census/sampling 2,104 2,083 1,735 3,265 64.4 83.3 ES Combination census/sampling 49,212 43,462 40,104 177,996 24.4 92.3 FR Combination census/sampling 29,370 29,059 16,870 116,743 24.9 82.3 HR Combination census/sampling 4,500 3,598 3,390 10,676 33.7 81.5 IT Combination census/sampling 39,098 36,255 18,328 177,484 20.7 50.6 CY Combination census/sampling 1,405 1,405 1,405 - - 100.0 LV Combination census/sampling 3,547 3,546 1,204 29,188 12.2 88.7 LT Combination census/sampling 2,246 2,189 2,175 7,590 28.8 99.4 HU Combination census/sampling 6,087 6,087 5,120 15,720 38.6 84.5 MT Census - - 1,047 - - 72.8 AT Combination census/sampling 5,409 5,351 3,172 15,968 33.5 59.3 PL Census - - 38,028 - - 74.0 PT Combination census/sampling 9,132 8,032 6,068 24,643 32.6 76.0 RO Combination census/sampling 10,469 8,963 8,625 26,979 86.0 82.4 SI Combination census/sampling 2,726 2,719 2,290 4,195 65.0 84.2 SK Combination census/sampling 3,310 3,310 2,363 7,813 - 81.0 FI Combination census/sampling 3,163 3,108 2,187 8,222 38.5 70.4 SE Combination census/sampling 5,431 5,422 4,552 16,765 32.0 83.8 UK Combination census/sampling 28,000 28,000 - 172,000 16.4 - IS Combination census/sampling 1,334 1,248 817 3,552 23.0 59.0 NO Combination census/sampling 6,852 6,773 6,541 18,616 37.0 96.6 RS Combination census/sampling - - 2,842 12,145 23.0 71.4
For the sampled enterprises most countries applied a stratified random sampling. The stratification of the sample was based on the economic activity of the enterprise (according to NACE Rev.2 classification), on the enterprise size and in some countries also on the geographical region (NUTS2 level). The number of strata used for each variable varies among the countries. Regarding the size class, there were in most cases three strata based on the number of employees in the enterprise.

5
Most of countries used the (statistical) national business register as sampling frame, as it was also indicated in the methodological guidelines. According to the national quality reports, the business registers were up-to-date and provided information on identification characteristics of the enterprise, its economic activity and the number of employees. Belgium, Germany, and Iceland used other registers for the selection of the enterprises. According to Belgium and Germany, these registers were also used in other enterprise surveys, had a very good coverage of the enterprises and provided all the necessary information. In both countries, they are considered statistically equivalent to the official business register. Iceland reported the use of a list of legal (business) units that the Icelandic tax authorities maintain for taxing purposes. Weights calculation method According to the methodological recommendations provided to the participating countries, the basic method for adjusting for different probabilities of selection used in the sampling process is to use the inverse of the sampling fraction i.e. using the number of enterprises or employees. This would be based on the figure Nh/nh where Nh is the total number of enterprises/employees in stratum h of the population and nh is the number of enterprises/employees in the realised sample in stratum h of the population, assuming that each unit in the stratum had the same inclusion probability. This will automatically adjust the sample weights of the respondents to compensate for unit non-response. If a non-response analysis is carried out (and the results indicate that there is a difference between respondents and non-respondents), then the results of the non-response analysis should also be used when calculating the final weighting factors. Generally, this process was followed by the countries. Moreover in some countries, the initial weights were re-adjusted following the results of the non-response analysis and the information from auxiliary variable (for instance, the turnover of the enterprise). The adjustment of weights was done in twelve countries using of a calibration method. Additionally, some features were reported by the countries regarding the weighting method: BE: the weights were computed separately for each region and in the Flemish Region they were re- adjusted according to the results of the non-response analysis, CZ: auxiliary information about the number of employees with social insurance, sales according to VAT declaration and number of enterprises was used in the weighting method, DE: simple weighting (variables relating to the number of enterprises) and bounded weighting (quantitative variables relating to turnover, expenditure or number or employees) were applied. Three different weights were used: population weights (relating to the number of enterprises), turnover weights (relating to total turnover) and employment weights (relating to the number of employees). Weights were also corrected for a potential bias in the response of innovators and non-innovators, using the results of a non-response survey, FR: an initial allocation estimated the proportion of innovative companies (in product or process) with the best possible accuracy and a second one aimed to maximize the number of innovative companies in the sample. The number of units to sample corresponded to the average between these two allocations, IT: calibration estimators were used, AT: the weights were re-adjusted according to the results of the non-response analysis, RO: two coefficients were produced, one for weighting the number of enterprises and another one for calibration based on turnover and the number of employees. For reducing non-response bias, at the estimation stage, some auxiliary information was also used, UK: three variables were used for weighting (in line with the sample stratification): region, division and business size, FI: ratio estimator based on turnover for expenditure data and other financial data,

6
NO: for quantitative variables (i.e. innovation expenditure) a linear model scaled by the total number of employees per strata was employed. The main data source used for the calculation of total figures in the population was the national business register: most countries used information on the number of enterprises, broken down by economic activity and size class from the national business register. Countries used various programmes for the estimation process of CIS data. The most commonly used were the software package CLAN, SAS programmes (usually self-developed), CALMAR, SPSS, R, STATA. Data collection and transmission CIS 2010 data were collected either through an electronic or a mail survey. In fact, the majority of countries offered both possibilities to the enterprises. Compared with 2008, more countries promoted the online or electronic questionnaire and gave the possibility, if the electronic questionnaire couldn’t be used, to send the questionnaire by mail. CIS was organised in this way in Estonia, Spain, France, Italy, Finland, Sweden and Norway. In many cases, the login and password of the electronic questionnaire were sent by post. Enterprises that wanted to reply electronically could fill in the electronic questionnaire available on the website or sent by email, reply through a web-based platform, specially developed for the CIS or national surveys or could also print the questionnaire and send the questionnaire back by mail or email. Only in Cyprus, the CIS data collection was made exclusively via face-to-face interviews at the enterprises’ premises. Finally, some countries also contacted the enterprises by telephone. This mode served at first as a reminder for replying to the survey and secondly as a follow-up to clarify non-responses and missing data. Table 3 gives an overview of the data collection methods used in CIS 2010. Table 3. CIS 2010 statistics, data collection methods
Data Collection Method Number of countries Countries Postal and electronic survey 18 BE, BG, CZ, DE, EE, ES, FR, HR, IT, LV, LT, HU, AT, PT, RO, FI, SE, NO Only postal survey 4 MT, SI, SK, UK (half of the responses collected by telephone interviews) Only electronic survey 2 IT, IS Face-to-Face interviews 1 CY
As regards the transmission of CIS data to Eurostat, all countries used the EDAMIS (electronic Data files Administration and Management Information System) application as recommended in the methodological guidelines except United Kingdom that sent the aggregated data by email.

7
Overall assessment of the national methodology In this section countries were asked to give an overall assessment of the quality of the CIS methodology. In general, positive opinions were given highlighting the constant improvement of the methodological aspects of the Community Innovation Survey. However, some weaknesses seem to remain, in particular in the quantification of the turnover from innovative products (question 2.3) and of the innovation expenditures (question 5.2) for which the concepts were not easily marked out. The main strengths and weaknesses of the CIS 2010 methodology, as reported by the countries in the national quality reports are summarised as follows with the number of countries sharing the same opinion (a count of at least 2 countries was needed to include the item): Highlighted strengths o High unit response rate (10) o Collection of regional data (availability and as improvement factor of the quality) (4) o Better knowledge and understanding of the questionnaire by the users (4) o Timeliness and punctuality (3) o Accuracy (inter alia because of census)(3) o Coherence with SBS data (3) o Electronic form of collecting data (convenient for respondents, economical form of collecting data, data control during fulfilling questionnaires) (3) o Electronic and manual data checking (3) o Higher quality of expenditures categories (2) o Relevance - no compulsory cells are missing (2) o Better comparability over time (2) o Eurostat checks were incorporated into the data checking program (2) o On-line manual and a phone line were made available for respondents (2) o In all necessary cases, enterprises were contacted to consult errors and missing variables (2)
Highlighted weaknesses o Quantification of the turnover from innovative products (question 2.3) because of the difficulty in highlighting these origins of the turnover (3) o Quantification of the innovation expenditures (question 5.2) in particular (e.g. difficulties in splitting R&D from other activities) (3)
o Low response rate (3) o Too long questionnaire for small enterprises (2) o No user satisfaction survey was undertaken (2) o “Innovation concept” as a whole, which makes it difficult for the enterprise to assess their own activities as innovative or not innovative (2) o R&D innovation expenditures maybe overestimated (2)
8
3 Quality assessment This chapter includes an overall assessment of the quality of the 2010 Community Innovation Survey (CIS 2010). It uses the six following dimensions of quality as defined in the Eurostat standard statistical quality framework: 1. Relevance: it is the degree to which statistics meet current and potential users’ needs. It includes the production of all needed statistics and the extent to which concepts used (definitions, classifications etc.) reflect user needs. 2. Accuracy: it denotes the closeness of computations or estimates to the exact or true values. 3. Timeliness and punctuality: they refer to time and dates, but in a different manner: the timeliness of statistics reflects the length of time between their availability and the event or phenomenon they describe. Punctuality refers to the time lag between the release date of the data and the target date on which they should have been delivered, with reference to dates announced in the official release calendar. 4. Accessibility and clarity: they refer to the simplicity and ease for users to access statistics using simple and user-friendly procedures, obtaining them in an expected form and within an acceptable time period, with the appropriate user information and assistance. 5. Comparability: it aims at measuring the impact of differences in applied statistical concepts and definitions on the comparison of statistics between geographical areas, non-geographical domains or over time. It is the extent to which differences between statistics are attributable to differences between the true values of the statistical characteristics. 6. Coherence: the extent to which statistics are in agreement with relevant or related statistics originating from different statistical procedures. 3.1 Relevance 3.1.1 User groups, user needs, user satisfaction The classification of users of innovation statistics represented by the following groups: 1. Institutions 2. Social actors (e.g. Employers’ associations, trade unions, lobbies etc.), 3. Media 4. Researchers and students 5. Enterprises or businesses conforms with the situation in each country. The main institutions at European level are DG ENTR, where data are used for the European Innovation Scoreboard, and Eurostat that uses CIS data for the compilation of EU aggregates and the dissemination of statistics to users. At international level, OECD uses CIS data for international comparisons and further analyses on innovation of enterprises. Users of CIS statistics are also various national Ministries and other (national or regional) government institutions that need CIS statistics for the monitoring of innovation strategies, the production of national indicators and reports and the further development in the field of innovation. Other users of CIS statistics are research institutes, researchers and students. Such users are interested in CIS data for analytical purposes, for research in science and innovation and its performance in enterprises and for studies in economics and other relevant topics. Enterprises are using CIS data as well for comparisons of innovation strategies and for market analyses, investment analyses (i.e. possibility to create subsidiaries).

9
Finally, media are also an important user of CIS statistics for the presentation of innovation activities to the general public. For CIS 2010, no countries reported formal user satisfaction survey. 3.1.2 Completeness The Commission Regulation N° 1450/2004, implementing Decision No 1608/2003/EC of the European Parliament and of the Council concerning the production and development of Community statistics on innovation (= Commission Regulation on innovation statistics), puts innovation statistics on a statutory basis and makes compulsory the delivery of certain variables. According to article 5 of the Commission Regulation 1450/2004, two types of data were to be transmitted to Eurostat. The first set of data refers to aggregated statistics that will be transmitted on a compulsory basis (additional cells can be filled on voluntary basis as well) while the second one refers to individual data records that could be transmitted on a voluntary basis. Eurostat has furthermore prepared detailed guidelines for the tabulation of the transmitted data (by detailing the derivations step-by-step based on the survey microdata). For the assessment of the completeness of national statistics the comparison has been done on the total number of compulsory cells which should be transmitted to Eurostat with the number of cells actually transmitted for the total number of cells that were transmitted with reference period 2008-2010. The breach of completeness took only place in the countries that have provided in their national quality report. Four countries reported missing compulsory cells due to the fact that no observations were available for these breakdowns (either because there is no firm in the population or because none of the surveyed firms answered the questionnaire) (Belgium, Malta, Finland and Norway). Moreover, Germany reported missing compulsory cells refer to NACE divisions 5 to 9 for which confidentiality restrictions apply. Missing Spanish NACE categories at 3 digit level (35.1 and 35.2) have not been provided because of the extraction has been carried out at 2 digit-level. In Lithuania, the sample included full sector H of the NACE 2 rev. but not in more detailed breakdowns. 3.1.3 Sampling errors Accuracy of statistics is the outcome of many factors which makes very difficult its quantification with precision. In this quality report an indirect assessment is done and information on sampling and non- sampling errors which affect CIS statistics is presented. i. The coefficients of variation (CV) for five key indicators as reported by countries which rely more on sampling are shown in Table 4. The coefficients of variation were quite large in few countries and for specific variables.

10
Table 4. CIS 2010 statistics, coefficients of variation for five key indicators
Countries
Percentage of innovating enterprises
Percentage of innovators that introduced new or improved products to the market Turnover of new or improved products, as a percentage of total turnover
Percentage of innovation active enterprises involved in innovation cooperation
Total turnover per employee BE CZ DE EE FR HR IT CY LV LT HU AT PL PT RO SI SK FI SE UK IS NO RS
2.0 2.3 1.0 2.1 0.8 2.6 1.2 1.1 6.1 6.9 2.4 2.3 0.5 0.7 1.7 5.7 5.0 1.8 1.7 1.5 0.4 0.6 2.5
4.3 4.2 0.4 3.3 1.8 5.2 3.1 0.8 10.4 15.1 5.9 3.7 0.7 2.1 4.9 0.9 8.9 2.7 3.0 3.0 1.7 0.6 6.0
16.2 2.3 1.4 11.9 - 3.7 4.3 2.3 13.4 - 0.5 11.3 1.5 2.6 5.6 1.6 4.4 5.1 4.7 - 6.9 0.1 6.6
4.0 4.7 2.4 5.2 2.3 5.4 5.9 0.8 10.8 11.8 5.2 2.9 0.7 2.5 5.1 3.2 10.5 3.5 3.6 4.7 2.9 0.3 6.1
10.5 1.9 5.5 3.6 0.1 2.5 1.9 1.8 7.0 3.4 1.3 5.7 0.8 11.9 0.3 2.2 2.0 5.9 3.9 - 1.3 - 3.3 Note: Figures have been rounded to one decimal digit. The coefficients of variation were calculated using the formula given in Annex 1 to this report. 3.1.4 Coverage errors Very few coverage errors were highlighted. This is often due to the fact that most countries used the official business register as sampling frame, which is considered up-to-date and of high quality. Any errors reported mainly arise from over-coverage due to the inclusion of out-of-scope units or units that do not longer exist in the frame population. As regards the effect of coverage errors in the CVs reported in Table 4, almost all countries did not incorporate these errors in the calculation of CVs. Exceptions were four countries, i.e. Czech Republic, Hungary, Romania and Slovakia.
11
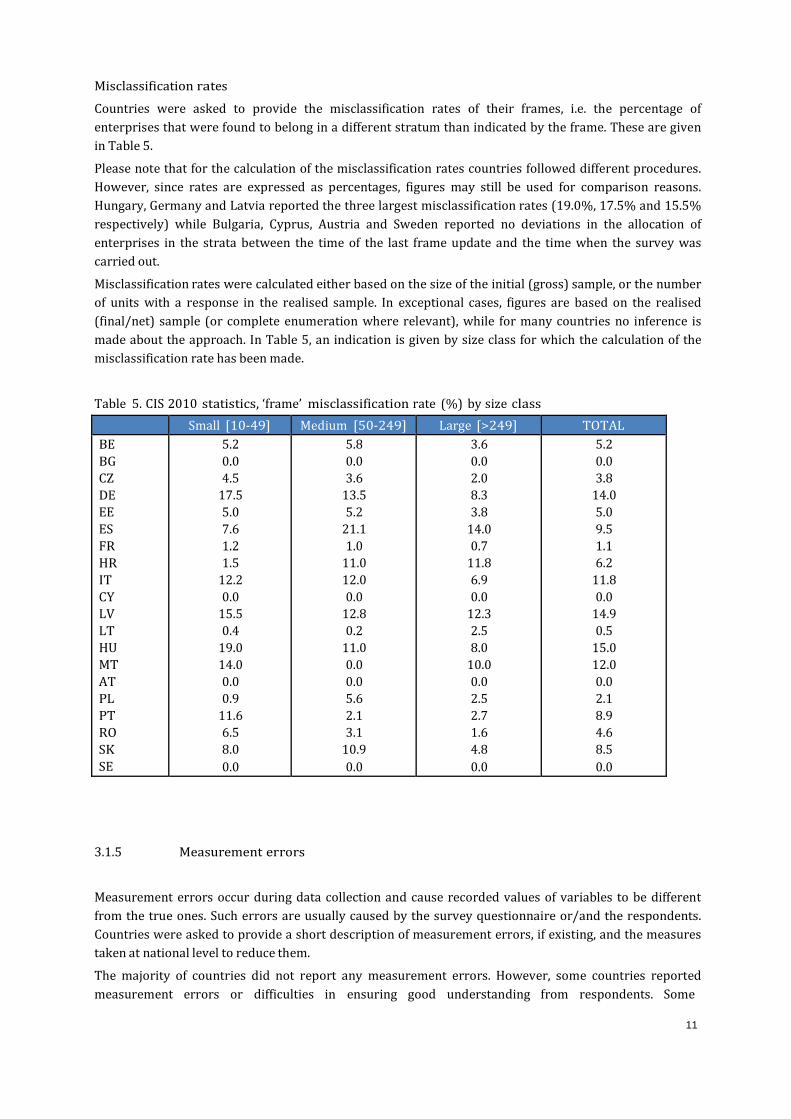
Misclassification rates Countries were asked to provide the misclassification rates of their frames, i.e. the percentage of enterprises that were found to belong in a different stratum than indicated by the frame. These are given in Table 5. Please note that for the calculation of the misclassification rates countries followed different procedures. However, since rates are expressed as percentages, figures may still be used for comparison reasons. Hungary, Germany and Latvia reported the three largest misclassification rates (19.0%, 17.5% and 15.5% respectively) while Bulgaria, Cyprus, Austria and Sweden reported no deviations in the allocation of enterprises in the strata between the time of the last frame update and the time when the survey was carried out. Misclassification rates were calculated either based on the size of the initial (gross) sample, or the number of units with a response in the realised sample. In exceptional cases, figures are based on the realised (final/net) sample (or complete enumeration where relevant), while for many countries no inference is made about the approach. In Table 5, an indication is given by size class for which the calculation of the misclassification rate has been made. Table 5. CIS 2010 statistics, ‘frame’ misclassification rate (%) by size class
Small [10-49] Medium [50-249] Large [>249] TOTAL BE BG CZ DE EE ES FR HR IT CY LV LT HU MT AT PL PT RO SK SE
5.2 0.0 4.5 17.5 5.0 7.6 1.2 1.5 12.2 0.0 15.5 0.4 19.0 14.0 0.0 0.9 11.6 6.5 8.0 0.0
5.8 0.0 3.6 13.5 5.2 21.1 1.0 11.0 12.0 0.0 12.8 0.2 11.0 0.0 0.0 5.6 2.1 3.1 10.9 0.0
3.6 0.0 2.0 8.3 3.8 14.0 0.7 11.8 6.9 0.0 12.3 2.5 8.0 10.0 0.0 2.5 2.7 1.6 4.8 0.0
5.2 0.0 3.8 14.0 5.0 9.5 1.1 6.2 11.8 0.0 14.9 0.5 15.0 12.0 0.0 2.1 8.9 4.6 8.5 0.0 3.1.5 Measurement errors Measurement errors occur during data collection and cause recorded values of variables to be different from the true ones. Such errors are usually caused by the survey questionnaire or/and the respondents. Countries were asked to provide a short description of measurement errors, if existing, and the measures taken at national level to reduce them. The majority of countries did not report any measurement errors. However, some countries reported measurement errors or difficulties in ensuring good understanding from respondents. Some

12
overestimations were suspected regarding R&D innovation activities and expenditures. Some variables imported sometimes from other sources (e.g. NACE code, turnover and number of employees) had to be corrected as well. Question about the turnover from new products (Q. 2.3) has also been highlighted as difficult to measure from the enterprises. All countries made significant efforts to minimise measurement errors. The measures undertaken to decrease issues in data reporting were the following ones: the most frequent method is the staff training (persons who were dedicated to the support for the respondents were prepared to provide help and explanations), information from other sources was also used to compare data and highlight inconsistencies, exhaustive methodological documentation was provided with the questionnaire, testing the questionnaire and electronic control of data was integrated in web questionnaire. 3.1.6 Processing errors Firstly, participating countries used mainly web survey. For those that collected results by another way, data keying, scanning for printed questionnaires, CAPI and face to face collection were used. Editing processes used by the countries consist mainly of checking the inconsistencies between variables and the completeness of questionnaires. Some countries compared figures obtained by another sources to confirm data. The inconsistencies were found out by logical controls, routine and mathematic checks. Some built-in controls were integrated as well in the electronic version of the questionnaire. Countries contacted the enterprises, mainly by phone, in order to request clarifications on the answers received and complete items that were left empty. 3.1.7 Non-response errors Non response occurs when a survey fails to collect data on all survey variables from all the population units designated for data collection in a sample or complete enumeration. Non-response errors may be reduced with the use of reminders/recalls to the enterprises. As recommended in the survey guidelines, most countries sent at least two or three paper reminders to non- responding enterprises. Additionally, these enterprises were either contacted by phone or e-mail in order to remind them to fill in and deliver the survey questionnaire. Figure 1 presents un-weighted and weighted unit response rates, defined as follows: Un-weighted Unit Response Rate= 100*(Number of units with a response) / (Total number of eligible and unknown eligibility units in the sample) Weighted Unit Response Rate = 100*(Weighted number of responding units) / (Weighted number of eligible and unknown eligibility units in the sample) The weighting is with the same weights used for estimation of population statistics with sample data. Therefore, the weighted response rate is an estimate of the proportion of population units which would respond, had a census been used. Figure 1 shows both rates for each country. If a census was used, the un-weighted rate and weighted rate are equivalent. It can be seen that Belgium and Germany have un-weighted response rates below 50%, while five countries have response rates above 90%.

13
Figure 1. CIS 2010 statistics, unit response rate (%)
Following Eurostat’s recommendations for the CIS 2010, a non-response survey should be performed when the (un-weighted) unit response rate is below 70%. Belgium, Germany, Austria, Italy and Iceland reported response rates below this threshold. A non-response survey was carried out to overcome the effect of the low response rate on the data collected. The non-response survey was performed for a stratified random sample of enterprises selected from the non-responding units of the full survey. The questions included in the non-response survey were similar to those specified in methodological recommendations (cf. annex 2 to this report). Belgium, Germany, Iceland and Austria used the results from the non-response survey in the adjustment of weighting factors for the share of innovative enterprises in the CIS 2010. In Belgium, this sample included only small and medium enterprises from the core NACE sectors. Austria chose a broad stratification: three industries2; wholesale trade; other services (NACE 49-71) and three size classes. Additionally two “mirror samples” were drawn which were structurally equal to the original non-response survey sample, but with different enterprises sampled in case the original enterprise would refuse to participate. In Germany, non-respondent enterprises were interviewed using computer-assisted telephone interview technique. The non-response sample ratio was 42 % of the total of non-respondent enterprises and the realised sample of enterprises interviewed in the non-response survey was 32% of the gross sample. The non-response analysis collected information on the size of the non-responding enterprises (number of
2 mining and quarrying; manufacturing; electricity, gas, steam and air conditioning supply; water supply, sewerage, waste management and remediation activities: NACE 05-39
14
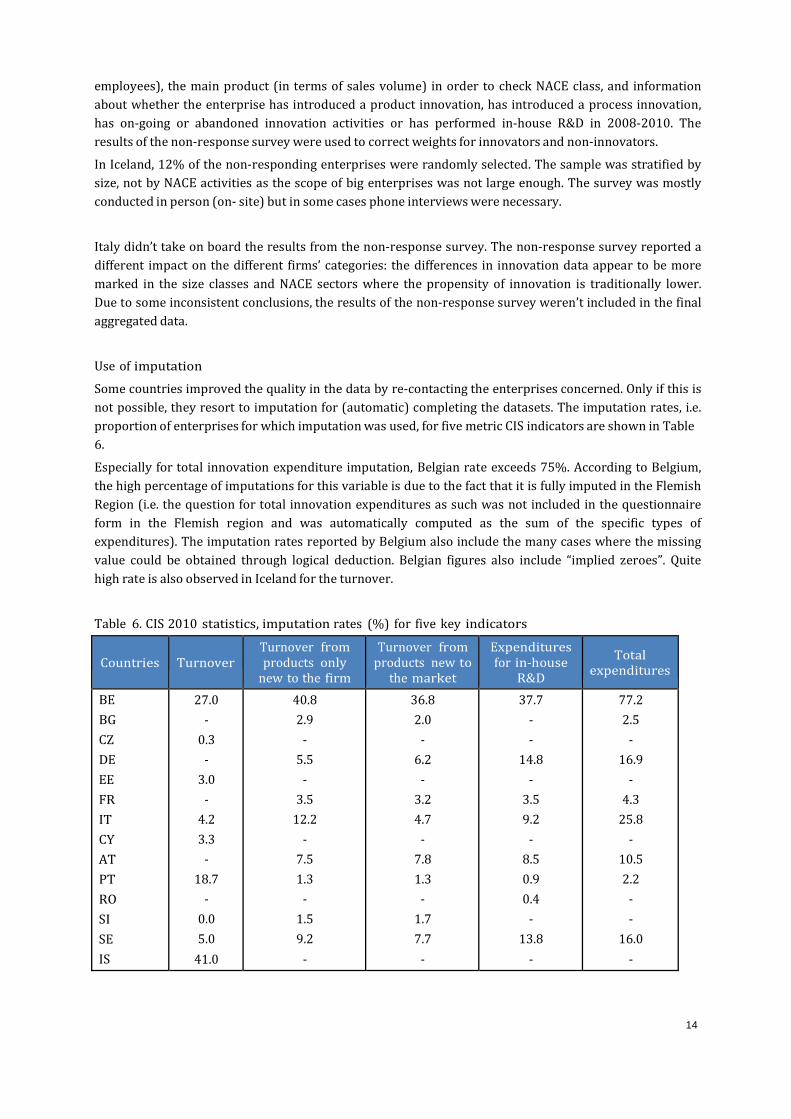
employees), the main product (in terms of sales volume) in order to check NACE class, and information about whether the enterprise has introduced a product innovation, has introduced a process innovation, has on-going or abandoned innovation activities or has performed in-house R&D in 2008-2010. The results of the non-response survey were used to correct weights for innovators and non-innovators. In Iceland, 12% of the non-responding enterprises were randomly selected. The sample was stratified by size, not by NACE activities as the scope of big enterprises was not large enough. The survey was mostly conducted in person (on- site) but in some cases phone interviews were necessary. Italy didn’t take on board the results from the non-response survey. The non-response survey reported a different impact on the different firms’ categories: the differences in innovation data appear to be more marked in the size classes and NACE sectors where the propensity of innovation is traditionally lower. Due to some inconsistent conclusions, the results of the non-response survey weren’t included in the final aggregated data. Use of imputation Some countries improved the quality in the data by re-contacting the enterprises concerned. Only if this is not possible, they resort to imputation for (automatic) completing the datasets. The imputation rates, i.e. proportion of enterprises for which imputation was used, for five metric CIS indicators are shown in Table 6. Especially for total innovation expenditure imputation, Belgian rate exceeds 75%. According to Belgium, the high percentage of imputations for this variable is due to the fact that it is fully imputed in the Flemish Region (i.e. the question for total innovation expenditures as such was not included in the questionnaire form in the Flemish region and was automatically computed as the sum of the specific types of expenditures). The imputation rates reported by Belgium also include the many cases where the missing value could be obtained through logical deduction. Belgian figures also include “implied zeroes”. Quite high rate is also observed in Iceland for the turnover. Table 6. CIS 2010 statistics, imputation rates (%) for five key indicators
Countries Turnover Turnover from products only new to the firm Turnover from products new to the market Expenditures for in-house R&D Total expenditures BE BG CZ DE EE FR IT CY AT PT RO SI SE IS
27.0 - 0.3 - 3.0 - 4.2 3.3 - 18.7 - 0.0 5.0 41.0
40.8 2.9 - 5.5 - 3.5 12.2 - 7.5 1.3 - 1.5 9.2 -
36.8 2.0 - 6.2 - 3.2 4.7 - 7.8 1.3 - 1.7 7.7 -
37.7 - - 14.8 - 3.5 9.2 - 8.5 0.9 0.4 - 13.8 -
77.2 2.5 - 16.9 - 4.3 25.8 - 10.5 2.2 - - 16.0 -

15
3.1.8 Comparison with CIS 2008 In this section a comparison of the CIS 2010 is made with the previous data collection, CIS 2008, in terms of response rate. The following assessment covers the countries that have participated both in CIS 2008 and CIS 2010 data collection and have also delivered their quality reports. Figure 2 presents the un-weighted response rates in the CIS 2008 and CIS 2010. In most of the countries there are slight differences between the response rate in CIS 2008 and in CIS 2010. Amongst 20 countries for which the data can be compared, Bulgaria and Czech Republic improved considerably their response rate (more than 5 points of percentage). In parallel, it decreased substantially (more than 5 point of percentage) in three countries: Austria, Portugal and Romania. Belgium did not report un-weighted response rate for the country as a whole regarding CIS 2008 but reported the figure separately for each region. Figure 2. CIS 2010 and CIS 2008 statistics, response rates (%) in CIS 2008 and CIS 2010
16
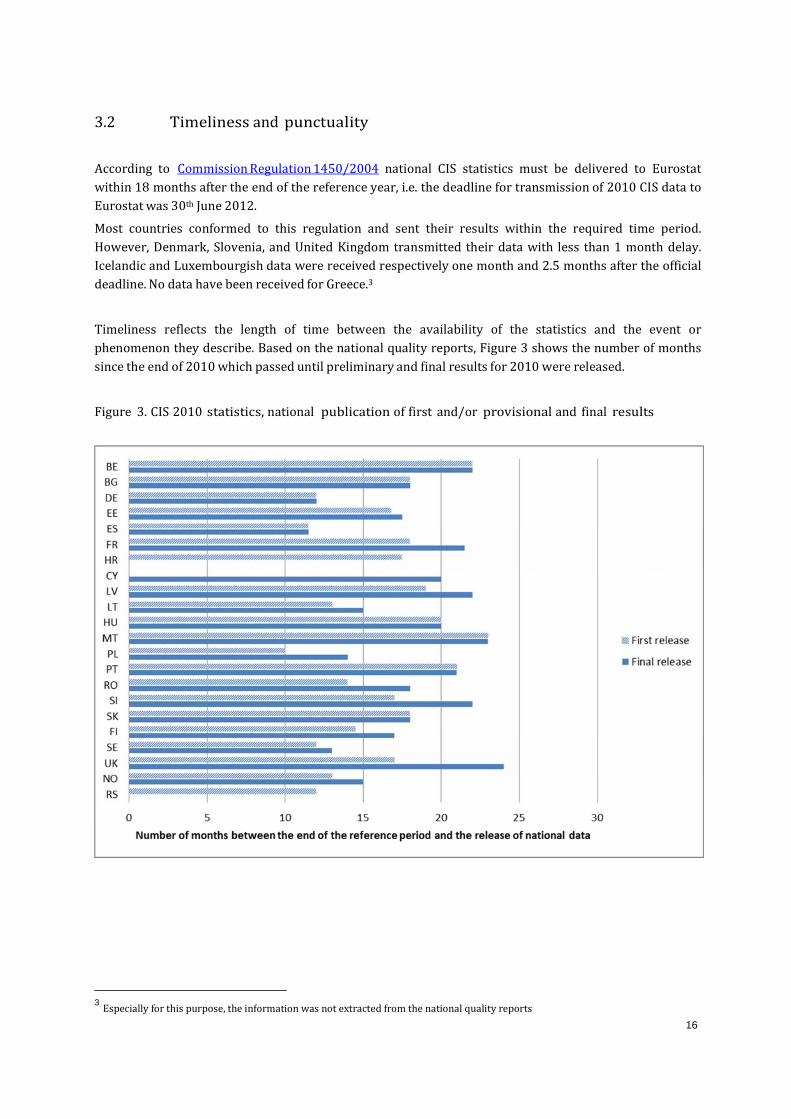
3.2 Timeliness and punctuality According to Commission Regulation 1450/2004 national CIS statistics must be delivered to Eurostat within 18 months after the end of the reference year, i.e. the deadline for transmission of 2010 CIS data to Eurostat was 30th June 2012. Most countries conformed to this regulation and sent their results within the required time period. However, Denmark, Slovenia, and United Kingdom transmitted their data with less than 1 month delay. Icelandic and Luxembourgish data were received respectively one month and 2.5 months after the official deadline. No data have been received for Greece.3 Timeliness reflects the length of time between the availability of the statistics and the event or phenomenon they describe. Based on the national quality reports, Figure 3 shows the number of months since the end of 2010 which passed until preliminary and final results for 2010 were released. Figure 3. CIS 2010 statistics, national publication of first and/or provisional and final results
3 Especially for this purpose, the information was not extracted from the national quality reports

17
3.3 Accessibility and clarity Accessibility is evaluated through the different means used by the countries for the dissemination of the CIS statistics to users. Table 7 shows the available means in the CIS 2010, the level of access (free/paid) and the countries that provided each mean of dissemination. The majority of countries published the CIS results on their website. In addition, more than half of the countries published a press release with the main results and indicators and various paper publications. An on-line database of all or part of the survey data is also available to users. According to the national quality reports, five countries reported dissemination of CIS microdata. Table 7. CIS 2010 statistics, means of CIS 2010 dissemination
Level of access Number of countries Countries Paper publication Free of charge 6 BE, HR, IT, LT, SK (internal staff), RS Paid 7 CY, CZ, LV, HU, AT, RO, SK, NO Online version free 10 BE, DE, EE, FR, CY, AT, RO, SE, UK, NO On-line database Free of charge 16 BE, DE, EE, ES, FR, IT, LV, LT, HU, PL, RO, SI, SK, FI, SE, UK, NO Website Free of charge 22 BE, BG, CZ, DE, EE, ES, FR, HR, IT, CY, LT, HU, AT, PL, PT, RO, SI, SK, FI, SE, UK, NO, RS CD-ROM Free of charge 1 RO Paid 2 CZ, ES, AT Press release Free of charge 12 BG, CZ, DE, EE, ES, IT, CY, LT, MT, AT, RO, SE, NO Micro-data/ Anonymised micro-data (for research)
Free of charge 3 DE, IT, UK Paid 2 CZ, NO Data are usually accompanied by comprehensive methodological notes that provide information on the scope of the survey, the related concepts and definitions and the data collection method. In addition, many countries provided also guidelines to users for the interpretation of the indicators published. The feedback received from users on the clarity of CIS statistics is considered positive. 3.4 Comparability In this section, the assessment on the comparability of national CIS 2010 statistics has been made. There is a split into two sections, i.e. deviations from methodological recommendations and comparability over time, in line with the template of the quality reports. 3.4.1 Methodological deviations In order to ensure comparability across countries, Eurostat, in close cooperation with the countries, has developed a standard core questionnaire along with an accompanying set of definitions and methodological recommendations. The concepts and underlying methodology of the CIS are also based on the Oslo Manual (third edition of 2005). A harmonised questionnaire is thus made available for each wave.

18
Table 8 presents key concepts and the number of countries that adopt the recommendation. When the recommendation was not adopted the respective national practices are also presented. Deviation from the questionnaire Table 8. CIS 2010 statistics, deviations reported on the harmonised questionnaire Deviation s YES/NO from the recomme ndation
Nb. of coun tries Comments
Deviations from the harmonised CIS 2010 questionnaire NO 15 BG, CZ, HR, CY, LV, LT, HU, MT, AT, PT, RO, SI, SK, RS, PL (not significant) YES
10
BE: very slight deviation in the order of the questions: grouping of theGeneral information’ question (Q 1) with the ‘economic information’question (Q 11) in a ‘Module A: General information’ question. No realimpact on the results is assumed. DE: additional questions (not part of the harmonised questionnaire) andremoved questions from the harmonised questionnaire in the nationalversion (e.g. information sources, objectives of innovation activities,types of product and process innovation, module on creativity and skills).EE: few national questions were incorporated into the corequestionnaire; some additional categories were used (as CIS in Q 1.2). Noreal impact on the results is assumed. ES: Question on the largest market in terms of turnover (geographicvariable ‘LARMAR’) and on the novelty of product and processinnovations (Q 2.4 and Q 3.3) were not implemented in the Spanishquestionnaire. The old version of questions on product and processinnovations development (Q 2.2 & Q 3.2) was used. Question oninnovation activities (Q 5.1) was requested only for 2010 and not for thereference period 2008-2010. ‘Design’ was not requested separately andwas included in ‘Other’ (potential overestimation of this category hasbeen therefore expected). Additional expenditures categories (Q 5.2)were included (i.e. ‘Training’, ‘Market introduction of innovations’ and ‘Other preparations’ expenditures). Module on creativity and skills (Q 11)was not implemented. ISCED classes (Q 12.3) included level 6, 5A and 5Bto report employees with a university degree. FR: some optional questions were not introduced in the French questionnaire, particularly the questions: “Who developed your product/process innovations” or the basic economic information (turnover, number of employees) which were recovered through external sources. Some additional national questions in the French questionnaire were introduced. No real impact on the results is assumed IT: the “other” innovation expenditures (training, design, marketing, other innovation activities (cf. Q 5.1)) were asked. FI: the core questionnaire was in line with the model questionnaire(some voluntary questions, such as questions 1.2 and 3.3 and questionson objectives, were excluded). SE: following questions from the CORE were excluded: Q 3.3 (processinnovations new to your market), Q 5.3 (public financial support forinnovation activities), Q 6.1 (degree of importance of information sourceson innovation activities), Q 12 (turnover, employees, university degree)Additional question was asked: “How has the company financed itsinnovation activities in 2010?”.

19
Deviation s YES/NO from the recomme ndation Nb. of coun tries
Comments
UK: CIS did not include the cooperation filter but the impact was considered minimal. IS: some voluntary questions were omitted. NO: CIS 2010 was conducted combined with business enterprise R&Dsurvey. Minor alterations to the harmonised CIS 2010 questionnairewere carried out with the purpose of providing more accurate regionalinformation. Deviation in national data collection period and from the sampling frame See chapter 2 Deviation from the target population No deviation was reported regarding the coverage of the NACE sectors, the size classes and the statistical unit (some countries covered additional categories of NACE and size classes but all the countries have provided data corresponding to the recommendations). Survey methodology / sampling frame No deviation was reported Survey methodology / data collection and stratification of the sample See chapter 2 Survey methodology / sampling Regarding the sampling method, no particular fact was reported except for Germany (stratified sample with disproportional sampling according to the observed variation in key innovation indicators: innovation expenditure as a percentage of sales and share of innovative enterprises), Croatia (some strata with too small number of units in it) and Serbia (lists of enterprises that have received subventions from government have been included in the sample) Survey methodology / sample allocation Few countries reported information about the sample allocation method used (proportional or optimum). Amongst them: DE, HR and RS: proportional, NO: proportional, with a fixed minimum sample size per strata
20
LT: Optimum Unit response See chapter 3 Data processing Consistency, logical and quality checks have been performed by most of the participating countries. 3.4.2 Comparability over time Comparability over time, i.e. comparability between the statistics published by each country across the years is also important. Table 9 presents the percentage relative differences compares key variables for aggregated CIS 2010 data with CIS 2008 data for five key indicators. Explanations or arguments have been provided by some countries: Germany reported that the share of enterprises with co-operation arrangements increased compared to CIS 2008. It is assumed that this observation is in line with a general trend of an increase used of “open innovation models” by enterprises. Secondly, total innovation expenditure declined considerably in 2009 owing to the economic and financial crisis and did not fully recover in 2010. For this reason, expenditure figures in 2010 are below those in 2008. Similarly, the share of turnover with all new products declined in 2009 because of a lower demand for innovative products. Share of turnover with new products increased in 2010 compared to 2009 but was still lower than in 2008. For the share of turnover with market novelties, no such crisis effect could be observed. In contrast, turnover share with new-to-the-market products remained stable in 2009 and increased in 2010. In Estonia, the economic crisis seems to have influenced differently enterprises’ behaviour. Large enterprises lowered innovation expenditure rate and small enterprises were most active to enter market with new products. United Kingdom reported that the seventh CIS was the first survey which collected the data using a sample based on the Standard Industrial Classification 2007 (SIC 2007) and that created a break in the times series (in addition to revised size-classes and refreshed rotating sample).

21
Table 9. CIS 2010 statistics, comparison between CIS 2010 and CIS 2008 data (relative difference)
Countries
Proportion of enterprises with innovation activity
Enterprises with co- operation arrangements
Total innovation expenditure as a % of total turnover for enterprises with innovation activity
Turnover from all new products as a % of total turnover, for enterprises with innovation activity
Turnover from new products new to the market as a % of total turnover, for enterprises with innovation activity BE BG CZ DE EE ES FR HR IT CY LV LT HU MT AT PL PT RO SK FI SE NO
95.5 135.3 108.3 101.0 101.0 107.3 102.1 105.2 99.3 121.5 114.1 87.9 97.1 79.0 99.5 122.0 95.7 123.0 102.4 92.9 90.0 113.8
111.8 74.0 96.3 85.0 85.0 88.2 117.4 103.5 133.8 81.0 84.4 107.7 95.6 86.0 74.1 118.0 163.6 72.7 72.5 92.7 105.0 128.6
114.2 267.7 121.0 106.0 75.0 94.2 - 136.6 88.6 102.2 294.8 67.8 135.6 149.0 107.6 100.0 99.1 236.0 98.4 96.6 115.0 95.9
87.9 159.4 94.7 112.0 114.0 84.7 104.0 119.7 74.3 104.3 193.3 164.4 122.1 279.0 104.5 119.0 101.6 100.8 64.6 101.5 124.0 78.9
95.0 170.6 107.9 90.0 97.0 87.5 230.6 101.5 69.8 27.6 282.0 220.7 115.3 430.0 117.5 99.0 116.6 94.4 59.2 74.1 137.0 56.7 3.5 Coherence 3.5.1 Coherence with Structural Business Statistics Table 10 below shows the relative differences in absolute terms between aggregated CIS 2010 data and SBS data from 2010 for the following five key variables. Information is displayed only for the countries that have provided this information. In addition, the definition of employment in CIS (number of employees) differs from the definition in SBS (persons employed). This difference may also affect the coherence between the two data collections.

22
Table 10. CIS 2010 statistics, comparison between SBS and CIS 2010 data (relative differences)
Countries
Proportion of total turnover in 2010
Proportion of total number of employees in 2010
Proportion of number of enterprise by NACE
Proportion of expenditure in intramural R&D
Proportion of total turnover in 2010 per employee
EE IT CY LV HU MT AT PL PT RO SK
96.0 89.8 111.5 69.3 94.2 102.1 97.9 89.0 83.2 100.0 94.4
100.0 92.0 110.0 96.1 100.9 89.0 98.4 100.0 96.8 102.2 93.2
100.0 99.6 114.7 104.7 96.0 89.3 102.6 75.0 106.7 100.0 129.6
75.0 - - - 121.7 - - 89.0 - - 83.6
96.0 97.6 101.4 - 93.4 114.7 99.6 89.0 86.0 97.9 101.2

23
4 Conclusions Countries were in line with the Regulation on innovation statistics in terms of coverage, methodological aspects and for most of them punctuality in the transmission of CIS 2010 data to Eurostat. Almost all the countries carried out CIS as a combination of sample survey and census using more extensively web forms in data collection. This alternative allows easy inclusion of logical checks regarding the data provided by the enterprises and therefore contributes to increased quality. The national business register is the main and the most often sampling frame used. Coverage errors are reduced because of the use of up-to-date and high-quality business registers by most of the countries. The main strength of CIS 2010 reported by the countries seems to be a higher response rate and the new collection of regional data for some of them. A better understanding of the questionnaire was also found to have been strengthened while some countries show still some difficulties in ensuring a good understanding and/or reporting regarding the categories of innovation expenditures and the questions related to the turnover from new products. All countries made significant efforts to minimise measurement errors, specifically staff training to provide an adequate and suitable support for the respondents. The unit response rates were below the threshold of 70 % in five countries in which a non-response survey was carried out. The results of the national surveys are mainly available in the website of national statistical institutions. CIS 2010 microdata can also be accessed for research use in some countries.

24
_
_
_
ANNEX 1: Coefficient of variation List of the coefficient required for the CIS 2010 quality reports: [1] = Coefficient of variation for the percentage of innovating enterprises. [2] = Coefficient of variation for the percentage of innovators that introduced new or improved products to the market. [3] = Coefficient of variation for the turnover of new or improved products, as a percentage of total turnover. [4] = Coefficient of variation for percentage of innovation active enterprises involved in innovation cooperation. [5] = Coefficient of variation for total turnover per employee.
Detailed formula: [1] = Coefficient of variation for the percentage of innovating enterprises.
CVinno
100 *
^
inno
_
Where P inno
Inno
i / InPdgdi 1 or
InPdsvi 1 or InPspdi 1 or InPs lgi 1 or InPssui 1 or Inabai 1 or Inongi 1 or Orgbupi 1
or
Orgwkpi 1 or Orgexri 1 or Mktdgpi 1 or Mktpdpi 1 or Mktpdli 1 or Mktprii 1
[2] = Coefficient of variation for the percentage of innovators that introduced new or improved products to the market.
CVnewmkt
^
100 * newmkt
Pnewmkt [3] = Coefficient of variation for the turnover of new or improved products, as a percentage of total turnover.
CVturnew
^
100 * turnew
Pturnew
(Turnmari Turnin i ) * Turnover 2010 i Where turnnew i
Turnover2010 i
i
[4] = Coefficient of variation for percentage of innovation active enterprises involved in innovation cooperation. ^
CVCo 100 * Co
PCo
[5] = Coefficient of variation for total turnover per employee.

25
^
CVturnemp
100 *
^
turnemp
_
x turnemp
Where turnemp i / Turn2010 / Emp2010
n _ 2
xi x
n
_ xi i 1
With = i 1 x = n 1 n
ANNEX 2: List of questions in case of non-response survey The purpose is to determine if the non-respondent is an innovator or not. 1. In the last three years, did your enterprise introduce any of the following types of innovations? Please answer yes or no. 1. New or significantly improved goods or services 2. New or significantly improved processes for producing or delivering goods or services. 3. New or significantly improved organisational methods. These involve changes to your enterprise’s business practices, organisation of work responsibilities, or external relations with other firms or public institutions. 2. At any time in the last three years, did your enterprise perform R&D to develop or improve goods, services, or processes? Yes/No [Only ask the next question if there are one or more positive responses to questions 1a, 1b, 1c, or 1d.] 3. In the last three years, did your enterprise acquire advanced machinery, equipment, or software to produce new or significantly improved goods or services or as part of new or improved processes? Yes/ No