community meeting - ncdot community – may 9, 2017 work sub-district s u r ry w e s t s u r r y c e...
TRANSCRIPT
Community MeetingPiedmont Geographic Community
May 9, 2017 | Guilford Technical Community College (Jamestown)
Piedmont Community – May 9, 2017
Photo Booth
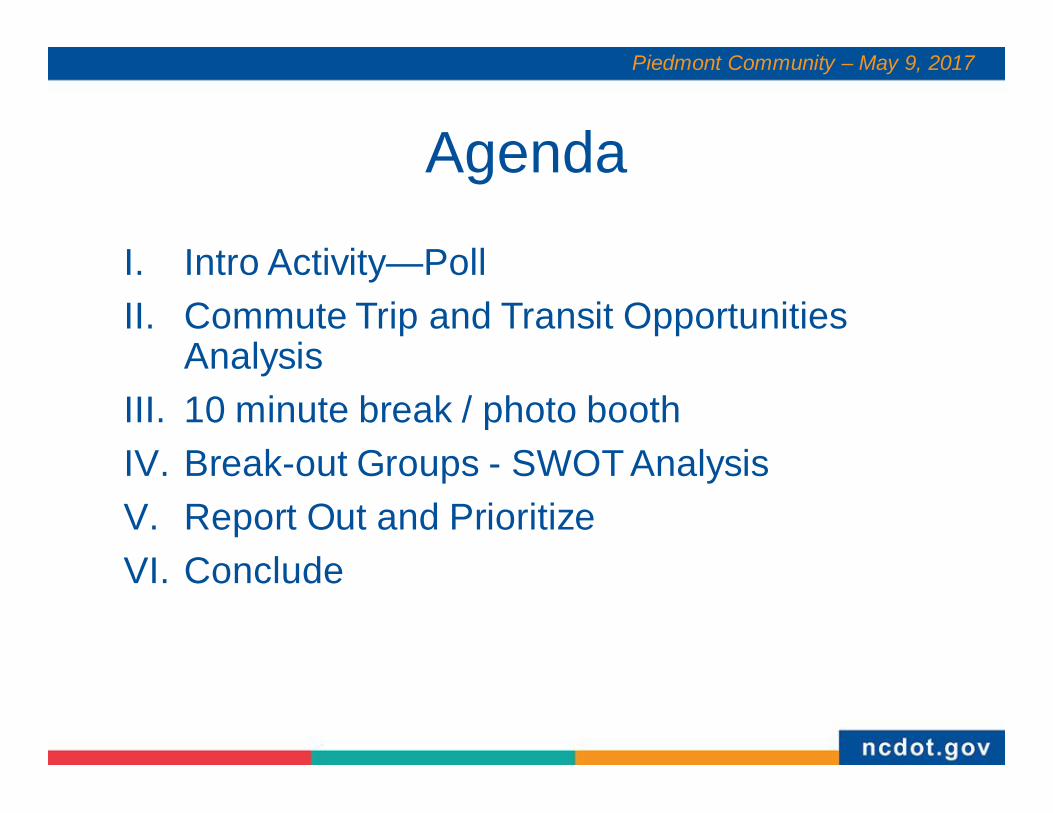
Agenda
I. Intro Activity—PollII. Commute Trip and Transit Opportunities
Analysis III. 10 minute break / photo boothIV. Break-out Groups - SWOT AnalysisV. Report Out and Prioritize VI. Conclude
Piedmont Community – May 9, 2017
Piedmont Community – May 9, 2017
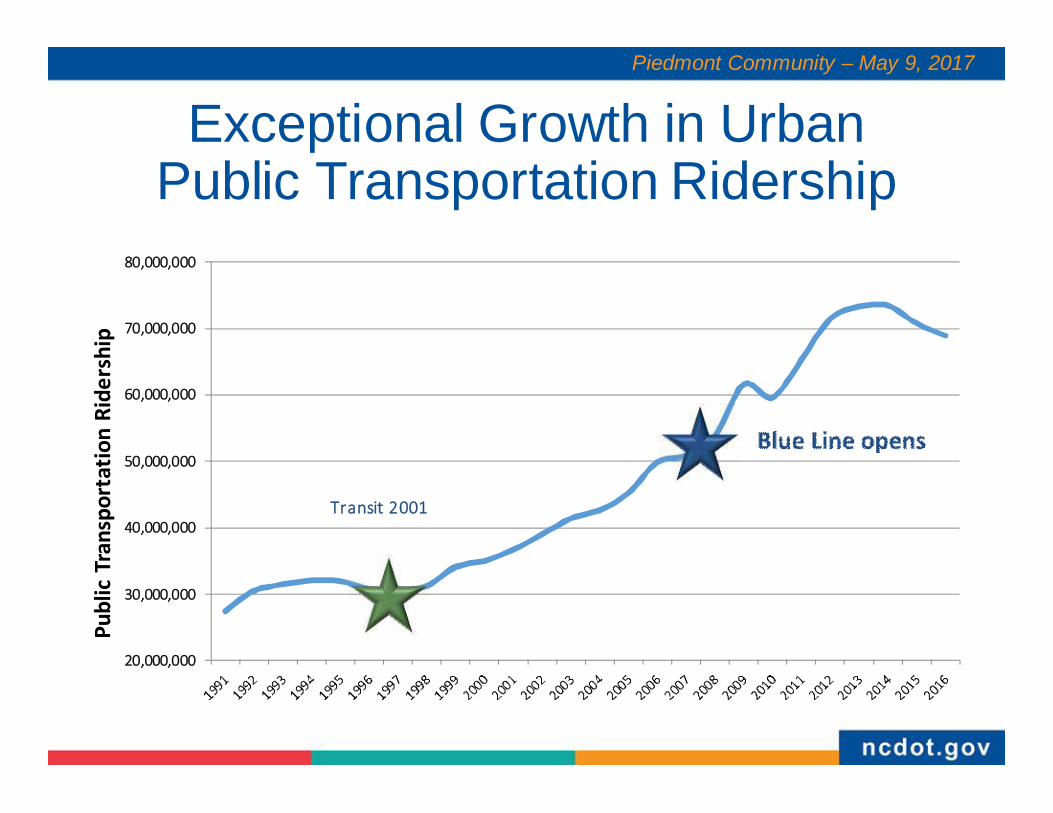
Exceptional Growth in Urban Public Transportation Ridership
Piedmont Community – May 9, 2017
20,000,000
30,000,000
40,000,000
50,000,000
60,000,000
70,000,000
80,000,000
Publ
ic T
rans
port
atio
n Ri
ders
hip
Transit 2001
Why Strategic Plan?
Piedmont Community – May 9, 2017
• Accountability• Direction• What can you do without a plan?
Everything has a plan. • Prepare for projected growth• Helps make an argument for needs• Changes mindset – history vs future • Gives voice to all / opportunity for
inclusion• Opportunity for innovation • Evolving technology• Support other planning efforts • Define success• Identify funding/target to needs;
“Blueprint” for infrastructure investment• Partners – common terminology, move
forward together
Piedmont Community – May 9, 2017

https://www.ncdot.gov/nctransit/strategicplan/
Debbie Collins, Director Jim RitcheyPublic Transportation Division [email protected] [email protected] 707 4684 404 433 1379
Poll Everywhere
What phrase would you use to illustrate your vision for the future of North Carolina Public Transportation
Piedmont Community – May 9, 2017
Meeting Purpose
• Provide a forum for discussing your ideas and concerns (specific to different geographic areas)
• Discuss a vision and goals for the future of public transportation in North Carolina
• Get a clearer understanding of the current transit situation (overall service, partnerships, etc.)
• Identify strengths and challenges• Identify opportunities/threats
• Identify your priorities
Piedmont Community – May 9, 2017
By the end of the meeting we will have…
• Identified the challenges and opportunities for North Carolina’s public transportation systems
• Discussed vision and goals for the future of public transportation in North Carolina
• Considered priorities for the future of transit in North Carolina
Piedmont Community – May 9, 2017
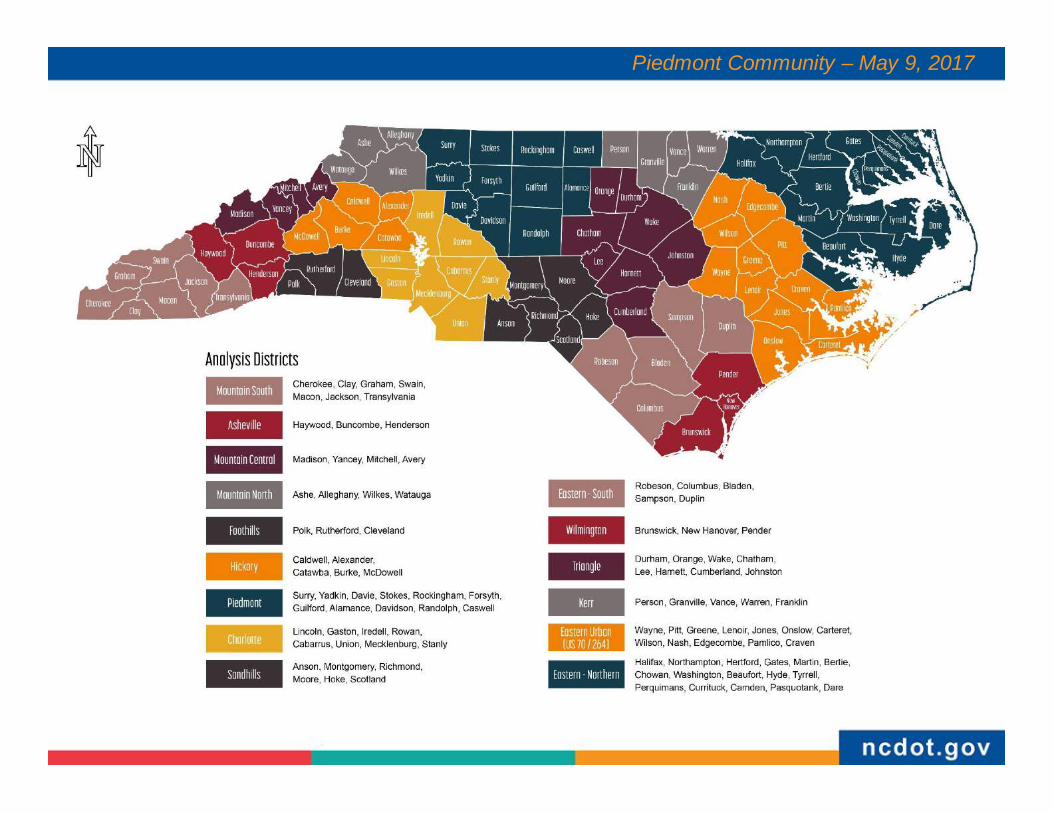
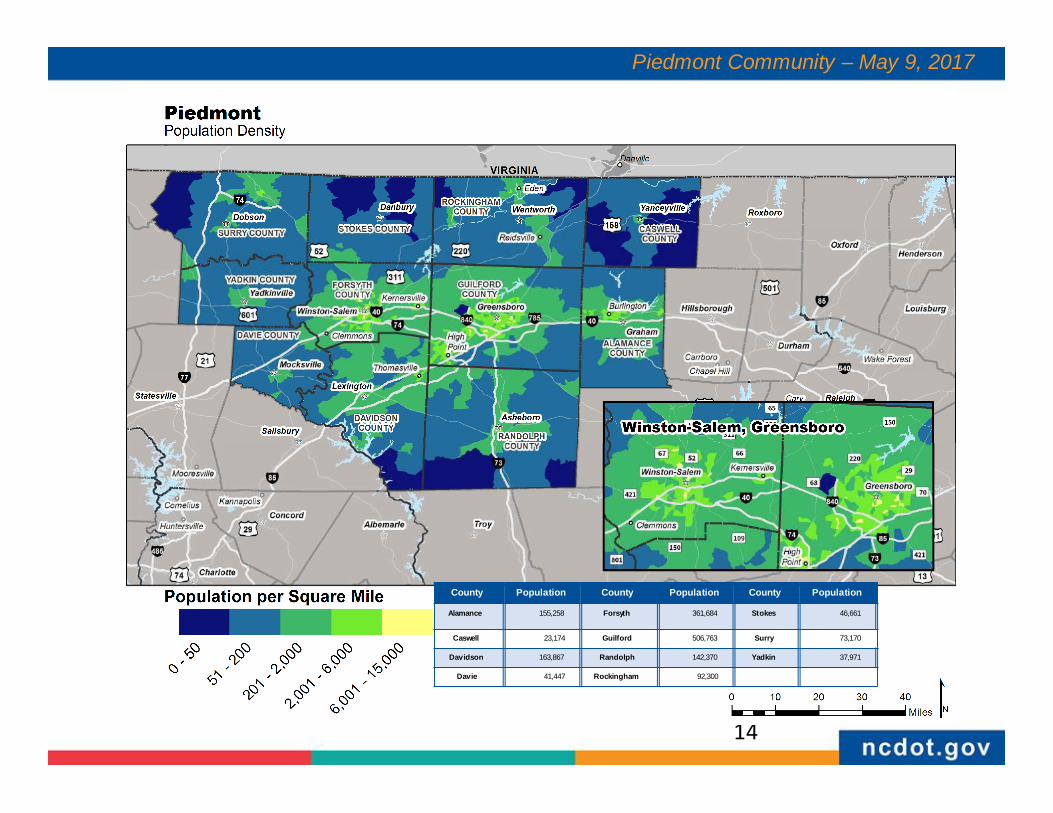
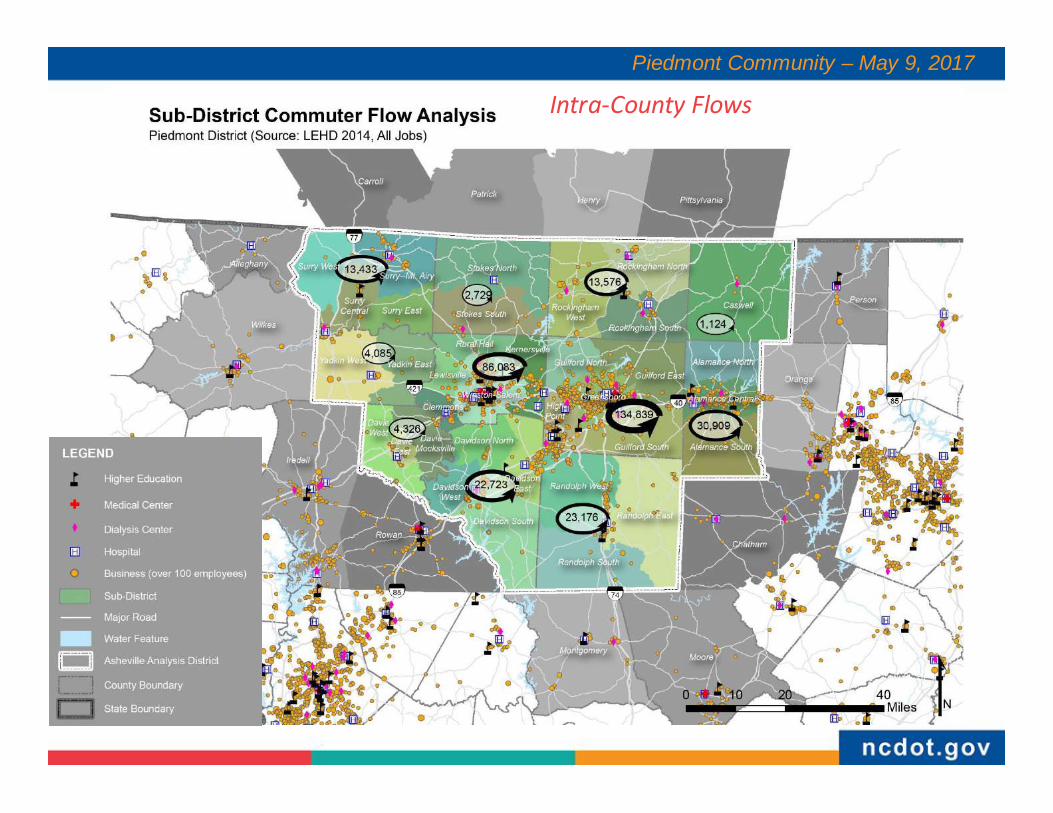
Transit Markets Analysis• 15 analysis districts for commuting patterns and
opportunity analysis• Work trips are usually the largest trip purpose for
most fixed route transit services • The U.S. Census Longitudinal Employer–
Household Dynamics (LEHD) data set can be used to estimate commuting patterns
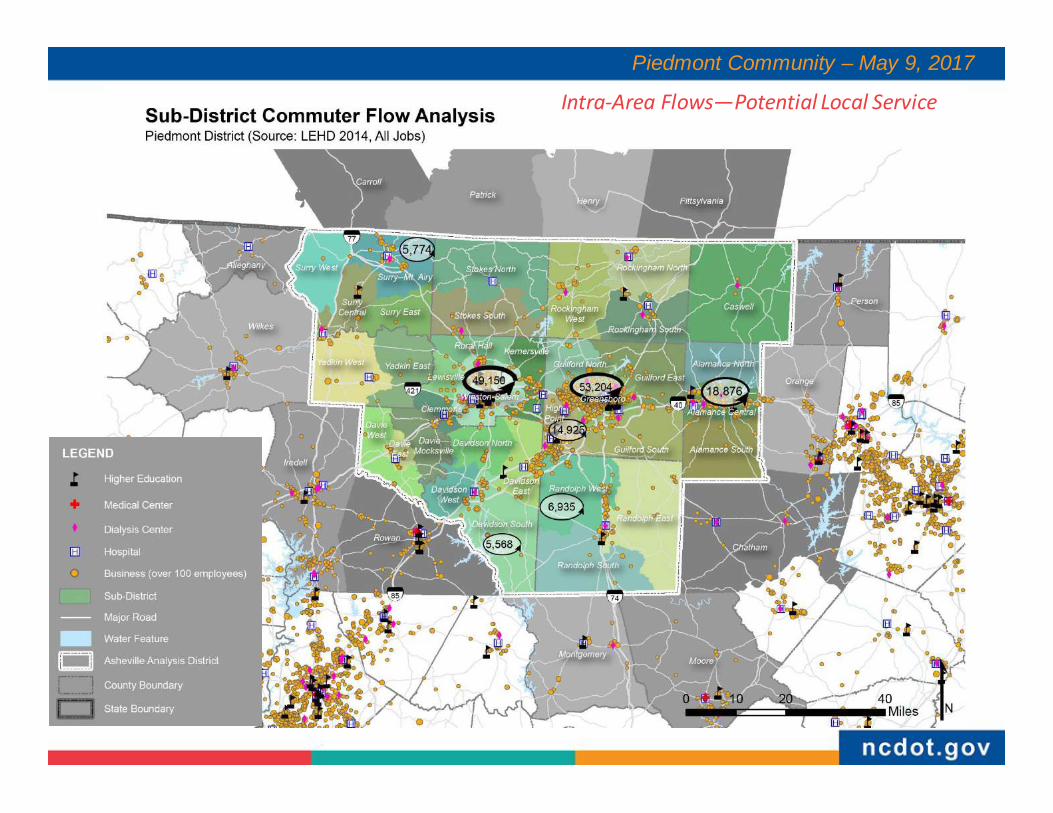
• High commuting flows within a district may indicate the need for local bus service
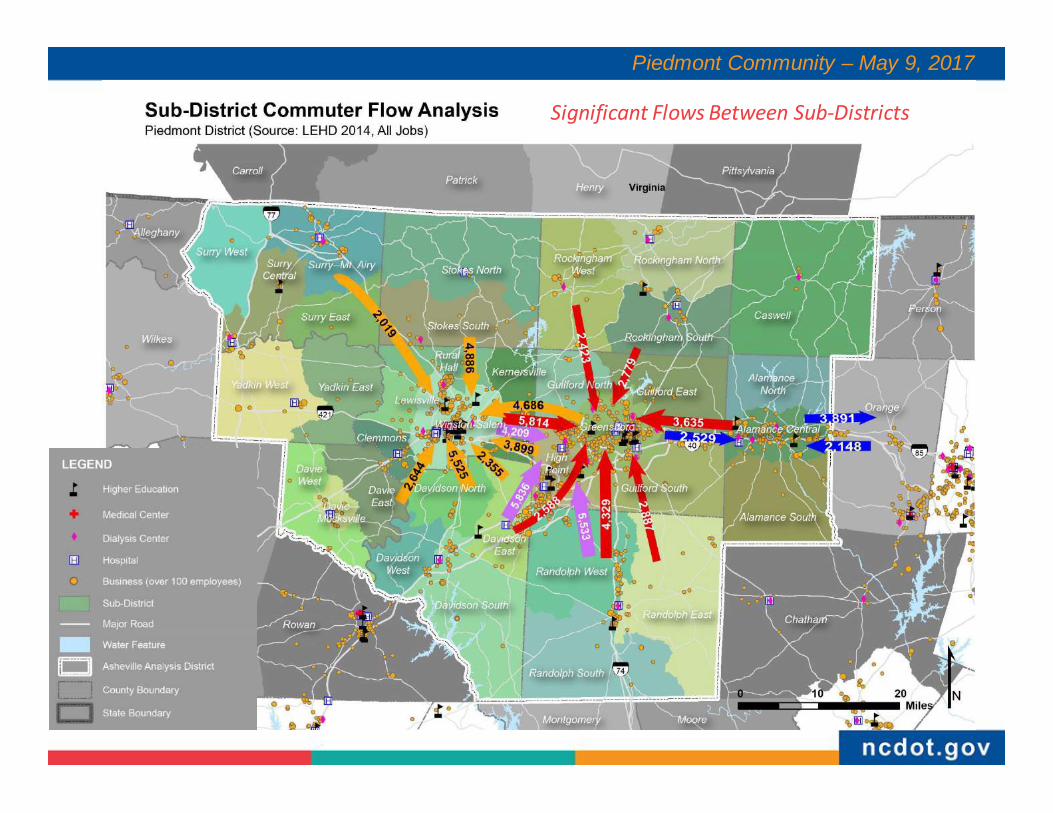
• High commuting flows between districts demonstrates the longer distance transit market
Piedmont Community – May 9, 2017
12
Piedmont Community – May 9, 2017
14
Piedmont Community – May 9, 2017
County Population County Population County Population
Alamance 155,258 Forsyth 361,684 Stokes 46,661
Caswell 23,174 Guilford 506,763 Surry 73,170
Davidson 163,867 Randolph 142,370 Yadkin 37,971
Davie 41,447 Rockingham 92,300

Piedmont Community – May 9, 2017
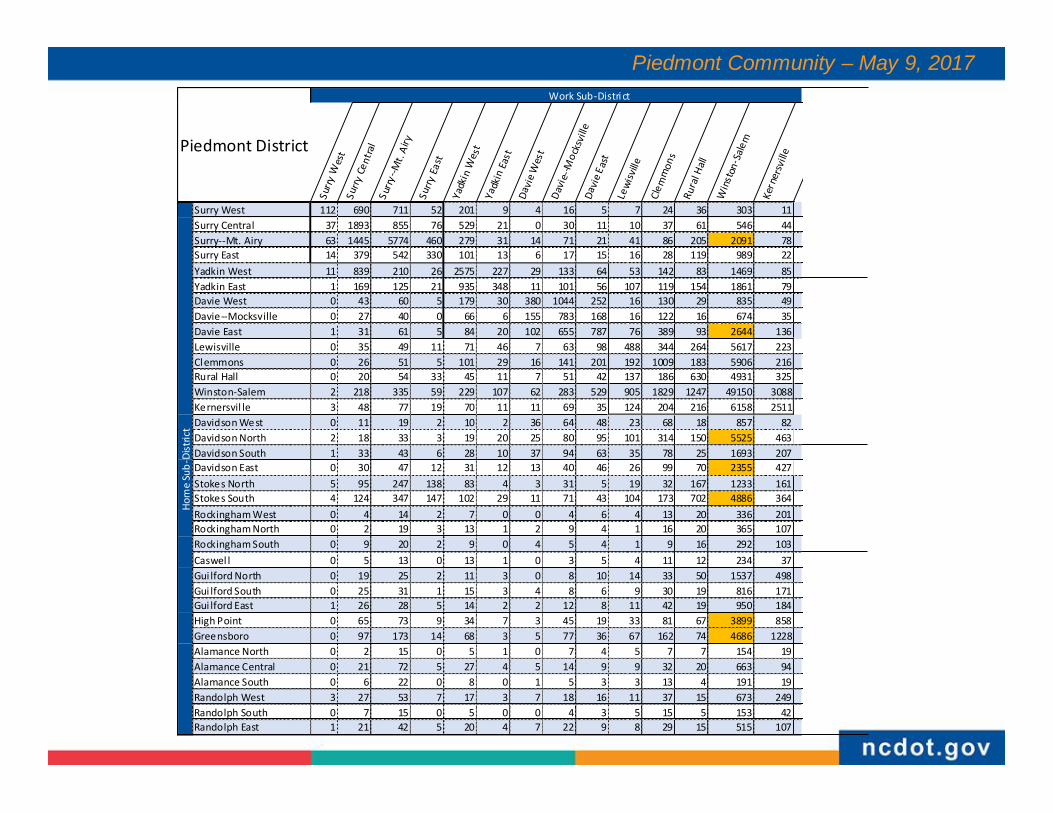
Intra-County Flows
Piedmont Community – May 9, 2017Work Sub-Distri ct
Surry
Wes
tSu
rry Ce
ntra
lS u
rry- -M
t. Ai
rySu
rry Ea
stYa
dki n
We s
tYa
dkin
East
Davi
e Wes
tDa
vie-
-Moc
ksvi
lleDa
vie E
ast
Lewi
sville
Clem
mon
sRu
ral H
allW
inst
on- S
alem
Kern
e rsv
illePiedmont District
Surry West 112 690 711 52 201 9 4 16 5 7 24 36 303 11Surry Central 37 1893 855 76 529 21 0 30 11 10 37 61 546 44Surry--Mt. Airy 63 1445 5774 460 279 31 14 71 21 41 86 205 2091 78Surry East 14 379 542 330 101 13 6 17 15 16 28 119 989 22Yadkin West 11 839 210 26 2575 227 29 133 64 53 142 83 1469 85Yadkin East 1 169 125 21 935 348 11 101 56 107 119 154 1861 79Davie West 0 43 60 5 179 30 380 1044 252 16 130 29 835 49Davie--Mocksville 0 27 40 0 66 6 155 783 168 16 122 16 674 35Davie East 1 31 61 5 84 20 102 655 787 76 389 93 2644 136Lewisville 0 35 49 11 71 46 7 63 98 488 344 264 5617 223Clemmons 0 26 51 5 101 29 16 141 201 192 1009 183 5906 216Rural Hall 0 20 54 33 45 11 7 51 42 137 186 630 4931 325Winston-Salem 2 218 335 59 229 107 62 283 529 905 1829 1247 49150 3088Kernersvil le 3 48 77 19 70 11 11 69 35 124 204 216 6158 2511Davidson West 0 11 19 2 10 2 36 64 48 23 68 18 857 82Davidson North 2 18 33 3 19 20 25 80 95 101 314 150 5525 463Davidson South 1 33 43 6 28 10 37 94 63 35 78 25 1693 207Davidson East 0 30 47 12 31 12 13 40 46 26 99 70 2355 427Stokes North 5 95 247 138 83 4 3 31 5 19 32 167 1233 161Stokes South 4 124 347 147 102 29 11 71 43 104 173 702 4886 364Rockingham West 0 4 14 2 7 0 0 4 6 4 13 20 336 201Rockingham North 0 2 19 3 13 1 2 9 4 1 16 20 365 107Rockingham South 0 9 20 2 9 0 4 5 4 1 9 16 292 103Caswel l 0 5 13 0 13 1 0 3 5 4 11 12 234 37Gui lford North 0 19 25 2 11 3 0 8 10 14 33 50 1537 498Gui lford South 0 25 31 1 15 3 4 8 6 9 30 19 816 171Gui lford East 1 26 28 5 14 2 2 12 8 11 42 19 950 184High Point 0 65 73 9 34 7 3 45 19 33 81 67 3899 858Greensboro 0 97 173 14 68 3 5 77 36 67 162 74 4686 1228Alamance North 0 2 15 0 5 1 0 7 4 5 7 7 154 19Alamance Central 0 21 72 5 27 4 5 14 9 9 32 20 663 94Alamance South 0 6 22 0 8 0 1 5 3 3 13 4 191 19Randolph West 3 27 53 7 17 3 7 18 16 11 37 15 673 249Randolph South 0 7 15 0 5 0 0 4 3 5 15 5 153 42Randolph East 1 21 42 5 20 4 7 22 9 8 29 15 515 107
Hom
e Su
b-Di
stric
t
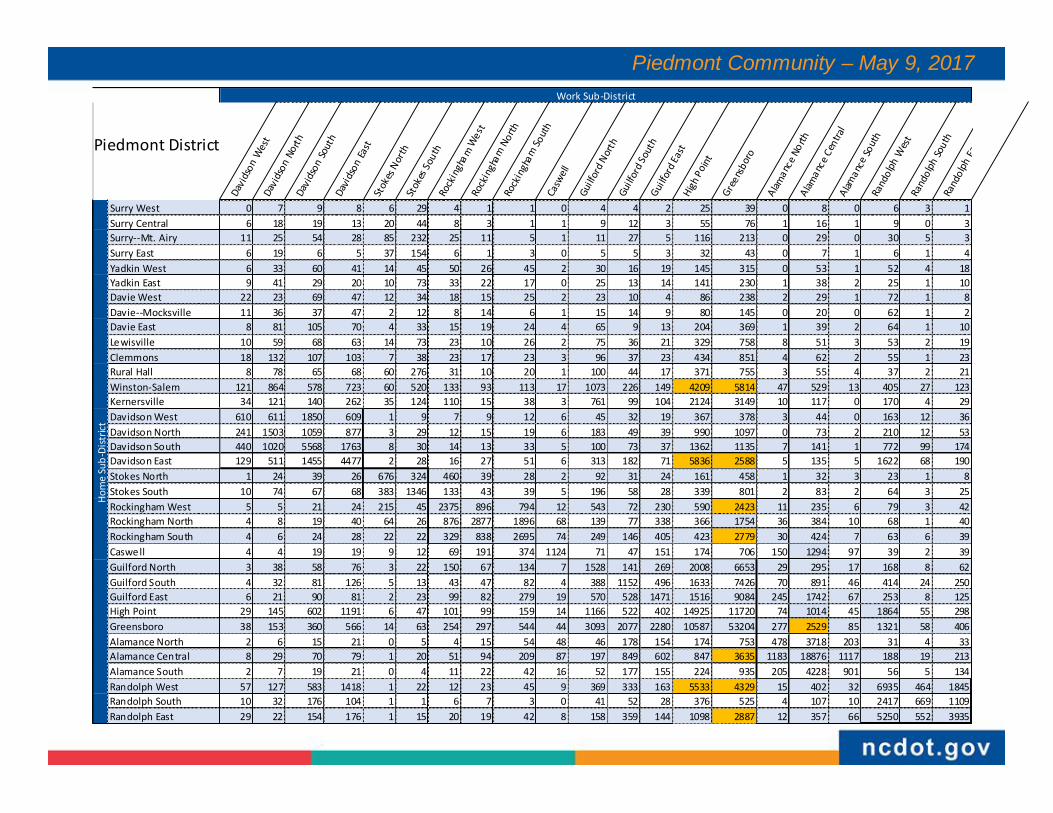
Piedmont Community – May 9, 2017Work Sub-District
Davi
dson
Wes
tDa
vids
on N
o rthDa
vids
on So
uth
Davi
dson
East
Stok
es N
orth
Stok
es So
uth
Rock
ingh
a m W
est
Rock
ingh
am N
orth
Rock
ingh
am So
uth
Casw
ellGu
i lfor
d Nor
thGu
i lfor
d Sou
thGui
lford
East
High P
o intGre
ensb
oro
A laman
ce N
o rthA lam
ance
Cen
tral
A laman
ce So
uth
Rand
olph
Wes
tRa
ndol
ph So
uth
Rand
olph
Eas
tPiedmont District
Surry West 0 7 9 8 6 29 4 1 1 0 4 4 2 25 39 0 8 0 6 3 1Surry Central 6 18 19 13 20 44 8 3 1 1 9 12 3 55 76 1 16 1 9 0 3Surry--Mt. Airy 11 25 54 28 85 232 25 11 5 1 11 27 5 116 213 0 29 0 30 5 3Surry East 6 19 6 5 37 154 6 1 3 0 5 5 3 32 43 0 7 1 6 1 4Yadkin West 6 33 60 41 14 45 50 26 45 2 30 16 19 145 315 0 53 1 52 4 18Yadkin East 9 41 29 20 10 73 33 22 17 0 25 13 14 141 230 1 38 2 25 1 10Davie West 22 23 69 47 12 34 18 15 25 2 23 10 4 86 238 2 29 1 72 1 8Davie--Mocksville 11 36 37 47 2 12 8 14 6 1 15 14 9 80 145 0 20 0 62 1 2Davie East 8 81 105 70 4 33 15 19 24 4 65 9 13 204 369 1 39 2 64 1 10Lewisville 10 59 68 63 14 73 23 10 26 2 75 36 21 329 758 8 51 3 53 2 19Clemmons 18 132 107 103 7 38 23 17 23 3 96 37 23 434 851 4 62 2 55 1 23Rural Hall 8 78 65 68 60 276 31 10 20 1 100 44 17 371 755 3 55 4 37 2 21Winston-Salem 121 864 578 723 60 520 133 93 113 17 1073 226 149 4209 5814 47 529 13 405 27 123Kernersville 34 121 140 262 35 124 110 15 38 3 761 99 104 2124 3149 10 117 0 170 4 29Davidson West 610 611 1850 609 1 9 7 9 12 6 45 32 19 367 378 3 44 0 163 12 36Davidson North 241 1503 1059 877 3 29 12 15 19 6 183 49 39 990 1097 0 73 2 210 12 53Davidson South 440 1020 5568 1763 8 30 14 13 33 5 100 73 37 1362 1135 7 141 1 772 99 174Davidson East 129 511 1455 4477 2 28 16 27 51 6 313 182 71 5836 2588 5 135 5 1622 68 190Stokes North 1 24 39 26 676 324 460 39 28 2 92 31 24 161 458 1 32 3 23 1 8Stokes South 10 74 67 68 383 1346 133 43 39 5 196 58 28 339 801 2 83 2 64 3 25Rockingham West 5 5 21 24 215 45 2375 896 794 12 543 72 230 590 2423 11 235 6 79 3 42Rockingham North 4 8 19 40 64 26 876 2877 1896 68 139 77 338 366 1754 36 384 10 68 1 40Rockingham South 4 6 24 28 22 22 329 838 2695 74 249 146 405 423 2779 30 424 7 63 6 39Caswell 4 4 19 19 9 12 69 191 374 1124 71 47 151 174 706 150 1294 97 39 2 39Guilford North 3 38 58 76 3 22 150 67 134 7 1528 141 269 2008 6653 29 295 17 168 8 62Guilford South 4 32 81 126 5 13 43 47 82 4 388 1152 496 1633 7426 70 891 46 414 24 250Guilford East 6 21 90 81 2 23 99 82 279 19 570 528 1471 1516 9084 245 1742 67 253 8 125High Point 29 145 602 1191 6 47 101 99 159 14 1166 522 402 14925 11720 74 1014 45 1864 55 298Greensboro 38 153 360 566 14 63 254 297 544 44 3093 2077 2280 10587 53204 277 2529 85 1321 58 406Alamance North 2 6 15 21 0 5 4 15 54 48 46 178 154 174 753 478 3718 203 31 4 33Alamance Central 8 29 70 79 1 20 51 94 209 87 197 849 602 847 3635 1183 18876 1117 188 19 213Alamance South 2 7 19 21 0 4 11 22 42 16 52 177 155 224 935 205 4228 901 56 5 134Randolph West 57 127 583 1418 1 22 12 23 45 9 369 333 163 5533 4329 15 402 32 6935 464 1845Randolph South 10 32 176 104 1 1 6 7 3 0 41 52 28 376 525 4 107 10 2417 669 1109Randolph East 29 22 154 176 1 15 20 19 42 8 158 359 144 1098 2887 12 357 66 5250 552 3935
Hom
e Su
b-Di
stric
t
Piedmont Community – May 9, 2017
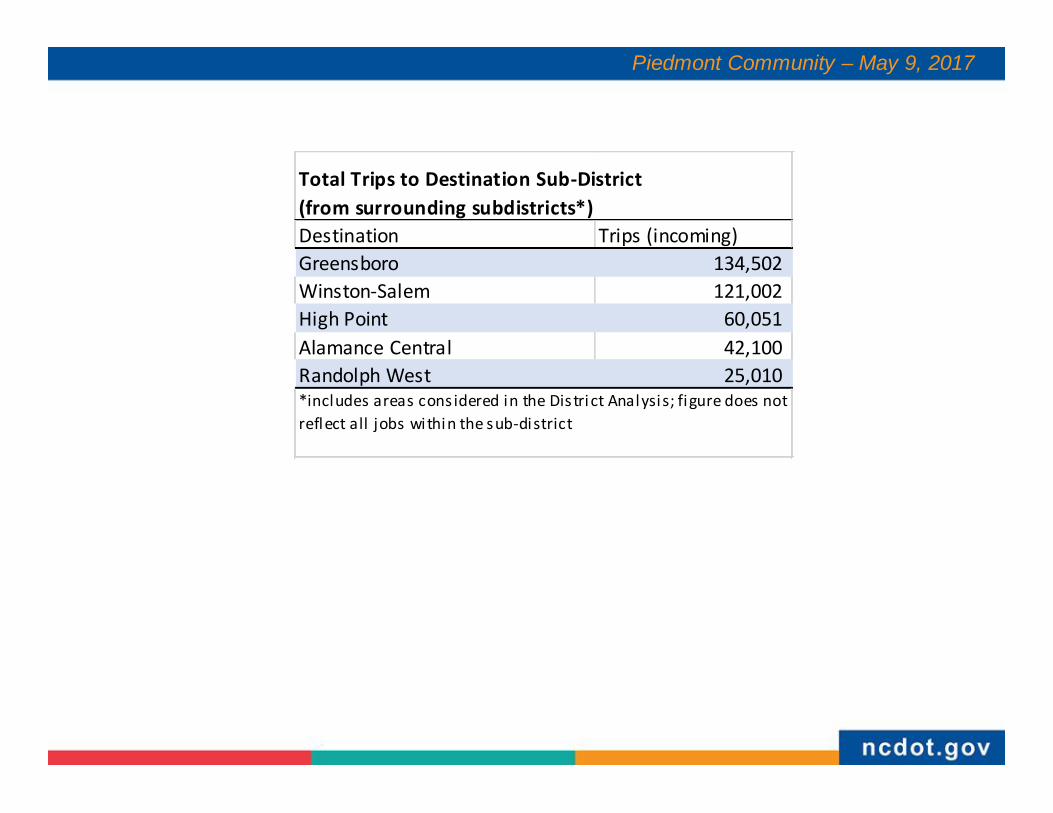
Destination Trips (incoming)Greensboro 134,502 Winston-Salem 121,002 High Point 60,051 Alamance Central 42,100 Randolph West 25,010
Total Trips to Destination Sub-District (from surrounding subdistricts*)
*includes areas cons idered in the Dis tri ct Analysis; figure does not reflect all jobs within the sub-district
Piedmont Community – May 9, 2017
Intra-County Flows
Piedmont Community – May 9, 2017
Intra-Area Flows—Potential Local Service
Piedmont Community – May 9, 2017
Significant Flows Between Sub-Districts
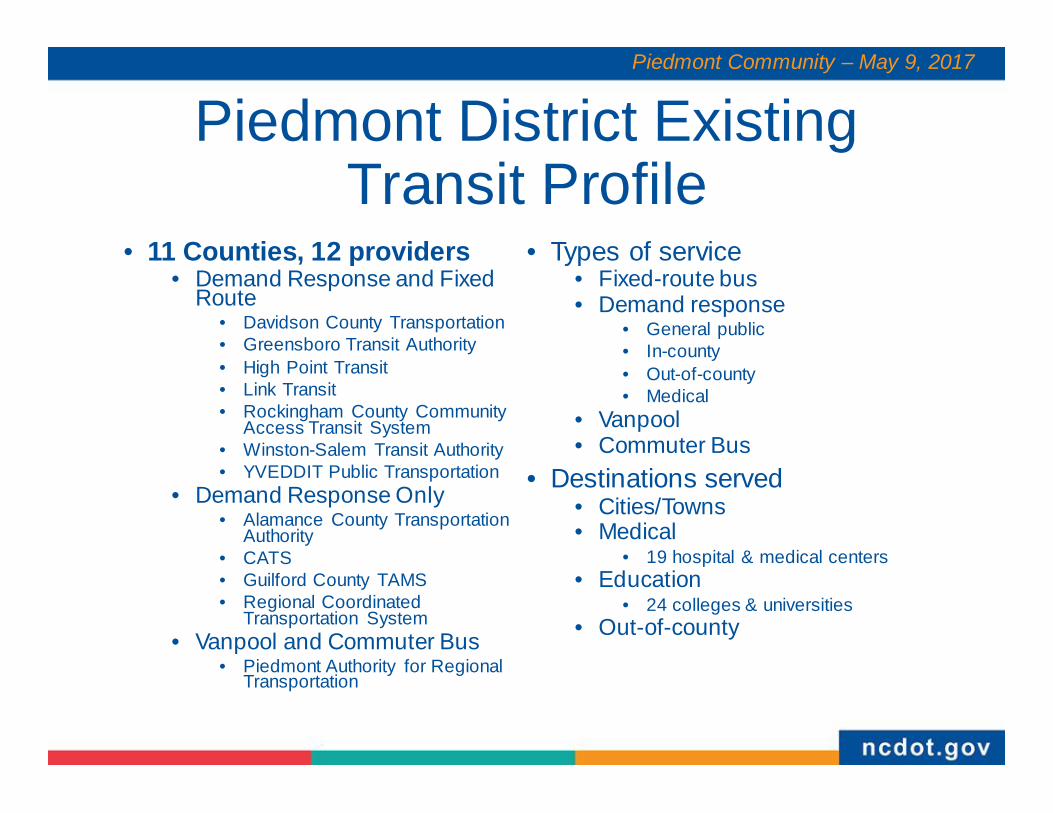
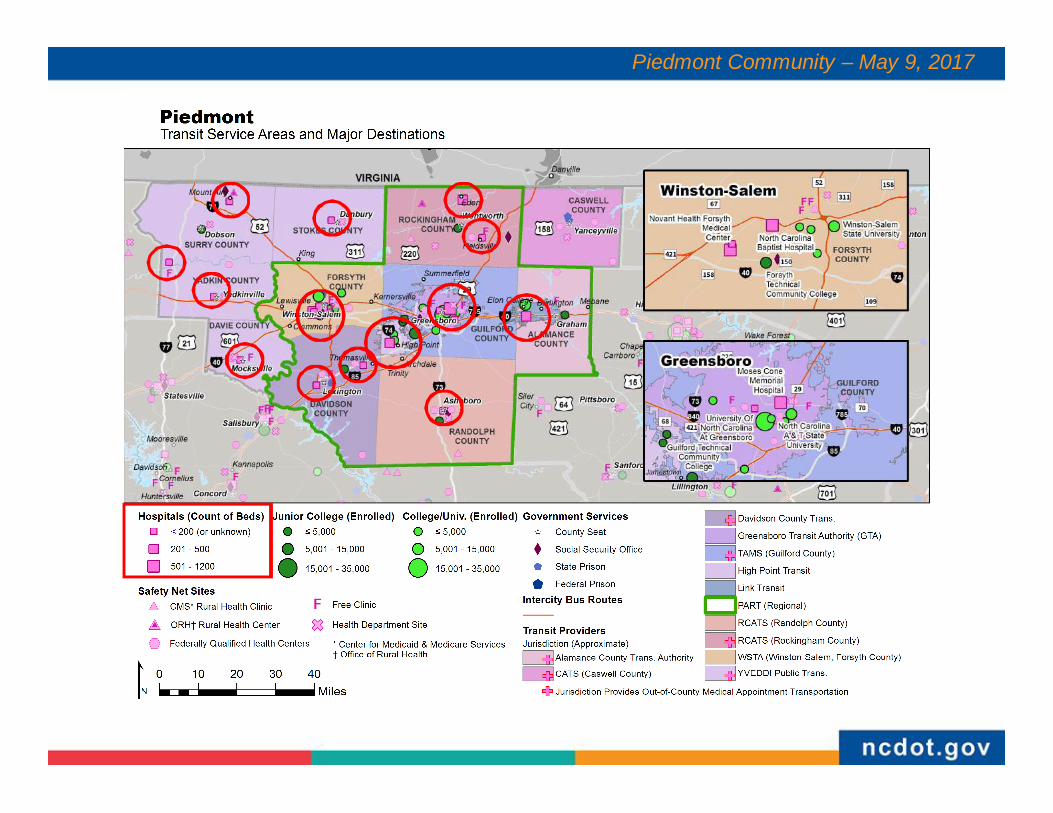
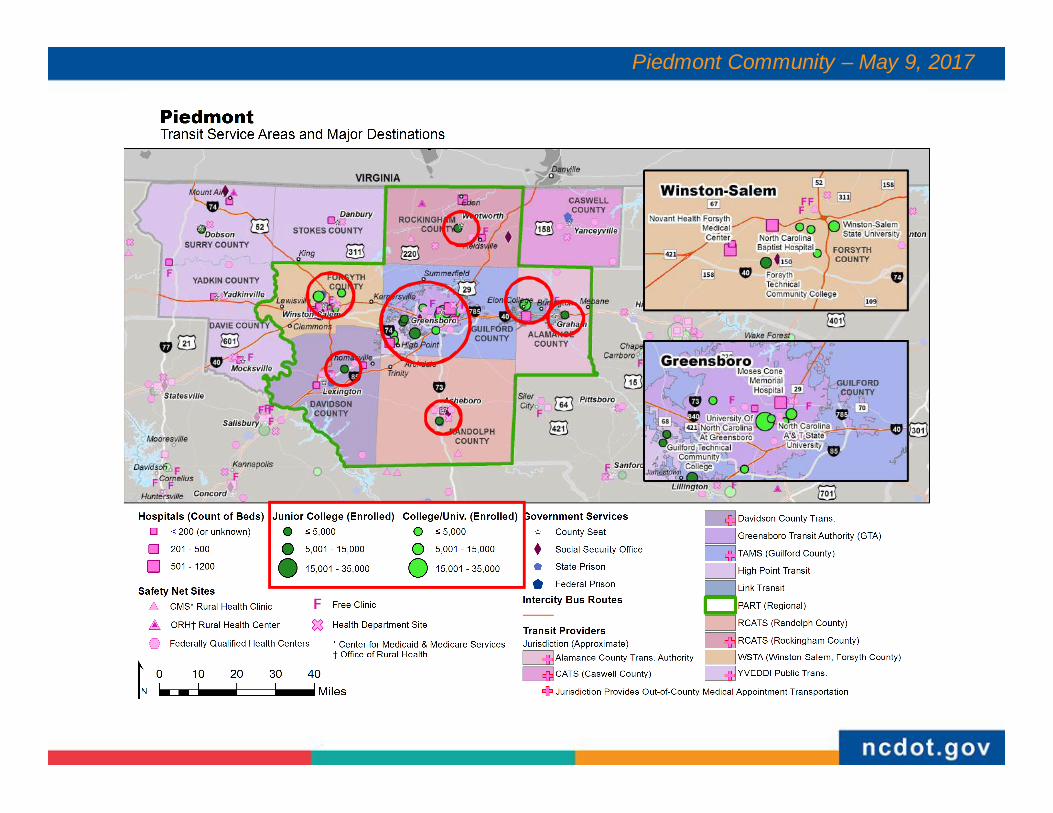
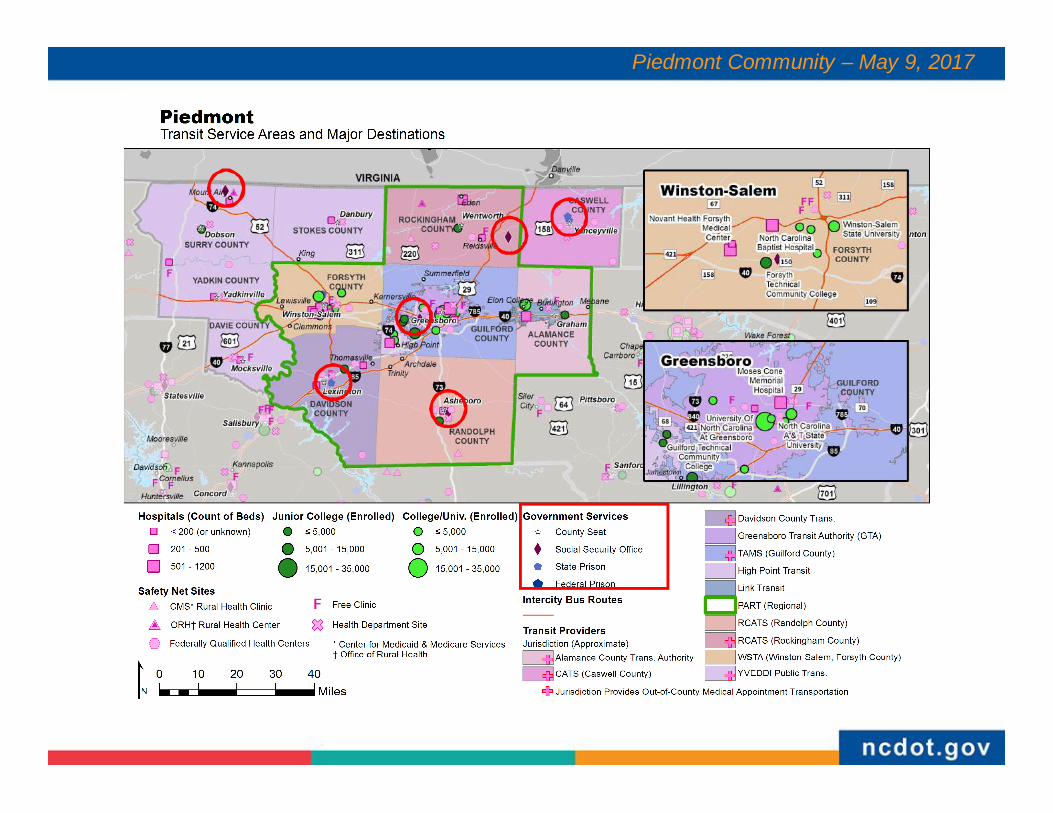
Piedmont District Existing Transit Profile
• 11 Counties, 12 providers• Demand Response and Fixed
Route• Davidson County Transportation• Greensboro Transit Authority• High Point Transit• Link Transit• Rockingham County Community
Access Transit System• Winston-Salem Transit Authority• YVEDDIT Public Transportation
• Demand Response Only• Alamance County Transportation
Authority• CATS• Guilford County TAMS• Regional Coordinated
Transportation System• Vanpool and Commuter Bus
• Piedmont Authority for Regional Transportation
• Types of service• Fixed-route bus• Demand response
• General public• In-county• Out-of-county• Medical
• Vanpool• Commuter Bus
• Destinations served• Cities/Towns• Medical
• 19 hospital & medical centers• Education
• 24 colleges & universities• Out-of-county
Piedmont Community – May 9, 2017
Piedmont Community – May 9, 2017
Piedmont Community – May 9, 2017
Piedmont Community – May 9, 2017
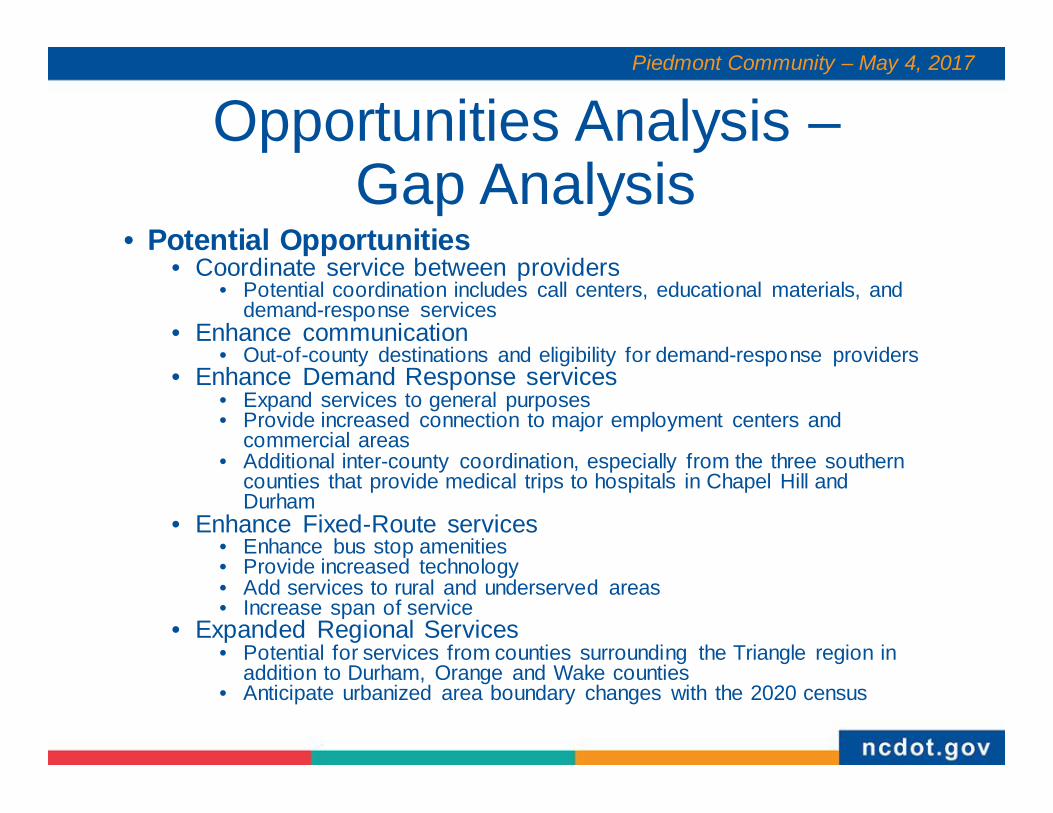
Opportunities Analysis –Gap Analysis
• Potential Opportunities• Coordinate service between providers
• Potential coordination includes call centers, educational materials, and demand-response services
• Enhance communication• Out-of-county destinations and eligibility for demand-response providers
• Enhance Demand Response services• Expand services to general purposes• Provide increased connection to major employment centers and
commercial areas• Additional inter-county coordination, especially from the three southern
counties that provide medical trips to hospitals in Chapel Hill and Durham
• Enhance Fixed-Route services• Enhance bus stop amenities• Provide increased technology• Add services to rural and underserved areas• Increase span of service
• Expanded Regional Services• Potential for services from counties surrounding the Triangle region in
addition to Durham, Orange and Wake counties • Anticipate urbanized area boundary changes with the 2020 census
Piedmont Community – May 4, 2017
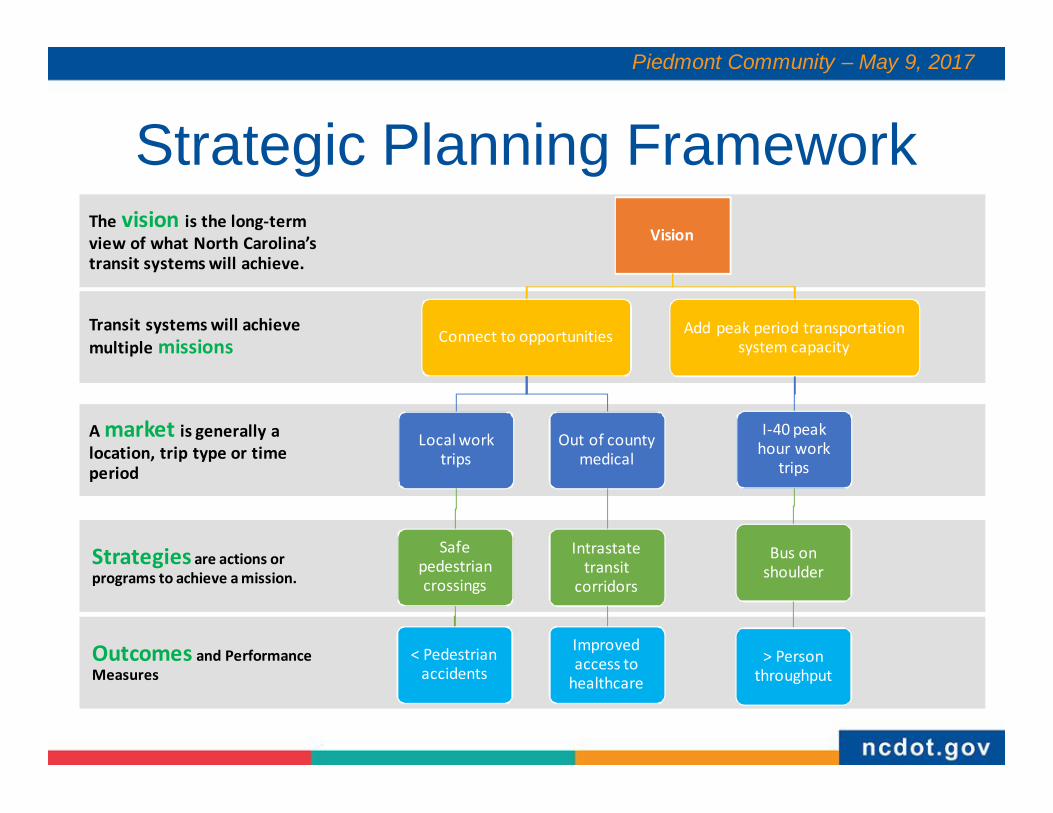
Strategic Planning FrameworkPiedmont Community – May 9, 2017
Outcomes and Performance Measures
Strategies are actions or programs to achieve a mission.
A market is generally a location, trip type or time period
Transit systems will achieve multiple missions
The vision is the long-term view of what North Carolina’s transit systems will achieve.
Vision
Connect to opportunities
Local work trips
Safe pedestrian crossings
< Pedestrian accidents
Out of county medical
Intrastate transit
corridors
Improved access to
healthcare
Add peak period transportation system capacity
I-40 peak hour work
trips
Bus on shoulder
> Person throughput
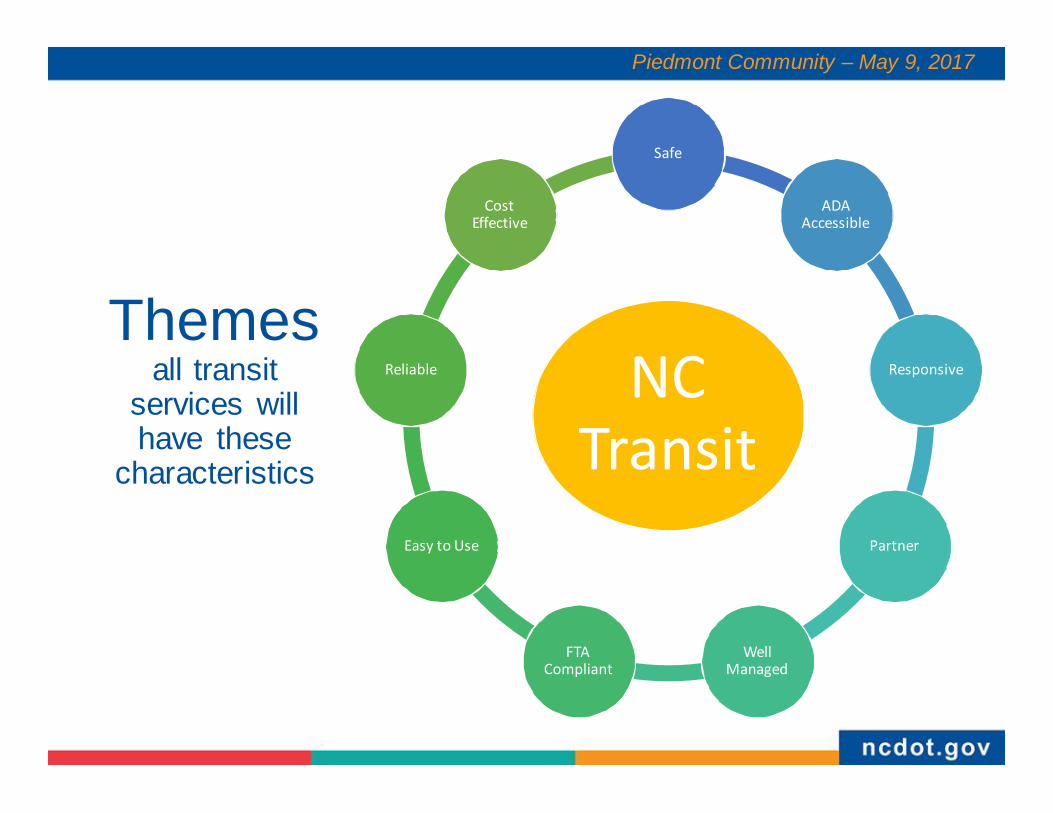
Themesall transit
services will have these
characteristics
NC Transit
Safe
ADA Accessible
Responsive
Partner
Well Managed
FTA Compliant
Easy to Use
Reliable
Cost Effective
Piedmont Community – May 9, 2017
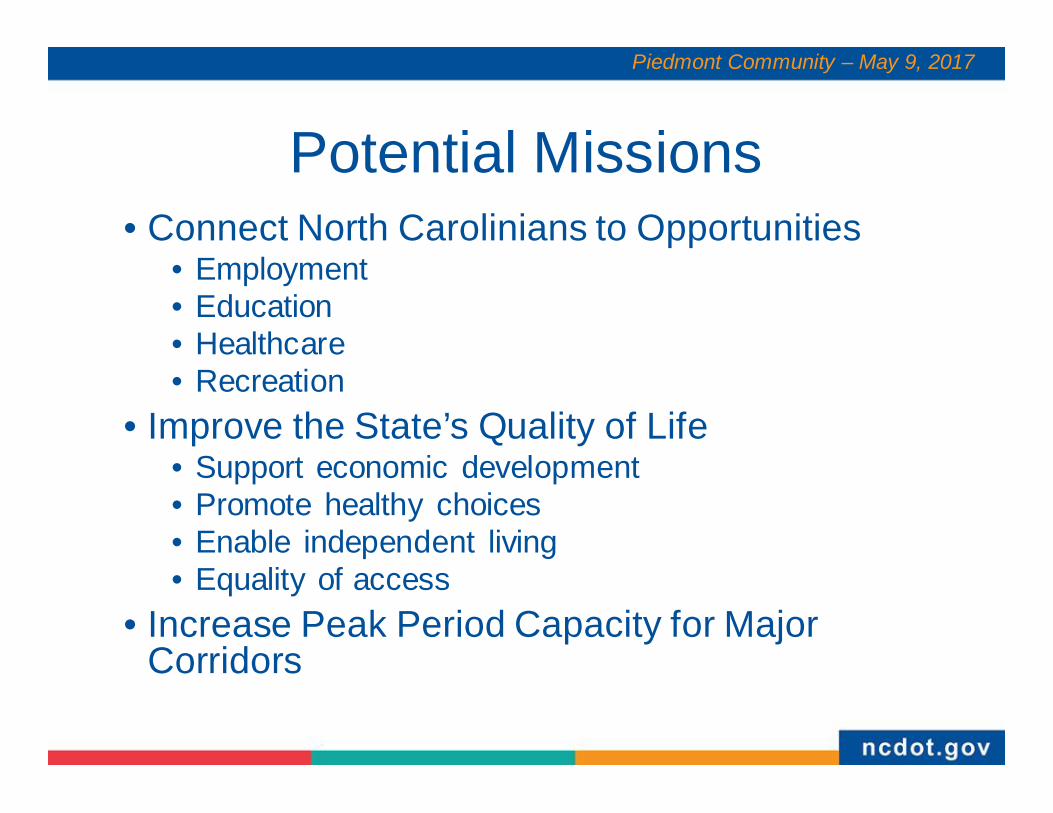
Potential Missions• Connect North Carolinians to Opportunities
• Employment• Education• Healthcare• Recreation
• Improve the State’s Quality of Life• Support economic development• Promote healthy choices• Enable independent living • Equality of access
• Increase Peak Period Capacity for Major Corridors
Piedmont Community – May 9, 2017
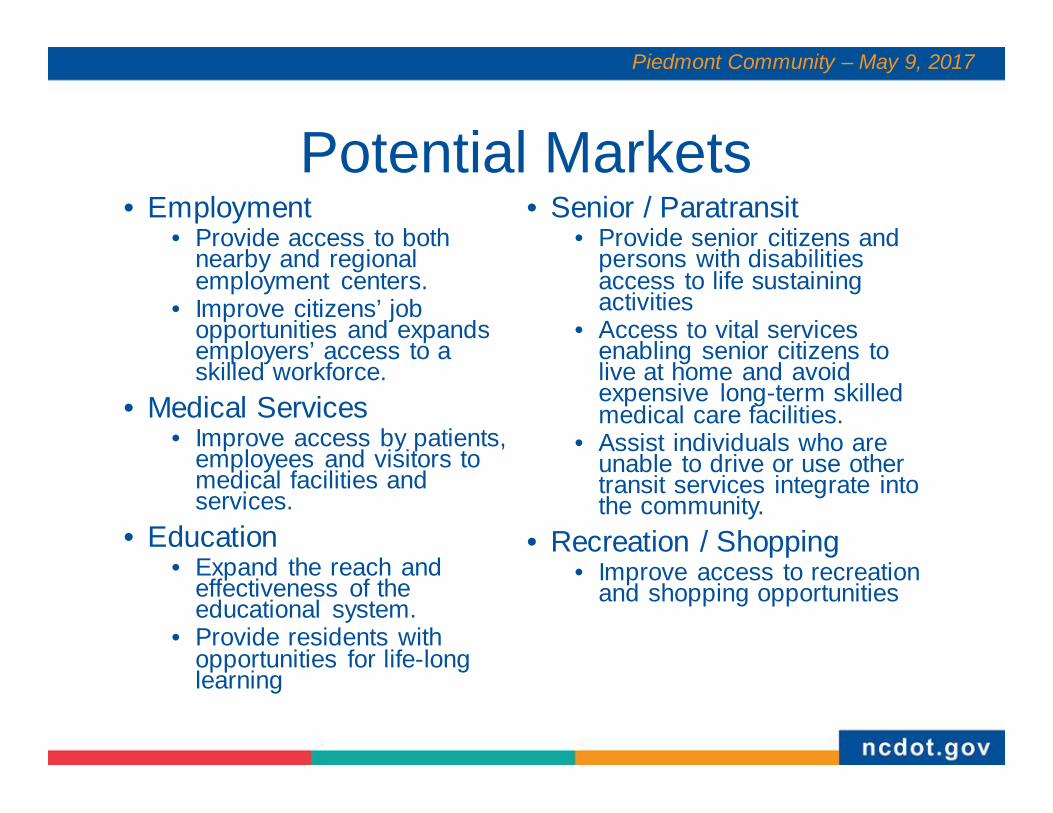
Potential Markets• Employment
• Provide access to both nearby and regional employment centers.
• Improve citizens’ job opportunities and expands employers’ access to a skilled workforce.
• Medical Services• Improve access by patients,
employees and visitors to medical facilities and services.
• Education• Expand the reach and
effectiveness of the educational system.
• Provide residents with opportunities for life-long learning
• Senior / Paratransit• Provide senior citizens and
persons with disabilities access to life sustaining activities
• Access to vital services enabling senior citizens to live at home and avoid expensive long-term skilled medical care facilities.
• Assist individuals who are unable to drive or use other transit services integrate into the community.
• Recreation / Shopping• Improve access to recreation
and shopping opportunities
Piedmont Community – May 9, 2017
Piedmont Community – May 9, 2017
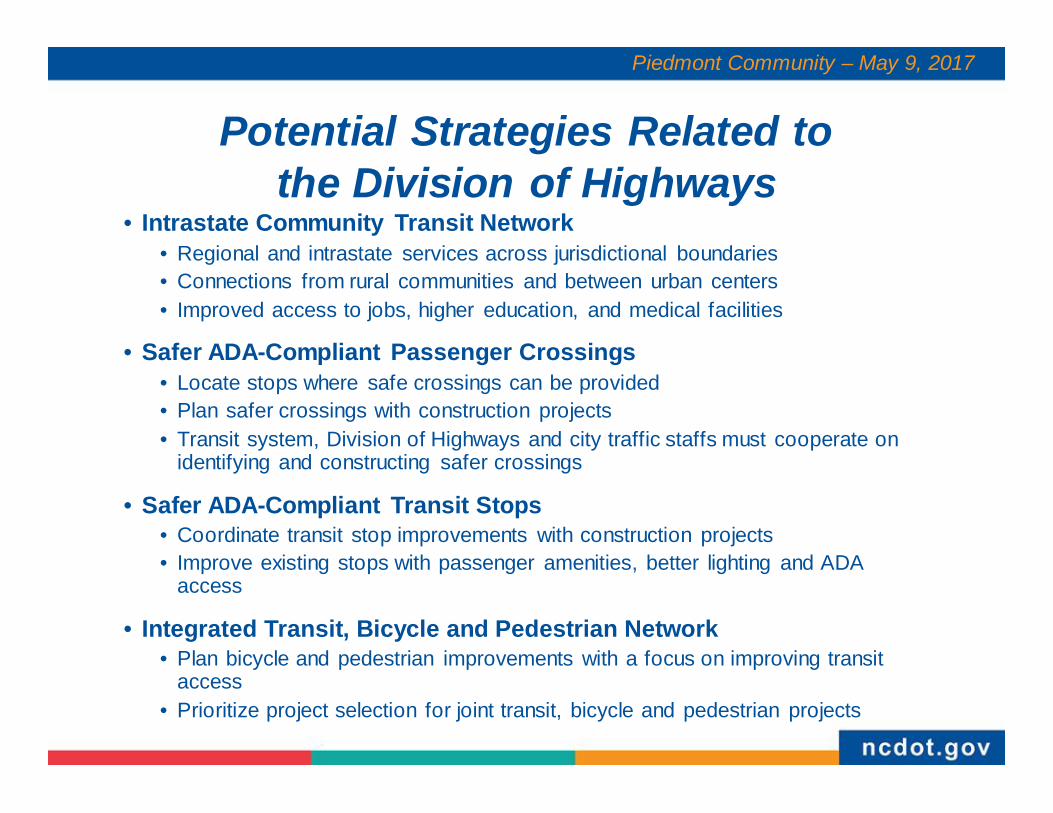
Potential Strategies Related to the Division of Highways
• Intrastate Community Transit Network• Regional and intrastate services across jurisdictional boundaries• Connections from rural communities and between urban centers• Improved access to jobs, higher education, and medical facilities
• Safer ADA-Compliant Passenger Crossings• Locate stops where safe crossings can be provided• Plan safer crossings with construction projects• Transit system, Division of Highways and city traffic staffs must cooperate on
identifying and constructing safer crossings
• Safer ADA-Compliant Transit Stops• Coordinate transit stop improvements with construction projects• Improve existing stops with passenger amenities, better lighting and ADA
access
• Integrated Transit, Bicycle and Pedestrian Network• Plan bicycle and pedestrian improvements with a focus on improving transit
access• Prioritize project selection for joint transit, bicycle and pedestrian projects
Piedmont Community – May 9, 2017
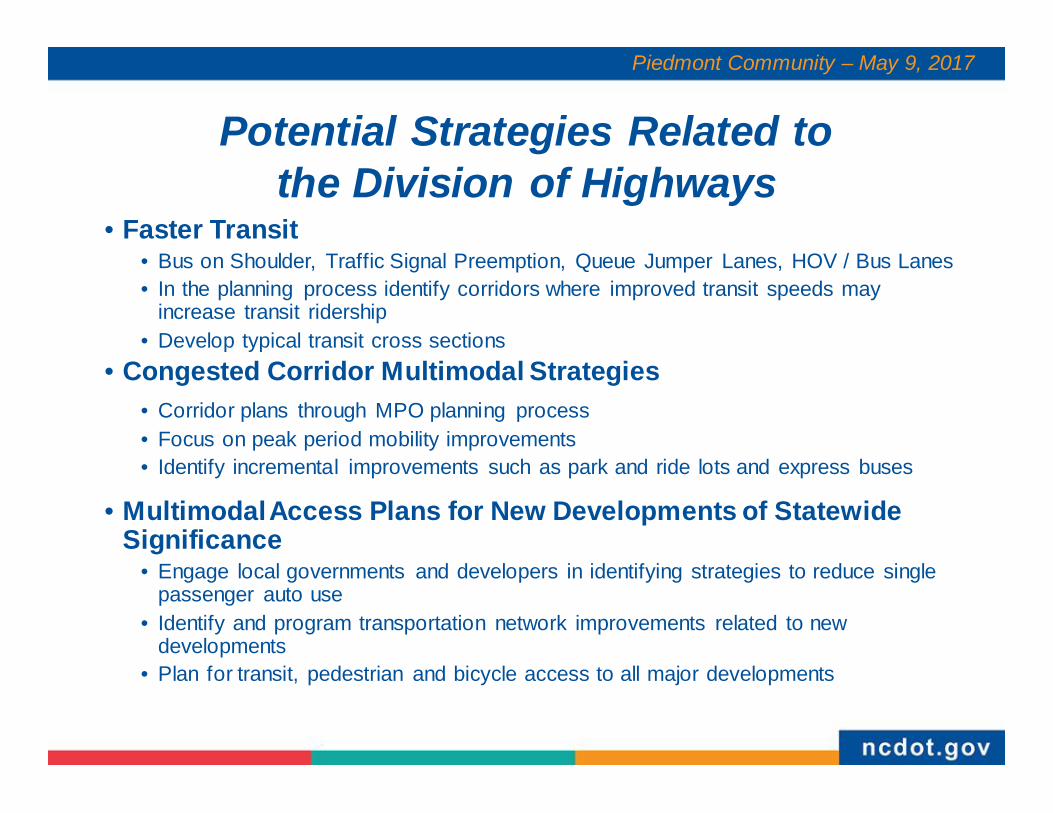
Potential Strategies Related to the Division of Highways
• Faster Transit • Bus on Shoulder, Traffic Signal Preemption, Queue Jumper Lanes, HOV / Bus Lanes• In the planning process identify corridors where improved transit speeds may
increase transit ridership• Develop typical transit cross sections
• Congested Corridor Multimodal Strategies• Corridor plans through MPO planning process• Focus on peak period mobility improvements• Identify incremental improvements such as park and ride lots and express buses
• Multimodal Access Plans for New Developments of Statewide Significance
• Engage local governments and developers in identifying strategies to reduce single passenger auto use
• Identify and program transportation network improvements related to new developments
• Plan for transit, pedestrian and bicycle access to all major developments
Piedmont Community – May 9, 2017
Break
Photo Booth
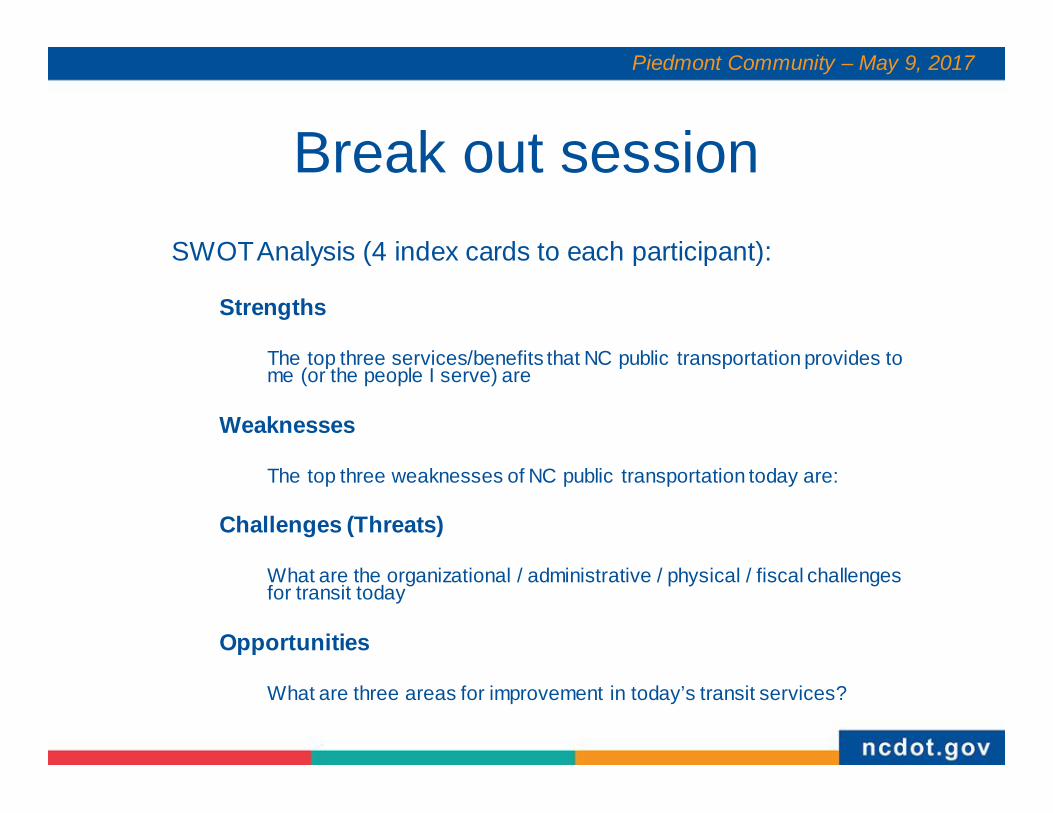
Break out sessionSWOT Analysis (4 index cards to each participant):
Strengths
The top three services/benefits that NC public transportation provides to me (or the people I serve) are
Weaknesses
The top three weaknesses of NC public transportation today are:
Challenges (Threats)
What are the organizational / administrative / physical / fiscal challenges for transit today
Opportunities
What are three areas for improvement in today’s transit services?
Piedmont Community – May 9, 2017
Report
Strengths
Weaknesses
Challenges (Threats)
Opportunities
Piedmont Community – May 9, 2017
Poll Everywhere
What is the greatest challenge facing Public Transportation in North Carolina?
Piedmont Community – May 9, 2017
Vision
What is your vision for North Carolina’s public transportation program?
Piedmont Community – May 9, 2017
Poll Everywhere
What word should be included in the North Carolina Public Transportation Vision Statement?
Piedmont Community – May 9, 2017
https://www.ncdot.gov/nctransit/strategicplan/
Debbie Collins, Director Jim RitcheyPublic Transportation Division [email protected] [email protected] 707 4684 404 433 1379