community noise analysis of ga aircraft noise analysis of ga aircraft ... the noise impact due to...
TRANSCRIPT
COMMUNITY NOISE ANALYSIS OF GA AIRCRAFT -
LOCAL AIRPORTS CASE STUDY
Ana Marija Đuranec1, Dubravko Miljković2, Tino Bucak1
1University of Zagreb, Faculty of Transport and Traffic Sciences, Department of Aeronautics,
Vukelićeva 4, Zagreb, Croatia; 2HEP Zagreb [email protected], [email protected], [email protected]
Abstract: The study is targeting disturbance caused by general aviation noise around two airports predominantly operated by aircraft less than 5,700 kg – specifically airports Lučko, LDZL and Varaždin, LDVA, Croatia. To assess the noise impact due to aircraft operations, noise measurements were carried out during touch-and-go and traffic pattern operations of Cessna 172 general aviation aircraft. Since background noise levels around GA airports are generally lower than a background levels around larger air carrier airports, the noise originating from GA operations could be perceived more intrusive to surrounding community. Measured aircraft noise levels are compared to community background noise and directions for scheduling of flight operations are given. Key words: noise, airport, general aviation, aircraft
1. INTRODUCTION
Noise can be described as unpleasant, unexpected or undesired sound that may have adverse affect regarding human health, but also may impair the quality of life. In aviation, noise is considered as aircraft emission along with exhaust gasses. Large airplanes produce greater noise than smaller aircraft, and most of the noise comes from engines and aircraft structure (airframe). The principal sources of aircraft noise are engine, propeller and boundary layer. This paper examines impact of community noise (within airport community) on two local GA airports: LDZL (Lučko) and LDVA (Varaždin), and measurements were performed during take off and landing procedures and traffic pattern for most common light aircraft on these airports - Cessna 172 Skyhawk.
2. GENERAL AVIATION AIRCRAFT USED IN
AN EXPERIMENT
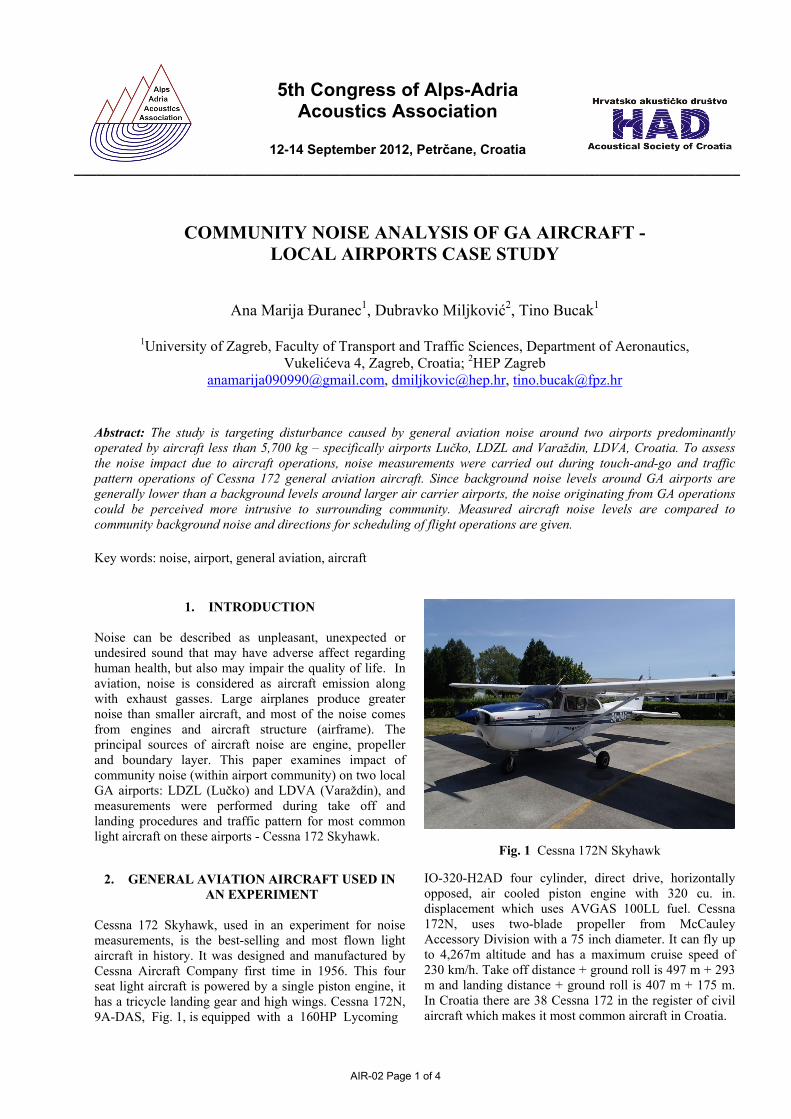
Cessna 172 Skyhawk, used in an experiment for noise measurements, is the best-selling and most flown light aircraft in history. It was designed and manufactured by Cessna Aircraft Company first time in 1956. This four seat light aircraft is powered by a single piston engine, it has a tricycle landing gear and high wings. Cessna 172N, 9A-DAS, Fig. 1, is equipped with a 160HP Lycoming
Fig. 1 Cessna 172N Skyhawk IO-320-H2AD four cylinder, direct drive, horizontally opposed, air cooled piston engine with 320 cu. in. displacement which uses AVGAS 100LL fuel. Cessna 172N, uses two-blade propeller from McCauley Accessory Division with a 75 inch diameter. It can fly up to 4,267m altitude and has a maximum cruise speed of 230 km/h. Take off distance + ground roll is 497 m + 293 m and landing distance + ground roll is 407 m + 175 m. In Croatia there are 38 Cessna 172 in the register of civil aircraft which makes it most common aircraft in Croatia.
5th Congress of Alps-Adria Acoustics Association
12-14 September 2012, Petrčane, Croatia __________________________________________________________________________________________
AIR-02 Page 1 of 4
It is a popular misconception that all jets are noisier than all turboprops which are noisier than all piston aircraft. Small piston engine aircraft can be quite noisy. World’s most popular aircraft Cessna 172 is noisier on take-off than the most popular new generation business jets: Citation CJ, CJ2, II/Bravo, Excel, Encore, Lear 45 and 60.
3. AIRPORTS AND NEIRBORHOOD
3.1. Airport Lučko (ICAO: LDZL) Airport Lučko is located 11 km south-west of the city center of Zagreb on following coordinates: 45º 46' 00,41" N and 015º 50' 55,31" E. Elevation of Lučko is 123 m above sea level. Magnetic variation is 3°E. Operational area of airport includes maneuvering area and 6 aprons. Maneuvering area consists of 2 grass runways (10R/28L and 10L/28R), each 850m long and 30m wide, and 6 taxiways, Fig. 2, [1] The airport is designated for operations of aircraft with MTOM up to 5700kg, sports craft, for gliders and parachute jumpers. It is also used by Croatian military and police helicopters. Three kilometers from airport there is village Lučko, Fig. 3. West of the airport there is a Samobor mountains and two kilometers north Sava river passes by. Airport traffic consists of training flights (Cessna 150 and 172, Piper Warrior), panoramic flights and occasional helicopter flights (private R44, police Bell 206/212 and military Mil Mi-8).
Fig. 2 Airport Lučko (ICAO: LDZL)
Fig. 3 Airport Lučko (LDZL) and neighborhood
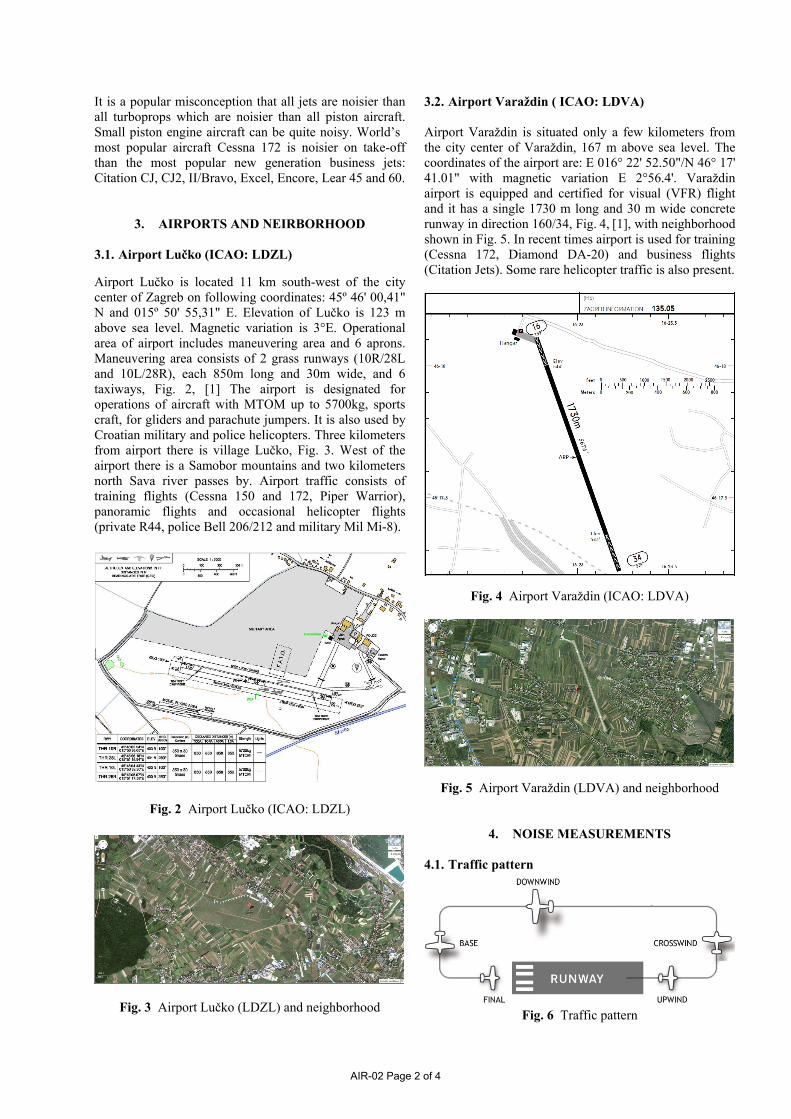
3.2. Airport Varaždin ( ICAO: LDVA) Airport Varaždin is situated only a few kilometers from the city center of Varaždin, 167 m above sea level. The coordinates of the airport are: E 016° 22' 52.50"/N 46° 17' 41.01" with magnetic variation E 2°56.4'. Varaždin airport is equipped and certified for visual (VFR) flight and it has a single 1730 m long and 30 m wide concrete runway in direction 160/34, Fig. 4, [1], with neighborhood shown in Fig. 5. In recent times airport is used for training (Cessna 172, Diamond DA-20) and business flights (Citation Jets). Some rare helicopter traffic is also present.
Fig. 4 Airport Varaždin (ICAO: LDVA)
Fig. 5 Airport Varaždin (LDVA) and neighborhood
4. NOISE MEASUREMENTS 4.1. Traffic pattern
Fig. 6 Traffic pattern
AIR-02 Page 2 of 4
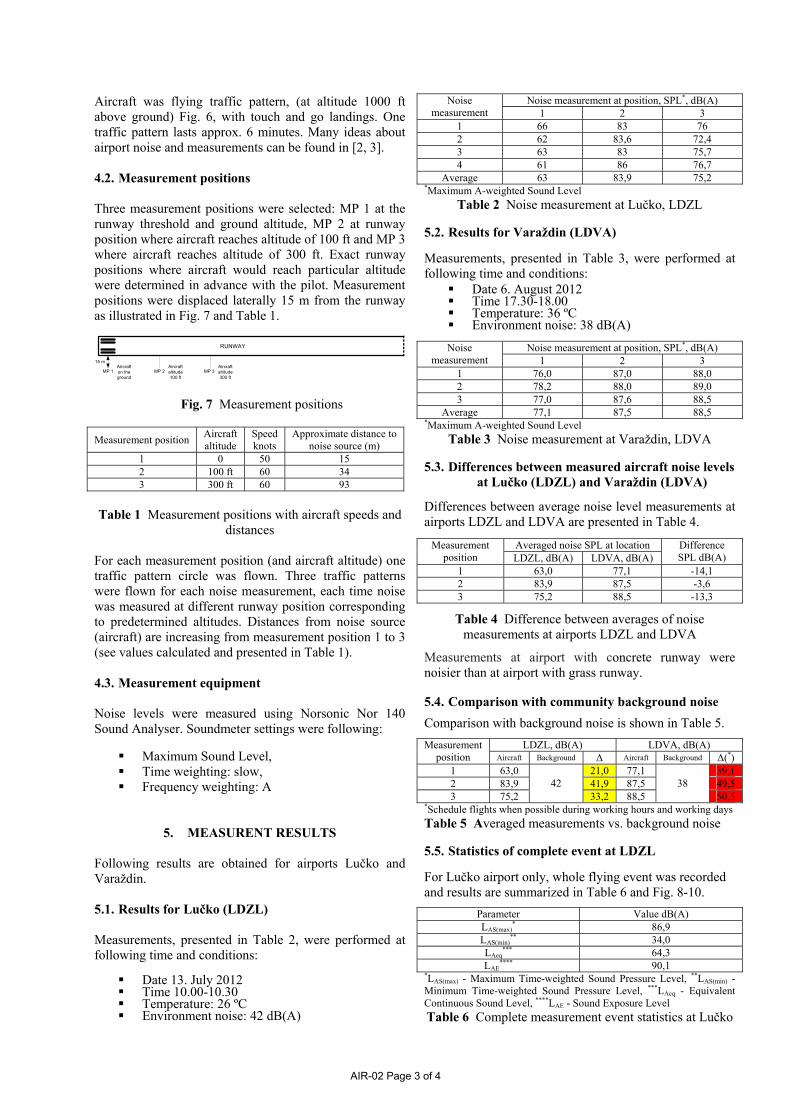
Aircraft was flying traffic pattern, (at altitude 1000 ft above ground) Fig. 6, with touch and go landings. One traffic pattern lasts approx. 6 minutes. Many ideas about airport noise and measurements can be found in [2, 3].
4.2. Measurement positions
Three measurement positions were selected: MP 1 at the runway threshold and ground altitude, MP 2 at runway position where aircraft reaches altitude of 100 ft and MP 3 where aircraft reaches altitude of 300 ft. Exact runway positions where aircraft would reach particular altitude were determined in advance with the pilot. Measurement positions were displaced laterally 15 m from the runway as illustrated in Fig. 7 and Table 1.
MP 1 MP 2 MP 3
15 mAircraft altitude 300 ft
RUNWAY
Aircraft altitude 100 ft
Aircraft on the ground
Fig. 7 Measurement positions
Measurement position Aircraft
altitude Speed knots
Approximate distance to noise source (m)
1 0 50 15 2 100 ft 60 34 3 300 ft 60 93
Table 1 Measurement positions with aircraft speeds and
distances
For each measurement position (and aircraft altitude) one traffic pattern circle was flown. Three traffic patterns were flown for each noise measurement, each time noise was measured at different runway position corresponding to predetermined altitudes. Distances from noise source (aircraft) are increasing from measurement position 1 to 3 (see values calculated and presented in Table 1).
4.3. Measurement equipment
Noise levels were measured using Norsonic Nor 140 Sound Analyser. Soundmeter settings were following:
Maximum Sound Level, Time weighting: slow, Frequency weighting: A
5. MEASURENT RESULTS
Following results are obtained for airports Lučko and Varaždin. 5.1. Results for Lučko (LDZL)
Measurements, presented in Table 2, were performed at following time and conditions:
Date 13. July 2012 Time 10.00-10.30 Temperature: 26 ºC Environment noise: 42 dB(A)
Noise measurement at position, SPL*, dB(A) Noise measurement 1 2 3
1 66 83 76 2 62 83,6 72,4 3 63 83 75,7 4 61 86 76,7
Average 63 83,9 75,2 *Maximum A-weighted Sound Level
Table 2 Noise measurement at Lučko, LDZL
5.2. Results for Varaždin (LDVA)
Measurements, presented in Table 3, were performed at following time and conditions:
Date 6. August 2012 Time 17.30-18.00 Temperature: 36 ºC Environment noise: 38 dB(A)
Noise measurement at position, SPL*, dB(A) Noise
measurement 1 2 3 1 76,0 87,0 88,0 2 78,2 88,0 89,0 3 77,0 87,6 88,5
Average 77,1 87,5 88,5 *Maximum A-weighted Sound Level
Table 3 Noise measurement at Varaždin, LDVA
5.3. Differences between measured aircraft noise levels at Lučko (LDZL) and Varaždin (LDVA)
Differences between average noise level measurements at airports LDZL and LDVA are presented in Table 4.
Averaged noise SPL at location Measurement
position LDZL, dB(A) LDVA, dB(A) Difference SPL dB(A)
1 63,0 77,1 -14,1 2 83,9 87,5 -3,6 3 75,2 88,5 -13,3
Table 4 Difference between averages of noise measurements at airports LDZL and LDVA
Measurements at airport with concrete runway were noisier than at airport with grass runway.
5.4. Comparison with community background noise
Comparison with background noise is shown in Table 5.
LDZL, dB(A) LDVA, dB(A) Measurement position Aircraft Background ∆ Aircraft Background ∆(*)
1 63,0 21,0 77,1 39,1 2 83,9 41,9 87,5 49,5 3 75,2
42 33,2 88,5
38 50,5
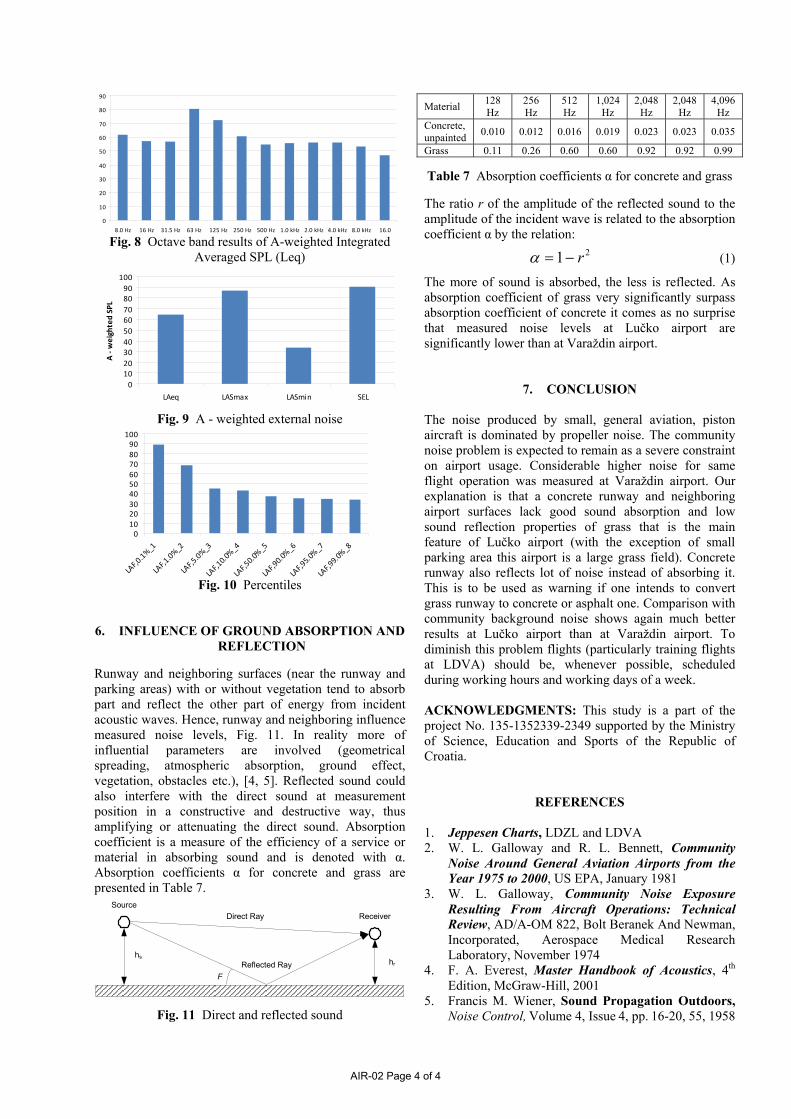
*Schedule flights when possible during working hours and working days Table 5 Averaged measurements vs. background noise 5.5. Statistics of complete event at LDZL For Lučko airport only, whole flying event was recorded and results are summarized in Table 6 and Fig. 8-10.
Parameter Value dB(A) LAS(max)
* 86,9 LAS(min)
** 34,0 LAeq
*** 64,3 LAE
**** 90,1 *LAS(max) - Maximum Time-weighted Sound Pressure Level, **LAS(min) - Minimum Time-weighted Sound Pressure Level, ***LAeq - Equivalent Continuous Sound Level, ****LAE - Sound Exposure Level Table 6 Complete measurement event statistics at Lučko
AIR-02 Page 3 of 4
0
10
20
30
40
50
60
70
80
90
8.0 Hz 16 Hz 31.5 Hz 63 Hz 125 Hz 250 Hz 500 Hz 1.0 kHz 2.0 kHz 4.0 kHz 8.0 kHz 16.0
Material 128 Hz
256 Hz
512 Hz
1,024 Hz
2,048 Hz
2,048 Hz
4,096 Hz
Concrete, unpainted 0.010 0.012 0.016 0.019 0.023 0.023 0.035
Grass 0.11 0.26 0.60 0.60 0.92 0.92 0.99
Table 7 Absorption coefficients α for concrete and grass The ratio r of the amplitude of the reflected sound to the amplitude of the incident wave is related to the absorption coefficient α by the relation: Fig. 8 Octave band results of A-weighted Integrated
Averaged SPL (Leq)
21 r−=α (1)
0102030405060708090
100
LAeq LASmax LASmin SEL
A ‐ weighted SPL
The more of sound is absorbed, the less is reflected. As absorption coefficient of grass very significantly surpass absorption coefficient of concrete it comes as no surprise that measured noise levels at Lučko airport are significantly lower than at Varaždin airport.
7. CONCLUSION
Fig. 9 A - weighted external noise The noise produced by small, general aviation, piston aircraft is dominated by propeller noise. The community noise problem is expected to remain as a severe constraint on airport usage. Considerable higher noise for same flight operation was measured at Varaždin airport. Our explanation is that a concrete runway and neighboring airport surfaces lack good sound absorption and low sound reflection properties of grass that is the main feature of Lučko airport (with the exception of small parking area this airport is a large grass field). Concrete runway also reflects lot of noise instead of absorbing it. This is to be used as warning if one intends to convert grass runway to concrete or asphalt one. Comparison with community background noise shows again much better results at Lučko airport than at Varaždin airport. To diminish this problem flights (particularly training flights at LDVA) should be, whenever possible, scheduled during working hours and working days of a week.
0102030405060708090
100
LAF,0.1%
_1
LAF,1.0%
_2
LAF,5.0%
_3
LAF,10.0%_4
LAF,50.0%_5
LAF,90.0%_6
LAF,95.0%_7
LAF,99.0%_8
Fig. 10 Percentiles
6. INFLUENCE OF GROUND ABSORPTION AND
REFLECTION Runway and neighboring surfaces (near the runway and parking areas) with or without vegetation tend to absorb part and reflect the other part of energy from incident acoustic waves. Hence, runway and neighboring influence measured noise levels, Fig. 11. In reality more of influential parameters are involved (geometrical spreading, atmospheric absorption, ground effect, vegetation, obstacles etc.), [4, 5]. Reflected sound could also interfere with the direct sound at measurement position in a constructive and destructive way, thus amplifying or attenuating the direct sound. Absorption coefficient is a measure of the efficiency of a service or material in absorbing sound and is denoted with α. Absorption coefficients α for concrete and grass are presented in Table 7.
ACKNOWLEDGMENTS: This study is a part of the project No. 135-1352339-2349 supported by the Ministry of Science, Education and Sports of the Republic of Croatia.
REFERENCES
1. Jeppesen Charts, LDZL and LDVA 2. W. L. Galloway and R. L. Bennett, Community
Noise Around General Aviation Airports from the Year 1975 to 2000, US EPA, January 1981
3. W. L. Galloway, Community Noise Exposure Resulting From Aircraft Operations: Technical Review, AD/A-OM 822, Bolt Beranek And Newman, Incorporated, Aerospace Medical Research Laboratory, November 1974
hshr
SourceReceiverDirect Ray
Reflected RayF
4. F. A. Everest, Master Handbook of Acoustics, 4th
Edition, McGraw-Hill, 2001 5. Francis M. Wiener, Sound Propagation Outdoors,
Noise Control, Volume 4, Issue 4, pp. 16-20, 55, 1958
Fig. 11 Direct and reflected sound
AIR-02 Page 4 of 4