community profile and benchmark analysis - future...
TRANSCRIPT

Edina, Minnesota
Community Profile and Benchmark Analysis

Community Profile and Benchmark AnalysisEdina, Minnesota
Prepared By:
October 2014
This report has been produced as part of Future iQ Partners work on the Vision Edina initiative

Table of Contents1.0 Introduction ................................................4 2.0 Community Profile ......................................6 3.0 Cohort Community Profile ...........................8 4.0 Population Characteristics .........................12 5.0 Income Dynamics .....................................14 6.0 Education & Occupation Dynamics............16 7.0 Housing and Migration Characteristics .......20 8.0 Commuting & Transportation Dynamics ......24 9.0 Conclusion ..............................................26 10. References & More Information .................27

Future iQ Partners (Future iQ) presents the findings of the City of Edina Community Profile and Benchmark Analysis. Future iQ has been contracted by the City of Edina, Minnesota to engage in a number of aspects of its Vision Edina community visioning process. The analysis presented in this technical report represents a natural extension of this process and is intended to both support and spark additional dialogue in the community.
Communities commonly use benchmark approaches as a means of both highlighting their strengths and identifying best practices for improvement. Many of the analyses of this type also utilize a competitive framework to identify those cohort communities that serve as the basis for comparison. The analysis presented in this report differs from the standard practice in that a select group of communities have been chosen that hold similar standing within their respective regions and share many of Edina’s core values. Similarly, the focus of this analysis is to identify and quantify the existing strengths within the community, but also to highlight areas that may be affected in Edina’s future.
We invite you to review the findings of this analysis and to consider how they may impact your understanding of the City of Edina and its significant growth potential.
Technical Note:
The analysis presented in this benchmark report draws on a number of publicly-available data sources. Data on each of the benchmark communities may not be depicted in every comparison in the interest of clarity. In these instances, an average or median measure of the full cohort will be utilized. All of the data utilized in the preparation of this report can be accessed by contacting [email protected], and will be referenced at the end of the report.
1.0 INTRODUCTION
4 | COMMUNITY PROFILE AND BENCHMARK ANALYSIS

COMMUNITY PROFILE AND BENCHMARK ANALYSIS | 5

6 | COMMUNITY PROFILE AND BENCHMARK ANALYSIS
Population
The City of Edina, Minnesota is located in southwestern Hennepin County and is part of the Minneapolis – St. Paul Metropolitan Statistical Area. The Twin
Cities region is home to more than 3.4 million residents and is the sixteenth largest metropolitan area in the United States. Edina’s population of 49,376 in 2013 represents a community that is a vibrant, inner ring suburb in a growing metropolitan region. The city’s population has increased by nearly 2,000 residents since 2000, with much of that growth occurring in the last three years.
The City of Edina has grown from an agrarian center in the nineteenth century to a vibrant suburban community, benefitting from its proximity to
Minneapolis and the broader economic and social trends that shaped much of post-World War II America. It has further developed to boast a vibrant and
diverse economy along with significant civic investments. The high standard of living enjoyed by many of the community’s residents is both a source of pride, as well
as an asset that attracts both young families and mature residents.
EducationEdina prides itself on supporting a nationally-renowned public school district. Edina Public Schools (EPS) routinely boasts high levels of achievement among its 8,300 students. The District ranks in the top three districts on all state standard assessments, and high school students receive an average score of 26.3 on the ACT exam. The number of students that are considered “college ready” is nearly twice the state average. Edina High School routinely ranks among top public high schools in the Midwest and nationally. The district has been cited by the U.S. Department of Education and a number of major national publications for its general excellence and enjoys a high level of support among the city’s residents.
Access to high-quality education is frequently cited as one of the principal factors affecting home buying decisions in American cities. The community places a high value on lifelong learning, as more than 82 percent of residents hold at least a bachelor’s degree – a rate more than three times the national average. This provides the talent base for many of the region’s large employers. A high degree of education also translates to greater wealth in the community.
Edina’s Residents in Brief
Population 49,376 Population under age 18 18.2%
Population Growth (since 2000) 4.40% Population over age 65 20.3%
Median Age 44.7 Years Population with a Bachelor’s Degree or Higher 82.3%
Male 47.6% Home Ownership Rate 73.5%
Female 52.4% Median Home Value $390,000
2.0 COMMUNITY PROFILE

COMMUNITY PROFILE AND BENCHMARK ANALYSIS | 7
Income and EmploymentThe median household income of Edina’s residents of $84,251 is nearly 60 percent above the national average, yet is only near the median when compared to other suburbs in the Minneapolis-St. Paul region. What distinguishes the City of Edina from its neighbors, however, is its close proximity to the central business district of downtown Minneapolis. The community compares favorably against other inner-ring suburbs in the region, as well as those destination communities identified in the benchmark cohort.
Forty-three percent of Edina’s households earn more than $100,000 annually. Also of note is the fact that 42 percent of the community’s households are single-worker households, a percentage that is well above both the national and benchmark average. The mean income in these households is also 90 percent higher than the cohort average at more than $330,000. This suggests that the community places a high value on the maintenance of a healthy work-life balance, a trait that is especially attractive to young families.
Quality of Life and Public AmenitiesEdina’s residents enjoy a number of public amenities in addition to a housing density that lies at the bottom of the benchmark cohort. The City maintains forty public parks and 1,550 acres of public space, expanding the community’s “backyard” and a sense of connectedness. The amount of public space per capita also compares favorably to the other inner-ring suburbs in this analysis. The community’s quality of life is further enhanced by an active arts community and support for public art. The community has recently embraced the importance of walkability through its Living Streets campaign. Each of these qualities, coupled with a vibrant commercial and retail corridor enhance the attractiveness and competitiveness of the community in attracting young professionals.

8 | COMMUNITY PROFILE AND BENCHMARK ANALYSIS
3.0 COHORT COMMUNITY PROFILE
Bellevue, WashingtonPopulation: 133,992 Population Growth (since 2000): 22.3% Median Age: 37.8 Years Median Household Income: $88,073 Median Housing Value: $541,600
Bellevue, Washington is located on the eastern shore of Lake Washington, which separates the community from Seattle. It was referred to as a “boomburg” for its large population, but is still regarded as an inner ring suburb due its proximity and access to the central city. It is a large community in its own right, with a central business district employing more than 35,000 workers. It is regarded as the retail destination in eastern Seattle, and benefits from the headquarters of Microsoft, Nintendo of America and other computer software companies in nearby Redmond. The city has experienced its own technology renaissance since the 1990’s. It was also rated as the 2nd Best City to Live by USA Today in 2014.
Bethesda, Maryland
Population: 59,591 Population Growth (since 2000): 7.8% Median Age: 42.7 Years Median Household Income: $141,817 Median Housing Value: $805,900
Bethesda, Maryland is a Census-Designated Place located to the northwest of Washington, D.C. While it is considered an unincorporated area, the region possesses a strong community identity. The community greatly benefits from federal government activity and is home to the National Institutes of Health and the Walter Reed National Military Medical Center, among other government and corporate headquarters. The region is very densely developed, with an average population density of over 4,500 residents per square mile. Bethesda has also received a number of national accolades, much like many of the other communities in this cohort. It was ranked as “America’s Most Educated Small Town” by Forbes Magazine in 2012, and CNN/Money named it the “Top Earning American Town” in that same year.
Carmel, Indiana
Population: 85,297 Population Growth (since 2000): 152.9% Median Age: 38.4 Years Median Household Income: $107,505 Median Housing Value: $293,600
Carmel, Indiana is the largest suburban community in the Indianapolis metropolitan area. The city has experienced nearly-exponential population growth over the last decade as a consequence of a combination of annexation activity and its reputation among the best cities in the United States. Its population density of 1,668 persons per square mile

COMMUNITY PROFILE AND BENCHMARK ANALYSIS | 9
is low for a community of its size, though the city has recently committed to developing a number of high-profile and high-density developments. The city ranked 12th in a recent rating of America’s Best Cities published by USA Today. Carmel also embraces the significance of public amenities a community’s quality of life through the promotion of its Arts and Design District. It is home to the corporate headquarters of CNO Financial, Delta Faucet, and other notable corporations.
Highland Park, Illinois
Population: 29,902 Population Growth (since 2000): -4.7% Median Age: 45.4 Years Median Household Income: $115,321 Median Housing Value: $521,700
Highland Park, a northeastern suburb of Chicago, is the third-smallest community in the cohort, and one of two communities to experience population decline since 2000. It boasts a number of attractive cultural amenities, including the Ravinia performing arts festival, and a large number of historic homes designed by Frank Lloyd Wright and other noted architects. The city has historically served as the home to a number of professional athletes from the Chicago Bears and Chicago Bulls, whose practice facilities are nearby. It is located within the regional corridor between Chicago and Milwaukee, offering a wide array of employment opportunities.
Lee’s Summit, Missouri
Population: 93,184 Population Growth (since 2000): 31.8% Median Age: 36.4 Years Median Household Income: $76,179 Median Housing Value: $185,100
Lee’s Summit, Missouri, one of the most populous suburbs of Kansas City, has the lowest median household income and lowest median housing value of any of communities in the benchmark cohort. Each of these rankings places the city close to the other Midwestern communities in the cohort. It is generally regarded as one of the top 100 communities in America on the strength of its amenities and educational quality.
Littleton, Colorado
Population: 44,275 Population Growth (since 2000): 9.8% Median Age: 41.3 Years Median Household Income: $52,232 Median Housing Value: $267,400
Littleton, Colorado represents one of the smallest communities by population among the cohort, and its median household income is among the lowest. The community is one of Denver’s inner ring suburbs located immediately south of the city and serviced by its light rail system. It is generally regarded as among the safest communities in America and was among the first communities to adopt a Community Scorecard benchmarking approach. Littleton is home to a number of prominent businesses, including Intelligent Vehicle Safety Technologies.

10 | COMMUNITY PROFILE AND BENCHMARK ANALYSIS
Manhattan Beach, California
Population: 35,276 Population Growth (since 2000): 4.2% Median Age: 40.4 Years Median Household Income: $134,445 Median Housing Value: $1,000,000+
Manhattan Beach, one of Los Angeles’s most prestigious suburbs has the most competitive real estate markets of any community in the cohort. There were more homes exceeding $1 million in value sold in the community than any other city in California in 2013. Residents are largely attracted to the community for its natural beauty and the high quality of its education system. The city ranks as the fifth most educated in California and Forbes Magazine rated its public school system sixth best in the country in 2013. The city’s economy benefits greatly by linkages to the Los Angeles economy as the largest local employers are generally involved in retail trade.
Menlo Park, California
Population: 33,071 Population Growth (since 2000): 6.9% Median Age: 38.9 Years Median Household Income: $113,774 Median Housing Value: $1,000,000+
Menlo Park is one of the most prosperous suburbs in the San Francisco Bay region. It has been rated by CNN as being among the “Top 15 Places for the Rich and Single to Live.” The community has benefitted greatly from the technology boom of the last three decades. It welcomed Facebook as its largest employer in 2011. SRI International and Robert Half International are also among the city’s most prominent employers. The community is fully integrated into the Bay Area and Silicon Valley through the region’s public transportation network.
Newton, Massachusetts
Population: 87,971 Population Growth (since 2000): 4.9% Median Age: 39.7 Years Median Household Income: $113,416 Median Housing Value: $687,300
Newton is a western suburb in the western Boston region and is widely regarded as among America’s best cities. It was recently ranked as the Best City to Live by USA Today on the strength of its low crime rate, and substantial amenities, which include access to 49 golf courses and over 3,000 restaurants in the greater metro region. The community is extensively served by a variety of public transportation options providing easy access into Boston’s
financial district. Newton is also home to Boston College.
3.0 COHORT COMMUNITY PROFILE

COMMUNITY PROFILE AND BENCHMARK ANALYSIS | 11
Shaker Heights, Ohio
Population: 27,935 Population Growth (since 2000): -5.0% Median Age: 40.2 Years Median Household Income: $77,198 Median Housing Value: $231,400
Shaker Heights is generally recognized as one of the first inner-ring suburbs in the United States, serving as a vital community in the Cleveland metropolitan region. It was originally designed as a planned development by the founders of the region’s first streetcar system. Much of the city’s architecture dates back to the 1910’s and 1920’s and a number of the city’s most prominent residences are registered as historic landmarks. The city’s public school system is frequently recognized for producing a large number of National Merit and National Achievement Scholars. Shaker Heights’ median household income and median housing value rank relatively low on the list of cohort communities, but are consistent with the levels observed throughout the greater Cleveland region.
University Park, Texas
Population: 23,992 Population Growth (since 2000): 2.9% Median Age: 26.1 Years Median Household Income: $164,273 Median Housing Value: $986,200
The city of University Park – the smallest in this cohort – traces much of its history to the growth of Southern Methodist University. The community’s founding is tied to the university’s charter of 1915, and the city’s relatively youthful population is dominated by the student population. The city is also now home to the George W. Bush Presidential Library, which attracts a significant number of visitors to the region each year. The city is surrounded on three sides by the City of Dallas and is therefore closely tied into the social and economic fabric of the Dallas-Fort Worth metropolitan region.

12 | COMMUNITY PROFILE AND BENCHMARK ANALYSIS
A city’s character and success are both largely defined by its residents. Their actions and perspectives determine the mix of economic, environmental, and social characteristics in the community and create the fabric that shapes its identity. Many of the advantages that the cities in this cohort experience are a direct consequence of the composition of their respective population. So, too are many of the future challenges they face.
Population Growth 2000 – 2013
You will note in the chart above that Carmel, Indiana has been excluded from this comparison. Its population growth rate of 152.9 percent is by far the largest of any of the cohort communities and therefore skews the discussion. This growth rate also influenced the total cohort average of 17 percent, which is higher than the growth rate of all but two other communities, Bellevue, Washington, and Lee’s Summit, Missouri.
Two notable conclusions can be drawn from a cursory analysis of population growth across this group of communities, both of which have to do with the influence of geography. The first is that there is a clear geographic orientation in the relative growth rates, with communities in the Northeast and Midwest experiencing significantly more modest growth than their Southern and Western counterparts. It is also unsurprising that the two communities that experienced negative growth during this period – Highland Park, Illinois, and Shaker Heights, Ohio – are Edina’s Midwestern colleagues in the cohort group. Edina’s population growth places it in the middle of the group, suggesting a certain degree of stability in its local population.
The second broad conclusion that can be drawn regarding the role of geography and population growth is that the location of the communities within their respective metropolitan regions matters a great deal. Population growth in these communities has largely occurred through two development paths. The communities have either increased their population density through in-fill development, such as in Bellevue, Washington, or have expanded their municipal boundaries through annexation, as is the case in Carmel, Indiana, and Lee’s Summit, Missouri. Those communities that experienced the lowest growth rates, including University Park, Texas had neither option available to them by virtue of being essentially landlocked by surrounding communities. Edina finds itself facing similar development challenges, though it does possess a number of opportunities to consider high-density redevelopment.
4.0 POPULATION CHARACTERISTICS
-5%
-0%
5%
10%
15%
20%
25%
30%
35%
Belle
vue,
Wash
ington
Bethe
sda,
Maryl
and
Carm
el, In
diana
Edina
, Minn
esota
Highla
nd Pa
rk, Il
linois
Lee's
Summ
it, Mi
ssou
ri
Little
ton, C
olora
do
Manh
attan
Beac
h, Ca
liforn
ia
Menlo
Park
, Cali
fornia
Newt
on, M
assa
chus
etts
Shak
er He
ights,
Ohio
Unive
rsity
Park
, Tex
as
Coho
rt Av
erage

COMMUNITY PROFILE AND BENCHMARK ANALYSIS | 13
Population and Aging
One conclusion that can be drawn from the chart above is that the majority of communities in the cohort have median ages at or slightly above the national average, with the exception of the group of four communities at the top whose median ages are at or above 40 years. The age profile of a community is determined by a number of factors, including birth rate, housing availability, and income characteristics. We shall see that the age profiles of each of the cohort communities provide both opportunities and constraints.
The impact of aging on Edina’s community character is more apparent in the chart above. While the population con-tains close to the same percentage of residents under the age of 18, the city’s 65 and older population is 6.5 per-cent above the cohort average. This is also significant higher than the national average of 13.1 percent. This suggests that both the community and economic character of the community may change significantly in response to the needs of its older residents.
University Park, Texas
Lee's Summit, Missouri
United States Average
Bellevue, Washington
Carmel, Indiana
Menlo Park, California
Newton, Massachusetts
Shaker Heights, Ohio
Manhattan Beach, California
Bethesda, Maryland
Littleton, Colorado
Edina, Minnesota
Highland Park, Illinois
0 6.25 12.5 18.75 25 31.25 37.5 43.75 50
Median Age
0.0%
10.0%
20.0%
30.0%
40.0%
50.0%
60.0%
Under 18 18 to 64 65 and Older
20.2%
54.0%
25.7%
13.7%
59.2%
27.0%
Edina, MinnesotaCohort Average
Percent of Total Population
14 | COMMUNITY PROFILE AND BENCHMARK ANALYSIS
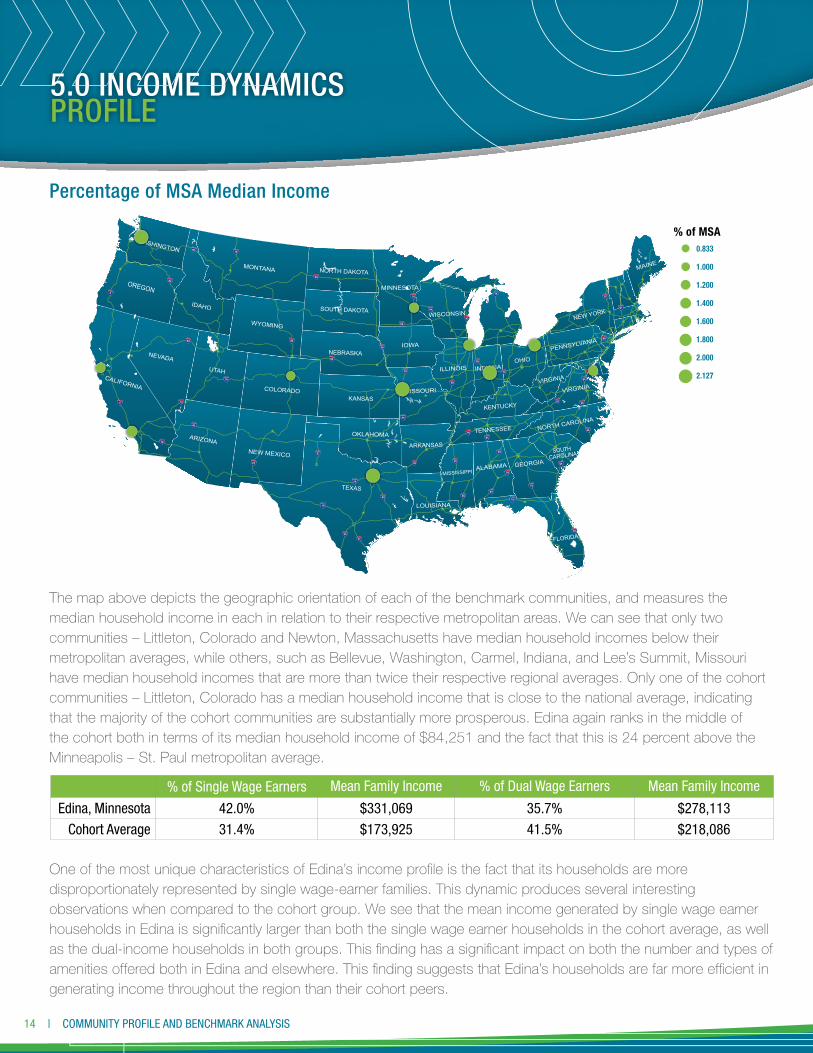
Percentage of MSA Median Income
The map above depicts the geographic orientation of each of the benchmark communities, and measures the median household income in each in relation to their respective metropolitan areas. We can see that only two communities – Littleton, Colorado and Newton, Massachusetts have median household incomes below their metropolitan averages, while others, such as Bellevue, Washington, Carmel, Indiana, and Lee’s Summit, Missouri have median household incomes that are more than twice their respective regional averages. Only one of the cohort communities – Littleton, Colorado has a median household income that is close to the national average, indicating that the majority of the cohort communities are substantially more prosperous. Edina again ranks in the middle of the cohort both in terms of its median household income of $84,251 and the fact that this is 24 percent above the Minneapolis – St. Paul metropolitan average.
One of the most unique characteristics of Edina’s income profile is the fact that its households are more disproportionately represented by single wage-earner families. This dynamic produces several interesting observations when compared to the cohort group. We see that the mean income generated by single wage earner households in Edina is significantly larger than both the single wage earner households in the cohort average, as well as the dual-income households in both groups. This finding has a significant impact on both the number and types of amenities offered both in Edina and elsewhere. This finding suggests that Edina’s households are far more efficient in generating income throughout the region than their cohort peers.
0.833
1.000
1.200
1.400
1.600
1.800
2.000
2.127
% of MSA
5.0 INCOME DYNAMICS PROFILE
% of Single Wage Earners Mean Family Income % of Dual Wage Earners Mean Family Income
Edina, Minnesota 42.0% $331,069 35.7% $278,113
Cohort Average 31.4% $173,925 41.5% $218,086

COMMUNITY PROFILE AND BENCHMARK ANALYSIS | 15
Income Composition
The above chart details the income composition of Edina and the selected cohort communities. Please note that the percentages for each group will not total to 100 percent as many households generate multiple income types. A few notable differences exist. First, we see that a far higher share of Edina households – 59 to 43.4 percent – generate at least a share of their income through investment activities. Second, a far larger share of households in the cohort group – 25.6 percent and 16.2 percent, respectively – generate income through Social Security and other forms of retirement income, such as employer-provided pensions.
This may appear to contradict an earlier observation that suggests that Edina’s population has a greater share of residents over the age of 65, and therefore a larger base of retirees. What is more likely the case is that a larger share of Edina residents have provided for their retirements through self-directed activities, such as investing, and are therefore less dependent on other forms of income. This composition is also consistent with the discussion above regarding the abnormally high number of single wage earners in Edina. It is likely that a larger number of households supplement their wage income with investment income, thereby lessening the need for many couples to generate two incomes.
0.0%
10.0%
20.0%
30.0%
40.0%
50.0%
60.0%
70.0%
80.0%
90.0%
Earnings Interest orRental Income
Social Security SSI Public Assistance Retirement
16.2%
1.2%1.6%
25.6%
43.4%
82.3%
8.7%0.0%0.7%
16.6%
59.0%
84.2%
Cohort AverageEdina, Minnesota
Share of Household Income

16 | COMMUNITY PROFILE AND BENCHMARK ANALYSIS
One thread that binds each of the cohort communities in this analysis is the pride that is taken in the quality of their respective education systems and the high level of educational attainment held by their residents. This is an especially compelling factor in attracting new residents in that each community intends to target young families as a means to future growth. The presence of a highly educated population is equally important in ensuring the economic vitality of a community as more highly educated individuals tend to earn more than their peers. The educational character of each of these communities makes them invaluable assets in the regional labor market.
Educational Attainment
The first conclusion to be drawn from the chart above is that each of the selected communities has an advanced educational attainment that far exceeds the national average of 29 percent. Further, the majority of communities, with the exception of Littleton, Colorado, and Shaker Heights, Ohio have measures which are at least twice the national average. Edina ranks second among the communities, trailing only Carmel, Indiana. What tends to distinguish communities with this level of educational attainment and others outside of the peer group is a relative ease of access to colleges and universities. Two of the peer communities are home to major research universities – Newton, Massachusetts, and University Park, Texas. Others, including Edina, are located in metropolitan regions with unusually high concentrations of colleges and universities per capita. Access to these institutions also has a positive impact on the performance of the peer communities’ school systems, many of which have been recognized nationally for their level of excellence.
6.0 EDUCATION & OCCUPATION DYNAMICS
Littleton, ColoradoHighland Park, Illinois
Edina, MinnesotaBethesda, Maryland
Manhattan Beach, CaliforniaShaker Heights, Ohio
Newton, MassachusettsMenio Park, California
Carmel, IndianaBellevue, Washington
Lee’s Summit, MissouriUniversity Park, Texas
0.0% 10.0% 20.0% 30.0% 40.0% 50.0% 60.0% 70.0% 80.0% 90.0%72.7%
68.0%67.6%
83.7%75.0%
65.6%42.0%
68.5%65.6%
82.9%61.8%
42.9%
Percent with Bachelor’s Degree or Higher

COMMUNITY PROFILE AND BENCHMARK ANALYSIS | 17
Average Earnings of Individuals with Bachelor’s Degree or Higher
The above chart builds upon the discussion of high-performing communities to once again consider the role that earnings and income play with respect to educational attainment. We see here that there is a nearly exact correlation between the percentage of individuals with baccalaureate degrees and their relative earnings. The City of Edina fares quite well on this measure as the only community with average earnings over $100,000, a level that is nearly twice the national average of $57,807. The earnings levels of these highly educated residents are largely dependent on access to employment opportunities throughout their respective regions.
Littleton, ColoradoHighland Park, Illinois
Edina, MinnesotaBethesda, Maryland
Manhattan Beach, CaliforniaShaker Heights, Ohio
Newton, MassachusettsMenio Park, California
Carmel, IndianaBellevue, Washington
Lee’s Summit, MissouriUniversity Park, Texas
$0 $20,000 $40,000 $60,000 $80,000 $100,000 $120,000$98,681.00
$82,881.00$71,840.00
$90,208.00$75,490.00$76,352.00
$58,725.00$71,057.00
$66,445.00$108,984.00
$78,479.00$59,194.00

18 | COMMUNITY PROFILE AND BENCHMARK ANALYSIS
Employment by Occupation Group
It once again appears that Edina is fairly matched with its cohort communities when examining the distribution of employment among its residents by occupation. It is important to note here that the data presented above reflects how the residents in the respective groups are employed – not the job distribution within the communities. This is an important distinction since relatively few residents in either Edina or any of the other peer communities live and work in the same place.
Edina has a slightly larger share of individuals in so-called “professional occupations,” such as management and sales, and far lesser shares of other occupational groups when compared to the cohort average. This distributional pattern aligns closely with that of the Minneapolis – St. Paul region which has a share of manufacturing employment roughly equivalent to the national average, for example, and a higher share of educational and health services employment. These distinctions are particularly important as they reflect the range of employment options available to Edina’s residents.
0%
10%
20%
30%
40%
50%
60%
70%
Management,Business,
Science, andArts Occupations
ServiceOccupations
Sales and OfficeOccupations
Natural Resources,Construction,
and MaintenanceOccupations
Production,Transportation,
and MaterialMoving Occupations
2.7%1.7%
25.3%
7.8%
62.5%
4.3%2.9%
21%
10.2%
61.6%
Edina, MinnesotaCohort Average
Share of All Residents
6.0 EDUCATION & OCCUPATION DYNAMICS

COMMUNITY PROFILE AND BENCHMARK ANALYSIS | 19
Average Annual Income by Occupation Group
The average earnings data presented above are again consistent with the occupational distribution of the respective regions. Edina once again reports average earnings in a number of key occupational groups that exceed the cohort average. Earnings in management, business, science, and arts occupations are among the highest in the peer communities, with only Carmel, Indiana ($105,133) ranking higher. The one observation that is somewhat surprising is the average earnings reported by individuals in service occupations. What is important to note here is that there is a high number of part-time workers within this occupational group, both in Edina, and throughout the peer communities, and that a number of occupations within this group report average earnings that are well above this level.
$0
$20,000
$40,000
$60,000
$80,000
$100,000
$120,000
Management,Business, Science,
and Arts Occupations
ServiceOccupations
Sales and OfficeOccupations
Natural Resources,Construction,
and MaintenanceOccupations
Production,Transportation,
and MaterialMoving Occupations
$21,
667
$52,
232
$43,
345
$5,8
38
$102
,533
$32,
271
$42,
320
$41,
552
$17,
052
$80,
778
Edina, MinnesotaCohort Average

20 | COMMUNITY PROFILE AND BENCHMARK ANALYSIS
There are three principle factors that prospective residents take into consideration when evaluating a community’s housing stock. They are generally most interested in availability, affordability, and quality. This is especially true of young professionals who value ease of access to amenities and an effective work-life balance. Each of the communities in the peer group prides itself on its reputation as a “destination city.” There are substantial differences both in the ability of each of these communities to attract new residents, as well as the types of individuals who are drawn there.
Median Housing Value – 2013
A number of regional differences are on display in the housing value data presented above. All of the communities in the cohort have median housing values well above the national average. However, the median housing values in the Midwestern communities of Carmel, Indiana, Edina, Minnesota, Highland Park, Illinois, Lee’ Summit, Missouri, and Shaker Heights, Ohio are all significantly less than that of those communities found in the Northeast, South, or West. This is generally reflective of the income dynamics in these regions, as well as the general cost of living, which tends to be far lower in the Midwestern United States regardless of the relative size of the metropolitan region in question. In each instance, the median housing value of the respective communities ranks in the upper third of values in communities within their region. This again suggests that each of these communities has the ability to attract residents with a certain degree of affluence.
Two other observations regarding the condition of Edina’s housing market are worthy of note. First, the community has a relatively smaller share of homes built before 1940 than the national average (6.6% versus 13.7%). This disparity is typical of communities that experienced their most significant growth following World War II. Second, the city has a slightly higher percentage of multi-unit structures than either the national or cohort average (43.1% versus 38.3% and 40.8%, respectively). This suggests that the city does possess a larger variety of housing options than other cities of its size or stature.
7.0 HOUSING & MIGRATION CHARACTERISTICS
Bellevue, WashingtonBethesda, Maryland
Carmel, IndianaEdina, Minnesota
Highland Park, IllinoisLee's Summit, Missouri
Manhattan Beach, CaliforniaMenlo Park, California
Newton, MassachusettsShaker Heights, Ohio
University Park, TexasLittleton, Colorado
United States Average
$0 $200,000 $400,000 $600,000 $800,000 $1,000,000$181,400
$267,400$986,200
$231,400$687,300
$1,000,000$1,000,000
$185,100$521,700
$390,000$293,600
$805,900$541,600

COMMUNITY PROFILE AND BENCHMARK ANALYSIS | 21
Issues of housing value and availability are certainly of importance to the present residents of each of these communities. They are, however, of even greater importance to prospective residents. The following section examines the role that migration plays in shaping the character of the cohort communities.
Migration by Former Residence 2008 – 2012
Population migration is principally categorized by an individual’s previous residence. The chart above presents three distinct points of origin – within county, within state, and out of state, which includes international migration – for each of the peer communities. The data is presented in terms of percentages rather than gross counts in order to account for differences in population size. A number of interesting observations can be drawn. The first is that Edina draws a higher share of residents both from other communities within Hennepin County and other states. This suggests that the city is relatively more effective than other communities in the peer group in attracting residents. The second conclusion is that only one community – Littleton, Colorado is particularly effective at attracting residents from within Colorado. This confirms, in part, the Denver region’s status as a notable draw for new residents.
Littleton, Colorado
University Park, Texas
Shaker Heights, Ohio
Newton, Massachusetts
Menlo Park, California
Manhattan Beach, California
Lee’s Summit, Missouri
Highland Park, Illinois
Edina, Minnesota
Carmel, Indiana
Bethesda, Maryland
Bellevue, Washington
0.0% 2.8% 5.6% 8.4% 11.2% 14.0%5.2%
6.2%
5.8%
12.2%
12.1%
4.6%
9.1%
6.6%
7.9%
7.9%
8.4%
7.1%
4.3%
1.5%
0.6%
4.7%
1.6%
2.4%
5.7%
4.1%
1.8%
2.5%
0.6%
8.8%
3.4%
2.8%
5.5%
7.2%
4.0%
2.4%
4.5%
3.9%
2.5%
2.4%
1.7%
3.3%
Moved from Different State Moved Within State Moved Within County
Shar
e of
New
Res
iden
ts

22 | COMMUNITY PROFILE AND BENCHMARK ANALYSIS
7.0 HOUSING & MIGRATION CHARACTERISTICS
Migration by Age Group
Population migration can also be classified by residents’ age. Again, a number of significant differences exist when comparing Edina to the communities in the cohort group. The most obvious disparity is found in the number of 18-24 year old residents moving into the respective communities. Residents in this age group are attracted to Edina by employment opportunities in retail trade and health care, as well as the diversity of colleges and universities in the broader Twin Cities region. Only Manhattan Beach, California (62.4%) has a higher share of its new residents located in this age group. These residents are quite likely to leave their respective communities following their studies. Other significant differences exist in comparisons of the 25 to 34 and 35 to 44 year old age groups. University Park, Texas attracts the highest relative share of residents in each of these age groups (33.7% and 25.3%, respectively). The disparity in each of these groups is significant as the 25 to 44 year old population represents the most attractive cohort in terms of career and family formation.
The average age of new residents in each of the peer communities varies slightly, but is generally close to each community’s median age. This is skewed slightly younger in Edina (29.2 years) due to the previously discussed disparities. The importance of new resident attraction to each of these communities to both stabilize the population and ensure continued prosperity is clearly recognized by leaders throughout.
0%
5%
10%
15%
20%
25%
30%
35%
40%
45%
18-24 25-34 35-44 45-54 55-64 65and Older
6.1%5.3%
8.4%
15.3%
24.9%
19.3%
1.9%3.3%
6.5%
12.3%
8.2%
41.8%
Cohort AverageEdina, Minnesota
Share of New Residents

COMMUNITY PROFILE AND BENCHMARK ANALYSIS | 23

24 | COMMUNITY PROFILE AND BENCHMARK ANALYSIS
Average Commute TimeEach of the previous metrics presented suggested that the communities in this cohort are completely connected to the larger metropolitan regions where they are located. Nowhere else does this appear or affect than in reviewing the ease by which the residents of the communities can travel to work or to enjoy any of the amenities provided by their regions. Commuting time and distance is often an important consideration of homebuyers when considering a new community. Inner ring suburbs, such as Edina have a considerable advantage in this regard as they are usually connected to the central business district (CBD) of the neighboring larger city via city streets, public transportation, or other convenient means. Access to a variety of transportation options, including biking and walking paths is also important to many young professionals.
Edina has the second lowest average commute time among the peer communities, trailing University Park, Texas (17.1 minutes). This disparity is easily explained by examining the location of each of the cities in proximity to their respective central business districts. University Park is located approximately four miles from the Dallas CBD, whereas Edina is located eight miles from the Minneapolis CBD. Similarly, nearly 47 percent of University Park’s working population both lives and works within the city limits, with the majority being employed by Southern Methodist University. Conversely, only 14.2 percent of Edina resident enjoys the same lifestyle.
78.6 percent of Edina’s residents have an average daily commute time of 30 minutes or less, while only 63.1 percent of the cohort communities enjoy a similar advantage. Each of the metropolitan region’s in the cohort analysis experience between four and six hours of peak congestion daily, with both the Los Angeles and San Francisco metropolitan areas experiencing over eight hours of congested travel. Residents in inner ring suburbs are largely able
8.0 COMMUTING & TRANSPORTATION DYNAMICS
0
5
10
15
20
25
30
Bellevue, W
ashington
Bethesd
a, Mary
land
Carmel,
Indiana
Edina, Minneso
ta
Highland Park
, Illinois
Lee's S
ummit, Misso
uri
Manhattan Beac
h, Californ
ia
Menlo Park
, Californ
ia
Newton
, Mass
achuset
ts
Shaker Heig
hts, Ohio
Universit
y Park
, Texas
Littleto
n, Colorad
o
United State
s Aver
age
25.424.8
17.1
22.9
26.4
21.8
27.524.6
29.9
20.4
24.7
29.2
21.8
Aver
age
Min
utes
to W
ork

COMMUNITY PROFILE AND BENCHMARK ANALYSIS | 25
to avoid the most congested roadways due to their proximity to the central city. Public transportation usage in each of the peer communities is below the national average of 1.2%, with the exception of Edina (3.8%), Menlo Park, California (4.3%) and Newton, Massachusetts (12.6%).
A final aspect of commuting behavior that has a significant bearing on a community’s economic character is the daily inflow and outflow of workers in a community. Over 47,000 workers are employed by the more than 6,800 businesses in Edina, with a vast majority of these workers commuting into the city from elsewhere. This is a fairly normal pattern among each of the peer communities as their residents are fully integrated into regional labor markets.
Commuting Patterns of Edina
The impact of this commuting pattern is also observed in the disparity in earnings generated by in-commuters and out-commuters. Sixty percent of out-commuters earn at least $3,333 per month, while only 49.2 percent of those who commute into Edina do. Similarly, the combined earnings of those who live in Edina and work elsewhere is nearly three times the combined earnings of those commuting into Edina daily. This disparity is only surpassed by Bellevue, Washington, and Menlo Park, California. This further suggests that Edina is perhaps more effective in taking advantage of the economic vitality of the Minneapolis-St. Paul metropolitan region than the other peer communities.

26 | COMMUNITY PROFILE AND BENCHMARK ANALYSIS
The benchmark analysis presented here suggests that Edina, Minnesota is both a highly attractive and competitive community when compared to a body of its peers, and that it shares many of the challenges faced by inner ring suburbs in the United States. Communities of all sizes have witnessed unprecedented changes and opportunities in the last thirty years as the global economy has evolved and the nation’s population has aged at an historic rate. A variety of lessons are continuing to be learned as cities confront each of these challenges, and many of these same lessons shape the conversation that is taking place in Edina.
Edina can boast a highly educated and prosperous population that is intimately tied to the Minneapolis-St. Paul metropolitan region. It can also point to the commitment that it has placed on its education system as a key draw for new families into the community. Finally, it is clear that a certain level of prosperity exists here that may not be present elsewhere, and that this is reflected in the numerous amenities provided for its residents. Edina is a community that can certainly be proud of its accomplishments.
There are also a number of challenges presented in these findings. The city does attract a large number of new residents each year. However, it does not do as well as its peers in attracting the key 25 to 44 demographic that is so highly sought. Much of this can be accounted for by the intense rivalry that exists in the communities throughout the region to attract young families to support school enrollment and property values. The community does see a number of young people come into the city each year. Conversations might emerge as to how to effectively retain this student population after graduation.
The aging of the city’s population is also of some concern, principally as it is occurring more rapidly than the nation, as a whole. This is not an uncommon phenomenon as it is shared by most of the communities in the peer group. One area where the community might look for improvement is in the development of a stronger sense of work-life balance within the city. There are no clear answers or “best practices” as to how to address what is an unprecedented trend. Rather, the challenge presented to Edina and other communities is how to balance development and public investments to create active communities that meet the needs of both the young and the old.
9.0 CONCLUSION

COMMUNITY PROFILE AND BENCHMARK ANALYSIS | 27
10. References and Technical NotesThe data contained within this community profile and benchmark analysis was derived from a number of publicly-available sources. This decision was intentional to both ensure transparency within the findings, as well as to allow for replication of the results.
The population, migration, and housing data contained throughout was generated from the 2000 Decennial Census of the Population and the 2008-2012 Five-Year Sample of the American Community Survey as published by the United States Census Bureau, United States Department of Commerce. The datasets contain a wealth of data on population demographics and are updated annually. Data can be found at http://www.census.gov.
Income data was initially compiled using Census data but was later cross-checked and verified against personal income data for 2013 compiled by the Bureau of Economic Analysis, United States Department of Commerce. This and a variety of other data sets can be found at http://www.bea.gov.
Occupational employment data presented represents an amalgamation of Census data and a special estimate of the May 2013 Occupational Employment Statistics Survey, as published by the Bureau of Labor Statistics, United States Department of Labor. This data, as well as a host of other labor market information can be obtained at http://www.bls.gov.
Finally, data on average commute times and commuting sheds was compiled through two sources. Commute time data was estimated by the Texas A&M Transportation Institute as part of its annual Urban Mobility Report series. This report can be found at http://mobility.tamu.edu/ums/. Data on employment-related commuting behavior is reported as part of the United States Census Bureau’s Local Employment – Household Dynamics program. A handy source for accessing this information is the OnTheMap tool, which can be found at http:// http://onthemap.ces.census.gov/.
11. For More InformationFor more information on this report and its methodology, please contact
David Beurle, CEO Future iQ Partners
Tel: +1 715 559 5046 Email: [email protected]
www.future-iq.com
