community socioeconomic profile wayne county, west virginia march 27, 2007
TRANSCRIPT

Community Socioeconomic ProfileCommunity Socioeconomic Profile
Wayne County, West VirginiaWayne County, West Virginia
March 27, 2007March 27, 2007

Purpose of the Socioeconomic Purpose of the Socioeconomic WorkshopWorkshop
Provide an informal way for local communities to talk about important economic growth factors in the region
– Help local community leaders better understand their economy & community
– Qualitatively assess the area’s potential for different types of economic development
– Discuss local visions for a desired future – Brainstorm how local leaders and agencies, such as the BLM,
can support community efforts to achieve community economic development goals
– Provide an opportunity for the public, local organizations, agencies, and government to offer comments and concerns regarding the project and/or social and economic issues

Socioeconomics: OverviewSocioeconomics: Overview
Socioeconomic resources are resources that provide social or economic value to local and regional communities.
Socioeconomic indicators include:– Demographics – population, age, sex, ethnicity, marital status,
etc.– Housing – numbers of units; ownership; vacancy rate– Schools – enrollment and capacity– Employment – labor sectors; labor force; unemployment– Income– Earnings– Local Services– Social Values– Environmental Justice – minority and low-income populations

Population Projections
USA Population Projections
281,421,906
295,507,134
322,365,787
335,804,546
308,935,581
250,000,000
260,000,000
270,000,000
280,000,000
290,000,000
300,000,000
310,000,000
320,000,000
330,000,000
340,000,000
1 2 3 4 5
Year
Pop
ulat
ion
2000 2005 2010 2015 2020

Population Projections
West Virginia Population Projections
1,808,344
1,746,336
1,769,081
1,796,311
1,826,389
1,700,000
1,720,000
1,740,000
1,760,000
1,780,000
1,800,000
1,820,000
1,840,000
1 2 3 4 5
Year
Popu
latio
n
2000 2005 2010 2015 2020
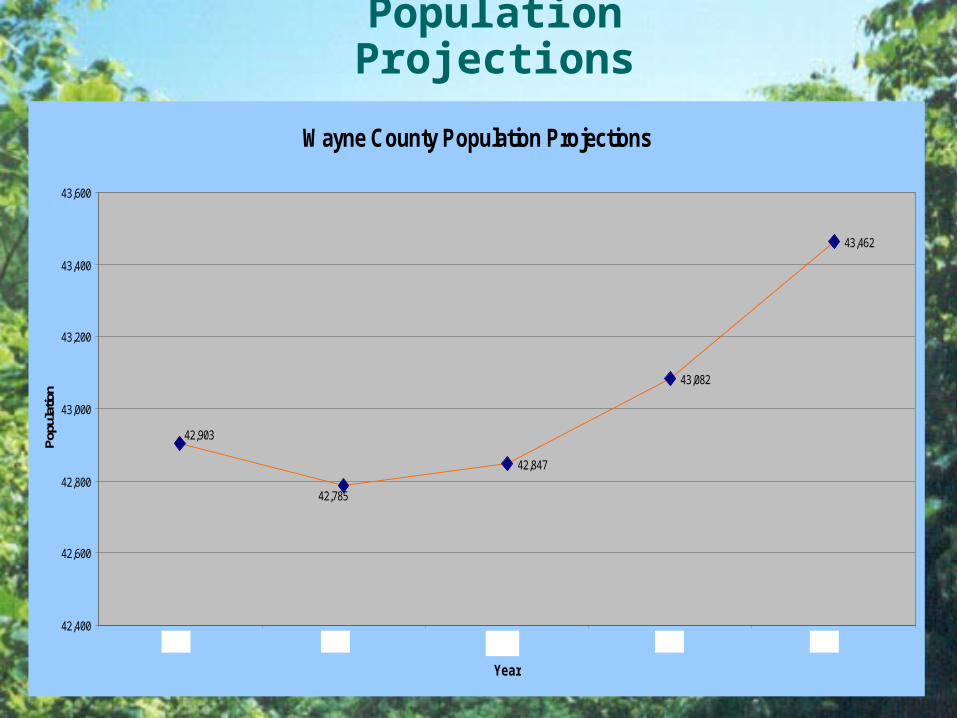
Population Projections
Wayne County Population Projections
42,847
43,082
43,462
42,903
42,785
42,400
42,600
42,800
43,000
43,200
43,400
43,600
1 2 3 4 5
Year
Popu
latio
n
2000 2005 2010 2015 2020
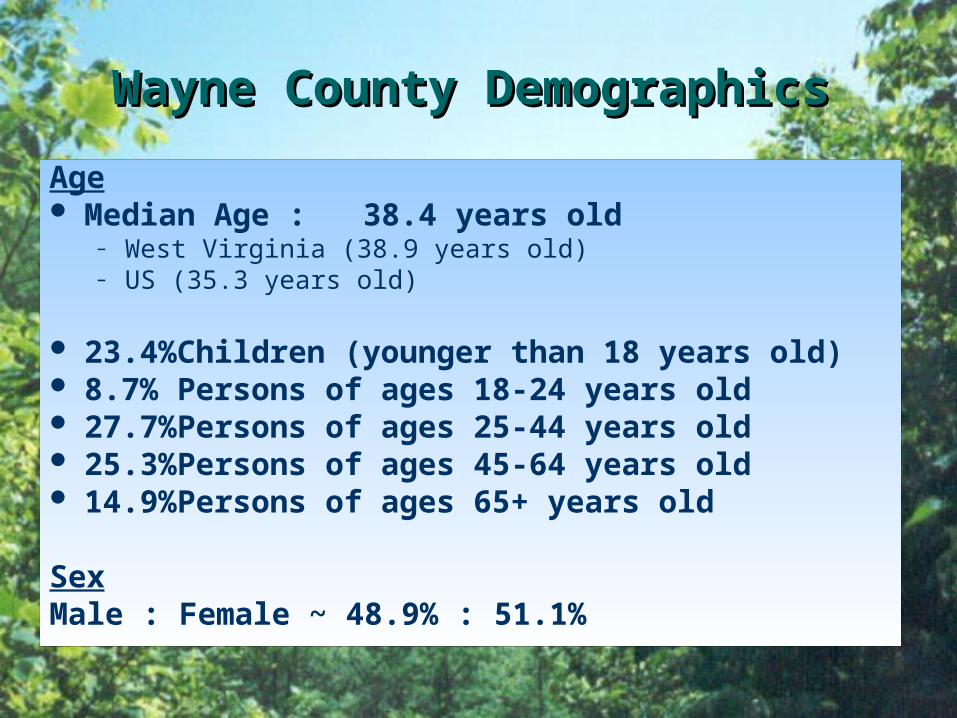
Wayne County DemographicsWayne County Demographics
Age Median Age : 38.4 years old
– West Virginia (38.9 years old)– US (35.3 years old)
23.4% Children (younger than 18 years old) 8.7% Persons of ages 18-24 years old 27.7% Persons of ages 25-44 years old 25.3% Persons of ages 45-64 years old 14.9% Persons of ages 65+ years old
SexMale : Female ~ 48.9% : 51.1%

Housing Estimates
1990 2000
Region Housing Units
Vacancy Rate
Persons Per Household
Housing Units
Vacancy Rate
Persons Per Household
Housing Units
Percent Change
Wayne County
15,626 1.3% 2.66 19,107 1.5% 2.48 20.9%
West Virginia
688,577 2.2% 2.55 844,623 2.2% 2.40 22.7%
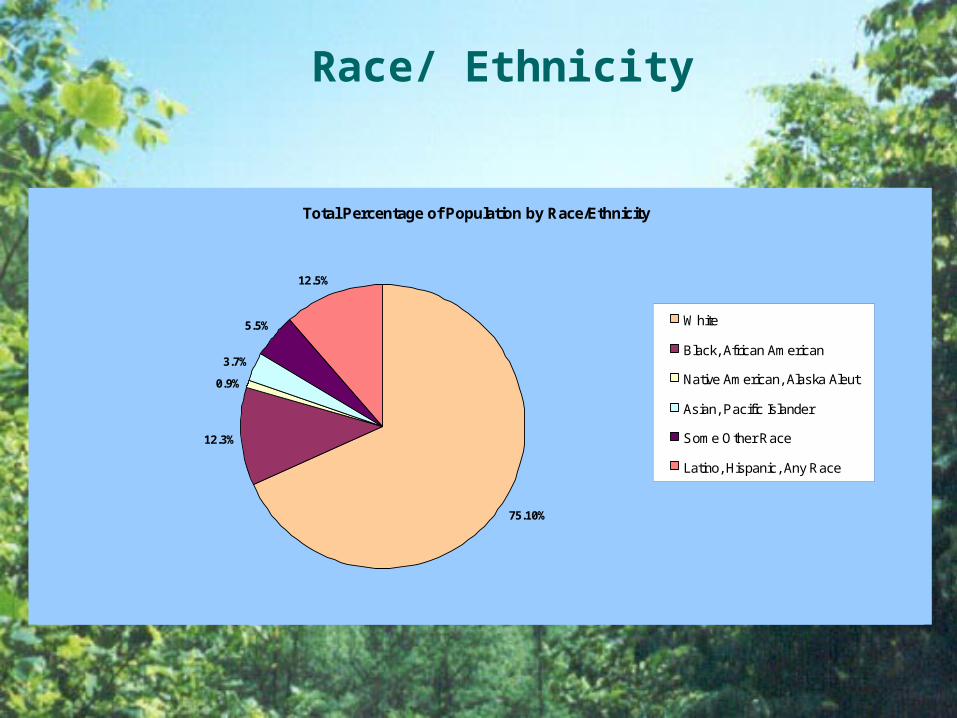
Race/ Ethnicity
Total Percentage of Population by Race/Ethnicity
75.10%
12.3%
0.9%
3.7%
5.5%
12.5%
White
Black, African American
Native American, Alaska Aleut
Asian, Pacific Islander
Some Other Race
Latino, Hispanic, Any Race
Total Percentage of Population by Race/Ethnicity
75.10%
12.3%
0.9%
3.7%
5.5%
12.5%
White
Black, African American
Native American, Alaska Aleut
Asian, Pacific Islander
Some Other Race
Latino, Hispanic, Any Race

Income & Poverty Level
Region Median Household
Income
Per Capita Income
Percent of Population Living in
Poverty (2000)
Percent of Population Living in
Poverty (1990)
Wayne County $27,352 $14,906 19.6% 21.8%
West Virginia $29,696 $16,477 17.9% 19.7%

Employment
West Virginia Employment
0
100000
200000
300000
400000
500000
600000
700000
800000
Employed Persons (1990) Employed Persons (2000) Unemployed Persons (1990) Unemployed Persons (2000)
Employment Status
Num
ber
of P
erso
ns
671,085
732,673
9.6%
71,142 58,021
7.3%

Employment
Wayne County Employment
0
2000
4000
6000
8000
10000
12000
14000
16000
18000
Employed Persons (1990) Employed Persons (2000) Unemployed Persons (1990) Unemployed Persons (2000)
Employment Status
Num
ber
and
Per
cent
age
of P
erso
ns
10.5%
14,598
16,184
6.6%
1,703 1,146

Industry Sector Employment
Wayne County Employment by Industry Sector
481 630
1,149
2,561
1,679
3,209
553
4,238
574
2,174
2,839
6,461
443
1,022
1,541
657 683
0
1000
2000
3000
4000
5000
6000
7000
Industry Sector
Num
ber E
mpl
oyed
1990
2000

Wayne Employment by Industry Sector and Average Sector Wayne Employment by Industry Sector and Average Sector GrowthGrowth

Industry Sector EmploymentIndustry Sector Employment

Major Employers
Wayne County Wayne County include
Wayne County Community Services, Inc.
Wayne County Commission, Ballard’s Farm and Sausage Inc.
Wayne High School Wayne Continuous Care
Center Human Services
Department, Wayne Middle School
Wayne County Board of Education
Huntington-Ashland, WV-KY-OH MSA
St. Mary’s Medical Center Marshall University Cabell Huntington Hospital CSX Huntington GC Services Special Metals Virginia Medical Center Alcon Manufacturing Ltd US Army Corps of
Engineers

West Virginia Coal FactsWest Virginia Coal Facts
Since 1863, the State has mined nearly 13 billion tons of coal, and it mined 159.5 million tons of coal in 2005, 98.6 million tons of which came from underground operations.
Coal mining and its related support activities are the dominant economic activity in West Virginia, as WV is the second largest coal-producing state and a lead exporter of the US.
Coal mining accounts for $3,500,000,000 (13%) of West Virginia’s total gross state product.
Taxes collected on coal production in West Virginia totaled more than $280,000,000 to state, county, and local budgets in 2005.
The coal industry and coal-fired electricity industry account for 60 percent of all business taxes collected in West Virginia.

West Virginia Coal Facts (Cont…)West Virginia Coal Facts (Cont…)
The West Virginia coal industry paid nearly one billion dollars ($1,000,000,000) in annual direct wages in 2004.
West Virginia coal miners are among the highest paid workers in the state, earning an average annual salary of over $50,000, nearly twice the average statewide salary for all workers.
Every coal mining job results in the creation of between six to eight positions in other sectors of the economy (Marshall University).
Every dollar’s worth of coal production supports an additional 52 cents in sales in other sectors of the state economy (Marshall University).
Wayne County Coal FactsWayne County Coal Facts
In Wayne County, coal mining accounted for 16.2% of the total employment and 8.6% of total earnings in the county.
According to West Virginia’s Office of Miner’s Health Safety and Training, 422 coal miners were employed in Wayne County in 2005 and earned a total direct wage salary of $26,473,800 per year in producing a total of 5,004,384 million short tons of coal from six different mines.
In coal production, Wayne County ranked 11th out of the 28 coal-producing counties in the state.

Coal and the EconomyCoal and the Economy
90% of West Virginia’s mineral tax receipts come from coal production.
7% is apportioned among the state’s 55 counties, of which 3/4 is divided among the coal-producing counties based on the individual county’s coal production rates.
The benefits of coal taxes are then realized through additional revenue available for social and public services.
In 2005, total tax collections on coal amounted to more than $280,000,000.
A total of $16,669,890 was distributed to all 55 counties, of which $11,242,408 was returned to the state’s coal-producing counties.
In 2005, West Virginia collected $431,745 as result of Wayne County’ coal production.
Local and municipal governments within Wayne County received $22,706 of coal tax distributions in 2005.

Socioeconomic Considerations & Socioeconomic Considerations & ConclusionsConclusions
Most lifestyles of the planning area residents are associated with place and community, as well as with natural resource development, such as mining.
Stakeholder Examples
• Local Communities, community organizations, community leaders• Recreationalists• Environmentalists • Non-profit organizations• Business owners• People with commercial interests• People with political and social interests• Local and state government officials
Conclusions’ Development• Economic growth • Visions for the future of the community• Concerns regarding social and economic affairs related to the community• Opinions or Issues regarding the effects of the project on SE resources

Q & AQ & ADiscussionDiscussion