community survey of young victorians’ resilience and
TRANSCRIPT

Title1 VicHealth 1vichealth.vic.gov.au
Melissa Weinberg PhD and Adrian Tomyn PhD
Community survey of young Victorians’ resilience and mental wellbeing
Full Report: part A and part B

z
Victorian Health Promotion Foundation PO Box 154 Carlton South Victoria 3053 Australia T +61 3 9667 1333 F +61 3 9667 1375
[email protected] vichealth.vic.gov.au twitter.com/vichealth facebook.com/vichealth
© VicHealth 2015 October 2015 P-MW-235
VicHealth acknowledges the support of the Victorian Government.
Community survey of young Victorians’ resilience and mental wellbeing
Part A: the report
Melissa K Weinberg, PhD and Adrian J Tomyn, PhD

Acknowledgements
This report has been written by Melissa Weinberg, PhD, Australian Centre on Quality of Life, Deakin
University and Adrian Tomyn, PhD, Managing Director, Tomyn Research, Australian Centre on Quality
of Life, Deakin University Cairnmillar Institute.
© VicHealth 2015
June 2015 P-MW-235
Suggested citation:
Community survey of young Victorians’ resilience and mental wellbeing. Full report: part A and part B,
Victorian Health Promotion Foundation, Melbourne, Australia

About the authors
Melissa K Weinberg, PhD. Melissa holds a PhD in psychology and is the Principal Research Fellow of
the Australian Centre on Quality of Life. She is an Honorary Fellow of Deakin University and the
Project Manager of the Australian Unity Wellbeing Index.
Melissa is a TEDx speaker and appears regularly in various media outlets, speaking on subjective
wellbeing and the science of happiness. She is also a provisional psychologist, specialising in the
application of wellbeing to sport and performance contexts.
Melissa believes in the power of psychoeducation to empower others, engender understanding and
effect change, and her key areas of research interest include subjective wellbeing, happiness studies,
intergenerational trauma, sport and exercise psychology, attachment and resilience. Her expertise
extends to the measurement, evaluation and interpretation of subjective wellbeing and quality of life
data.
Contact: [email protected]
Adrian J Tomyn, PhD. Adrian is the Managing Director of Tomyn Research, a Melbourne-based
research and consulting organisation that offers specialist services in the area of mental health and
wellbeing. He is also a Senior Lecturer in Psychology (Cairnmillar Institute), an Honorary Fellow
(Deakin University) and a Primary Researcher (Australia) with the Australian Centre on Quality of Life
and with the International Wellbeing Group.
Adrian holds a PhD in psychology and his research expertise is in the areas of quality of life and
subjective wellbeing, including theoretical and measurement issues, scale development,
psychometric assessment, normative group comparisons, quantitative research methodology and
adolescent subjective wellbeing assessment.
Adrian has published his research in the form of international peer-reviewed journal articles as well
as major empirical reports for government departments and organisations.
Contact: [email protected]

Contents
Report highlights .......................................................................................................................... 7
Executive summary ...................................................................................................................... 9
Subjective wellbeing ........................................................................................................................ 9
Resilience ......................................................................................................................................... 9
The current study .......................................................................................................................... 10
Results summary ........................................................................................................................... 10
Introduction ............................................................................................................................... 14
Objective versus subjective quality of life ..................................................................................... 14
Subjective wellbeing ...................................................................................................................... 14
Subjective Wellbeing Homeostasis Theory ................................................................................... 15
Measuring subjective wellbeing: the Personal Wellbeing Index ................................................... 15
Interpretation of subjective wellbeing data .................................................................................. 16
Resilience ....................................................................................................................................... 16
Measuring resilience: the 10-item Connor-Davidson Resilience Scale (CD-RISC 10) .................... 16
Methodology ................................................................................................................................. 17
Procedure ...................................................................................................................................... 19
Data cleaning and preparation ...................................................................................................... 19
Data analytic strategy and presentation of the results ................................................................. 19
Psychometric evaluation of key variables .................................................................................... 21
Overall results ............................................................................................................................ 24
Gender, subjective wellbeing, and resilience ............................................................................... 27
Age, subjective wellbeing, and resilience .................................................................................... 29
Marital status, subjective wellbeing, and resilience ..................................................................... 31
Household composition, subjective wellbeing, and resilience ...................................................... 32
Education status and subjective wellbeing .................................................................................. 33
Work status and subjective wellbeing ......................................................................................... 35
Income status and subjective wellbeing ...................................................................................... 37
Perceived social support among Victorian youths ........................................................................ 38
Negative affectivity in Victorian youths ....................................................................................... 39
High and low wellbeing/resilience groups ................................................................................... 42
General discussion, research implications and limitations ........................................................... 44

Study aims...................................................................................................................................... 44
Overall results for subjective wellbeing ........................................................................................ 44
Psychometric assessment of CD-RISC 10 ....................................................................................... 45
Demographic and other subgroup analyses .................................................................................. 45
Study limitations and future research opportunities .................................................................... 46
Conclusions .................................................................................................................................... 46
References ................................................................................................................................. 48
Appendix A: Survey questionnaire .............................................................................................. 50

Tables
Table 1: Participant demographics ........................................................................................................ 17
Table 2: Means, standard deviations and correlations between variables and inter-item reliability .. 21
Table 3: Suggested guidelines for the interpretation of single-item measures of ‘lonely’; ‘stressed’
and ‘anxious’ based on their impact on personal wellbeing ................................................................. 41
Figures
Figure 1: Principal Components factor analysis of the CD-RISC 10 ....................................................... 22
Figure 2: Average ratings for CD-RISC 10 items ranked from highest to lowest ................................... 22
Figure 3: Average PWI Scores for each CD-RISC 10 category ................................................................ 23
Figure 4: Comparison between Youth Connections and Mainstream SWB data.................................. 24
Figure 5: Average scores for key variables of interest .......................................................................... 25
Figure 6: Distribution of Victorian youths in each PWI group compared to adult normative data ...... 26
Figure 7: Average SWB and Resilience of male and female respondents ............................................. 27
Figure 8: Distribution of males and females in each PWI group ........................................................... 27
Figure 9: Average SWB and resilience of Victorian youth in each age group ....................................... 29
Figure 10: Domain scores x age groups ................................................................................................. 30
Figure 11: PWI distribution for young people in each age group ......................................................... 30
Figure 12: Average SWB and Resilience of Victorian youths according to marital status .................... 31
Figure 13: Average SWB of Victorian youth according to their household composition...................... 32
Figure 14: Average SWB and Resilience of students and non-students ............................................... 33
Figure 15: Average SWB and resilience of students studying at various institutions ........................... 34
Figure 16: Average SWB and Resilience among young Victorians according to work status ............... 35
Figure 17: Average SWB among young Victorians in each age group who are looking for work ......... 36
Figure 18: Average SWB and Resilience among young Victorians by household income category
compared to adult normal range .......................................................................................................... 37
Figure 19: Average SWB and Resilience and perceived social support ................................................. 38
Figure 20: The relationship between SWB and general feelings of loneliness ..................................... 39
Figure 21: The relationship between SWB and general feelings of stress ............................................ 40
Figure 22: The relationship between SWB and general feelings of anxiety.......................................... 40
Figure 23: Groups with higher than normal SWB and corresponding resilience scores ....................... 42
Figure 24: Groups with lower than normal SWB and corresponding resilience scores ........................ 43

Community survey of young Victorians’ resilience and mental wellbeing. Part A: the report 7
Report highlights
This is the first study to:
1. empirically validate a shortened version of the Connor-Davidson Resilience Scale (CD-RISC 10) in
a sample of young Victorians
2. bridge the gap between subjective wellbeing (SWB) and resilience research by clarifying the link
between SWB scores – measured using the Personal Wellbeing Index (PWI) – and resilience
scores – measured using the CD-RISC 10
3. clarify the relationship between SWB and the three negative affective traits of loneliness, stress
and anxiety, and suggest evidenced-based guidelines for interpreting these affects.
Key findings
While the overall sample mean for SWB was within the normal range for Australian adults,
analyses reveal differences in personal wellbeing and resilience among different subgroups.
○ Young people with above-average wellbeing:
■ are from higher-income households
■ live with a partner and children / partner and parents
■ participate in sport/recreation
■ have high access to social support when in need.
○ Young people with below-average wellbeing:
■ have limited access to social support when in need
■ are from lower-income households
■ are looking for work and aged 22–25 years
■ live alone.
Loneliness has been identified as a major threat to personal wellbeing and appears to have a
more detrimental association with wellbeing at lower levels of intensity than stress or anxiety
does.
High-school students have higher personal wellbeing than university and TAFE students, but
lower resilience scores.

Community survey of young Victorians’ resilience and mental wellbeing. Part A: the report 8
Glossary
Subjective wellbeing (SWB). The scientific term for mood happiness and the construct measured by
the Personal Wellbeing Index (PWI). SWB reflects a person’s level of happiness or satisfaction with
their life and is synonymous with ‘personal wellbeing’.
Personal wellbeing or wellbeing. Synonymous with subjective wellbeing.
the Personal Wellbeing Index (PWI). The measure of SWB. The PWI comprises seven domains rated
on an 11-point, end-defined, ‘Not at all satisfied’ to ‘Completely satisfied’ scale. The seven domains
are averaged to form a single composite variable, standardised onto a 0 to 100-point scale.
Subjective Wellbeing Homeostasis Theory or SWB Homeostasis Theory. This theory proposes that
SWB is actively maintained and defended around a ‘set-point’, in much the same way as body
temperature.
Subjective wellbeing homeostasis. The process that keeps a person’s SWB around their biologically
determined ‘set-point’.
Resilience. A dynamic process leading to positive adaptation in the face of significant adversity.
post-hoc test. Test of the significance of difference between two or more group mean scores. Post-
hoc tests are presented throughout Part B of this report and discussed where relevant in Part A.
Significant or significance testing. A statistical exploration of how likely a result is to occur by chance
alone. A difference between two mean scores that is significant (p < 0.05) is likely to reflect a true
difference between the means and is unlikely to have occurred by chance. Significance level is
represented by the ‘p’ value, with smaller numbers indicating greater statistical significance.
Throughout this report, the minimum significance criteria employed is p < 0.05 – in other words, if
there was no actual difference between groups, the chance of obtaining the values observed is less
than 5 per cent.
Mean or mean score (M). The combined average scores for a group of respondents on a particular
variable.
Standard deviation (SD). A standard deviation is the measure of the spread of scores around a mean
value. Lower standard deviations indicate a lower dispersion of scores around the mean, and vice
versa.
Young Victorians or young adults. In the context of this research, people between the ages of 16 and
25 years.

Community survey of young Victorians’ resilience and mental wellbeing. Part A: the report 9
Executive summary
Mental wellbeing and resilience are important and underdeveloped areas of research in Victoria’s
youth population.
With this in mind, the Victorian Health Promotion Foundation (VicHealth) asked quality of life and
subjective wellbeing experts to provide a baseline measure of the prevalence of resilience among
young Victorians aged 16 to 25 and to report on their levels of mental wellbeing (expressed here as
‘subjective wellbeing’). A further aim was to investigate whether the 10-item Connor-Davidson
Resilience Scale (Campbell-Sills & Stein, 2007), a common measure of resilience, is a suitable
measure of this construct.
Collectively, these data have the potential to inform government policy and service delivery. For
example, interventions can be targeted at young people who are identified as being at high risk of
experiencing low wellbeing or depression, maximising their effectiveness. Moreover, evidence
gathered from this research may lead to a greater understanding of the concept of resilience and
create capacity to measure resilience within this important and under-researched group of young
Victorians.
Subjective wellbeing
Subjective wellbeing (SWB) can be defined as “a normally positive state of mind that involves the
whole life experience” (Cummins, 2010). Also referred to as ‘personal wellbeing’ or ‘happiness’, SWB
concerns how people feel and think about their lives and personal circumstances.
The instrument used to measure SWB in this research is the Personal Wellbeing Index – Adult (PWI-
A; IWG, 2013). The PWI adopts a ‘domain-based’ approach to measuring SWB, by asking respondents
to indicate their level of satisfaction with seven important life domains, and is recommended by both
the World Health Organization (WHO) and the Organisation for Economic Co-operation and
Development (OECD) for this purpose. Scores on these seven domains are averaged to form a single
composite personal wellbeing score that is standardised and projected onto a 0 to 100-point scale.
Using this scale, the following guidelines for interpreting individual SWB scores measured using the
PWI are offered:
1. 70+ points = ‘Normal’: A person is likely to be experiencing a normal level of wellbeing
2. 51–69 points = ‘Challenged’: Personal wellbeing is likely to be challenged or compromised
3. <50 points = ‘High risk’: Very low personal wellbeing; strong likelihood of depression.
Resilience
Resilience generally refers to the ability to ‘bounce back’ after adversity. Though the research has
primarily focused on resilience in terms of protective factors, it involves more than simply having
access to resources. Arguably more important than the availability of factors that promote resilience
is the capacity of an individual to make use of these resources at critical moments and in the most
effective manner.
Community survey of young Victorians’ resilience and mental wellbeing. Part A: the report 10
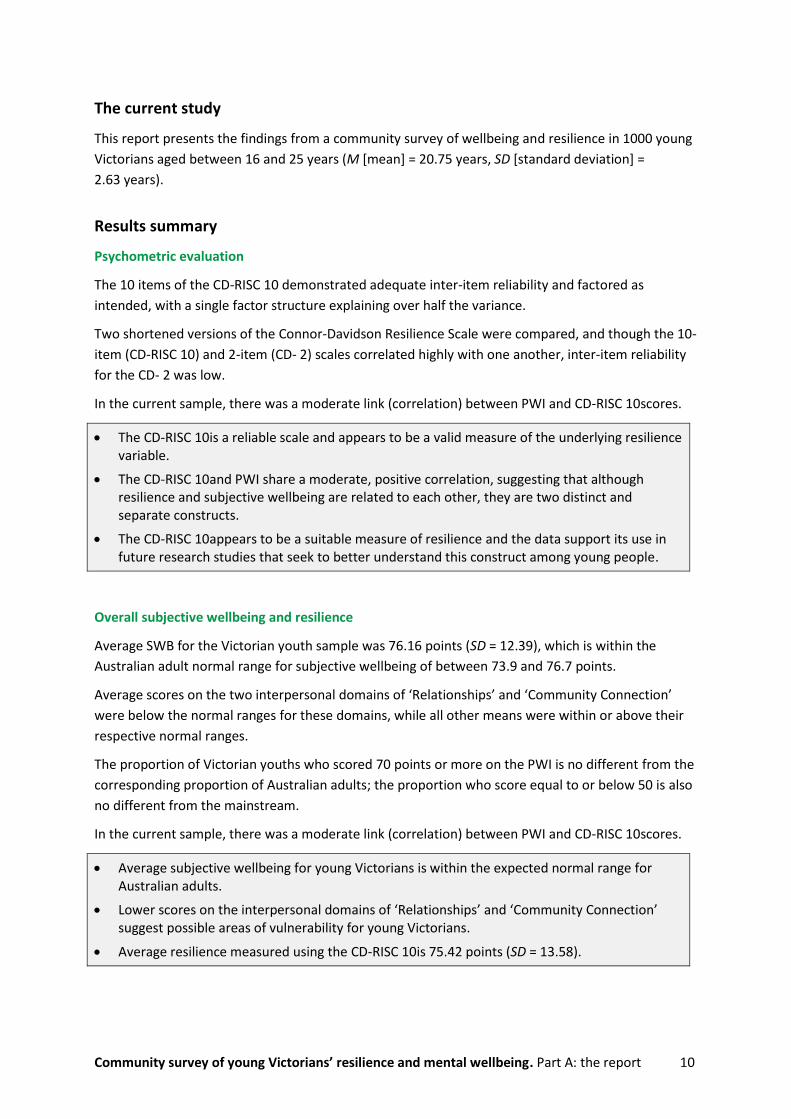
The current study
This report presents the findings from a community survey of wellbeing and resilience in 1000 young
Victorians aged between 16 and 25 years (M [mean] = 20.75 years, SD [standard deviation] =
2.63 years).
Results summary
Psychometric evaluation
The 10 items of the CD-RISC 10 demonstrated adequate inter-item reliability and factored as
intended, with a single factor structure explaining over half the variance.
Two shortened versions of the Connor-Davidson Resilience Scale were compared, and though the 10-
item (CD-RISC 10) and 2-item (CD- 2) scales correlated highly with one another, inter-item reliability
for the CD- 2 was low.
In the current sample, there was a moderate link (correlation) between PWI and CD-RISC 10scores.
The CD-RISC 10is a reliable scale and appears to be a valid measure of the underlying resilience variable.
The CD-RISC 10and PWI share a moderate, positive correlation, suggesting that although resilience and subjective wellbeing are related to each other, they are two distinct and separate constructs.
The CD-RISC 10appears to be a suitable measure of resilience and the data support its use in future research studies that seek to better understand this construct among young people.
Overall subjective wellbeing and resilience
Average SWB for the Victorian youth sample was 76.16 points (SD = 12.39), which is within the
Australian adult normal range for subjective wellbeing of between 73.9 and 76.7 points.
Average scores on the two interpersonal domains of ‘Relationships’ and ‘Community Connection’
were below the normal ranges for these domains, while all other means were within or above their
respective normal ranges.
The proportion of Victorian youths who scored 70 points or more on the PWI is no different from the
corresponding proportion of Australian adults; the proportion who score equal to or below 50 is also
no different from the mainstream.
In the current sample, there was a moderate link (correlation) between PWI and CD-RISC 10scores.
Average subjective wellbeing for young Victorians is within the expected normal range for Australian adults.
Lower scores on the interpersonal domains of ‘Relationships’ and ‘Community Connection’ suggest possible areas of vulnerability for young Victorians.
Average resilience measured using the CD-RISC 10is 75.42 points (SD = 13.58).

Community survey of young Victorians’ resilience and mental wellbeing. Part A: the report 11
Gender, wellbeing and resilience
Male and female Victorian youths reported similar scores for subjective wellbeing. However, male
respondents reported higher scores on the CD-RISC 10than females. Specifically, they reported
significantly higher scores on every individual item of the CD-RISC 10except for “I am able to adapt to
change”. Though the difference is statistically significant, it would be premature to suggest that
efforts be directed towards improving the resilience of females based on these findings alone.
There was no statistically significant difference in the average subjective wellbeing scores of male and female respondents.
However, females were over 50 per cent more likely than males to score in the high-risk range for low personal wellbeing.
There was a statistically significant difference in average resilience scores between male (M = 77.58, SD = 12.93) and female (M = 73.56, SD = 13.86) respondents.
Age, wellbeing and resilience
Young Victorians aged 22 to 25 years reported lower average personal wellbeing than younger
Victorians sampled, with significantly lower scores in the domains of Standard of Living, Health,
Community Connection and Future Security.
Young Victorians in the 22 to 25-year-old age group reported higher average resilience scores than
people in the 16 to 17-year-old age group. This finding offers some important preliminary insight into
the degree of correspondence between resilience and wellbeing data.
Victorian youths aged 22 to 25 years reported significantly lower average subjective wellbeing scores than young people aged 16 to 17 years and those aged 18 to 21 years.
Victorian youths aged 22 to 25 years reported significantly higher average resilience than young people aged 16 to 17 years.
Education/employment status, wellbeing and resilience
There were no statistically significant differences in average subjective wellbeing scores for Victorian
youths based on whether or not they were students. However, there was a significant difference for
resilience, with non-students reporting significantly higher scores on the CD-RISC 10than students.
Among students only, those studying at high school have, on average, significantly higher subjective
wellbeing than those studying at TAFE, while those studying at university have significantly higher
average resilience than people attending high school.
Young Victorians involved in paid work reported higher wellbeing and higher resilience than young
Victorians not involved in paid work, while people in full-time work reported higher resilience than
people employed on either a part-time or casual basis.
Victorian students (M = 74.36, SD = 13.19) recorded significantly lower average resilience scores than people not currently studying (M = 76.98, SD = 14.01). However, students and non-students did not differ significantly in terms of their average levels of SWB.
Victorian youths studying in high school reported significantly higher average personal

Community survey of young Victorians’ resilience and mental wellbeing. Part A: the report 12
wellbeing (M = 78.25, SD = 11.69) than people attending TAFE (M = 73.73, SD = 13.19), but have lower average resilience (M = 71.60, SD = 14.50) than people attending university (M = 76.04, SD = 11.97).
Household composition, wellbeing and resilience
There were significant differences in average wellbeing and resilience scores according to young
people’s household composition, with those who live with their parents reporting average SWB
above the normal range.
On the other hand, young people who live with their children, live alone or live with other adults
(e.g., in shared accommodation), report average SWB below the normal range.
People who live with their children only report significantly lower average resilience than people who
live with their partner and children.
Young Victorians who live with their parents have above-average levels of personal wellbeing.
Young Victorians who live with only their children have lower wellbeing (M = 59.40, SD = 22.09) and resilience (M = 63.12, SD = 20.80) than all other groups.
Household income, wellbeing and resilience
Both wellbeing and resilience scores tended to increase with increasing levels of income up to an
annual household income of $250,000 to $500,000.
The lowest reported average personal wellbeing belonged to the group who reported an annual
household income of between $15,000 and $30,000 per year.
Personal wellbeing and resilience generally increase with increasing levels of annual household income.
These findings are consistent with adult data collected as part of the Australian Unity Wellbeing Index which support the notion that money can be used as a flexible resource that acts as a buffer to life’s challenges and supports wellbeing during times of threat.
Social support, wellbeing and resilience
Average personal wellbeing and resilience were significantly higher among young Victorians who
responded “Yes, definitely” to the question “Can you get help from friends, family or neighbours
when needed?”
Average SWB for young people who responded “Sometimes”, “Rarely” or “Not at all” was well below
the normal range, placing them at a higher risk of depression. This is a very concerning finding given
that approximately one in four respondents reported feeling this way about the availability of social
support.
Like money, social support is regarded as an important external resource that can act as a buffer to protect personal wellbeing and support resilience in times of challenge.
Supportive friends, family and peers may increase a person’s capacity to adapt to and confront

Community survey of young Victorians’ resilience and mental wellbeing. Part A: the report 13
the challenges that threaten their personal wellbeing, with people low on social resources at greater risk of depression.
Given the prevalence of young people who feel that they lack someone they can reach out to when in need, education and intervention programs that target and support the socially isolated should be a priority.

Community survey of young Victorians’ resilience and mental wellbeing. Part A: the report 14
Introduction
Compared to data on adults, there is a paucity of published data describing levels of self-reported
wellbeing among Australian youths. There is even less data available on levels of resilience among
this important population subgroup. The latter may be attributed in part to the general lack of
consensus in the scientific literature on the definition and measurement of ‘resilience’.
One of the major aims of this research is to present data that describe levels of subjective wellbeing
(SWB) among Victoria’s adolescent and young adult population, and to explore the 10-item Connor-
Davidson Resilience Scale (CD-RISC 10;Campbell-Sills & Stein, 2007) as an appropriate and validated
measure of resilience. A further aim of this research is to explore levels of resilience among Victoria’s
young adult population and consider demographic factors associated with higher or lower resilience
within this subgroup.
This introduction will begin by describing the concept of SWB as a quality of life indicator in the
context of SWB Homeostasis Theory, the underlying theoretical paradigm that is the basis for the
interpretation of SWB data. We will then offer a description of resilience and highlight issues
pertaining to the way this construct is measured and understood in the literature.
This report will then describe the current research methodology, major findings and interpretations.
Objective versus subjective quality of life
Quality of life (QOL) is a broad and inclusive construct comprising both objective and subjective
dimensions. Objective QOL refers to concrete, identifiable aspects of life and society, such as average
income, physical health, education and employment status. These objective indicators have
traditionally been at the centre of decision-making and policy, as governments try to enhance the
QOL of their citizens by improving such metrics.
More recently, however, researchers have become increasingly interested in the subjective
dimension of life quality. Subjective quality of life concerns how people perceive various aspects of
their lives, such as satisfaction with health, relationships and standard of living. In light of empirical
findings which have determined that objective and subjective dimensions of QOL share a complex
relationship and are often poorly correlated (e.g., Cummins, 2000a; 2000b), measuring and
understanding subjective wellbeing has proven to be a useful endeavour, because such data offer
important insights into how people feel and think about themselves and their lives, independent of
their objective life circumstances.
Subjective wellbeing
An alternative to traditional indicators of national performance and progress, such as income, high-
school completion and GDP, is the measure known as subjective wellbeing (SWB). Often referred to
more generally as ‘happiness’, SWB can be defined scientifically as a normally positive state of
mind that involves the whole life experience (Cummins, 2010).
In the context of the present investigation, SWB is recognised as having ‘trait’-like properties and is
best conceptualised as a stable, enduring positive mood that reflects how people feel about

Community survey of young Victorians’ resilience and mental wellbeing. Part A: the report 15
themselves at the most global, abstract level. In contrast, ‘state’ happiness or wellbeing is a short-
term, transient emotional response, usually directed at something good or pleasant.
The authors believe that SWB is best explained and understood by SWB Homeostasis Theory.
Subjective Wellbeing Homeostasis Theory
One of the most interesting findings in the literature is that SWB is not free to vary over the entire
range of values offered by a particular measurement instrument. A commonly held view is that SWB
is maintained around a ‘set-point’ and is remarkably stable across time (Cummins, 1995; Headey &
Wearing, 1989, 1992; Eid & Diener, 2004; Schimmack, Diener, & Oishi, 2002).
One theory that offers a comprehensive description of SWB, including stability and change in this
construct, is SWB Homeostasis Theory (Cummins, 2010). According to this theory, each person has a
biologically determined level of SWB that is actively maintained and controlled within a narrow,
positive range of values around a ‘set-point’. According to recent empirical evidence by Cummins,
Li, Wooden and Stokes (2014), individual SWB set-points normally range between 70 and 90 points
on a standard 0 to 100-point scale. Moreover, the distribution of set-points within this range is
normal, thus yielding a theoretical population mean score of 80 points. This estimation is reasonably
corroborated by data obtained from the Australian Unity Wellbeing Index – an extant project that
has tracked the SWB of the Australian population since 2001. Over the 31 surveys conducted to date,
the mean population SWB from each survey has varied within a very narrow 3.0 percentage point
range, from 73.9 to 76.7 points (Cummins et al., 2013), demonstrating remarkable stability over
more than a decade. The discrepancy between this range and the mean set-point of 80 points is
proposed to represent the degree of challenge within the population samples employed.
According to Homeostasis Theory, the purpose of homeostasis is to defend the affective core of SWB,
which is proposed to be a stable, genetically endowed, positive mood (Blore, Stokes, Mellor, Firth, &
Cummins, 2011; Davern, Cummins, & Stokes, 2007; Tomyn & Cummins, 2011). When nothing is
happening to affect an individual’s mood, their responses to subjective wellbeing questionnaires will
reflect their ordinary set-point. However, when challenges are encountered, SWB may fall below its
set level. When this occurs, psychological homeostatic forces are engaged to restore SWB to its
normal range. When a challenge is chronic and persistent, ordinary homeostatic processes may fail,
and a person may become vulnerable to depression (Cummins, 2010).
Measuring subjective wellbeing: the Personal Wellbeing Index
SWB is typically measured by asking people to rate their level of satisfaction with their life in general.
A common and simple way to evaluate SWB is to approximate it using a single item that assesses
General Life Satisfaction (GLS): “How satisfied are you with your life as a whole?” (0 = Not at all
satisfied; 10 = Completely satisfied).
A more robust estimate is afforded through the Personal Wellbeing Index (PWI) (IWG, 2013). The
PWI generates a composite variable, calculated by averaging life satisfaction scores on seven
important life domains: Standard of Living, Health, Achieving in Life, Relationships, Safety,
Community Connection, Future Security (see Appendix A). Each domain contributes unique variance
to the single-item measure of GLS. Scores on the seven domains are combined, averaged and
converted into a single, composite, percentage of scale maximum score (%SM) which has a range of

Community survey of young Victorians’ resilience and mental wellbeing. Part A: the report 16
0 to 100 points. The PWI exhibits strong psychometric properties in Australia and overseas. It has
been translated into at least 20 languages and is currently used by hundreds of researchers in over
50 countries worldwide.
Interpretation of subjective wellbeing data
Several diagnostic approximations regarding the personal wellbeing of people and groups can be
made based on the findings (Cummins et al., 2014) that set-points exist between the levels of 70 and
90 points and have a normal operating range (set-point range) of around 18 to 20 points. For
example, it can be deduced that:
1. SWB scores at or above 70 points reflect a normally functioning homeostatic system.
2. SWB scores equal to or below 50 points (i.e., 70–20 points) represent homeostatic failure.
3. SWB scores between 51 and 69 points cannot be unequivocally interpreted. Any score within this
range may represent the homeostatic failure of a high set-point or homeostatic normality of a
low set-point.
Resilience
Resilience can be defined in various ways, but a common thread running through the scientific
literature involves coping in the face of adversity. Various definitions of this emerging concept have
been offered in recent years, usually proposing that resilience is either a process or an outcome.
Definitions of resilience range from being broad and outcome-focused, like the standard dictionary
definition of “an ability to recover from or adjust easily to misfortune or change” (Merriam-Webster,
2012), to the more concentrated and process-oriented “a dynamic process leading to positive
adaptation in the face of significant adversity” (Luthar, Cicchetti & Becker, 2000). The latter definition
is further distinguished from the former in that it proposes “adaptation” rather than recovery. This
definition is therefore preferred, as it acknowledges that recovery is characterised by a transition to a
new state of functioning, rather than a return to the pre-trauma state. In the context of SWB
Homeostasis Theory, resilience refers to the process by which the set-point for wellbeing is
recovered following a departure from its usual resting state.
Measuring resilience: the 10-item Connor-Davidson Resilience Scale (CD-RISC 10)
One concern with measuring resilience is that, by most definitions, resilience can only be
demonstrated in the face of adversity, making the ethical exploration of it problematic. Instead,
measures usually approximate actual resilience by capturing ‘perceived resilience’, or by having
participants rate their level of agreement with statements that typically describe resilient people.
In a review of resilience measurement scales, Windle, Bennett and Noyes (2011) acknowledged the
Connor-Davidson Resilience Scale (Connor & Davidson, 2003) as one of the top-rated resilience tools,
due to its strong psychometric properties. Since it has been evaluated as among the highest-quality
scales, and is the only one of the recommended scales that is targeted to a young adult audience, it
was selected for investigation in the present study.
Community survey of young Victorians’ resilience and mental wellbeing. Part A: the report 17
The 10-item CD-RISC 10is a brief form of the original scale, which has greater conceptual clarity and
less redundancy in items (Campbell-Sills & Stein, 2007). Items load onto a single factor that
represents resilience, and endorsement of the item statements reflects a general ability to bounce
back from challenges encountered in life. The scale has strong psychometric properties and has been
validated in both general population and clinical samples (Connor & Davidson, 2003). Importantly,
the Connor-Davidson Resilience Scale has been shown to be capable of capturing changes following
interventions designed to increase resilience (Davidson et al., 2005). In the present study,
respondents rated how true each item is for them on a 0–10 scale. The items can be seen as part of
the full questionnaire in Appendix A.
Methodology
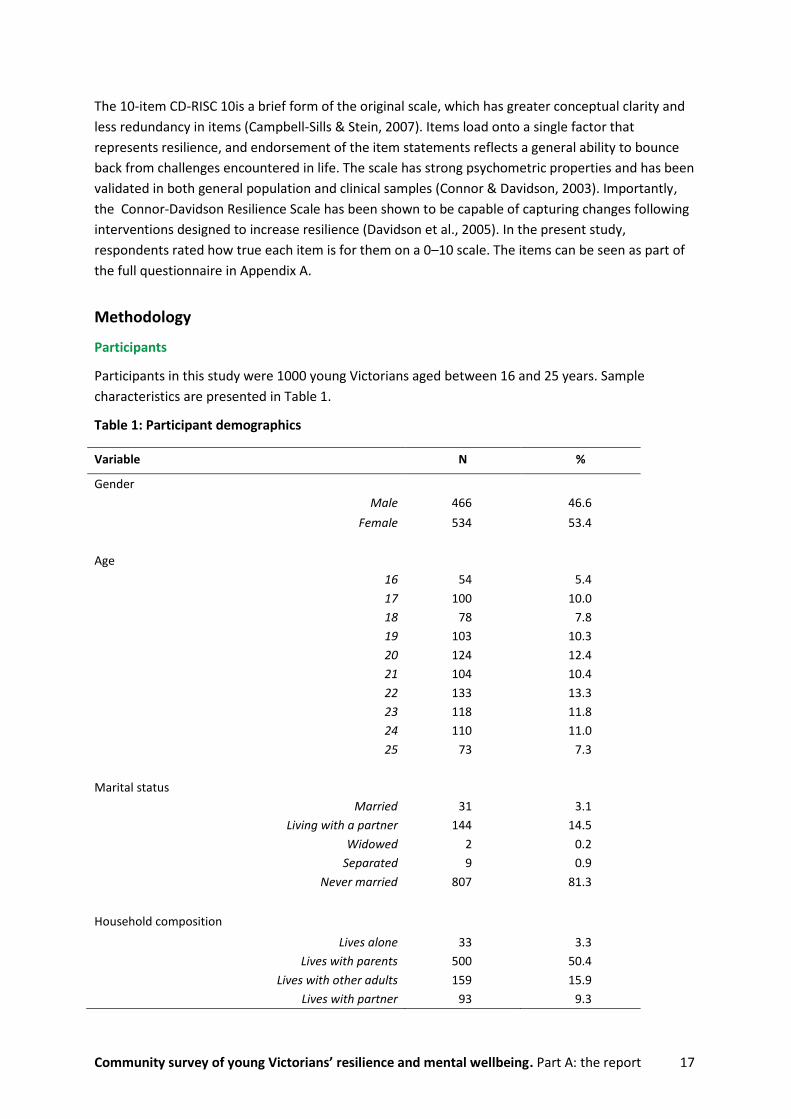
Participants
Participants in this study were 1000 young Victorians aged between 16 and 25 years. Sample
characteristics are presented in Table 1.
Table 1: Participant demographics
Variable N %
Gender
Male 466 46.6
Female 534 53.4
Age
16 54 5.4
17 100 10.0
18 78 7.8
19 103 10.3
20 124 12.4
21 104 10.4
22 133 13.3
23 118 11.8
24 110 11.0
25 73 7.3
Marital status
Married 31 3.1
Living with a partner 144 14.5
Widowed 2 0.2
Separated 9 0.9
Never married 807 81.3
Household composition
Lives alone 33 3.3
Lives with parents 500 50.4
Lives with other adults 159 15.9
Lives with partner 93 9.3

Community survey of young Victorians’ resilience and mental wellbeing. Part A: the report 18
Variable N %
Lives with partner and children 25 2.5
Lives with parents and children 57 5.7
Lives with parents and other adults 54 5.4
Other combination 76 7.6
Student status
High school 167 17.2
University 320 32.9
TAFE 83 8.5
Other 22 2.3
Not a student 405 41.6
Work status
Full time 240 24.1
Part time 205 20.6
Casual 303 30.4
Not in paid work 249 25.0
Household income
<$15,000 49 6.9
$15,000 – $30,000 93 13.1
$31,000 – $60,000 149 21.0
$61,000 – $100,000 154 21.8
$101,000 – $150,000 141 19.9
$151,000 – $250,000 88 12.4
$251,000 – $500,000 26 3.7
>$500,000 8 1.1
Social groups
Sport or physical recreation group 342 34.3
Religious, youth or other spiritual group 61 6.1
Special interest or hobby group 85 8.5
Ethnic/multicultural club 4 0.4
Social club or group through school/university 84 8.4
Online group or community 39 3.9
No active involvement in social groups 553 55.5
Indigenous descent
Yes 22 2.3
No 974 97.8
Wellbeing category based on overall PWI score
High risk (0–50) 41 4.3
Challenged (51–69) 195 20.4
Normal (70+) 718 75.3
Community survey of young Victorians’ resilience and mental wellbeing. Part A: the report 19
Procedure
Ethics approval for this research was granted by the Cairnmillar Institute School of Psychology
Counselling and Psychotherapy Human Research Ethics Committee (approval code 2015/8740),
which is accountable to the National Health and Medical Research Institute (NHMRC).
Participants were recruited through iView, a leading market and social research data collection
agency in Australia. Telephone lists of Victorian youths aged between 16 and 25 were purchased
from external sources to provide an inventory of viable participants. These participants were
recruited to the phone list because they had previously been contacted by random selection for
other Australian studies and had agreed to be contacted for future studies. Data were collected
between 6 May 2015 and 20 May 2015.
Once collected, a secondary, de-identified Statistical Package for the Social Science (SPSS ; version
22.0) data set was sent to the lead researchers for cleaning and analysis.
Data cleaning and preparation
Aggregate total scores for the PWI and CD-RISC 10were calculated. Twenty-two scores were deleted
due to suggestion of acquiescent responding to the PWI (the tendency of some respondents to say
‘yes’ regardless of the question), as recommended by the PWI user manual (IWG, 2013).
Subsequently, univariate (i.e., appearing only once) outliers were identified as being three standard
deviations beyond the mean, and were recoded to values that lay within the acceptable range. This
process resulted in the recoding of 19 scores on the PWI, and nine scores for the CD-RISC 10. The
recoding procedure is recommended by Tabachnik and Fidell (2015) when there are few outliers and
is preferable to deletion, as the scores remain in the data set but are not so extreme that they may
limit subsequent analyses. Three multivariate outliers were detected using the criterion of having a
Mahalanobis distance with two degrees of freedom of 13.816. These cases were removed since “they
may distort the results in any direction” (Tabachnik & Fidell, 2015, p. 111).
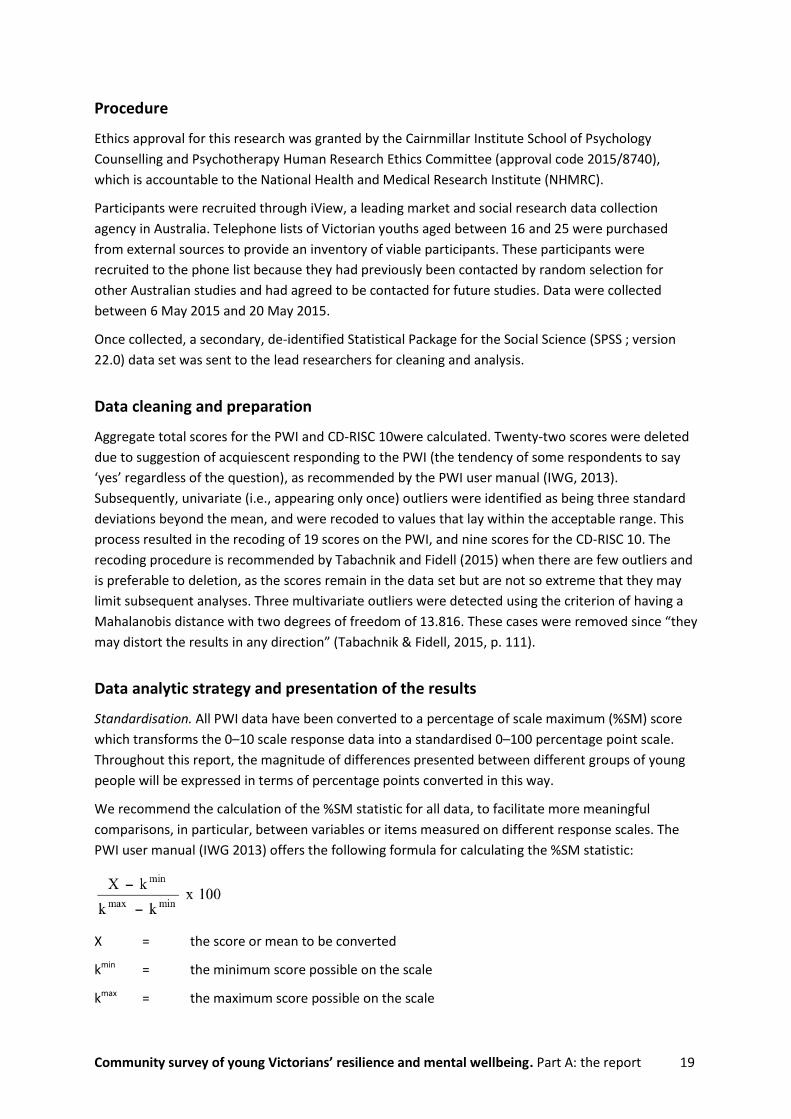
Data analytic strategy and presentation of the results
Standardisation. All PWI data have been converted to a percentage of scale maximum (%SM) score
which transforms the 0–10 scale response data into a standardised 0–100 percentage point scale.
Throughout this report, the magnitude of differences presented between different groups of young
people will be expressed in terms of percentage points converted in this way.
We recommend the calculation of the %SM statistic for all data, to facilitate more meaningful
comparisons, in particular, between variables or items measured on different response scales. The
PWI user manual (IWG 2013) offers the following formula for calculating the %SM statistic:
X = the score or mean to be converted
kmin = the minimum score possible on the scale
kmax = the maximum score possible on the scale

Community survey of young Victorians’ resilience and mental wellbeing. Part A: the report 20
Response set. To ensure the integrity of the data, all responses were examined for response set. This
occurs when a respondent consistently scores at the scale maximum (10) or minimum (0) for all
seven PWI domains, often due to ‘acquiescence’ (a tendency to respond in the affirmative) or
misunderstanding. Regardless of the cause, these data are considered unreliable and were removed
before the main analyses, as advised in the user manual (Cummins & Lau, 2005).
Altogether, 19 response sets (1.9 per cent) were evident, and all recorded the maximum score of 100
for the PWI. Twelve of the participants who recorded scores of 100 were male (63.16 per cent), while
11 (57.89 per cent) were aged between 22 and 25 years.
Significance testing. All data were analysed at the significance level of p < 0.05, unless otherwise
stated. To control for familywise error rate that frequently occurs when conducting multiple group
comparisons, the Bonferroni test of significance of group differences was used. The Bonferroni
method is a conservative test that allows multiple comparisons while maintaining the overall
confidence coefficient. It is also valid when comparing groups of unequal sizes, of which there are
many presented throughout this report.
For analysis of variance (ANOVA), where the homogeneity of variance assumption was violated,
Dunnett’s T3 Post-Hoc Test was used. In the case of t-tests, the SPSS option for significance when
equality of variance cannot be assumed was employed.
Comparative adult data set
This report includes comparisons to normative ranges, which were generated based on a series of
studies conducted as part of the Australian Unity Wellbeing Index (AUWI), a project that has
gathered data on the subjective wellbeing of over 60,000 Australians. Since 2001, 31 national surveys
have been conducted on the Australian adult population, with each survey involving a new and
geographically representative sample of at least 1000 Australians aged 18 years and over. The AUWI
is the largest and most nationally representative data set involving the PWI available and will
subsequently form the basis of comparative analyses. These data were cleaned in the same manner
as the current data. Normative ranges were calculated by taking the mean and standard deviation of
the average score for each survey. The normative ranges represent two standard deviations either
side of the mean score. More information about this project, and access to all data, is available
online via www.acqol.com.au.
Community survey of young Victorians’ resilience and mental wellbeing. Part A: the report 21
Psychometric evaluation of key variables
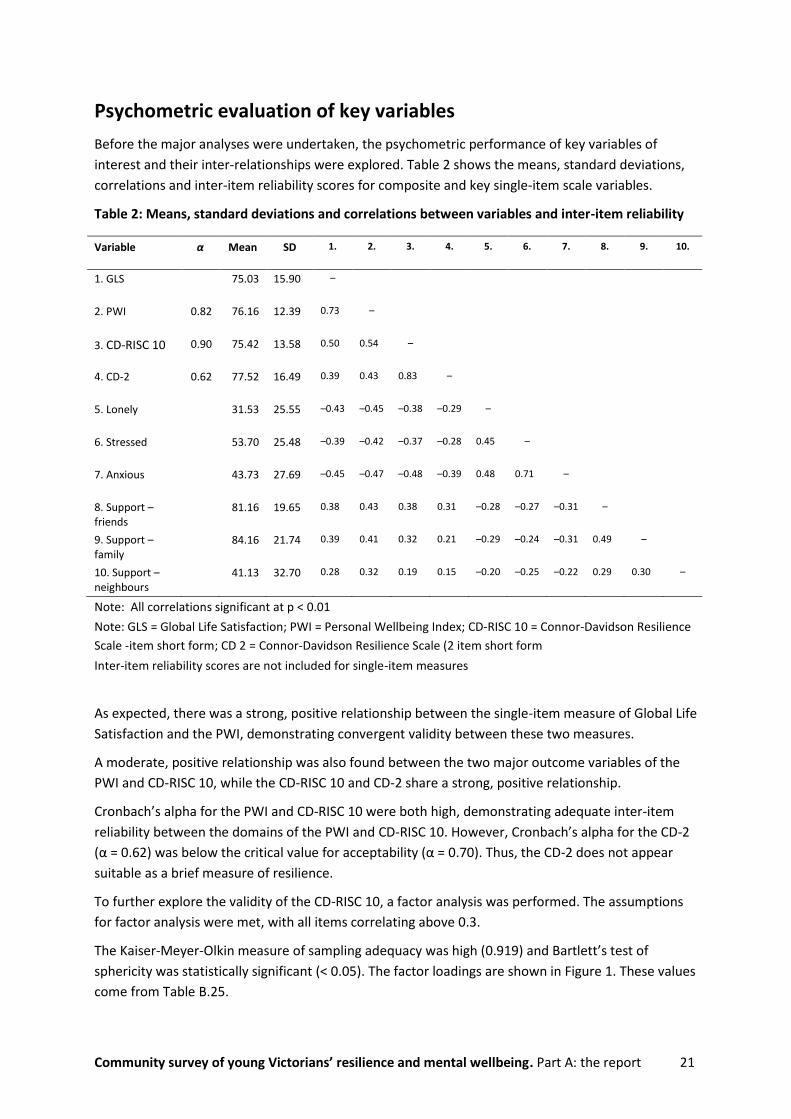
Before the major analyses were undertaken, the psychometric performance of key variables of
interest and their inter-relationships were explored. Table 2 shows the means, standard deviations,
correlations and inter-item reliability scores for composite and key single-item scale variables.
Table 2: Means, standard deviations and correlations between variables and inter-item reliability
Variable α Mean SD 1. 2. 3. 4. 5. 6. 7. 8. 9. 10.
1. GLS 75.03 15.90 –
2. PWI 0.82 76.16 12.39 0.73 –
3. CD-RISC 10 0.90 75.42 13.58 0.50 0.54 –
4. CD-2 0.62 77.52 16.49 0.39 0.43 0.83 –
5. Lonely 31.53 25.55 –0.43 –0.45 –0.38 –0.29 –
6. Stressed 53.70 25.48 –0.39 –0.42 –0.37 –0.28 0.45 –
7. Anxious 43.73 27.69 –0.45 –0.47 –0.48 –0.39 0.48 0.71 –
8. Support – friends
81.16 19.65 0.38 0.43 0.38 0.31 –0.28 –0.27 –0.31 –
9. Support – family
84.16 21.74 0.39 0.41 0.32 0.21 –0.29 –0.24 –0.31 0.49 –
10. Support – neighbours
41.13 32.70 0.28 0.32 0.19 0.15 –0.20 –0.25 –0.22 0.29 0.30 –
Note: All correlations significant at p < 0.01
Note: GLS = Global Life Satisfaction; PWI = Personal Wellbeing Index; CD-RISC 10 = Connor-Davidson Resilience
Scale -item short form; CD 2 = Connor-Davidson Resilience Scale (2 item short form
Inter-item reliability scores are not included for single-item measures
As expected, there was a strong, positive relationship between the single-item measure of Global Life
Satisfaction and the PWI, demonstrating convergent validity between these two measures.
A moderate, positive relationship was also found between the two major outcome variables of the
PWI and CD-RISC 10, while the CD-RISC 10 and CD-2 share a strong, positive relationship.
Cronbach’s alpha for the PWI and CD-RISC 10 were both high, demonstrating adequate inter-item
reliability between the domains of the PWI and CD-RISC 10. However, Cronbach’s alpha for the CD-2
(α = 0.62) was below the critical value for acceptability (α = 0.70). Thus, the CD-2 does not appear
suitable as a brief measure of resilience.
To further explore the validity of the CD-RISC 10, a factor analysis was performed. The assumptions
for factor analysis were met, with all items correlating above 0.3.
The Kaiser-Meyer-Olkin measure of sampling adequacy was high (0.919) and Bartlett’s test of
sphericity was statistically significant (< 0.05). The factor loadings are shown in Figure 1. These values
come from Table B.25.

Community survey of young Victorians’ resilience and mental wellbeing. Part A: the report 22
Figure 1: Principal components factor analysis of the CD-RISC 10
As expected, a single-factor solution emerged with an eigenvalue greater than 1.0, explaining
52.19 per cent of variance.
All items loaded above 0.6, with the highest loading belonging to Item 2, “I can deal with whatever
comes”.
Further exploration of the CD-RISC 10 items is presented below. Figure 2 presents mean CD-RISC 10
item scores ranked from highest to lowest. These findings come from Table B.23.
Figure 2: Average ratings for CD-RISC 10 items ranked from highest to lowest
As shown, the highest average score for the CD-RISC 10 was Item 3, “I see the humorous side of
things”; followed by Item 1, “I am able to adapt to change”; and Item 9, “I think of myself as a strong
person”. These items potentially lend support to the idea that humour may serve an adaptive
function.
The lowest average scores were for Item 4, “Coping with stress can strengthen me”; Item 8, “I am not
easily discouraged by failure”; and Item 7, “I can stay focused under pressure”.
To gain a better understanding of the degree of correspondence between PWI and CD-RISC 10
scores, the CD-RISC 10 composite variable was recoded into a number of different categories: 0–50,
51–55,
56–60, 61–65, 66–70, 71–75, 76–80, 81–85, 86–90 and 91+. Presenting the CD-RISC 10 scores in this
way better demonstrates what level of resilience is coincident with average personal wellbeing
falling below the normal range, and therefore places people at risk of low wellbeing and depression.

Community survey of young Victorians’ resilience and mental wellbeing. Part A: the report 23
Figure 3 presents average PWI scores (on the vertical axis) for each corresponding CD-RISC 10 score
range (on the horizontal axis). The yellow bar represents the Australian adult normal range for the
PWI. These findings come from Table B.27.
Figure 3: Average PWI scores for each CD-RISC 10 category
Group mean SWB is within the normal range at a CD-RISC 10 score of 71–75. As CD-RISC 10 scores
increase beyond this level, so too do average PWI scores.
Interestingly, average SWB is below the normal range, with corresponding CD-RISC 10 scores of
between 61 and 70. At a CD-RISC 10 score of 56–60, average SWB falls below 70 points and continues
to fall as CD-RISC 10 scores also decrease further, suggesting that people in these groups are at
higher risk of low wellbeing and depression.
Summary
The 10-item CD-RISC 10 appears to be a reliable and valid indicator of resilience, revealing strong
inter-item reliability and displaying convergent validity. Scores on this measure appear to reflect the
conceptual understanding of resilience, and correlate as expected with other variables.

Community survey of young Victorians’ resilience and mental wellbeing. Part A: the report 24
Overall results
Figure 4 shows average subjective wellbeing (represented by ‘PWI’) and domain happiness scores for
the cleaned sample of 954 young Victorians against the comparative sample of Australian adults
(surveyed as part of the Australian Unity Wellbeing Index over the years 2001–2014). More
information is provided in Table B.1.
Figure 4: Comparison between youth and mainstream SWB data
Average SWB among Victorian youths is within the normal range for the general population of
Australia.
Examination of average domain scores reveals that all domains, with the exception of ‘Relationship’
and ‘Community Connection’, are within or above the normal range. Most notable are higher than
normal scores on ‘Safety’, ‘Standard of Living’ and ‘Health’.
The two lower than normal means for the interpersonal domains of ‘Relationships’ and ‘Community
Connection’ highlight potential areas of vulnerability among Victoria’s young adult population.
Collectively, the findings suggest that Victorian young adults comprise a population subgroup that is,
on average, experiencing a normal level of wellbeing but with a domain profile that is slightly, though
predictably, different from that of Australia’s mainstream adult population.
Figure 5 shows average scores for the other key variables explored, including the CD-RISC 10, the
single-item measures of satisfaction with support from friends, family and neighbours, and general
feelings of loneliness, stress and anxiety. All means are expressed in terms of standardised scores as
a percentage of the scale maximum. More information is provided in Table B.24.

Community survey of young Victorians’ resilience and mental wellbeing. Part A: the report 25
Figure 5: Average scores for key variables of interest
Interestingly, the average score for the CD-RISC 10 (75.42 points) approximates the average score for
the PWI (76.15 points), suggesting a high degree of correspondence between these two measures.
Average satisfaction with support from ‘family’ and ‘friends’ was relatively high, with 84.16 per
cent and 81.16 per cent satisfaction respectively. These results are encouraging, given that mutually
supportive relationships are key external resources that protect personal wellbeing, especially in
times of challenge (Cummins, 2010).
By contrast, satisfaction with support from ‘neighbours’ was very low. This score likely reflects
contemporary societal relationship trends, where neighbours are considered as geographically
proximal others. Given the changing nature of relationships – due largely to the increased
accessibility of the internet and connection via digital means – geographic proximity seems no longer
to be a core predictor of relational support, and this would be especially so for adolescents.
Regarding the measures of negative affect, ‘Stress’ appears to be more commonly experienced than
being ‘Anxious’ or ‘Lonely’. However, it is evident that the experience of all three affects is not
uncommon among this sample group. This is not surprising, given the many challenges that young
people face in everyday life, including pressures to succeed at school and at university,
responsibilities to friends and family, and the need for employment that supports an adequate
standard of living.
The relationship between negative affect and SWB is discussed in greater detail below, under
‘Negative affectivity in Victorian youths’.
Figure 6 displays the proportion of Victorian youths categorised into the normal, challenged or high-
risk group, based on their overall PWI score. More information is provided in Table B.3.

Community survey of young Victorians’ resilience and mental wellbeing. Part A: the report 26
Figure 6: Distribution of Victorian youths in each PWI group compared to adult normative data
About three-quarters of Victorian youths scored in the normal range for subjective wellbeing. This
approximates the proportion of Australian adults who normally score within this range.
4.3 per cent of respondents have very low subjective wellbeing and scored in the ‘high-risk’ range.
These young people are either depressed or at very high risk of depression and are in critical need of
supportive services.
Finally, 20.4 per cent of Victorian youths scored between 51 and 69 points. These young people may
be experiencing a lower than normal level of SWB, either due to having a low set-point or due to
some life challenge(s) that compromises their level of perceived wellbeing.
Collectively, these results suggest that the distribution of PWI scores for the Victorian youth
population is no different from that of the general Australian adult population.

Community survey of young Victorians’ resilience and mental wellbeing. Part A: the report 27
Gender, subjective wellbeing, and resilience
Figure 7 presents average SWB and resilience scores for male and female respondents. Throughout
the report, the blue bars represent SWB and the purple bars represent resilience. The shaded yellow
area represents the normal range for SWB for the Australian adult population. More information is
provided in Tables B.4 and B.6.
Figure 7: Average SWB and resilience of male and female respondents
Average SWB does not differ significantly between males and females. While the average for females
is within the normal range for Australian adults, the average for males is slightly above.
The average resilience score, however, is about four points higher for males than for females. This
difference is statistically significant (p < 0.001).
Figure 8 below displays the proportion of males and females categorised into the normal, challenged
or high-risk group, based on their overall PWI score. More information is provided in Table B.5.
Figure 8: Distribution of males and females in each PWI group
77.1 per cent of males score in the normal range for SWB, compared to 73.7 per cent of females.
Community survey of young Victorians’ resilience and mental wellbeing. Part A: the report 28
Females are approximately 50 per cent more likely than males to be at ‘high risk’ for depression. In
Australia’s adult population, the proportion of males and females who score ≤ 50 on the PWI is
comparative (4.5 per cent and 4.3 per cent respectively).
These findings suggest greater vulnerability among young Victorian females than males, and may
have implications for service delivery.

Community survey of young Victorians’ resilience and mental wellbeing. Part A: the report 29
Age, subjective wellbeing, and resilience
Figure 9 presents average SWB and resilience scores for Victorian youths, split into three age groups
(16–17, 18–21 and 22–25), compared to the normal range for SWB. More information is provided in
Tables B.7 and B.9.
Figure 9: Average SWB and resilience of Victorian youth in each age group
Average personal wellbeing among young Victorians aged 16 and 17 years is significantly higher than
the average for young people aged 22 to 25 years (p < 0.01), while average personal wellbeing for
18 to 21-year-olds is significantly higher than for 22 to 25-year-olds (p < 0.05).
All three average scores, however, are within the normal range for Australian adults.
Interestingly, while increasing age is associated with decreasing scores for subjective wellbeing, the
reverse appears to hold for resilience (see Table B.9). The average resilience score for the 22 to 25
age group is significantly higher (p < 0.01) than for those aged 16 to 17.
These findings highlight the complex relationship between SWB and resilience scores and support
the belief that resilience should not be used as a proxy for personal wellbeing, nor vice versa.
To provide further insight into the age-related differences in subjective wellbeing, their domain
profiles are shown in Figure 10. More information is provided in Table B.7.

Community survey of young Victorians’ resilience and mental wellbeing. Part A: the report 30
Figure 10: Domain scores by age groups
Victorians aged 16 to 17 years and 18 to 21 years score significantly higher than Victorians aged 22 to
25 years on the domains of ‘Standard of Living’ and ‘Community Connection’.
Victorians aged 16 to 17 score significantly higher than Victorians aged 22 to 25 years on the domains
of ‘Health’ and ‘Future Security’.
Collectively, the results for age suggest that 22 to 25-year-olds appear to be more vulnerable to
experiencing lower wellbeing, despite revealing higher resilience scores.
Figure 11 displays the proportion of young Victorians in each age group categorised into the normal,
challenged or high-risk group, based on their overall PWI score. More information is provided in
Table B.8.
Figure 11: PWI distribution for young people in each age group
Young people aged 22 to 25 years are over two times more likely than young people aged 16 to 17
years to score in the high-risk range on the PWI, which represents those most likely to be depressed.
These findings corroborate the earlier suggestion that 22 to 25-year-olds may be more vulnerable to
experiencing lower wellbeing than younger Victorians, and highlight the need for targeted wellbeing
interventions or programs in early adolescence that foster resilience, in addition to education and
support for making the transition to employment.

Community survey of young Victorians’ resilience and mental wellbeing. Part A: the report 31
Marital status, subjective wellbeing, and resilience
Figure 12 presents average SWB and resilience scores for Victorian youths, categorised according to
their current marital status, compared to the normal range for SWB. More information is provided in
Table B.10.
Figure 12: Average SWB and Resilience of Victorian youths according to marital status
Average personal wellbeing for the 81.6 per cent of young Victorians who report having never been
married is within the normal range; while average personal wellbeing for people living with their
partner, and for young people who are married, is above the normal range. These latter findings
attest to the power of relationships in supporting personal wellbeing in young adulthood.
There were no differences in average resilience scores as a function of marital status.

Community survey of young Victorians’ resilience and mental wellbeing. Part A: the report 32
Household composition, subjective wellbeing, and resilience
Figure 13 presents average PWI scores for Victorian youths, categorised according to who else lives
in their household, compared to the normal range for SWB. More information is provided in
Table B.11.
Figure 13: Average SWB of Victorian youth according to their household composition
The majority of young Victorians (50.2 per cent) indicated that they live with their parents only. Their
average SWB is slightly above the normal range for Australian adults.
Young people who live with their parents as well as others (e.g., their children, partner or other
adults) also report average SWB above the normal range, as do people who live with their partner
only.
People who live alone, live with their children only, live with other adults, and live with their
partner and other adults, all have average personal wellbeing below the normal range.
Collectively, these findings attest to the important role that a young person’s parents play in
supporting psychological wellbeing, for example, through the provision of financial resources. These
data also highlight the difficult circumstances that single parents and people living alone face, which
significantly compromise their wellbeing.
Analysis of scores on the CD-RISC 10 revealed that those who lived with children only maintained a
relatively high level of resilience (M = 63.12, SD = 20.80), which was only significantly lower than
resilience scores for those living with partner and children (M = 81.84, SD = 15.13). These findings can
be seen in Table B.11.

Community survey of young Victorians’ resilience and mental wellbeing. Part A: the report 33
Education status and subjective wellbeing
Figure 14 presents average SWB and resilience scores for Victorian youths, categorised by student
status, compared to the normal range for SWB. More information is provided in Table B.12.
Figure 14: Average SWB and resilience of students and non-students
About 60 per cent of participants identified as being a student. Their average personal wellbeing is
slightly above the normal range for Australian adults, while the average for people who do not study
is within the normal range.
Among young Victorians who study, there were no differences in wellbeing between those who
study full time versus part time. However, and perhaps interestingly, resilience was significantly
higher for non-students compared to students.
Figure 15 presents average SWB and resilience scores for Victorian youths who identify as studying at
each of the following types of institution, compared to the normal range for SWB. More information
is provided in Table B.13.

Community survey of young Victorians’ resilience and mental wellbeing. Part A: the report 34
Figure 15: Average SWB and resilience of students studying at various types of institution
Average personal wellbeing among high-school students is above the normal range and statistically
significantly higher than the average for young people who attend TAFE. This is an interesting result
in light of the finding that high-school students have the lowest average resilience score.
Average personal wellbeing among university students is also above the normal range, while the
average for TAFE students is slightly below.
Finally, average personal wellbeing for young Victorians who report being students but do not
undertake their studies at one of the listed locations is below the normal range.
Resilience is highest for university students, significantly higher than for students still at high
school.
Community survey of young Victorians’ resilience and mental wellbeing. Part A: the report 35
Work status and subjective wellbeing
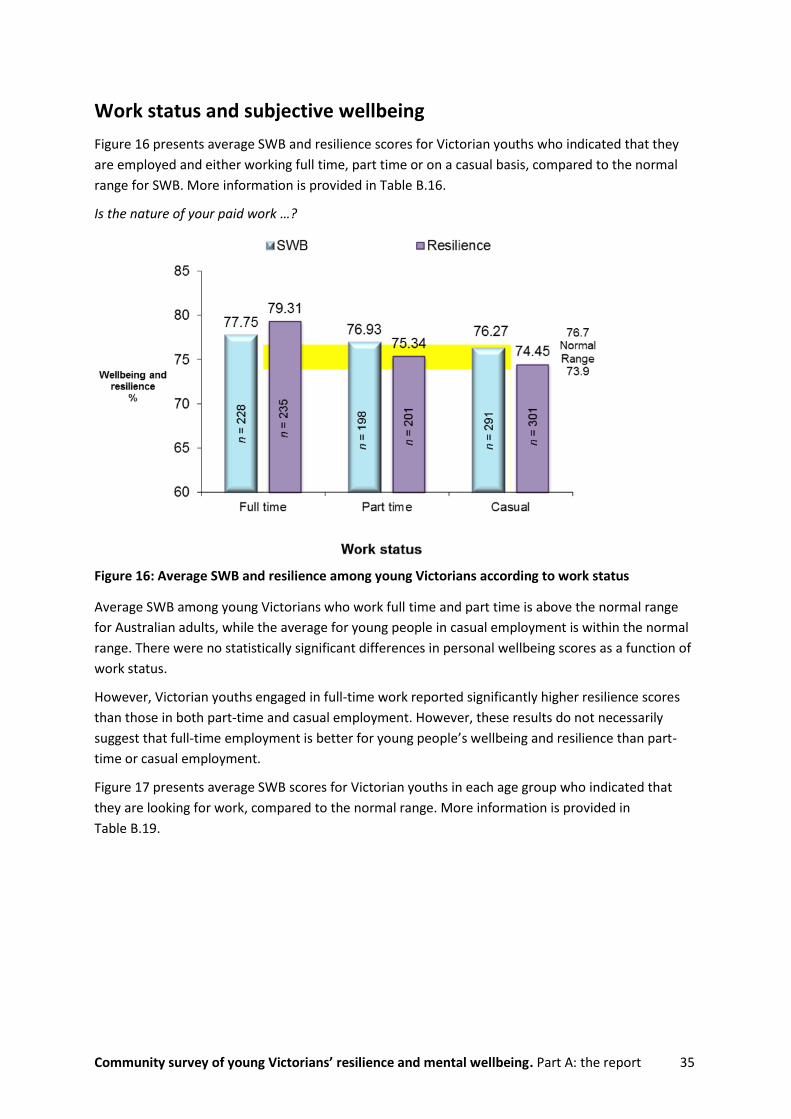
Figure 16 presents average SWB and resilience scores for Victorian youths who indicated that they
are employed and either working full time, part time or on a casual basis, compared to the normal
range for SWB. More information is provided in Table B.16.
Is the nature of your paid work …?
Figure 16: Average SWB and resilience among young Victorians according to work status
Average SWB among young Victorians who work full time and part time is above the normal range
for Australian adults, while the average for young people in casual employment is within the normal
range. There were no statistically significant differences in personal wellbeing scores as a function of
work status.
However, Victorian youths engaged in full-time work reported significantly higher resilience scores
than those in both part-time and casual employment. However, these results do not necessarily
suggest that full-time employment is better for young people’s wellbeing and resilience than part-
time or casual employment.
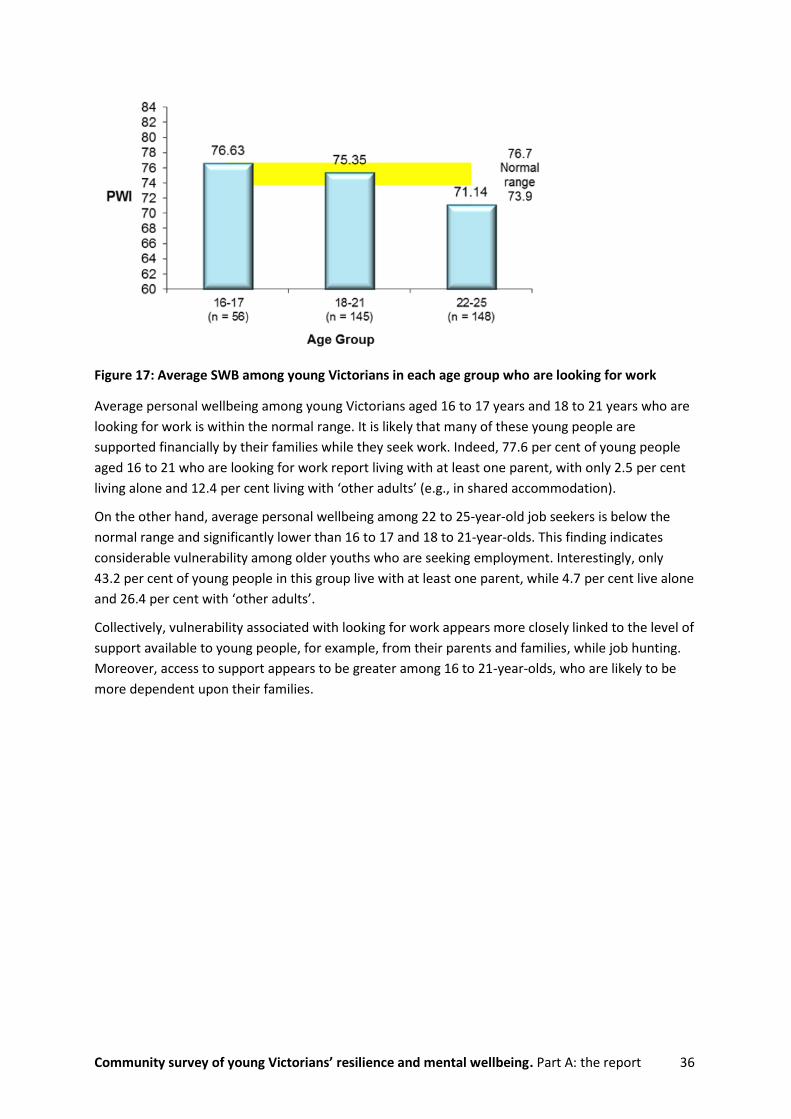
Figure 17 presents average SWB scores for Victorian youths in each age group who indicated that
they are looking for work, compared to the normal range. More information is provided in
Table B.19.
Community survey of young Victorians’ resilience and mental wellbeing. Part A: the report 36
Figure 17: Average SWB among young Victorians in each age group who are looking for work
Average personal wellbeing among young Victorians aged 16 to 17 years and 18 to 21 years who are
looking for work is within the normal range. It is likely that many of these young people are
supported financially by their families while they seek work. Indeed, 77.6 per cent of young people
aged 16 to 21 who are looking for work report living with at least one parent, with only 2.5 per cent
living alone and 12.4 per cent living with ‘other adults’ (e.g., in shared accommodation).
On the other hand, average personal wellbeing among 22 to 25-year-old job seekers is below the
normal range and significantly lower than 16 to 17 and 18 to 21-year-olds. This finding indicates
considerable vulnerability among older youths who are seeking employment. Interestingly, only
43.2 per cent of young people in this group live with at least one parent, while 4.7 per cent live alone
and 26.4 per cent with ‘other adults’.
Collectively, vulnerability associated with looking for work appears more closely linked to the level of
support available to young people, for example, from their parents and families, while job hunting.
Moreover, access to support appears to be greater among 16 to 21-year-olds, who are likely to be
more dependent upon their families.

Community survey of young Victorians’ resilience and mental wellbeing. Part A: the report 37
Income status and subjective wellbeing
Figure 18 presents average SWB and resilience scores for Victorian youths according to combined
level of household income, compared to the normal range for SWB. More information is provided in
Table B.17.
Figure 18: Average SWB and resilience among young Victorians by household income category compared to adult normal range
Average SWB is within the normal range for all household income categories between $31,000 and
$60,000 and between $151,000 and $500,000. Although there is a general trend for average SWB to
increase coincident with increasing income for each group between $31,000 and $500,000, these
differences are not statistically significant.
Not surprisingly, average SWB is below the normal range for the two lowest income categories.
These findings are consistent with adult data collected as part of the Australian Unity Wellbeing
Index and highlight vulnerability among young Victorians who live in low-income households. The
finding, however, that average SWB among people in the $500,000+ household income category is
below the normal range is unexpected, although this result should be interpreted with caution due to
the very small sample size.
The collective findings highlight additional challenges that young people in low-income households
face, and support the need for targeted interventions that assist young adults from low-income or
low-socioeconomic households and backgrounds.

Community survey of young Victorians’ resilience and mental wellbeing. Part A: the report 38
Perceived social support among Victorian youths
Figure 19 presents average SWB and resilience scores for Victorian youths according to their
perception that they can get help from family, friends or neighbours when in need, compared to the
normal range for SWB. More information is provided in Table B.18.
Can you get help from friends, family or neighbours when needed?
Figure 19: Average SWB and resilience and perceived social support
76.3 per cent of young Victorians responded “Yes, definitely” to the question “Can you get help from
friends, family or neighbours when needed?” Average SWB for this group is above the adult normal
range, highlighting an association between perceptions of access to social support and above-
average personal wellbeing.
Average SWB for all other groups is below the normal range and highlights vulnerability among
young people who feel that they would have limited access to social support in a time of need. This
finding is very concerning, given that approximately one in four respondents feel this way.
The average resilience score for those who responded “Yes, definitely” is also significantly higher
than for all other groups.
Participants were also asked whether they belonged to any social clubs, groups or organisations.
Almost half of participants (44.5 per cent) reported that they belonged to at least one such group,
with most (34.3 per cent) associating with a sport or physical recreation group.
Belonging to a sport or physical activity group was associated with higher average wellbeing scores
(M = 79.15, SD = 74.55) and higher average resilience (M = 77.83, SD = 74.14) than those who did
not belong to one (PWI: M = 74.55, SD = 12.90; CD-RISC 10: M = 74.14, SD = 14.23).

Community survey of young Victorians’ resilience and mental wellbeing. Part A: the report 39
Negative affectivity in Victorian youths
Respondents were asked three questions regarding how lonely, stressed and anxious they generally
feel, using an 11-point, end-defined scale ranging from 0 (Not at all) to 10 (Extremely). These scores
have been standardised onto a 0 to 100-point scale. In order to gain a better understanding of the
degree of correspondence between PWI scores and negative affectivity, scores on each of the three
single-item negative affect variables were recoded into different percentage point categories: 0–10,
11–20, 21–30, 31–40, 41–50, 51–60, 61–70, 71–80, 81–90 and 91+. Presenting negative affect scores
in this way affords greater insight into what levels of loneliness, stress and anxiety are coincident
with average personal wellbeing falling below the normal range.
Figure 20 presents average SWB scores (represented on the vertical axis) for each corresponding
loneliness category score (represented on the horizontal axis). The yellow bar represents the
Australian adult normal range for the PWI based on average scores for grouped data. More
information is provided in Table B.31.
Figure 20: The relationship between SWB and general feelings of loneliness
For people who report loneliness scores between 0 and 30 points, their average SWB is above or
within the normal range, though it decreases from a very high 82.52 points in the 0–10 point
loneliness group to 75.79 points in the 30-point loneliness group. Approximately two-thirds of all
respondents (61 per cent) score in these lower ranges for feelings of loneliness.
As the intensity of felt loneliness increases to 40 points, average SWB falls below the normal range,
where it continues to decrease coincident with increasing feelings of loneliness.
These findings suggest a strong association between loneliness and SWB, with groups of people who
score 40 points and higher on loneliness at greater risk of low wellbeing and depression. This result is
concerning, given that 39 per cent of all respondents score within this range, and has implications for
education and service delivery.
Figure 21 presents average SWB scores (represented on the vertical axis) for each corresponding
stress category score (represented on the horizontal axis). The yellow bar represents the Australian
adult normal range for the PWI. More information is provided in Table B.31.

Community survey of young Victorians’ resilience and mental wellbeing. Part A: the report 40
Figure 21: The relationship between SWB and general feelings of stress
At stress scores of between 0 and 70 points, average SWB is above or within the normal range. This is
a very interesting finding and suggests that, on average, even at the level of 70 points, stress is not
associated with below-average wellbeing.
Young people who report low levels of stress relative to their peers (e.g., between 0 and 30 points)
have an average SWB above 80 points. Average SWB above 80 points is suggestive of a low challenge
or risk group, with a lower than normal proportion of people likely to be experiencing a level of SWB
below their normal set-point range.
Once feelings of stress reach a level of 80 points, however, SWB falls sharply below the normal range.
71 to 80 per cent appears to be the threshold and the level at which feelings of stress are associated
detrimentally with personal wellbeing. Almost one-quarter of Victorian youths (23 per cent)
experience general feelings of stress at the level of 80 points or above, placing them at a higher risk
of low wellbeing and depression.
Figure 22 presents average SWB scores (represented on the vertical axis) for each corresponding
anxiety category score (represented on the horizontal axis). The yellow bar represents the Australian
adult normal range for the PWI. More information is provided in Table B.31.
Figure 22: The relationship between SWB and general feelings of anxiety
At anxiety scores of between 0 and 60 points, average SWB is above or within the normal range,
despite decreasing from a high of 84.48 points in the 0–10 point anxiety group, to 74.79 in the
60-point anxiety group.

Community survey of young Victorians’ resilience and mental wellbeing. Part A: the report 41
Once general feelings of anxiety reach 70 points, average SWB falls below the normal range, placing
the 27 per cent of all young people who score between 70 and 100 points at a higher risk of low
wellbeing and depression.
Based on data presented in Figures 20–22, the authors propose the following guidelines for
interpreting negative affect scores measured as single items, informed by their relationship to SWB.
The categories for negative affect have been proposed using the following criteria:
‘Normal’ = SWB average score within or above normal range of 73.9 to 76.7 points
‘At risk’ = SWB average score below normal range and above 70 points
‘High risk’ = SWB average score below 70 points
Table 3: Suggested guidelines for interpreting single-item measures of ‘lonely’, ‘stressed’ and ‘anxious’ based on their influence on personal wellbeing
Affect categorisation
Affect Normal At risk High risk
Lonely 0–30 points (0–3) 40–60 points (4–6) 70–100 points (7–10)
Stressed 0–70 points (0–7) 80 points (8) 90–100 points (9–10)
Anxious 0–60 points (0–6) 70–80 points (7–8) 90–100 points (9–10)
Note: Scores in parentheses represent unstandardised 0–10 scale responses
Collectively, and somewhat surprisingly, the data suggest that general feelings of loneliness may be
more detrimental to personal wellbeing than general feelings of either stress or anxiety, with
feelings of loneliness associated with SWB scores below the normal range at much lower levels of
intensity.

Community survey of young Victorians’ resilience and mental wellbeing. Part A: the report 42
High and low wellbeing/resilience groups
Figure 23 presents average SWB and resilience scores for Victorian youths with higher than normal
group average wellbeing, compared to the normal range for SWB. More information is provided in
Table B.21.
Figure 23: Groups with higher than normal SWB and corresponding resilience scores
Collectively, these results highlight financial and interpersonal-related factors as being associated
with above-average wellbeing and resilience. For example, young people who live in higher-income
households and have access to at least one other source of income, young people who participate in
sport and other social activities, married young people, and young people who report always having
someone to turn to when needed, all report wellbeing scores above the normal range, and also
exhibit high resilience.
These findings are consistent with data obtained from the Australian Unity Wellbeing Index, which
suggest that money and relationships are two important buffers to personal wellbeing that support
adaptation to life stressors during times of challenge.
Figure 24 presents average SWB and resilience scores for Victorian youths with lower than normal
group average wellbeing, compared to the normal range for SWB. More information is provided in
Table B.21.

Community survey of young Victorians’ resilience and mental wellbeing. Part A: the report 43
Figure 24: Groups with lower than normal SWB and corresponding resilience scores
These results corroborate the previous assertion that interpersonal and financial-related factors are
associated with wellbeing and resilience. It is evident from Figure 24 that, on average, groups of
people low on social support (e.g., people who cannot always access help when needed, people who
live alone) and groups on low incomes or seeking employment have lower than normal wellbeing.

Community survey of young Victorians’ resilience and mental wellbeing. Part A: the report 44
General discussion, research implications and limitations
Study aims
The major aim of this research was to provide VicHealth with a baseline measure of the
prevalence of resilience and mental wellbeing among young Victorians, and to describe their
levels of mental wellbeing.
A further aim of this research was to investigate the utility of a common measure of resilience,
the 10-item Connor-Davidson Resilience Scale.
Overall results for subjective wellbeing
Average personal wellbeing for young Victorians is within the normal range for Australian adults
This result suggests that the present sample of young Victorians can be considered a ‘normal’
sample, experiencing levels of personal wellbeing comparable to those of Australia’s mainstream
adult population.
Similar to Australian adults, approximately three-quarters (75.3 per cent) of young Victorians
scored in the normal range (70+ points).
20.4 per cent and 4.3 per cent of young people respectively scored in the ‘challenged’ and ‘high-
risk’ ranges for personal wellbeing, suggesting that approximately one in four young people are
likely to be more vulnerable to depression.
Average scores on the interpersonal PWI domains of ‘Relationships’ and ‘Community Connection’
were below the normative adult ranges.
Lower scores on the two interpersonal domains of ‘Relationships’ and ‘Community Connection’
highlight areas of potential vulnerability among Victoria’s young adult population and may have
implications for education and service delivery.
The lower scores reported on these domains are particularly noteworthy, since it has been
reported that social and family relationships may be especially important for adolescents as they
are heavily reliant on key adults in their lives, including parents and teachers, throughout their
development (Bronfenbrenner, 2005).
Targeted interventions may be most effective if they can engage young people in a supportive
and socially oriented environment in which they can build positive and mutually beneficial
relationships at both personal and community levels. By connecting to others in this way, young
people can build important supportive resources that can be accessed during times of personal
challenge and crisis.
Victorian youths scored above the normal range on the PWI domains of ‘Safety’, ‘Standard of
Living’ and ‘Health’.
The finding that young people scored higher on ‘Safety’ is encouraging, given that young people,
like adults, have a fundamental need to feel safe and secure.

Community survey of young Victorians’ resilience and mental wellbeing. Part A: the report 45
A higher than normal average for ‘Standard of Living’ is not surprising, given that respondents are
primarily young adults, with a majority still living at home with their parents and likely to be able
to access their financial and other supportive resources.
A majority of young people sampled are unlikely to be experiencing the adverse objective health
conditions that may befall an older adult population, and this is evidenced by a higher than
normal average score on the ‘Health’ domain.
Psychometric assessment of CD-RISC 10
First psychometric assessment of CD-RISC 10 in young Victorian sample
Inter-item reliability assessment and factor analysis revealed that the CD-RISC 10 is a reliable
instrument and appears to offer a valid representation of the underlying resilience construct.
This study is the first to clarify the relationship between SWB scores measured using the PWI and
resilience scores measured using the 10-item CD-RISC 10. Specifically, it was determined that
these two variables share a moderate, positive relationship, and group mean SWB is within the
normal range at a CD-RISC 10 score of 71 to 75.
This study has also established that the CD-RISC 10 threshold at which average SWB falls below
the normal range is between 61 and 70 points. This finding leads to a better understanding of the
level at which resilience scores are associated with increased risk of low wellbeing and
depression among young people.
Demographic and other subgroup analyses
Social support and connection are paramount to feelings of personal wellbeing
The findings from this study highlight social support, for example, from family and friends, as
important to the wellbeing of young Victorians, with young people who feel that they can “Yes,
definitely” access support from another person when in need reporting above-average personal
wellbeing.
In contrast, approximately one-quarter of young people report having limited access to social
support in a time of need and these people may be at greater risk of experiencing lower than
normal wellbeing and depression during a time of crisis. As a group, on average, they appear to
have compromised wellbeing.
Living with one’s parents was also identified as a factor associated with normal or above-average
feelings of personal wellbeing; so too is being a part of a sporting or recreational group.
SWB, stress, anxiety and loneliness: loneliness may be the biggest threat to personal wellbeing
This is the first study to clarify the relationship between SWB scores and single-item measures of
general feelings of stress, anxiety and loneliness. This is also the first study to propose evidence-
based guidelines for interpreting single-item measures of ‘Lonely’, ‘Stressed’ and ‘Anxious’ based
on their association with personal wellbeing.
While much research has been devoted to the negative and harmful effects of stress on personal
wellbeing, general feelings of loneliness were found to have a stronger negative influence on
personal wellbeing at lower levels than either stress or anxiety.

Community survey of young Victorians’ resilience and mental wellbeing. Part A: the report 46
Approximately 1 in 8 young Victorians report a very high intensity of loneliness (a score of 70 or
above), which is associated with an average wellbeing well below the normal range
Though Victorian youths report feeling generally high levels of stress, wellbeing only falls below
the normal range for those reporting a very high intensity of stress (over 80 points). This finding
suggests that although it is common for Victorian youths to feel stressed, the effect on their
wellbeing is not substantial until it reaches very high levels (e.g., 80 points and higher). This
finding is testament to the resilience of the sample, such that they can tolerate stress until it
extends beyond a threshold level of 8 out of 10.
Similarly, feelings of anxiety appear to be tolerable until an intensity level of 70 points, when
subjective wellbeing scores fall below the normal range. Thus, although stress and anxiety can
generally be endured until they reach maximum levels, loneliness appears to be predictive of
vulnerability at lower levels.
The implication of these findings is that loneliness appears to have a more hidden, more
detrimental effect on the SWB of young people, and that future education and intervention
initiatives should focus on reducing social isolation and loneliness.
Study limitations and future research opportunities
This study offers a cross-sectional ‘snapshot’ of wellbeing and resilience in a Victorian sample of 1000
young people, and explores the utility of the CD-RISC 10 in this context. Although the findings
supported the reliability and validity of this measure of resilience in a single study, a subsequent
longitudinal study could confirm test-retest reliability and further demonstrate discriminant validity
with other wellbeing-related measures.
In addition, the current sample is representative of a ‘normal’ population, such that a relatively small
proportion of young people are considered to be experiencing chronic challenge to their ordinary
level of personal wellbeing, for example, as a result of one or more life challenges. Given that
resilience is considered to be a process that is activated in response to challenge or adversity, further
exploration of the CD-RISC 10 should be undertaken with clinical or challenged samples, to
determine its capacity for influence or change in critical times.
It is important to note also that the Australian adult normative range for SWB of between 73.9 and
76.7 points has been calculated using data for adults aged between 18 and 80+ years. Thus, these
comparative data may not represent a true indication of the normative range for SWB among young
Victorians. However, given that this is the first study of its kind in Victoria, and that no normative
data exist for people aged 16 to 25 years, the Australian adult normative range employed is the most
reliable comparative data available and sufficient for this purpose. However, we do recommend that
future research should seek to obtain normative SWB data for young Victorians.
Conclusions
Victorian youths have a level of subjective wellbeing that generally reflects the normative range for
the Australian adult population. Their wellbeing is also positively and moderately correlated with
resilience. Despite the generally high scores on wellbeing, not all subgroups who scored above
average on wellbeing expressed high corresponding resilience. For example, young Victorians
attending high school reported higher subjective wellbeing than other student groups, but their
Community survey of young Victorians’ resilience and mental wellbeing. Part A: the report 47
overall resilience was relatively lower. This report highlights the importance of other factors related
to resilience and personal wellbeing, such as interpersonal (e.g., supportive relationships) and
economic (e.g., income), and provides baseline data that will serve to guide the interpretation of
data collected in future studies.

Community survey of young Victorians’ resilience and mental wellbeing. Part A: the report 48
References
Blore, JD, Stokes, M, Mellor, D, Firth, L & Cummins, RA 2011, ‘Comparing multiple discrepancies theory to affective models of subjective wellbeing’, Social Indicators Research, vol. 100, no. 1, pp. 1–16.
Bronfenbrenner, U 2005, Making human beings human: bioecological perspectives on human development, Sage Publication Ltd, Thousand Oaks CA.
Campbell-Sills, L & Stein, MB 2007, ‘Psychometric analysis and refinement of the Connor-Davidson Resilience Scale (CD-RISC): validation of a 10-item measure of resilience’, Journal of Traumatic Stress, vol. 20, no. 6, pp. 1019–1028.
Connor, KM & Davidson, JRT 2003, ‘Development of a new resilience scale: the Connor-Davidson Resilience Scale (CD-RISC)’, Depression and Anxiety, vol. 18, no. 2, pp. 76–82.
Cummins, RA 1995, ‘On the trail of the gold standard for subjective wellbeing’, Social Indicators Research, vol. 35, no. 2, pp. 179–200.
Cummins, RA 2000a, ‘Personal income and subjective wellbeing: a review’, Journal of Happiness Studies, vol. 1, no. 2, pp. 133–158.
Cummins, RA 2000b, ‘Objective and subjective quality of life: an interactive model’, Social Indicators Research, vol. 52, no. 1, pp. 55–72.
Cummins, RA 2010, ‘Subjective wellbeing, homeostatically protected mood and depression: a synthesis’, Journal of Happiness Studies, vol. 11, no. 1, pp. 1–17.
Cummins, RA & Lau, ADL 2005, Personal wellbeing index – school children (PWI-SC), 3rd edn, Deakin University, Melbourne.
Cummins, RA, Li, N, Wooden, M & Stokes, M 2014, ‘A demonstration of set-points for subjective wellbeing’, Journal of Happiness Studies, vol. 15, no. 1, pp. 183–206.
Cummins, RA, Woerner, J, Weinberg, M, Collard, J, Hartley-Clark, L & Horfiniak, K 2013, Australian Unity Wellbeing Index survey 30.0: part A: the report: the wellbeing of Australians: social media, personal achievement, and work, Deakin University, Melbourne, www.acqol.com.au/reports/survey-reports/survey-030-report-part-a.pdf.
Davern, MT, Cummins, RA & Stokes, MA 2007, ‘Subjective wellbeing as an affective-cognitive construct’, Journal of Happiness Studies, vol. 8, no. 4, pp. 429–449.
Davidson, JR, Payne, VM, Connor, KM, Foa, EB, Rothabum, BO, Hertzberg, MA & Weisler, RH 2005, ‘Trauma, resilience, and saliostasis: effects of treatment on posttraumatic stress disorder’, International Clinical Psychopharmacology, vol. 20, no. 1, pp. 43–48.
Eid, M & Diener, E 2004, ‘Global judgements of subjective wellbeing: situational variability and long-term stability’, Social Indicators Research, vol. 65, no. 3, pp. 245–277.
Headey, B & Wearing, A 1989, ‘Personality, life events, and subjective wellbeing: toward a dynamic equilibrium model’, Journal of Personality and Social Psychology, vol. 57, no. 4, pp. 731–739.
Headey, B & Wearing, A 1992, Understanding happiness: a theory of subjective wellbeing, Longman Cheshire, Melbourne.
International Wellbeing Group 2013, Personal Wellbeing Index: user manual, 5th edn, Deakin University, Melbourne.

Community survey of young Victorians’ resilience and mental wellbeing. Part A: the report 49
Luthar, SS, Cicchetti, D & Becker, B 2000, ‘The construct of resilience: a critical evaluation and guidelines for future work’, Child Development, vol. 71, no. 3, pp. 543–562.
Merriam-Webster 2012, viewed 28 March 2015, www.merriam-webster.com.
Schimmack, U, Diener, E & Oishi, S 2002, ‘Life‐satisfaction is a momentary judgment and a stable personality characteristic: the use of chronically accessible and stable sources’, Journal of Personality, vol. 70, no. 3, pp. 345–384.
Tabachnick, BG & Fidell, LS 2015, Using multivariate statistics, 6th edn, Allyn & Bacon, MA.
Tomyn, AJ & Cummins, RA 2011, ‘Subjective wellbeing and homeostatically protected mood: theory validation with adolescents’, Journal of Happiness Studies, vol. 12, no. 5, pp. 897–914.
Windle, G, Bennett, KM & Noyes, J 2011, ‘A methodological review of resilience measurement scales’, Health and Quality of Life Outcomes, vol. 9, no. 8, pp. 1–18.

Community survey of young Victorians’ resilience and mental wellbeing. Part A: the report 50
Appendix A: Survey questionnaire
Community survey of young Victorians’ resilience and mental wellbeing
Interview questionnaire and PLS
“Hello, my name is ………… I’m calling from iView on behalf of VicHealth. We are doing a survey on
how people feel about their lives in general that will only take about 10 minutes to complete. This
research has been approved by the Cairnmillar Institute Human Research Ethics Committee.”
Can I confirm please that you live in the state of Victoria and are between the ages of 16 and 25
years?
Instructions: If the person who answers meets the criteria for inclusion, then continue. If they do not
live in Victoria and/or are not aged between 16 and 25 years, thank the person for their time and
inform them that you cannot continue with the interview.
“The community survey of young Victorians’ resilience and mental wellbeing involves asking you
questions about how satisfied you are with different aspects of your life and about how you cope
with things that happen in your life. Would you like to share your views by being involved in this
survey?”
“Thank you”
“I’d like to inform you that you do not have to answer any question you do not feel comfortable
answering, and that you’re welcome to withdraw at any time during this survey. If you do withdraw,
your answers will not be included in the analysed results. There are no anticipated risks to you for
being involved in this survey, but just in case you feel you need to speak to someone, the number for
Lifeline is 131114.”
“The information you provide will be used to publish an overall survey result. At the end of the
survey I will give you the contact details of the Principal Researcher should you wish to receive
further information regarding this project.”
We may at any time during this interview be listened to by my supervisor for quality control
purposes.
Do you understand these procedures?
Do you have any questions before we proceed?"
“Are you happy to proceed?”
"Thank you. Now I will ask some questions about yourself."
Q0. Interviewer – record the sex of the respondent
○ Male ○ Female
“I am going to ask how satisfied you feel, on a scale of zero to 10.”
“Zero means you feel not at all satisfied. 10 means you feel completely satisfied. And the middle of
the scale is 5.”
“Would you like me to go over this again for you?”

Community survey of young Victorians’ resilience and mental wellbeing. Part A: the report 51
“In that case I will start by asking how satisfied you are with life. So, -----------”
(Group – Personal Wellbeing)
(Subgroup – Personal Abstract)
Q1. Thinking about your own life and personal circumstances, how satisfied are you with your life as a whole?
0 1 2 3 4 5 6 7 8 9 10
○ Don’t know ○ Don’t understand
(Subgroup – Personal Domains)
“Turning now to various areas of your life, -----------”
How satisfied are you …?
Q2. With your standard of living?
0 1 2 3 4 5 6 7 8 9 10
○ Don’t know ○ Don’t understand
Q3. With your health?
0 1 2 3 4 5 6 7 8 9 10
○ Don’t know ○ Don’t understand
Q4. With what you are currently achieving in life?
0 1 2 3 4 5 6 7 8 9 10
○ Don’t know ○ Don’t understand
Q5. With your personal relationships?
0 1 2 3 4 5 6 7 8 9 10
○ Don’t know ○ Don’t understand

Community survey of young Victorians’ resilience and mental wellbeing. Part A: the report 52
Q6. With how safe you feel?
0 1 2 3 4 5 6 7 8 9 10
○ Don’t know ○ Don’t understand
Q7. With feeling part of your community?
0 1 2 3 4 5 6 7 8 9 10
○ Don’t know ○ Don’t understand
Q8. With your future security?
0 1 2 3 4 5 6 7 8 9 10
○ Don’t know ○ Don’t understand
“The following questions are about different feelings that we might all experience at one time or
another. I will ask you how often you generally experience each feeling.
“Zero means not at all. 10 means extremely. And the middle of the scale is 5.”
“Would you like me to go over this again for you?”
“In that case …”
Q9. How lonely do you generally feel?
0 1 2 3 4 5 6 7 8 9 10
Not at all Extremely
Q10. How stressed do you generally feel?
0 1 2 3 4 5 6 7 8 9 10
Not at all Extremely
Q11. How anxious do you generally feel?
0 1 2 3 4 5 6 7 8 9 10
Not at all Extremely

Community survey of young Victorians’ resilience and mental wellbeing. Part A: the report 53
Ok, thank you. Now a few questions about social support.
Q11. Can you get help from friends, family or neighbours when needed?
○ Yes, definitely ○ Sometimes ○ Rarely ○ Not at all □ Don’t understand □ Declined to answer
If response to Q12 is ‘Not at all’, skip to Q14.
Q12. Can you get help from friends, family or neighbours when needed?
○ Yes, definitely ○ Sometimes ○ Rarely ○ Not at all □ Don’t understand □ Declined to answer
If response to Q12 is ‘Not at all’, skip to Q14.
Q13. How satisfied are you with the support that you receive from …
a) Your friends
b) Your family
c) Your neighbours
0 = not at all satisfied, 10 = completely satisfied
Q14. Are you currently involved in any organised social, sporting or recreational groups?
If ‘yes’, prompt for which ones. More than one response is allowed.
1. Sport or physical recreation group
2. Religious, youth or other spiritual group or organisation
3. Special interest or hobby group
4. Ethnic or multicultural club
5. Social club or group through school/university/TAFE
6. Online group or community
7. No active involvement in social groups

Community survey of young Victorians’ resilience and mental wellbeing. Part A: the report 54
“Now we are going to ask you some questions about how you cope with things that happen in your
life.”
“For these items, you rate the extent to which each item is true for you. So, 0 means it is ‘not true at
all’ and 10 means it is ‘extremely true’.”
Q15. I am able to adapt to change
0 1 2 3 4 5 6 7 8 9 10
Not at all true Extremely true
Q16. I can deal with whatever comes
0 1 2 3 4 5 6 7 8 9 10
Not at all true Extremely true
Q17. I see the humorous side of things
0 1 2 3 4 5 6 7 8 9 10
Not at all true Extremely true
Q18. Coping with stress can strengthen me
0 1 2 3 4 5 6 7 8 9 10
Not at all true Extremely true
Q19. I tend to bounce back after illness or hardship
0 1 2 3 4 5 6 7 8 9 10
Not at all true Extremely true
Q20. I can achieve my goals despite obstacles
0 1 2 3 4 5 6 7 8 9 10
Not at all true Extremely true
Q21. I can stay focused under pressure

Community survey of young Victorians’ resilience and mental wellbeing. Part A: the report 55
0 1 2 3 4 5 6 7 8 9 10
Not at all true Extremely true
Q22. I am not easily discouraged by failure
0 1 2 3 4 5 6 7 8 9 10
Not at all true Extremely true
Q23. I think of myself as a strong person
0 1 2 3 4 5 6 7 8 9 10
Not at all true Extremely true
Q24. I can handle unpleasant feelings
0 1 2 3 4 5 6 7 8 9 10
Not at all true Extremely true
Demographics
-----------------------------------------------------------------------------------------------------
“Now, just a few more questions about yourself.”
Q25. Can you tell me your age? Interviewer type in age.
□ Declined to answer
------------------------------------------------------------------------------------

Community survey of young Victorians’ resilience and mental wellbeing. Part A: the report 56
Q26. Which of the following best describes your current marital status? Are you …
READ OUT
1. Married
2. Living with a partner
3. Widowed
4. Divorced
5. Separated, or
6. Never married
7. (Don’t know)
8. (Refused)
Q27. I am going to ask who lives in your household. Please indicate from the list I will read who lives with you.
[MR, code 1, 6 exclusive]
1. No one, you live by yourself
2. You live with your partner
3. With one or more children
4. With one or both of your parents
5. With one or more adults who are neither your partner nor your parent
6. Declined to answer
Q28. Are you a student?
If yes, GO TO Q28b. If no, GO TO Q29.
Q28b. Are you currently studying at …
○ High school ○ University ○ TAFE ○ Other
If ‘high school’, GO TO Q28c. If ‘university’, ‘TAFE or ‘other’, go to Q28d.
Q28c. What year level are you currently in at school? Interviewer type in year level.
Q28d. Do you study…
○ Full time ○ Part time

Community survey of young Victorians’ resilience and mental wellbeing. Part A: the report 57
Q29. Are you involved in paid work in a full time, part time, or casual capacity? YES/NO
○ Full time ○ Part time
If yes, GO TO Q29b. If no, GO TO Q29c.
Q29b. Is the nature of your paid work …
○ Full time ○ Part time ○ Casual
Q29c. Are you looking for work?
○ Yes ○ No □ Declined to answer
Q30. I will now give you a number of categories for household income. Can you please give me an idea of your household’s total annual income before tax? Let me first ask – is your total household income less than $100,000?
YES NO
Is it less than $15,000 □
Is it between:
$15,000 – $30,000 □
$31,000 – $60,000 □
$61,000 – $100,000 □
Is it between:
$101,000 – $150,000 □
$151,000 – $250,000 □
$251,000 – $500,000 □
More than $500,000 □
□ Declined to answer
Q31. Are you of Aboriginal or Torres Strait Islander descent?
○ Yes ○ No □ Declined to answer
The researcher that you can contact for any queries or to receive a summary report of the research
findings is Dr Adrian Tomyn on 9650 0411.
Thank you for helping us with this survey. Standard iView privacy/close
RECORD POSTCODE
RECORD DATE TIME INTERVIEW DURATION
**End of telephone survey**
**NO MORE QUESTIONS*
Community survey of young Victorians’ resilience and mental wellbeing
Part B: appended tables

Contents
A. Participant demographics and sample sizes ........................................................................... 5
B. Analyses involving PWI, CD-RISC 10 and other major variables ............................................. 10

Tables
Table A.1 Age × gender ........................................................................................................................... 5
Table A.2 Marital status × gender ........................................................................................................... 5
Table A.3 Household composition × gender ........................................................................................... 5
Table A.4 Education status × gender ....................................................................................................... 6
Table A.5 Full-time vs. part-time education × gender ............................................................................. 6
Table A.6 Workforce participation × gender ........................................................................................... 6
Table A.7 Work status × gender .............................................................................................................. 6
Table A.8 Income × gender ...................................................................................................................... 7
Table A.9 Work status × age .................................................................................................................... 7
Table A.10 Looking for work × age .......................................................................................................... 8
Table A.11 Access to help from others × gender .................................................................................... 8
Table A.12 Group activity involvement ................................................................................................... 8
Table A.13 Indigenous vs. non-Indigenous descent × gender ................................................................. 9
Table B.1 PWI and domain satisfaction scores ...................................................................................... 10
Table B.2 Comparison between Victorian youth and mainstream adult .............................................. 10
Table B.3 Distribution of Victorian youth in each PWI group compared to mainstream ..................... 10
Table B.4 Gender × PWI and domain happiness scores ........................................................................ 11
Table B.5 Distribution of male and female respondents according to PWI group ............................... 11
Table B.6 Gender × CD-RISC 10 ............................................................................................................. 12
Table B.7 Age × PWI and domain happiness scores .............................................................................. 13
Table B.8 Age × PWI group .................................................................................................................... 13
Table B.9 Age × CD-RISC 10 ................................................................................................................... 14
Table B.10 Marital status × PWI and CD-RISC 10 .................................................................................. 14
Table B.11 Household composition × PWI and CD-RISC 10 .................................................................. 15
Table B.12 Education status × PWI and CD-RISC 10 .............................................................................. 16
Table B.13 Type of education × PWI and CD-RISC 10 ............................................................................ 16
Table B.14 Full-time vs. part-time education x PWI and CD-RISC 10 .................................................... 16
Table B.15 Work status × PWI and CD-RISC 10 ..................................................................................... 17
Table B.16 Type of work x PWI and CD-RISC 10 .................................................................................... 17
Table B.17 Income × PWI and CD-RISC 10 ............................................................................................. 18
Table B.18 Social support × PWI and CD-RISC 10 .................................................................................. 18

Table B.19 Work Status × age group × PWI and CD-RISC 10 ................................................................. 19
Table B.20 Support groups and wellbeing/resilience............................................................................ 20
Table B.21 Key demographic risk subgroups × PWI and CD-RISC 10 .................................................... 21
Table B.22 Means, standard deviations and correlations between variables (PWI) ............................ 22
Table B.23 Means, standard deviations and correlations between variables (CD-RISC 10) ................. 23
Table B.24 Means, standard deviations and correlations between all composite and scale variables 24
Table B.25 Exploratory factor analysis (CD-RISC 10 and CD-2) ............................................................. 25
Table B.26 Means and standard deviations for CD-RISC 10items for people who score high on stress
(7+) and normal (PWI > 70) and low (PWI < 70) SWB ........................................................................... 25
Table B.27 Means and standard deviations for PWI for corresponding CD-RISC 10 scores ................. 26
Table B.28 Predicting GLS using the seven domains of the PWI ........................................................... 26
Table B.29 Predicting PWI using the CD-RISC 10 (Stressed > 70) .......................................................... 27
Table B.30 Mean scores and standard deviations for negative affects ................................................ 28
Table B.31 Means and standard deviations for PWI for corresponding negative affect category ....... 29
Table B.32 Means and standard deviations for CD-Risk for corresponding negative affect category . 30

Community survey of young Victorians’ resilience and mental wellbeing. Part B: appended tables 5
A. Participant demographics and sample sizes
Table A.1 Age × gender
Age Male Female Total
16 32 22 54
17 55 45 100
18 40 38 78
19 63 40 103
20 49 75 124
21 47 57 104
22 46 87 133
23 46 72 118
24 44 66 110
25 42 31 73
Total 464 533 997
Table A.2 Marital status × gender
Marital status Male Female Total
Married 6 25 31
Living with a partner 34 110 144
Widowed 2 0 2
Divorced 0 0 0
Separated 1 8 9
Never married 419 388 807
Total 462 531 993
Table A.3 Household composition × gender
Who lives in your household? Male Female Total
Lives alone 16 17 33
Lives with parents 259 241 500
Lives with other adults 75 84 159
Lives with partner only 23 70 93
Lives with parents and children 29 28 57
Lives with parents and other adults 33 21 54
Lives with partner and children 3 22 25
Lives with partner and parents 4 15 19
Lives with partner and other adults 5 8 13
Lives with children only 3 8 11
Other combination 14 19 33
Total 464 533 997

Community survey of young Victorians’ resilience and mental wellbeing. Part B: appended tables 6
Table A.4 Education status × gender
Are you a student? Male Female Total
‘Yes’
High School 90 77 167
University 133 187 320
TAFE 38 45 83
Other 9 13 22
Subtotal ‘Yes’ 270 322 592
‘No’ 194 211 405
Total 450 523 973
Table A.5 Full-time vs. part-time education × gender
Do you study …? Male Female Total
Full time 147 202 349
Part time 33 43 77
Total 180 245 425
Table A.6 Workforce participation × gender
Are you involved in paid work? Male Female Total
Yes 336 412 748
No 128 121 249
Total 464 533 997
Table A.7 Work status × gender
Is the nature of your paid work …? Male Female Total
Full time 117 123 240
Part time 85 120 205
Casual 134 169 303
Total 336 412 748
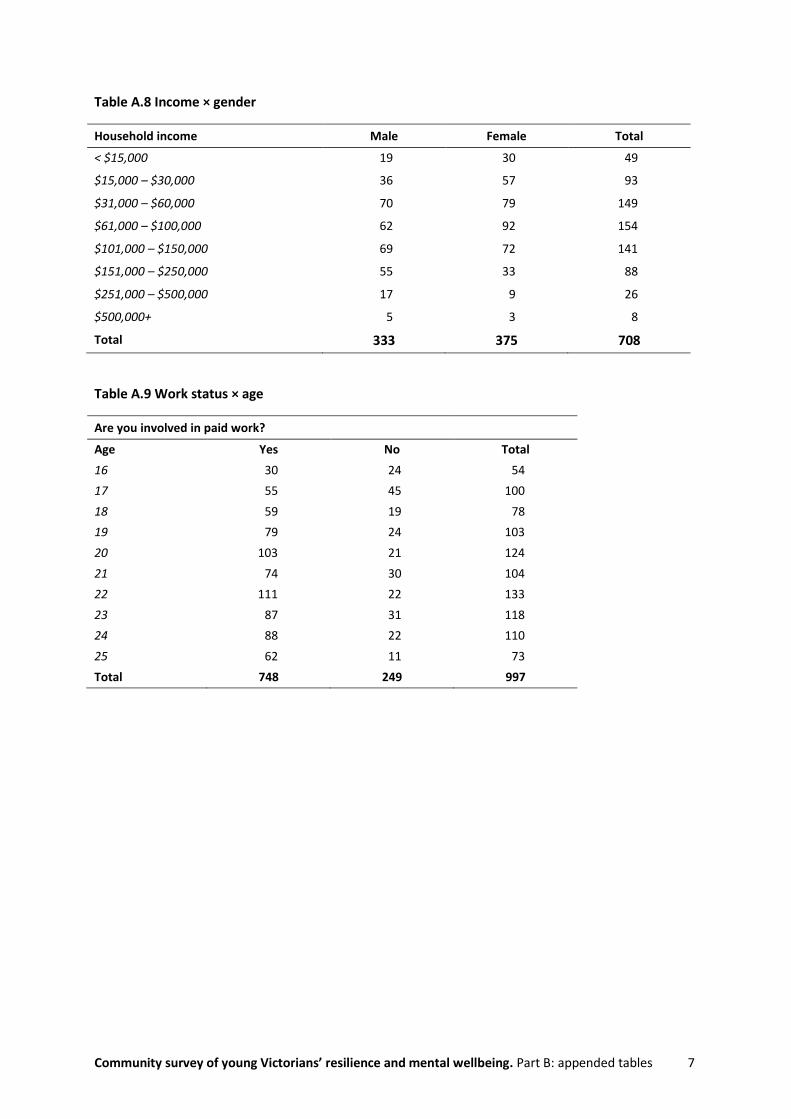
Community survey of young Victorians’ resilience and mental wellbeing. Part B: appended tables 7
Table A.8 Income × gender
Household income Male Female Total
< $15,000 19 30 49
$15,000 – $30,000 36 57 93
$31,000 – $60,000 70 79 149
$61,000 – $100,000 62 92 154
$101,000 – $150,000 69 72 141
$151,000 – $250,000 55 33 88
$251,000 – $500,000 17 9 26
$500,000+ 5 3 8
Total 333 375 708
Table A.9 Work status × age
Are you involved in paid work?
Age Yes No Total
16 30 24 54
17 55 45 100
18 59 19 78
19 79 24 103
20 103 21 124
21 74 30 104
22 111 22 133
23 87 31 118
24 88 22 110
25 62 11 73
Total 748 249 997

Community survey of young Victorians’ resilience and mental wellbeing. Part B: appended tables 8
Table A.10 Looking for work × age
Are you looking for work?
Age Yes No Total
16 28 26 54
17 28 72 100
18 32 46 78
19 38 65 103
20 40 84 124
21 40 64 104
22 49 84 133
23 48 70 118
24 30 79 109
25 26 47 73
Total 359 637 996
Table A.11 Access to help from others × gender
Can you get help from friends, family or neighbours when needed?
Male Female Total
Yes, definitely 355 408 763
Sometimes 87 102 189
Rarely 16 14 30
Not at all 5 9 14
Total 463 533 996
Table A.12 Group activity involvement
Current involvement in groups
Group or activity Yes No Total
Sport or physical recreation group 342 655 997
Religious, youth or other spiritual group or organisation 61 936 997
Special interest or hobby group 85 912 997
Ethnic or multicultural club 4 993 997
Social club or group through school/university/TAFE 84 913 997
Online group or community 39 958 997
No active involvement in social groups 553 444 997

Community survey of young Victorians’ resilience and mental wellbeing. Part B: appended tables 9
Table A.13 Indigenous vs. non-Indigenous descent × gender
Are you of Indigenous descent? Male Female Total
Yes 9 13 22
No 454 520 974
Total 463 533 996

Community survey of young Victorians’ resilience and mental wellbeing. Part B: appended tables 10
B. Analyses involving PWI, CD-RISC 10 and other major variables
Table B.1 PWI and domain satisfaction scores
Mean SD N
PWI 76.16 12.39 954
1. Standard of living 82.26 16.17 996
2. Health 77.06 19.18 996
3. Achieving in life 73.98 19.07 995
4. Relationships 76.19 21.36 994
5. Safety 84.65 16.78 996
6. Community connection 68.20 22.30 987
7. Future security 72.53 19.18 986
Table B.2 Comparison between Victorian youth and mainstream adult
Victorian youths AU Survey 1–31 AU Survey 1–31
N = 954 58,140 5,239
M1 SD1 Adult normal range 18–25 normal range
PWI 76.16 12.39 73.86 – 76.73 71.77 – 78.86
1. Standard of living 82.26 16.17 75.62 – 80.17 75.83 – 83.60
2. Health 77.06 19.18 73.09 – 76.07 74.64 – 83.90
3. Achieving in life 73.98 19.07 71.93 – 75.23 69.67 – 77.15
4. Relationships 76.19 21.36 77.56 – 81.43 72.36 – 79.74
5. Safety 84.65 16.78 75.78 – 82.40 75.08 – 86.14
6. Community connection 68.20 22.30 68.85 – 73.39 61.67 – 71.86
7. Future security 72.53 19.18 68.62 – 73.57 66.88 – 75.53
Table B.3 Distribution of Victorian youth in each PWI group compared to mainstream
Victorian youth AU Survey 1–31 AU Survey 1–31
Adults 18–25 years
PWI range N % N % N %
0–50 (high risk) 41 4.3 2,561 4.4 195 3.7
51–69 (challenged) 195 20.4 12,389 21.3 1,156 22.1
70+ (normal) 718 75.3 43,190 74.3 3,888 74.2
Total 954 100.0 58,140 100.0 5,239 100.0

Community survey of young Victorians’ resilience and mental wellbeing. Part B: appended tables 11
Table B.4 Gender × PWI and domain happiness scores
Male Female
M1 SD1 N M2 SD2 N Difference
(M1 – M2)
p =
PWI 76.79 12.24 437 75.63 12.50 517 1.16 0.149
1. Standard of living 82.01 16.57 463 82.48 15.82 533 –0.47 0.649
2. Health 79.72 17.85 464 74.74 19.99 532 4.98 <0.001
3. Achieving in life 74.24 19.31 462 73.75 18.87 533 0.49 0.686
4. Relationships 74.68 22.52 462 77.50 20.23 532 –2.82 0.038
5. Safety 86.76 15.86 463 82.81 17.35 533 3.95 <0.001
6. Community connection
68.78 23.15 458 67.69 21.54 529 1.09 0.447
7. Future security 73.47 19.08 458 71.70 19.25 528 1.77 0.149
Note: Statistically significant p values in bold
Table B.5 Distribution of male and female respondents according to PWI group
Male Female Difference
(N1 – N2)
PWI range N1 % N2 % %
0–50 (high risk) 15 3.4 26 5.0 –1.6
51–69 (challenged) 85 19.5 110 21.3 –1.8
70+ (normal) 337 77.1 381 73.7 3.4
Total 437 100.0 517 100.0

Community survey of young Victorians’ resilience and mental wellbeing. Part B: appended tables 12
Table B.6 Gender × CD-RISC 10
Male Female
M1 SD1 N M2 SD2 N Difference
(M1 – M2)
p =
CD-RISC 10composite 77.58 12.93 454 73.56 13.86 528 4.03 <0.001
1. Adapt to change 78.81 19.24 463 77.24 18.96 533 1.57 0.196
2. Can deal 77.84 18.30 464 74.61 18.51 532 3.24 0.006
3. Humorous side 84.08 18.63 463 80.81 17.33 532 3.27 0.004
4. Coping with stress 71.50 21.22 461 68.14 21.78 533 3.35 0.014
5. Bounce back 79.91 19.18 461 74.37 20.04 531 5.54 <0.001
6. Achieve goals 78.60 18.45 463 75.95 17.47 533 2.65 0.020
7. Can stay focused 72.59 21.81 463 68.71 21.58 533 3.89 0.005
8. Not discouraged 72.68 20.99 463 67.44 22.46 532 5.23 <0.001
9. Strong person 79.52 18.04 462 75.73 18.52 532 3.79 0.001
10. Can handle feelings
77.21 20.29 463 70.09 21.41 532 7.12 <0.001
Note: Statistically significant p values in bold

Community survey of young Victorians’ resilience and mental wellbeing. Part B: appended tables 13
Table B.7 Age × PWI and domain happiness scores
16–17 18–21 22–25 Total
N = 149 392 413
Mean SD Mean SD Mean SD Mean SD p =
PWI 77.85 11.97 77.18 11.74 74.59 12.98 76.16 12.39 0.002
> 22–25, p = 0.017 > 22–25, p = 0.009
1. Standard of living 85.23 12.67 83.81 15.94 79.75 17.12 82.26 16.17 <0.001
> 22–25, p = <0.001 > 22–25, p = 0.001
2. Health 79.61 16.44 77.94 18.91 75.32 20.18 77.06 19.18 0.028
> 22–25, p = 0.028
3. Achieving in life 74.71 18.18 75.20 17.76 72.58 20.46 73.98 19.07 0.121
4. Relationships 74.64 19.87 76.20 20.64 76.72 22.52 76.19 21.36 0.585
5. Safety 85.06 18.37 85.12 16.11 84.06 16.83 84.65 16.78 0.618
6. Community 70.71 20.71 70.10 20.67 65.50 24.01 68.20 22.30 0.004
> 22–25, p = 0.032 > 22–25, p = 0.009
7. Future security 76.27 16.50 73.33 18.24 70.44 20.65 72.53 19.18 0.003
> 22–25, p = 0.002
Note: Statistically significant p values in bold
Table B.8 Age × PWI group
Age group
16–17 18–21 22–25 Total
PWI range N % N % N % N
0–50 (high risk) 4 2.7 14 3.6 23 5.6 41
51–69 (challenged) 29 19.5 70 17.9 96 23.2 195
70+ (normal) 116 77.9 308 78.6 294 71.2 718
Total 149 392 413 954

Community survey of young Victorians’ resilience and mental wellbeing. Part B: appended tables 14
Table B.9 Age × CD-RISC 10
CD-RISC 10
Age group Mean SD N
16–17 71.51 14.20 152
18–21 75.87 13.38 403
22–25 76.38 13.33 427
Total 75.42 13.58 982
ANOVA and post-hocs F(2, 979) = 7.690, p < 0.001
18–21 > 16–17, p = 0.002
22–25 > 16–17, p = <0.001
Table B.10 Marital status × PWI and CD-RISC 10
PWI CD-RISC 10
Marital status Mean SD N Mean SD N
Married 78.37 12.92 30 79.16 12.36 31
Living with a partner 77.85 10.98 134 76.87 13.31 143
Widowed 38.14 – 1 64.00 – 1
Separated 61.86 17.53 9 71.00 12.78 9
Never married 75.98 12.38 778 75.04 13.67 794
Declined to answer – – – 89.00 15.56 2
Don’t know 82.14 3.03 2 76.00 4.24 2
Total 76.16 12.39 954 75.42 13.58 982
ANOVA F(5, 948) = 5.209, p < 0.001 F(6,975) = 1.383, p > 0.05

Community survey of young Victorians’ resilience and mental wellbeing. Part B: appended tables 15
Table B.11 Household composition × PWI and CD-RISC 10
PWI CD-RISC 10
Household composition:
Lives with … Mean SD N Mean SD N
Parents 77.06 12.25 479 74.54 14.01 493
Other adults 73.46 12.36 155 77.19 12.27 156
Partner only 76.89 11.58 86 76.34 12.35 92
Children and parents 77.74 12.52 55 74.65 13.88 57
Parents and others 77.41 10.43 53 75.78 11.78 54
Alone 71.62 10.96 30 75.90 13.81 31
Partner and children 81.07 10.99 24 81.84 15.13 25
Partner and parents 80.16 11.86 18 78.53 11.23 19
Partner and others 71.43 10.56 11 79.23 16.04 13
Children only 59.40 22.09 10 63.12 20.80 10
Other 74.27 12.42 33 73.31 11.96 32
Total 76.16 12.39 954 75.42 13.58 982
ANOVA and post-hocs F(10, 943) = 4.346, p < 0.001
Parents > Children only, p = <0.001
Partner only > Children only, p = 0.001
Partner and children > Children only, p = <0.001
Other adults > Children only, p = 0.023
Children and parents > Children only, p = 0.001
Parents and others > Children only, p = 0.001
Partner and parents > Children only, p = 0.001
Other > Children only, p = 0.041
F(10,971) = 2.225, p < 0.05
Partner and children > Children only, p = 0.012

Community survey of young Victorians’ resilience and mental wellbeing. Part B: appended tables 16
Table B.12 Education status × PWI and CD-RISC 10
PWI CD-RISC 10
Are you a student? Mean SD N Mean SD N
Yes 76.78 11.81 573 74.36 13.19 585
No 75.24 13.18 381 76.98 14.01 397
Total 76.16 12.39 954 75.42 13.58 982
t-test t(952) = 1.879, p > 0.05 t(980) = –2.984, p < 0.001
Table B.13 Type of education × PWI and CD-RISC 10
PWI CD-RISC 10
Are you currently studying at …? Mean SD N Mean SD N
High school 78.25 11.69 161 71.60 14.50 165
University 77.11 11.10 312 76.04 11.97 318
TAFE 73.73 13.19 80 74.20 13.68 81
Other 71.91 15.01 20 71.05 14.71 21
Total 76.78 11.81 573 74.36 13.19 585
ANOVA and post-hocs F(3,569) = 3.875, p < 0.01
High school > TAFE, p = 0.030
F(3,581) = 4.656, p < 0.01
University > High school, p = 0.002
Table B.14 Full-time vs. part-time education x PWI and CD-RISC 10
PWI CD-RISC 10
Education status Mean SD N Mean SD N
Full time 76.23 11.39 337 75.55 12.36 345
Part time 76.06 13.70 75 74.91 13.16 75
Total 76.20 11.83 412 75.44 12.49 420
t-test t(98) = 0.097, p > 0.05 t(418) = 0.405, p > 0.05

Community survey of young Victorians’ resilience and mental wellbeing. Part B: appended tables 17
Table B.15 Work status × PWI and CD-RISC 10
PWI CD-RISC 10
Are you involved in paid work? Mean SD N Mean SD N
Yes 76.92 11.45 717 76.24 12.91 737
No 73.86 14.68 237 72.93 15.19 245
Total 76.16 12.39 954 75.42 13.58 982
t-test t(335) = 2.927, p < 0.01 t(368) = 3.068, p < 0.01
Table B.16 Type of work x PWI and CD-RISC 10
PWI CD-RISC 10
Work status Mean SD N Mean SD N
Full time 77.75 10.65 228 79.31 12.74 235
Part time 76.93 11.12 198 75.34 11.87 201
Casual 76.27 12.23 291 74.45 13.31 301
Total 76.92 11.45 717 76.24 12.91 737
ANOVA and post-hocs F(2,714) = 1.070, p > 0.05
F(2, 734) = 10.263, p < 0.001
Full time > Part time, p = 0.004
Full time > Casual, p = <0.001

Community survey of young Victorians’ resilience and mental wellbeing. Part B: appended tables 18
Table B.17 Income × PWI and CD-RISC 10
PWI CD-RISC 10
Income Mean SD N Mean SD N
< $15,000 73.21 11.52 48 72.21 11.94 48
$15,000 – $30,000 71.48 14.25 89 73.69 15.39 93
$31,000 – $60,000 74.35 13.10 143 73.90 14.19 147
$61,000 – $100,000 77.28 12.05 149 76.75 13.64 151
$101,000 – $150,000 78.24 9.97 135 76.87 12.24 141
$151,000 – $250,000 79.29 9.81 81 79.26 11.46 87
$251,000 – $500,000 81.09 11.77 25 79.80 11.42 25
$500,000+ 70.57 26.19 6 74.57 21.49 8
Total 76.12 12.35 676 75.85 13.52 700
ANOVA and post-hocs F(7,668) = 5.069, p < 0.001
$61–100K > $15–30K, p = 0.011
$101–150K > $15–30K, p = 0.001
$151–250K > $15–30K, p = 0.001
$251–500K > $15–30K, p = 0.014
F(7,692) = 2.635, p < 0.05
Table B.18 Social support × PWI and CD-RISC 10
PWI CD-RISC 10
Can get help Mean SD N Mean SD N
Yes, definitely 78.65 10.68 728 77.42 12.40 755
Sometimes 69.60 12.83 182 68.90 14.55 185
Rarely 61.23 17.32 30 68.56 17.23 29
Not at all 63.92 17.08 14 66.81 19.25 13
Total 76.16 12.39 954 75.42 13.58 982
ANOVA and post-hocs F(3, 950) = 53.496, p < 0.001
Yes > Sometimes, p = <0.001
Yes > Rarely, p = 0.001
Yes > Not at all, p = 0.001
Sometimes > Rarely, p = 0.001
F(3,978) = 25.702, p < 0.001
Yes > Sometimes, p = <0.001
Yes > Rarely, p = 0.002
Yes > Not at all, p = 0.023

Community survey of young Victorians’ resilience and mental wellbeing. Part B: appended tables 19
Table B.19 Work Status × age group × PWI and CD-RISC 10
PWI CD-RISC 10
Looking for work: ‘Yes’ Mean SD N Mean SD N
16–17 76.63 11.62 56 69.94 15.26 56
18–21 75.35 12.10 145 74.82 12.92 147
22–25 71.14 14.50 148 74.09 13.80 149
Total 73.77 13.27 349 73.74 13.75 352
ANOVA F(2,346) = 5.361, p < 0.01
16–17 > 22–25, p = 0.024
18–21 > 22–25, p = 0.019
F(2,349) = 2.666, p > 0.05

Community survey of young Victorians’ resilience and mental wellbeing. Part B: appended tables 20
Table B.20 Support groups and wellbeing/resilience
PWI CD-RISC 10
Group Mean SD N Mean SD N
Sport or physical recreation 79.15 10.78 334 77.83 11.93 340
No 74.55 12.90 620 74.14 14.23 642
t-test t(791) = 5.846, p < 0.001 t(802) = 4.310, p < 0.001
Religious, youth, or other spiritual group/organisation
79.36 9.88 58 77.07 10.73 60
No 75.95 12.51 896 75.31 13.74 922
t-test t(952) = 2.032, p < 0.05 t(72) = 1.206, p > 0.05
Special interest or hobby group 76.96 11.43 82 75.08 13.17 84
No 76.09 12.48 872 75.45 13.63 898
t-test t(952) = 0.613, p > 0.05 t(980) = –0.239, p > 0.05
Ethnic or multicultural club 78.93 3.17 4 63.50 11.59 4
No 76.15 12.42 950 75.47 13.57 978
t-test t(952) = 0.447, p > 0.05 t(980) = –1.760, p > 0.05
Social club or group 78.66 10.11 82 77.33 11.31 84
No 75.93 12.56 872 75.24 13.77 898
t-test t(952) = 1.911, p > 0.05 t(107) = 1.588, p > 0.05
Online group or community 76.49 12.48 38 76.68 11.78 39
No 76.15 12.40 916 75.36 13.65 943
t-test t(952) = 0.168, p > 0.05 t(980) = 0.593, p > 0.05

Community survey of young Victorians’ resilience and mental wellbeing. Part B: appended tables 21
Table B.21 Key demographic risk subgroups × PWI and CD-RISC 10
PWI CD-RISC 10
At-risk subgroups
Can get help when needed: Mean 62.09 68.02
‘Rarely’ + ‘Not at all’ SD 17.09 17.66
N 44 42
Can get help when needed: Mean 69.60 68.90
‘Sometimes’ SD 12.83 14.55
N 182 185
Looking for work: ‘Yes’ and Mean 71.14 74.09
aged 22–25 years SD 14.50 13.80
N 148 149
Lives alone Mean 71.62 75.90
SD 10.96 13.81
N 30 31
Resilient subgroups
Income $251,000 – $500,000 Mean 81.09 79.80
SD 11.77 11.42
N 25 25
Lives with partner and children Mean 81.07 81.84
SD 10.99 15.13
N 24 25
Lives with partner and parents Mean 80.16 78.53
SD 11.86 11.23
N 18 19
Income $151,000 – $250,000 Mean 79.29 79.26
SD 9.81 11.46
N 81 87
Participates in sport or Mean 79.15 77.83
physical recreation SD 10.78 11.93
N 334 340
Access to social support: Mean 78.65 77.42
‘Yes, definitely’ SD 10.68 12.40
N 728 755
Married Mean 78.37 79.16
SD 12.92 12.36
N 30 31

Community survey of young Victorians’ resilience and mental wellbeing. Part B: appended tables 22
Table B.22 Means, standard deviations and correlations between variables (PWI)
Variable Mean SD 1. 2. 3. 4. 5. 6. 7. 8. 9.
1. GLS 75.03 15.90 –
2. PWI composite 76.16 12.39 0.73 –
3. Standard of living 82.26 16.17 0.56 0.64 –
4. Health 77.06 19.18 0.53 0.69 0.46 –
5. Achieving in life 73.98 19.07 0.67 0.71 0.41 0.45 –
6. Relationships 76.19 21.36 0.51 0.68 0.34 0.34 0.46 –
7. Safety 84.65 16.78 0.38 0.62 0.38 0.33 0.32 0.35 –
8. Community connection 68.20 22.30 0.41 0.69 0.36 0.39 0.36 0.37 0.37 –
9. Future security 72.53 19.18 0.53 0.73 0.39 0.42 0.51 0.38 0.40 0.48 –

Community survey of young Victorians’ resilience and mental wellbeing. Part B: appended tables 23
Table B.23 Means, standard deviations and correlations between variables (CD-RISC 10)
Variable Mean SD 1. 2. 3. 4. 5. 6. 7. 8. 9. 10.
1. Adapt to change 77.97 19.10 –
2. Can deal 76.11 18.48 0.65 –
3. Humorous side 82.33 18.01 0.43 0.46 –
4. Coping with stress 69.70 21.57 0.42 0.47 0.37 –
5. Bounce back 76.95 19.83 0.45 0.53 0.43 0.48 –
6. Achieve goals 77.18 17.97 0.43 0.55 0.39 0.43 0.58 –
7. Can stay focused 70.51 21.76 0.39 0.44 0.29 0.43 0.41 0.54 –
8. Not discouraged 69.88 21.93 0.40 0.50 0.40 0.40 0.45 0.55 0.53 –
9. Strong person 77.49 18.39 0.40 0.53 0.41 0.41 0.50 0.60 0.48 0.53 –
10. Can handle feelings 73.41 21.18 0.39 0.55 0.41 0.45 0.49 0.47 0.45 0.54 0.60 –
Note: bold = CD-2 item

Community survey of young Victorians’ resilience and mental wellbeing. Part B: appended tables 24
Table B.24 Means, standard deviations and correlations between all composite and scale variables
Variable Mean SD 1. 2. 3. 4. 5. 6. 7. 8. 9. 10.
1. GLS 75.03 15.90 –
2. PWI 76.16 12.39 0.73 –
3. CD-RISC 10 75.42 13.58 0.50 0.54 –
4. CD-2 77.52 16.49 0.39 0.43 0.83 –
5. Lonely 31.53 25.55 –0.43 –0.45 –0.38 –0.29 –
6. Stressed 53.70 25.48 –0.39 –0.42 –0.37 –0.28 0.45 –
7. Anxious 43.73 27.69 –0.45 –0.47 –0.48 –0.39 0.48 0.71 –
8. Support friends 81.16 19.65 0.38 0.43 0.38 0.31 –0.28 –0.27 –0.31 –
9. Support family 84.16 21.74 0.39 0.41 0.32 0.21 –0.29 –0.24 –0.31 0.49 –
10. Support neighbours 41.13 32.70 0.28 0.32 0.19 0.15 –0.20 –0.25 –0.22 0.29 0.30 –
GLS = Global Life Satisfaction item; PWI = Personal Wellbeing Index; CD-RISC 10 = Connor-Davidson Resilience Scale (10-item short form); CD - 2 = Connor-
Davidson Resilience Scale (2-item short form)

Community survey of young Victorians’ resilience and mental wellbeing. Part B: appended tables 25
Table B.25 Exploratory factor analysis (CD-RISC 10 and CD-2)
Domain Factor loadings
CD-RISC 10
Factor loadings
CD-2
1. Adapt to change 0.79 0.85
2. Can deal 0.77
3. Humorous side 0.76
4. Coping with stress 0.74
5. Bounce back 0.74 0.85
6. Achieve goals 0.73
7. Can stay focused 0.68
8. Not discouraged 0.68
9. Strong person 0.67
10. Can handle feelings 0.63
KMO =
Sig.
Variance explained
0.919
0.000
52.19%
0.500
0.000
72.27%
Table B.26 Means and standard deviations for CD-RISC 10 items for people who score high on stress (7+) and normal (PWI > 70) and low (PWI < 70) SWB
PWI > 70 & Stress = 70+
PWI < 70 & Stress = 70+
Variable M1 SD1 M2 SD2 Difference
M1 – M2
CD-RISC 10 composite 74.36 11.44 64.03 14.72 10.33
1. Adapt to change 77.30 17.49 69.93 22.42 7.37
2. Can deal 75.86 16.06 64.38 23.67 11.48
3. Humorous side 81.08 17.79 70.56 21.86 10.52
4. Coping with stress 68.06 20.65 59.02 24.53 9.04
5. Bounce back 75.23 18.04 64.69 23.28 10.54
6. Achieve goals 78.65 15.97 65.21 21.97 13.44
7. Can stay focused 69.95 21.15 56.94 24.81 13.01
8. Not discouraged 67.30 21.01 56.74 26.89 10.56
9. Strong person 77.56 16.14 65.00 21.90 12.56
10. Can handle feelings 72.70 19.07 56.99 25.40 15.71
Note: bold = highest mean scores; underline = greatest differences between groups.

Community survey of young Victorians’ resilience and mental wellbeing. Part B: appended tables 26
Table B.27 Means and standard deviations for PWI for corresponding CD-RISC 10 scores
PWI
CD-RISC 10 Range M1 SD1 N
0–50 59.46 14.49 51
51–55 65.76 10.38 23
56–60 68.43 10.42 43
61–65 71.72 10.55 83
66–70 72.15 10.86 120
71–75 74.56 10.39 139
76–80 78.76 9.23 148
81–85 81.02 8.91 137
86–90 81.23 10.58 88
91+ 86.14 10.46 111
Total 76.28 12.25 943
Table B.28 Predicting GLS using the seven domains of the PWI
N = 972
Domain B SE sr²
1. Standard 0.24* 0.02 0.04
2. Health 0.12* 0.02 0.01
3. Achieving 0.30* 0.02 0.08
4. Relationships 0.12* 0.02 0.02
5. Safety 0.01 0.02 0.00
6. Community 0.01 0.02 0.00
7. Future 0.10* 0.02 0.01
F(7, 971) = 221.512, p < 0.001
R2 = 0.62
Unique variance = 0.16
Shared variance = 0.46
*p < 0.001

Community survey of young Victorians’ resilience and mental wellbeing. Part B: appended tables 27
Table B.29 Predicting PWI using the CD-RISC 10 (Stressed > 70)
N = 220
Domain B SE sr²
1. Adapt to change –0.31 0.39 0.00
2. Can deal 0.58 0.44 0.00
3. Humorous side 0.70* 0.33 0.01
4. Coping with stress 0.05 0.30 0.00
5. Bounce back –0.16 0.36 0.00
6. Achieve goals 1.76** 0.44 0.03
7. Can stay focused 0.51 0.31 0.01
8. Not discouraged –0.26 0.31 0.00
9. Strong person 0.10 0.39 0.00
10. Can handle feelings 1.49** 0.31 0.04
F (10, 351) = 16.582, p < 0.001
R2 = 0.32
Unique variance = 0.09
Shared variance = 0.23
* p < 0.05, **p < 0.001

Community survey of young Victorians’ resilience and mental wellbeing. Part B: appended tables 28
Table B.30 Mean scores and standard deviations for negative affects
Lonely Stressed Anxious
M SD N M SD N M SD N
Overall 31.53 25.55 997 53.70 25.48 997 43.73 27.69 997
Gender
Male 30.26 26.21 464 47.39 26.73 464 37.37 26.80 464
Female 32.65 24.93 533 59.19 22.99 533 49.27 27.28 533
Age
16–17 32.08 24.46 154 50.91 24.61 154 45.26 26.28 154
18–21 31.56 25.33 409 52.47 26.02 409 41.61 27.44 409
21–25 31.31 26.18 434 55.85 25.14 434 45.18 28.34 434
Marital status
Married 19.35 17.50 31 48.06 20.72 31 35.16 18.95 31
Living with partner 23.96 25.07 144 57.29 25.40 144 43.40 30.02 144
Widowed 100.0 0.00 2 100.0 0.00 2 40.00 42.43 2
Separated 34.44 19.44 9 71.11 19.00 9 66.67 28.72 9
Never married 33.18 25.38 807 52.91 25.54 807 43.85 27.39 807
Declined to answer 40.00 56.57 2 55.00 35.36 2 45.00 63.64 2
Don’t know 10.00 0.00 2 75.00 7.07 2 50.00 0.00 2
Household composition
Parents 31.56 25.78 500 51.62 25.75 500 42.64 27.23 500
Other adults 38.05 26.11 159 57.86 23.93 159 48.30 27.17 159
Partner only 22.69 21.88 93 55.38 24.16 93 42.80 28.79 93
Children and parents 30.53 25.31 57 54.21 24.34 57 42.98 25.21 57
Parents and others 29.07 21.04 54 47.41 24.89 54 38.33 26.55 54
Alone 49.09 23.37 33 64.55 24.51 33 55.45 28.84 33
Partner and children 16.40 20.59 25 47.20 24.07 25 33.20 25.77 25
Partner and parents 21.58 21.67 19 56.84 27.09 19 37.37 28.45 19
Partner and others 29.23 31.21 13 62.31 33.20 13 52.31 33.20 13
Children only 43.64 28.73 11 70.91 28.79 11 63.64 36.95 11
Other 26.97 22.98 33 53.03 25.43 33 40.91 27.77 33
Student
Yes 33.29 25.33 592 55.63 24.86 592 45.37 26.79 592
No 28.96 25.69 405 50.89 26.13 405 41.33 28.82 405
University 30.96 23.93 167 50.84 24.31 167 44.67 25.74 167
TAFE 33.19 25.14 320 58.13 24.00 320 45.63 26.94 320
Other 38.31 26.77 83 56.14 26.03 83 46.02 27.76 83
No 33.64 31.40 22 53.64 32.30 22 44.55 30.51 22

Community survey of young Victorians’ resilience and mental wellbeing. Part B: appended tables 29
Lonely Stressed Anxious
M SD N M SD N M SD N
Work status
Paid work – yes 30.84 25.21 748 52.94 25.40 748 42.59 27.39 748
Paid work – no 33.61 26.50 249 55.98 25.62 249 47.15 28.35 249
Full time 25.54 23.28 240 50.71 25.46 240 38.58 26.76 240
Part time 32.93 25.33 205 53.41 25.63 205 43.85 26.63 205
Casual 33.63 26.00 303 54.39 25.15 303 44.92 28.13 303
Looking for work – yes
36.43 26.55 359 56.91 25.12 359 46.27 27.68 359
Looking for work – no
28.79 24.58 637 51.84 25.49 637 42.31 27.64 637
Income
< $15,000 44.29 25.25 49 62.24 23.74 49 53.06 28.95 49
$15,000 – $30,000 36.56 24.91 93 60.54 25.04 93 53.33 27.79 93
$31,000 – $60,000 32.15 25.62 149 55.17 25.27 149 44.56 27.91 149
$61,000 – $100,000 31.3 24.49 154 49.35 25.12 154 38.96 25.93 154
$101,000 – $150,000 27.23 21.75 141 51.63 25.98 141 40.99 26.17 141
$151,000 – $250,000 26.02 23.76 88 52.27 25.09 88 40.57 27.26 88
$251,000 – $500,000 32.31 29.71 26 50.38 23.91 26 39.62 29.05 26
$500,000+ 37.5 38.08 8 50.00 43.42 8 30.00 33.81 8
Table B.31 Means and standard deviations for PWI for corresponding negative affect category
Mean PWI scores for each negative affect category
Lonely Stressed Anxious
Range M SD N M SD N M SD N
0–10 82.52 10.52 283 83.99 13.27 68 84.48 11.04 151
11–20 78.99 10.04 173 84.56 8.60 62 81.04 9.43 120
21–30 75.79 11.03 126 80.62 10.17 92 79.61 9.93 114
31–40 72.58 11.05 73 79.06 9.56 97 75.77 10.05 103
41–50 72.40 10.48 102 78.32 11.22 163 75.09 11.22 120
51–60 70.05 10.54 74 74.20 9.32 106 74.79 10.34 88
61–70 67.63 12.54 66 75.07 10.73 146 71.56 9.96 105
71–80 67.19 15.41 35 71.02 10.98 127 70.37 12.21 90
81–90 70.32 17.69 12 65.43 13.44 57 64.32 13.30 33
91–100 56.58 18.20 10 63.25 18.43 36 57.87 16.21 30

Community survey of young Victorians’ resilience and mental wellbeing. Part B: appended tables 30
Table B.32 Means and standard deviations for CD-Risk for corresponding negative affect category
Mean CD-Risk scores for each negative affect category
Range Lonely Stressed Anxious
M SD N M SD N M SD N
0–10 82.80 11.47 306 84.93 13.40 82 85.33 11.72 170
11–20 76.32 11.35 174 83.03 9.69 62 80.97 9.49 119
21–30 73.35 11.93 125 79.85 12.16 95 78.10 9.76 117
31–40 72.81 11.43 72 77.55 11.39 99 74.09 11.68 104
41–50 70.54 13.39 104 77.05 12.08 166 73.59 12.56 123
51–60 65.57 13.11 74 72.57 11.61 106 71.53 11.89 90
61–70 68.05 13.45 68 72.16 12.46 147 70.26 12.97 105
71–80 70.89 15.55 36 70.46 12.04 128 69.84 12.37 89
81–90 66.68 23.52 12 69.85 16.29 59 67.74 13.67 35
91–100 78.55 10.21 11 64.57 19.25 38 54.00 16.89 30