community wellbeing and local attitudes to conventional gas … · 2020-05-14 · community...
TRANSCRIPT
Community wellbeing and local attitudes to conventional gas development in the South‐East of South Australia Walton, A., McCrea R., and Jeanneret, T.
February 2020
Australia’s NationalScience Agency
Community wellbeing and local attitudes to conventional gas development in the South‐East of South Australia | i
ISBN Online: 978‐1‐4863‐1416‐4
ISBN Print: 978‐1‐4863‐1422‐5
Citation
Walton, A., McCrea R., and Jeanneret, T. (2020). Community wellbeing and local attitudes to
conventional gas development in the South‐East of South Australia. CSIRO, Australia.
Copyright
© Commonwealth Scientific and Industrial Research Organisation 2020. To the extent permitted
by law, all rights are reserved and no part of this publication covered by copyright may be
reproduced or copied in any form or by any means except with the written permission of CSIRO.
Important disclaimer
CSIRO advises that the information contained in this publication comprises general statements
based on scientific research. The reader is advised and needs to be aware that such information
may be incomplete or unable to be used in any specific situation. No reliance or actions must
therefore be made on that information without seeking prior expert professional, scientific and
technical advice. To the extent permitted by law, CSIRO (including its employees and consultants)
excludes all liability to any person for any consequences, including but not limited to all losses,
damages, costs, expenses and any other compensation, arising directly or indirectly from using this
publication (in part or in whole) and any information or material contained in it.
CSIRO is committed to providing web accessible content wherever possible. If you are having
difficulties with accessing this document please contact [email protected].


Community wellbeing and local attitudes to conventional gas development in the South‐East of South Australia | i
Contents
Acknowledgments ........................................................................................................................ vi
Executive summary ..................................................................................................................... vii
Part I Introduction and Methods 1
1 Concepts used in this report ............................................................................................ 2
1.1 Community wellbeing .......................................................................................... 2
1.2 Attitudes and perceptions of conventional gas development .............................. 5
2 Context: Conventional gas in the south‐east of South Australia ....................................... 7
3 Method ............................................................................................................................. 9
3.1 Survey Overview .................................................................................................. 9
3.2 Survey Procedure ................................................................................................. 9
3.3 Survey sample and representativeness .............................................................. 10
3.4 Measures ........................................................................................................... 11
3.5 Statistical analyses ............................................................................................. 12
Part 2 Results and Conclusions 14
4 Community Wellbeing .................................................................................................... 15
4.1 Overall community wellbeing and place attachment ......................................... 15
4.2 Dimensions of Community Wellbeing ................................................................ 17
4.3 Most important dimensions of community wellbeing ....................................... 20
5 Expected future community wellbeing ........................................................................... 22
5.1 Reasons underpinning expectations of future community wellbeing ................ 22
6 Attitudes and perceptions of conventional gas development ......................................... 25
6.1 Attitudes towards conventional gas development............................................. 25
6.2 Feelings towards conventional gas development .............................................. 28
6.3 Adapting to conventional gas development ...................................................... 29
6.4 Perceptions about conventional gas development and the sector .................... 30
6.5 Model of social acceptance: A framework for explaining trust and social
acceptance of conventional gas development .................................................. 35
7 Deeper dive into the underlying drivers of social acceptance ......................................... 38
7.1 Possible industry effects: Concerns and benefits ............................................... 38
ii | CSIRO Australia’s National Science Agency
7.2 Industry and community relationship: Trust in industry, relationship quality,
and procedural fairness ..................................................................................... 43
7.3 Governance: Trust in government, regulations, engaging and working with
the community .................................................................................................. 44
7.4 Distributional fairness: Sharing costs and benefits ............................................ 45
7.5 Knowledge and information ............................................................................... 46
8 Demographic differences ................................................................................................ 50
9 Conclusions and implications .......................................................................................... 52
9.1 Community wellbeing ........................................................................................ 52
9.2 Attitudes and perceptions of conventional gas development
in the SE of South Australia ............................................................................... 53
Background information provided for survey questions relating to
conventional gas development .......................................................................... 57
Measures and reliability of scales ...................................................................... 58
Statistical analyses ............................................................................................. 61
All survey items by Subregion ............................................................................ 62
Tables of Demographic Differences ................................................................... 69
References ........................................................................................................................... 76

Community wellbeing and local attitudes to conventional gas development in the South‐East of South Australia | iii
Figures
Figure 1 Mean scores of overall community wellbeing, expected future wellbeing,
and place attachment: By subregions, 2019 ................................................................ viii
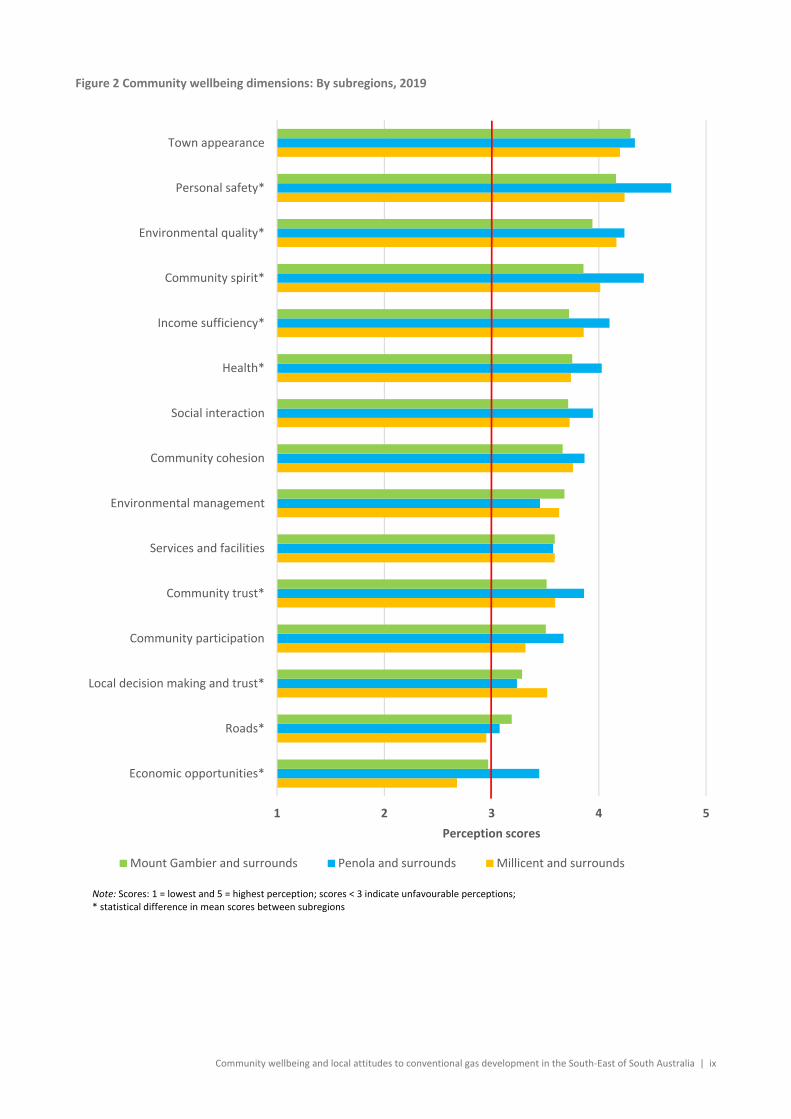
Figure 2 Community wellbeing dimensions: By subregions, 2019 ............................................... ix
Figure 3 Attitudes towards conventional gas development in the lower SE of South Australia ... xi
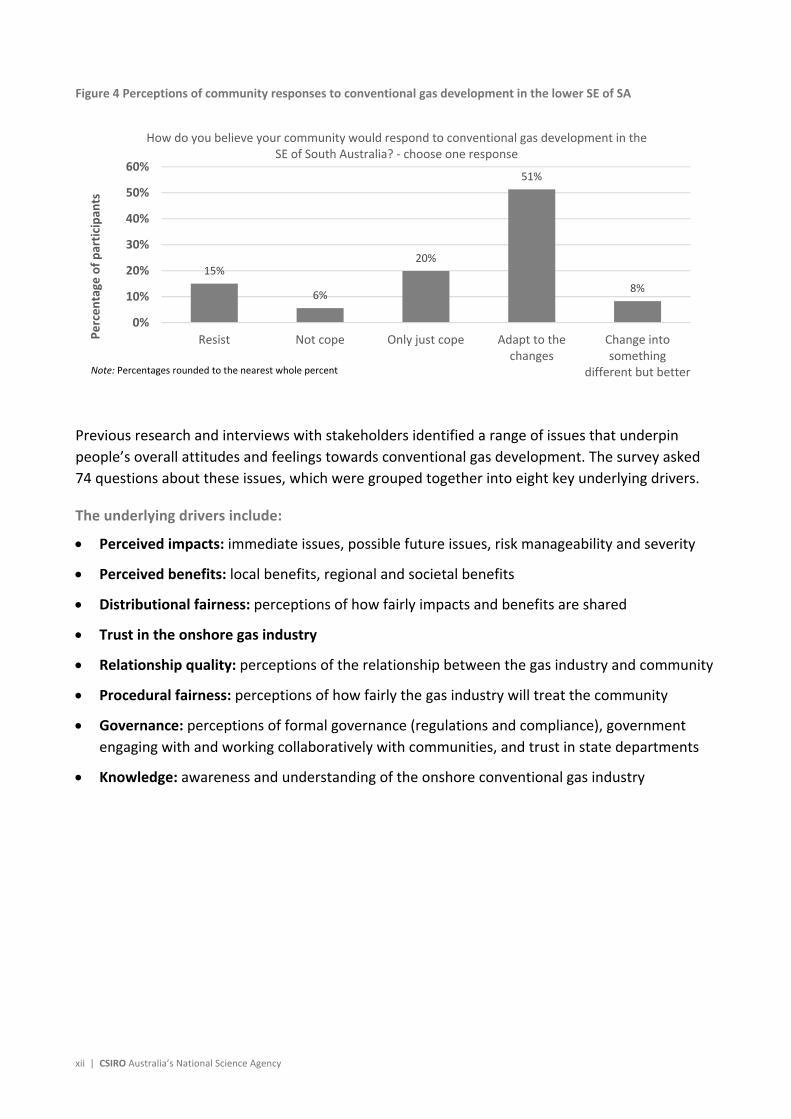
Figure 4 Perceptions of community responses to conventional gas development
in the lower SE of SA ..................................................................................................... xii
Figure 5 Perceptions about conventional gas development: Underlying drivers for the
lower SE region .............................................................................................................xiv
Figure 6 Model of social acceptance .......................................................................................... xv
Figure 7 Dimensions of community wellbeing grouped into six domains ..................................... 3
Figure 8 A statistical model explaining social acceptance, or lack thereof, for onshore
conventional gas development ....................................................................................... 6
Figure 9 Map of the lower South East region of South Australia, including LGA boundaries
and energy infrastructure ............................................................................................... 7
Figure 10 Outline of survey question topics ................................................................................ 10
Figure 11 Mean scores of overall community wellbeing and place attachment: By subregions,
2019 ............................................................................................................................ 15
Figure 12 Overall community wellbeing items: By subregions, 2019 .......................................... 16
Figure 13 Mean scores of overall community wellbeing and place attachment:
By farm owners, 2019 ................................................................................................. 16
Figure 14 Community wellbeing dimensions: By subregions, 2019............................................. 18
Figure 15 Community wellbeing dimensions: By farm owners, 2019 .......................................... 19
Figure 16 Relative importance of each dimension to a sense of community wellbeing:
By subregions, 2019 .................................................................................................... 21
Figure 17 Expected future community wellbeing: By subregions, 2019 ...................................... 22
Figure 18 Attitudes towards conventional gas development in the lower SE
of South Australia ....................................................................................................... 25
Figure 19 Attitudes towards conventional gas development in the lower SE
of South Australia: By subregion, 2019 ....................................................................... 26
Figure 20 Attitudes towards conventional gas development in the lower SE
of South Australia: By farm ownership, 2019.............................................................. 26
Figure 21 Attitudes towards conventional gas development in the lower SE
of South Australia: By gender, 2019 ............................................................................ 27
Figure 22 Attitudes towards conventional gas development in the lower SE
of South Australia: By income, 2019 ........................................................................... 27

iv | CSIRO Australia’s National Science Agency
Figure 23 Acceptance of conventional gas development in the lower SE of SA: Self vs
perceptions of others.................................................................................................. 28
Figure 24 Feelings towards conventional gas development in the lower SE of SA:
By subregion, 2019 ..................................................................................................... 29
Figure 25 Feelings associated with each attitude toward conventional gas development
in the lower SE of SA ................................................................................................... 29
Figure 26 Perceptions of community responses to conventional gas development
in the lower SE of SA ................................................................................................... 30
Figure 27 Perceptions about conventional gas development in the lower SE of SA:
Underlying drivers by subregion ................................................................................. 34
Figure 28 CSIRO model of social acceptance .............................................................................. 35
Figure 29 Model of social acceptance: Mount Gambier and surrounds .................................... 37
Figure 30 Model of social acceptance: Penola and surrounds and Millicent and surrounds
combined .................................................................................................................... 37
Figure 31 Perceived impacts about conventional gas development in the lower SE of SA:
By subregion, 2019 ..................................................................................................... 39
Figure 32 Perceptions of risk from conventional gas development in the lower SE of SA:
By subregion, 2019 ..................................................................................................... 40
Figure 33 Percentage of residents feeling they would be personally impacted
by conventional gas development in the lower SE of SA ............................................ 41
Figure 34 Perceived benefits from conventional gas development in the lower SE of SA:
By subregion, 2019 ..................................................................................................... 42
Figure 35 Perceptions of trust in industry, relationship quality, and procedural fairness
in the lower SE of SA: By subregion, 2019................................................................... 43
Figure 36 Perceptions of formal governance, informal governance, and trust in government:
By subregion, 2019 ..................................................................................................... 44
Figure 37 Perceptions of distributional fairness in the lower SE of SA: By subregions, 2019 ...... 45
Figure 38 Knowledge confidence and awareness levels about conventional gas
in the lower SE of SA: By subregion, 2019 .................................................................. 46
Figure 39 Perceptions of information need and sources in the lower SE of SA ........................... 47
Figure 40 Knowledge confidence and awareness of conventional gas development
in the lower SE of SA: By overall attitude to conventional gas development .............. 48

Community wellbeing and local attitudes to conventional gas development in the South‐East of South Australia | v
Tables
Table 1 Descriptions of the fifteen dimensions of community wellbeing ..................................... 3
Table 2 Profile of sample ............................................................................................................ 11
Table 3 Summary of survey questions ........................................................................................ 12
Table 4 Reasons for expecting future community wellbeing to decline ...................................... 23
Table 5 Reasons for expecting future community wellbeing to improve .................................... 23
Table 6 Reasons for expecting community wellbeing to stay the same ...................................... 24
Table 7 Summarising the underlying drivers and perception scores for the lower SE region ..... 32
Table 8 Measures and reliability of scales used in survey .......................................................... 58

vi | CSIRO Australia’s National Science Agency
Acknowledgments
This Project was funded by the Gas Industry Social and Environmental Research Alliance (GISERA).
GISERA is a collaborative vehicle established to undertake publicly‐reported independent research
addressing the socio‐economic and environmental impacts of Australia’s natural gas industries.
The governance structure for GISERA is designed to provide for and protect research
independence and transparency of funded research. See gisera.csiro.au for more information
about GISERA’s governance structure, funded projects, and research findings.
We also wish to acknowledge the 533 South Australian residents from the lower SE region who
participated in the CSIRO survey of community wellbeing and local attitudes to conventional gas
development in the South‐East of South Australia.

Community wellbeing and local attitudes to conventional gas development in the South‐East of South Australia | vii
Executive summary
This research establishes baseline data for community wellbeing and local attitudes and perceptions of conventional gas development in the southern Limestone Coast or lower South‐East region of South Australia. The research provides empirical data, which can be used to inform planning and decision making. It also delivers a framework for understanding and addressing community concerns and expectations about conventional gas development and the sector.
What we did and when
Using a comprehensive survey instrument, we conducted telephone interviews of 533 residents of
the lower South East (SE) region of South Australia and measured their perceptions of community
wellbeing along 15 different wellbeing dimensions. We also measured local attitudes and feelings
towards conventional gas development in the lower SE and the perceptions that underpin these
attitudes. The survey comprised approximately 170 questions and took 35 minutes to complete on
average. The response rate was 24%, which is relatively high for lengthy telephone surveys. The
surveys were conducted over a four‐week period in Sept‐Oct 2019.
Who participated
The sample comprised residents from the Wattle Range, Mount Gambier, and Grant Local
Government Areas (LGAs) and grouped into three subregions centred on three main towns: Mt
Gambier and surrounds, Penola and surrounds, and Millicent and surrounds. These subregions
were used in reporting results. Participants were randomly selected using databases of landline
and mobile telephone numbers. Age, gender and subregion quotas were used to ensure a
representative sample was obtained in combination with weighting the data to achieve LGA,
subregion, age, gender, and working status representativeness according to 2016 census data
(ABS, 2016).
Note: Interpreting the results
The results are reported as average scores out of 5 using a scale from 1 to 5, where 1 is the least
and 5 is the most. A score below the midpoint of 3 is considered lower or unfavourable on average
except for perceived impacts where the higher the score the greater the concern about potential
impacts. Where relevant, we describe results as statistically different (higher or lower) using the
science convention of statistical significance at the p < .05 level. This means that any differences
reported as statistically significant had less than a five percent chance that the findings were due
to chance. While some differences may be evident in the graphs, unless they are described as
significantly different they should be read as essentially similar.

viii | CSIRO Australia’s National Science Agency
COMMUNITY WELLBEING
Community wellbeing scores reflect perceptions about whether the community is a great place to
live and whether it offers a great quality of life for all ages. As such, it differs from individual
wellbeing. Fifteen dimensions of community wellbeing were evaluated using approximately 70
questions. These covered social, environmental, political, economic, health, and physical
infrastructure aspects of the community, including services, facilities, and the built environment.
When assessing community wellbeing and future community wellbeing there was no reference to
conventional gas development in the survey questions.
Results showed that community wellbeing overall in the lower SE region was very robust, with
high scores evident in all subregions. Figure 1 shows that these very favourable views extended to
expectations about the community’s future wellbeing in three years hence. Residents also
indicated a very high sense of belonging and pride in their communities as reflected in the place
attachment scores across the region.
Figure 1 Mean scores of overall community wellbeing, expected future wellbeing, and place attachment: By
subregions, 2019
Analyses of the fifteen dimensions comprising community wellbeing showed that residents of
Penola and surrounds had statistically more favourable views of their communities across a range
of dimensions than residents of Mt Gambier and surrounds, and Millicent and surrounds, as
shown in Figure 2. Particularly, Penola residents were far more positive about their economic
opportunities than Mt Gambier and Millicent.
4.17 4.154.414.32 4.32
4.46
4.10 4.134.40
4.13 4.154.41
1
2
3
4
5
Overall community wellbeing* Expected future wellbeing Place attachment
Perception scores
Millicent and surrounds Penola and surrounds Mount Gambier and surrounds Total Lower SE
Note: Scores: 1 = lowest and 5 = highest perception; scores < 3 indicate unfavourable perceptions;
Community wellbeing and local attitudes to conventional gas development in the South‐East of South Australia | ix
Figure 2 Community wellbeing dimensions: By subregions, 2019
1 2 3 4 5
Economic opportunities*
Roads*
Local decision making and trust*
Community participation
Community trust*
Services and facilities
Environmental management
Community cohesion
Social interaction
Health*
Income sufficiency*
Community spirit*
Environmental quality*
Personal safety*
Town appearance
Perception scores
Mount Gambier and surrounds Penola and surrounds Millicent and surrounds
Note: Scores: 1 = lowest and 5 = highest perception; scores < 3 indicate unfavourable perceptions; * statistical difference in mean scores between subregions

x | CSIRO Australia’s National Science Agency
Differences also were evident between farm owners and non‐farm owners. Farm owners reported
significantly higher levels on six of the fifteen dimensions including economic opportunities. Farm
owners viewed their economic opportunities quite favourably, whereas non‐farm owners viewed
economic opportunities unfavourably. Farm owners also showed statistically higher levels of both
community wellbeing and place attachment than people who did not own farms, though in all
cases levels of community wellbeing and place attachment were very high.
Interestingly, differences in overall community wellbeing did not emerge between those who live
in town and those who live out‐of‐town. Some differences in the underlying dimensions were
evident but these did not extend into differences in place attachment or expected future
wellbeing. It appears that owning a farm rather than living in or out‐of‐town is associated with
increased perceptions of community wellbeing.
The most important dimensions of community wellbeing were services and facilities, the quality of
the environment, perceptions of personal safety, income sufficiency, and perceptions of
community trust. These can be considered as the dimensions that contribute most to a sense of
wellbeing in the community. Understanding the relative importance of a dimension helps decision
makers to prioritise scarce resources for improving or maintaining community wellbeing. In
combination, the perceived level of a dimension and its relative importance can provide empirical
evidence for directing initiatives towards improving community wellbeing within the region.
Notably, there was considerable variation among the subregions suggesting that initiatives for
improving or maintaining wellbeing within each of the subregions needs to be very place‐based
and respond to the aspects of community life that each subregion views as important. The
research identifies which dimensions are most important for each subregion.
Key messages: Community wellbeing
1. Community wellbeing was very high across the lower SE region, particularly in Penola and surrounds where economic opportunities were viewed considerably more favourably than the other subregions.
2. Even though there were no statistical differences between people who live in town and those who live out‐of‐town, those who own a farm indicated statistically higher levels of community wellbeing and place attachment. Farm owners also felt there was greater economic opportunities within their communities than those who don’t own a farm.
3. The main drivers of community wellbeing across the region were services and facilities, the quality of the environment, perceptions of personal safety, income sufficiency, and perceptions of community trust. However, there was considerable variation among the subregions.
4. All subregions showed very positive expectations that community wellbeing in three years hence would be high.

Community wellbeing and local attitudes to conventional gas development in the South‐East of South Australia | xi
ATTITUDES AND PERCEPTIONS OF CONVENTIONAL GAS DEVELOPMENT
Attitudes towards conventional gas development in the SE of South Australia ranged across a
spectrum of views
22% of people rejected conventional gas development
13% of people embraced conventional gas development
65% of people tolerated, would be OK with it, or approved of conventional gas development
– 28% would tolerate it
– 22% would be OK with it
– 15% would approve it
Figure 3 Attitudes towards conventional gas development in the lower SE of South Australia
We also measured people’s feelings towards onshore conventional gas development for each of
the attitude categories: people who reject the idea had very negative feelings (M = 1.74), people
who tolerate had more neutral feelings around the mid‐point of three (M = 2.88), people who
were ok with it had more positive feelings (M = 3.37), as did those who approve of (M = 3.97) and
embrace it (M = 4.59).
Most people believed that their community would adapt to the changes associated with
conventional gas development (51% of residents) or transform into something different but better
(8% of residents). Figure 4 also shows that just over 40% of residents believed that their
community would resist the changes (15% of residents), not cope (6% of residents) or only just
cope with the changes (20% of residents). These responses did not differ significantly between
subregions or whether residents owned farms or not.
22%
28%
22%
15%13%
0%
10%
20%
30%
40%
50%
Reject it Tolerate it Be OK with it Approve of it Embrace it
Percentage
of participan
ts
Note: Percentages rounded to the nearest whole
xii | CSIRO Australia’s National Science Agency
Figure 4 Perceptions of community responses to conventional gas development in the lower SE of SA
Previous research and interviews with stakeholders identified a range of issues that underpin
people’s overall attitudes and feelings towards conventional gas development. The survey asked
74 questions about these issues, which were grouped together into eight key underlying drivers.
The underlying drivers include:
Perceived impacts: immediate issues, possible future issues, risk manageability and severity
Perceived benefits: local benefits, regional and societal benefits
Distributional fairness: perceptions of how fairly impacts and benefits are shared
Trust in the onshore gas industry
Relationship quality: perceptions of the relationship between the gas industry and community
Procedural fairness: perceptions of how fairly the gas industry will treat the community
Governance: perceptions of formal governance (regulations and compliance), government
engaging with and working collaboratively with communities, and trust in state departments
Knowledge: awareness and understanding of the onshore conventional gas industry
15%
6%
20%
51%
8%
0%
10%
20%
30%
40%
50%
60%
Resist Not cope Only just cope Adapt to thechanges
Change intosomething
different but better
Percentage
of participan
ts
How do you believe your community would respond to conventional gas development in the SE of South Australia? ‐ choose one response
Note: Percentages rounded to the nearest whole percent
Community wellbeing and local attitudes to conventional gas development in the South‐East of South Australia | xiii
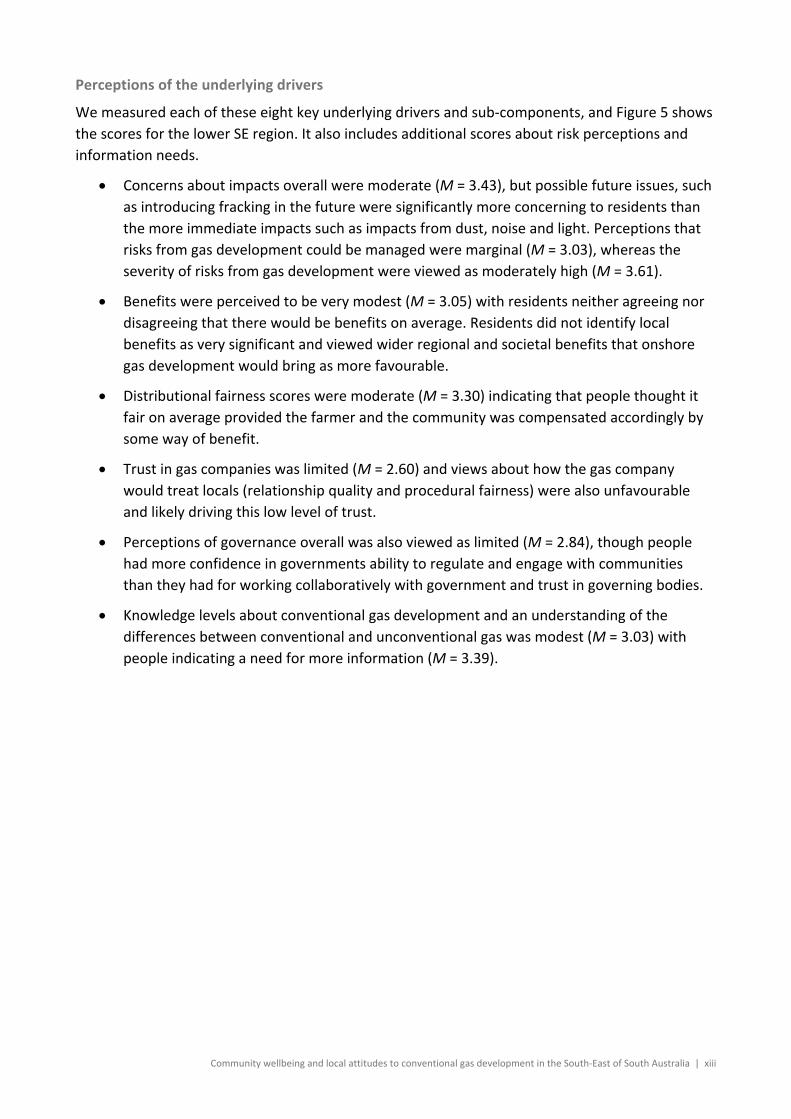
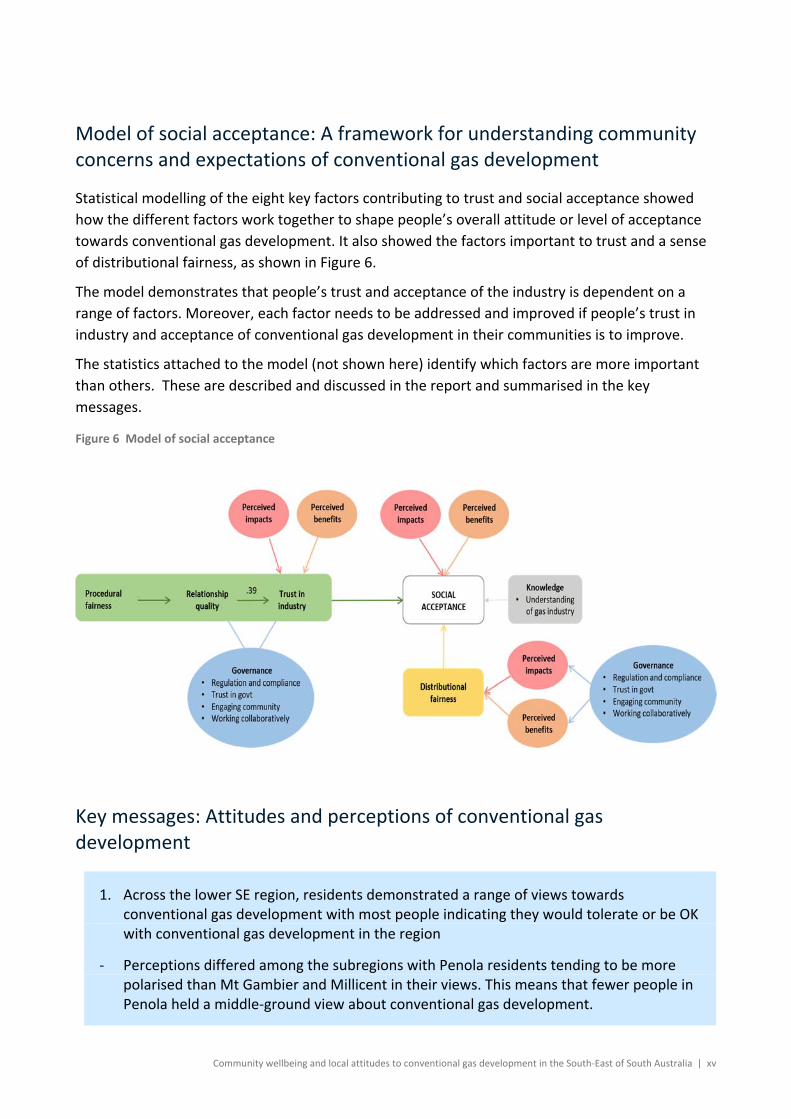
Perceptions of the underlying drivers
We measured each of these eight key underlying drivers and sub‐components, and Figure 5 shows
the scores for the lower SE region. It also includes additional scores about risk perceptions and
information needs.
Concerns about impacts overall were moderate (M = 3.43), but possible future issues, such
as introducing fracking in the future were significantly more concerning to residents than
the more immediate impacts such as impacts from dust, noise and light. Perceptions that
risks from gas development could be managed were marginal (M = 3.03), whereas the
severity of risks from gas development were viewed as moderately high (M = 3.61).
Benefits were perceived to be very modest (M = 3.05) with residents neither agreeing nor
disagreeing that there would be benefits on average. Residents did not identify local
benefits as very significant and viewed wider regional and societal benefits that onshore
gas development would bring as more favourable.
Distributional fairness scores were moderate (M = 3.30) indicating that people thought it
fair on average provided the farmer and the community was compensated accordingly by
some way of benefit.
Trust in gas companies was limited (M = 2.60) and views about how the gas company
would treat locals (relationship quality and procedural fairness) were also unfavourable
and likely driving this low level of trust.
Perceptions of governance overall was also viewed as limited (M = 2.84), though people
had more confidence in governments ability to regulate and engage with communities
than they had for working collaboratively with government and trust in governing bodies.
Knowledge levels about conventional gas development and an understanding of the
differences between conventional and unconventional gas was modest (M = 3.03) with
people indicating a need for more information (M = 3.39).
xiv | CSIRO Australia’s National Science Agency
Figure 5 Perceptions about conventional gas development: Underlying drivers for the lower SE region
3.39
3.03
2.57
2.81
3.00
3.02
2.84
2.45
2.39
2.60
3.30
3.13
2.98
3.05
3.61
3.03
3.86
3.26
3.43
3.04
1 2 3 4 5
Need for more information
KNOWLEDGE ‐ Understanding of gas industry
‐ Trust in state departments
‐ Working collaboratively
‐ Engaging community
‐ Formal governance
GOVERNANCE OVERALL
PROCEDURAL FAIRNESS
RELATIONSHIP QUALITY
TRUST IN GAS COMPANY
DISTRIBUTIONAL FAIRNESS
‐ Regional and societal benefits
‐ Local benefits
PERCEIVED BENEFITS OVERALL
Risk severity
Risk manageability
‐ Possible future issues
‐ More immediate issues
PERCEIVED IMPACTS OVERALL
Community attitudes and feelings toward gas
Perception scores
Note: Scores: 1 = lowest and 5 = highest perception; scores < 3 indicate unfavourable perceptions except perceived impacts where the higher the score the greater the concern; * statistical difference in mean scores between subregions
Community wellbeing and local attitudes to conventional gas development in the South‐East of South Australia | xv
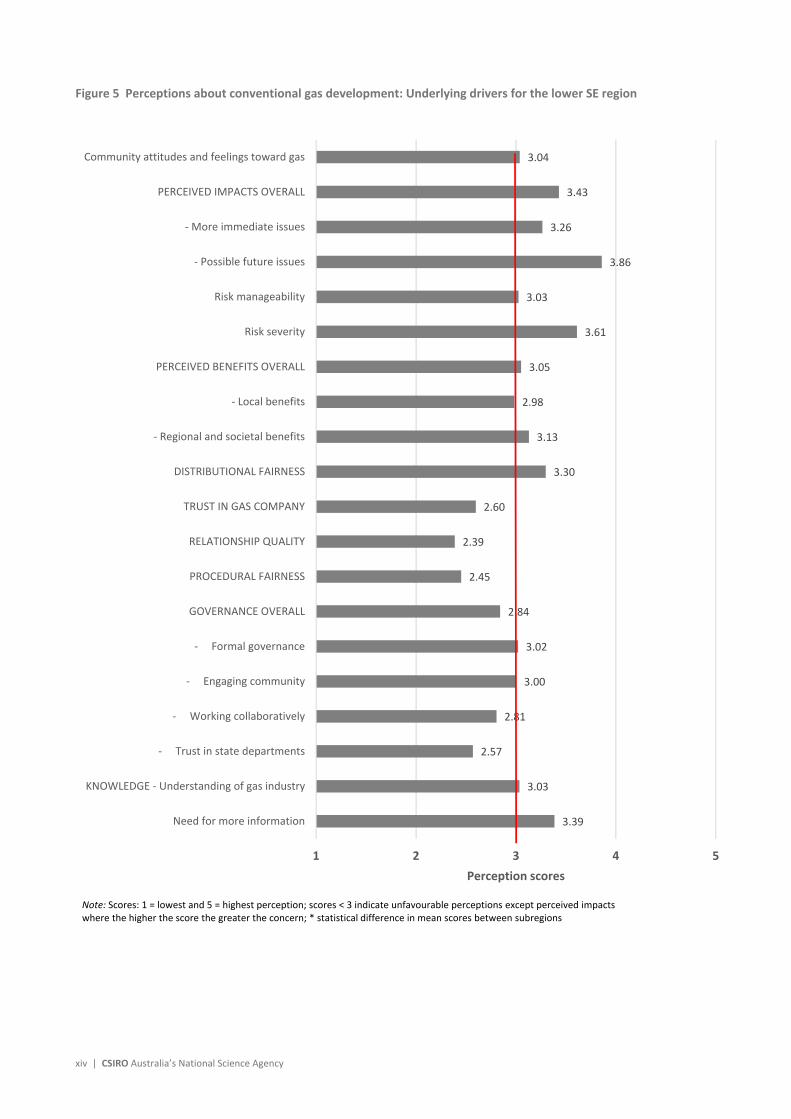
Model of social acceptance: A framework for understanding community concerns and expectations of conventional gas development
Statistical modelling of the eight key factors contributing to trust and social acceptance showed
how the different factors work together to shape people’s overall attitude or level of acceptance
towards conventional gas development. It also showed the factors important to trust and a sense
of distributional fairness, as shown in Figure 6.
The model demonstrates that people’s trust and acceptance of the industry is dependent on a
range of factors. Moreover, each factor needs to be addressed and improved if people’s trust in
industry and acceptance of conventional gas development in their communities is to improve.
The statistics attached to the model (not shown here) identify which factors are more important
than others. These are described and discussed in the report and summarised in the key
messages.
Figure 6 Model of social acceptance
Key messages: Attitudes and perceptions of conventional gas development
1. Across the lower SE region, residents demonstrated a range of views towards conventional gas development with most people indicating they would tolerate or be OK with conventional gas development in the region
‐ Perceptions differed among the subregions with Penola residents tending to be more polarised than Mt Gambier and Millicent in their views. This means that fewer people in Penola held a middle‐ground view about conventional gas development.
xvi | CSIRO Australia’s National Science Agency
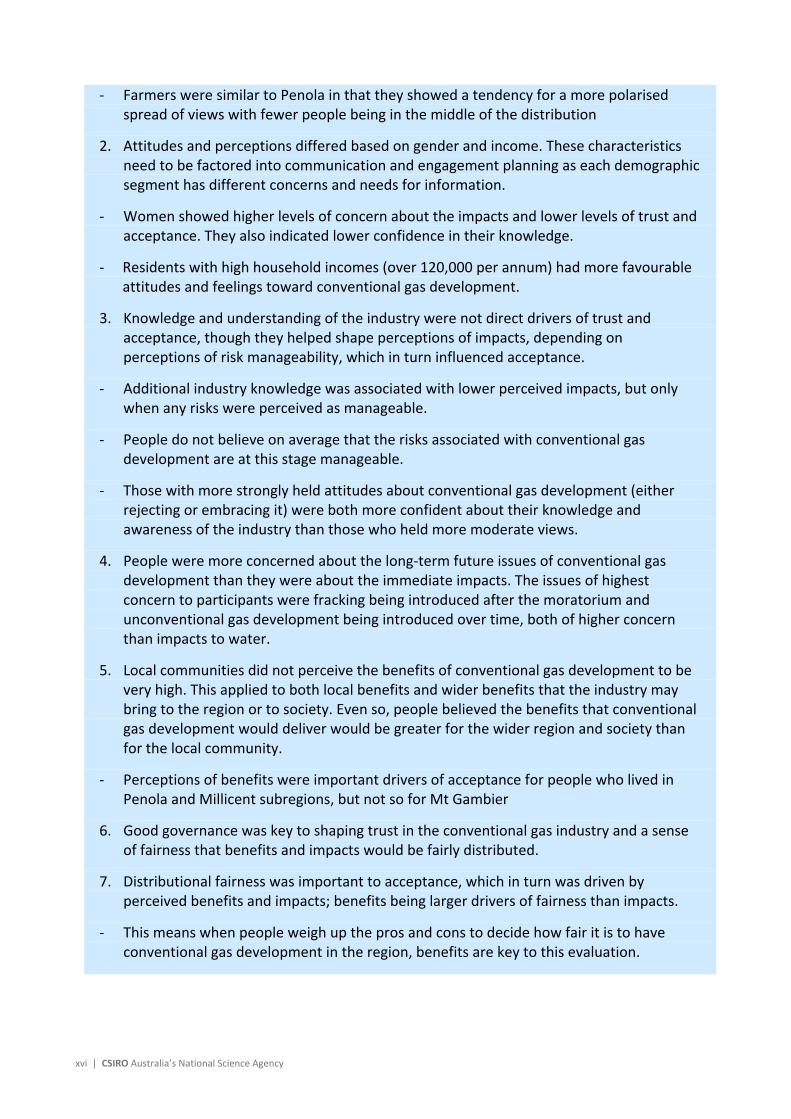
‐ Farmers were similar to Penola in that they showed a tendency for a more polarised spread of views with fewer people being in the middle of the distribution
2. Attitudes and perceptions differed based on gender and income. These characteristics need to be factored into communication and engagement planning as each demographic segment has different concerns and needs for information.
‐ Women showed higher levels of concern about the impacts and lower levels of trust and acceptance. They also indicated lower confidence in their knowledge.
‐ Residents with high household incomes (over 120,000 per annum) had more favourable attitudes and feelings toward conventional gas development.
3. Knowledge and understanding of the industry were not direct drivers of trust and acceptance, though they helped shape perceptions of impacts, depending on perceptions of risk manageability, which in turn influenced acceptance.
‐ Additional industry knowledge was associated with lower perceived impacts, but only when any risks were perceived as manageable.
‐ People do not believe on average that the risks associated with conventional gas development are at this stage manageable.
‐ Those with more strongly held attitudes about conventional gas development (either rejecting or embracing it) were both more confident about their knowledge and awareness of the industry than those who held more moderate views.
4. People were more concerned about the long‐term future issues of conventional gas development than they were about the immediate impacts. The issues of highest concern to participants were fracking being introduced after the moratorium and unconventional gas development being introduced over time, both of higher concern than impacts to water.
5. Local communities did not perceive the benefits of conventional gas development to be very high. This applied to both local benefits and wider benefits that the industry may bring to the region or to society. Even so, people believed the benefits that conventional gas development would deliver would be greater for the wider region and society than for the local community.
‐ Perceptions of benefits were important drivers of acceptance for people who lived in Penola and Millicent subregions, but not so for Mt Gambier
6. Good governance was key to shaping trust in the conventional gas industry and a sense of fairness that benefits and impacts would be fairly distributed.
7. Distributional fairness was important to acceptance, which in turn was driven by perceived benefits and impacts; benefits being larger drivers of fairness than impacts.
‐ This means when people weigh up the pros and cons to decide how fair it is to have conventional gas development in the region, benefits are key to this evaluation.

Community wellbeing and local attitudes to conventional gas development in the South‐East of South Australia | 1
Part I Introduction and Methods
Background to the research
This research is part of a suite of social, economic and environmental research being conducted by
CSIRO’s GISERA into potential impacts of onshore conventional gas development in the Otway
Basin of South Australia. It establishes baseline estimates of community wellbeing and attitudes
toward conventional gas development in the southern Limestone Coast or lower South‐East region
of South Australia for informing planning and decision making, and for monitoring over time. It
does not investigate attitudes about unconventional gas development in the Basin nor hydraulic
fracturing as there is a moratorium on this form of onshore gas development in the region until
November 2028.
Project aims
This project aims to determine baselines for understanding community concerns, expected
benefits, knowledge of, and factors important for building trust and acceptance in relation to
conventional gas development in the South East of South Australia (SA). The research uses the
context of the resumption of the region’s conventional gas industry whereby 2 to 3 wells are
developed in the South East over the next couple of years (Hasselgrove‐3, Dombey‐1, and
Nangwarry‐1), and possibly a dozen wells over the next decade, providing regional gas supplies
and diversification to the state’s energy and power supply sources. In addition, the research
assesses baseline levels of community wellbeing, expectations of the region’s future and identifies
community values and beliefs in relation to conventional gas development. Establishing baseline
measures is important for monitoring community wellbeing and attitudes to conventional gas
development in the South East region over time.
2 | CSIRO Australia’s National Science Agency
1 Concepts used in this report
1.1 Community wellbeing
A measure of community wellbeing is a snapshot in time of the perceived 'quality of life' within the community; an evaluation of the community as a ‘good place to live’ (McCrea, Walton, & Leonard, 2014). The notion of community wellbeing means different things to different people, and thus a comprehensive measure of wellbeing that incorporates different 'dimensions' of wellbeing is used to gain a deeper understanding of the various aspects of community wellbeing.
Drawing on international research and previous Australian research in onshore gas development
regions in the Western Downs region of Queensland and the Narrabri region of New South Wales
(McCrea, Walton, & Leonard, 2014; McCrea, Walton, and Leonard, 2019; Walton and McCrea,
2017; Walton and McCrea, 2018), we investigated wellbeing across 15 dimensions. These
dimensions can be grouped into six domains: social, environmental, political, physical
infrastructure and services, economic, and health (McCrea et al., 2014). Figure 7 depicts the 15
dimensions grouped into the six domains and
Table 1 gives a brief description of each dimension, which we measure and discuss further in this
report.

Community wellbeing and local attitudes to conventional gas development in the South‐East of South Australia | 3
Figure 7 Dimensions of community wellbeing grouped into six domains
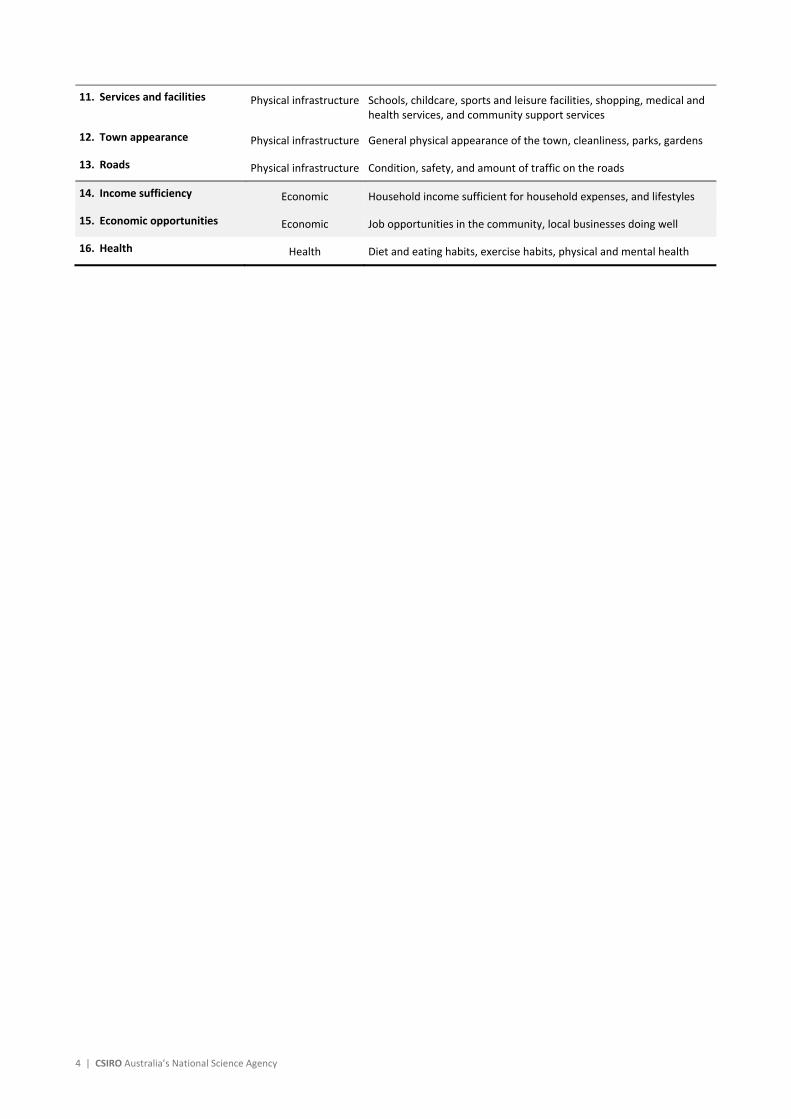
Table 1 Descriptions of the fifteen dimensions of community wellbeing
Dimension Domain Brief description
1. Personal safety Social Safety at home alone at night, walking outside alone at night
2. Community spirit Social Friendliness, supporting each other
3. Community cohesion Social Inclusion, welcoming of newcomers and people with differences
4. Community trust Social Trust within the community and people seen around locally
5. Community participation Social Supporting community based organisations and activities
6. Social interaction Social Visiting, talking, and going out with others in the community
7. Environmental quality Environment Quality of the environment in which people live ‐ levels of dust and noise, overall quality of the general environment
8. Environmental management Environment Managing the environment for the future: underground water, nature reserves, parks and caves
9. Local decision making Political Citizens having a say and being heard in local decision making
10. Trust in local leaders Political Local leaders and local council can be trusted
4 | CSIRO Australia’s National Science Agency
11. Services and facilities Physical infrastructure Schools, childcare, sports and leisure facilities, shopping, medical and health services, and community support services
12. Town appearance Physical infrastructure General physical appearance of the town, cleanliness, parks, gardens
13. Roads Physical infrastructure Condition, safety, and amount of traffic on the roads
14. Income sufficiency Economic Household income sufficient for household expenses, and lifestyles
15. Economic opportunities Economic Job opportunities in the community, local businesses doing well
16. Health Health Diet and eating habits, exercise habits, physical and mental health
Community wellbeing and local attitudes to conventional gas development in the South‐East of South Australia | 5
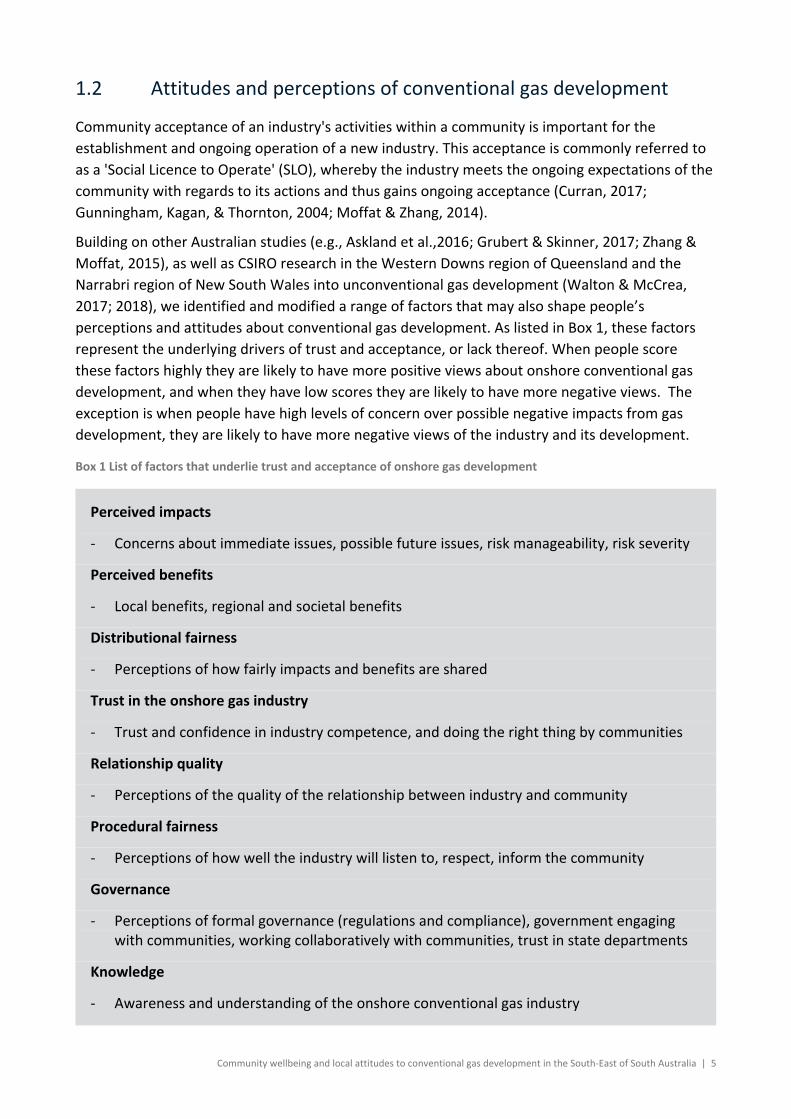
1.2 Attitudes and perceptions of conventional gas development
Community acceptance of an industry's activities within a community is important for the
establishment and ongoing operation of a new industry. This acceptance is commonly referred to
as a 'Social Licence to Operate' (SLO), whereby the industry meets the ongoing expectations of the
community with regards to its actions and thus gains ongoing acceptance (Curran, 2017;
Gunningham, Kagan, & Thornton, 2004; Moffat & Zhang, 2014).
Building on other Australian studies (e.g., Askland et al.,2016; Grubert & Skinner, 2017; Zhang &
Moffat, 2015), as well as CSIRO research in the Western Downs region of Queensland and the
Narrabri region of New South Wales into unconventional gas development (Walton & McCrea,
2017; 2018), we identified and modified a range of factors that may also shape people’s
perceptions and attitudes about conventional gas development. As listed in Box 1, these factors
represent the underlying drivers of trust and acceptance, or lack thereof. When people score
these factors highly they are likely to have more positive views about onshore conventional gas
development, and when they have low scores they are likely to have more negative views. The
exception is when people have high levels of concern over possible negative impacts from gas
development, they are likely to have more negative views of the industry and its development.
Box 1 List of factors that underlie trust and acceptance of onshore gas development
Perceived impacts
‐ Concerns about immediate issues, possible future issues, risk manageability, risk severity
Perceived benefits
‐ Local benefits, regional and societal benefits
Distributional fairness
‐ Perceptions of how fairly impacts and benefits are shared
Trust in the onshore gas industry
‐ Trust and confidence in industry competence, and doing the right thing by communities
Relationship quality
‐ Perceptions of the quality of the relationship between industry and community
Procedural fairness
‐ Perceptions of how well the industry will listen to, respect, inform the community
Governance
‐ Perceptions of formal governance (regulations and compliance), government engaging with communities, working collaboratively with communities, trust in state departments
Knowledge
‐ Awareness and understanding of the onshore conventional gas industry

6 | CSIRO Australia’s National Science Agency
Figure 8 shows a model of how these factors work together to explain a person’s level of
acceptance (or lack thereof) for onshore gas development within their community. Each of these
factors are important to communities. For example, concerns that communities have about gas
development, community expectations if trust in the industry is to be achieved, and views related
to fairness, including how benefits are distributed and costs borne by host communities. By
measuring these factors, we provide empirical evidence to key stakeholders as to the current
levels of these factors within communities. Results can be used to guide industry improvements,
government initiatives, and strengthening policy and standards governing the onshore
conventional gas sector.
Figure 8 A statistical model explaining social acceptance, or lack thereof, for onshore conventional gas development
Community wellbeing and local attitudes to conventional gas development in the South‐East of South Australia | 7
2 Context: Conventional gas in the south‐east of South Australia
The south‐east region of South Australia is bound by the South Australian coastline to the west
and south, the Victorian border to the east, and stretches north to include the local governments
areas of Kingstown and Tatiara. This area is often referred to as the Limestone Coast and is mostly
rural, with primary industries the predominant land‐use. It is a highly productive area, with
significant forestry plantations and agricultural operations. The agricultural industry is particularly
diverse; including livestock grazing, wool, cropping, dairying, viticulture and other horticulture
(ABARES, 2019). The local economy is also supplemented by manufacturing industries such as
timber, pulp and paper processing, and wine production.
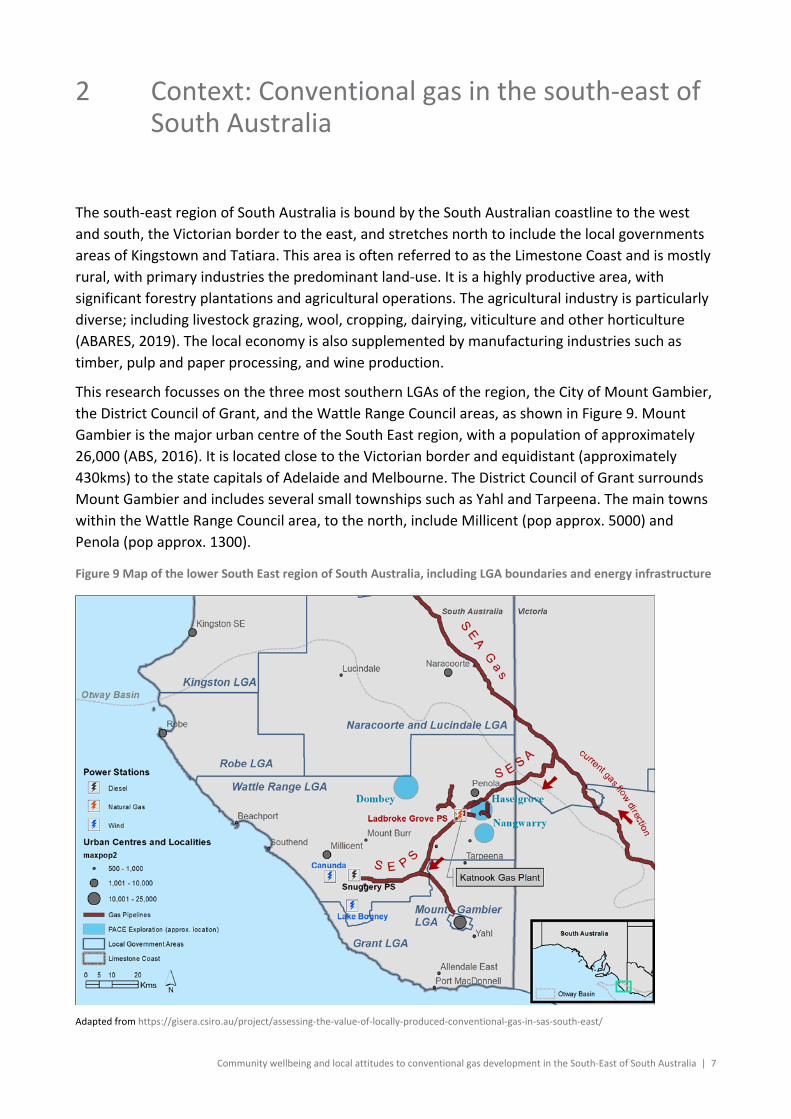
This research focusses on the three most southern LGAs of the region, the City of Mount Gambier,
the District Council of Grant, and the Wattle Range Council areas, as shown in Figure 9. Mount
Gambier is the major urban centre of the South East region, with a population of approximately
26,000 (ABS, 2016). It is located close to the Victorian border and equidistant (approximately
430kms) to the state capitals of Adelaide and Melbourne. The District Council of Grant surrounds
Mount Gambier and includes several small townships such as Yahl and Tarpeena. The main towns
within the Wattle Range Council area, to the north, include Millicent (pop approx. 5000) and
Penola (pop approx. 1300).
Figure 9 Map of the lower South East region of South Australia, including LGA boundaries and energy infrastructure
Adapted from https://gisera.csiro.au/project/assessing‐the‐value‐of‐locally‐produced‐conventional‐gas‐in‐sas‐south‐east/
8 | CSIRO Australia’s National Science Agency
Figure 9 also shows a map of the gas pipelines and associated infrastructure in the South East
region of South Australia (GISERA, 2019). Conventional gas extraction in the South East has co‐
existed with other land uses for over three decades. Exploration and production wells have been
drilled in the Otway Basin since early last century, with the first deep exploration well in 1915 east
of Robe (Robe 1). The first commercial discovery of carbon dioxide gas was made in 1967, south‐
east of Mount Gambier (Caroline 1), and the first commercial discovery of methane gas was made
south‐west of Penola in the Wattle Range LGA (Katnook 1) in 1987 (DEM, 2019a). Between 1991
and 2011, approximately 70 billion cubic feet of conventional gas was extracted from South
Australia’s Otway Basin. Over the twenty‐year period 1991 – 2011, conventional gas wells in the
South East region provided gas locally to Mount Gambier, the surrounding districts and smaller
towns, and several key manufacturing and processing businesses located in the region. Currently,
local industrial demand for gas includes the Kimberly Clark Australia pulp and paper mill in
Millicent and dairy processing near Penola, following the conversion of former potato processing
plants into dairy processing facilities.
In 2013, the Katnook gas plant outside Penola was mothballed and the region accessed its gas
outside the region from a central distribution network. This change in supply has coincided with
other changes to the state’s electricity and gas supply, such as a significant increase in power
generation from wind energy. Residents and businesses of SA are paying relatively high rates for
electricity and gas, with state and federal policy makers negotiating plans to provide cheaper,
greener, and more reliable supply options. The SA government has also placed a 10‐year
moratorium on hydraulic fracturing (fracking) in the South East region until November 2028.
Resumption of conventional gas production in the region near Penola is part of improving energy
security and the scope of planned activity is likely to be between 4‐12 wells in the South East over
the next decade. The Wattle Range LGA contains most of the conventional gas wells previously
drilled in the South East, mostly south‐east of Penola, with approximately 20 wells (DEM, 2019b).
However, petroleum exploration licences presently extend across most of the southern half of the
South East. This includes the LGAs of Wattle Range; Grant; Robe; the southern half of Naracoorte
and Lucindale; and the southern tip of Kingston LGA. In January this year, Beach Energy announced
the discovery of a potentially commercial gas field south of Penola (Haselgrove‐3 ST1) (World Oil,
2018). Their decision to drill at this site was supported by a SA government grant under the PACE
scheme (Plan for Accelerating Exploration) (Beach Energy, 2019), which assisted Beach Energy’s
plan to build a $22.6 million gas processing plant to purify gas from Haselgrove‐3 (The Advertiser,
2018). In addition, a joint venture between Rawson Oil and Gas Ltd and Vintage Energy Ltd have
identified PEL 155 (Nangwarry) as a potential area for exploration and they are also recipients of a
$4.95 million PACE grant to develop the gas (Vintage Energy, 2017).
Community wellbeing and local attitudes to conventional gas development in the South‐East of South Australia | 9
3 Method
3.1 Survey Overview
The survey was conducted during July‐August 2019, using computer‐assisted telephone
interviewing (CATI). The survey explored community wellbeing and attitudes to conventional gas
development in the south east region of South Australia, specifically targeting three local
government areas in the region: Wattle Range, Mount Gambier and Grant. A third‐party research
company administered the survey using a database of landline and mobile telephone numbers to
randomly select residents based on pre‐determined selection criteria, and demographic quotas,
which combined with data weighted were used to achieve a representative sample.
On average, the survey took 35 minutes to complete and was undertaken by 533 residents. The
response rate was 24.3%, which is considered a good outcome for lengthy telephone surveys.
Inclusion criteria quotas
Residents of Wattle Range, Mount Gambier or Grant LGAs
Age of 18 years or older
Demographic quotas based on age, gender and location characteristics according to the Australian Bureau of Statistics (ABS, 2016).
3.2 Survey Procedure
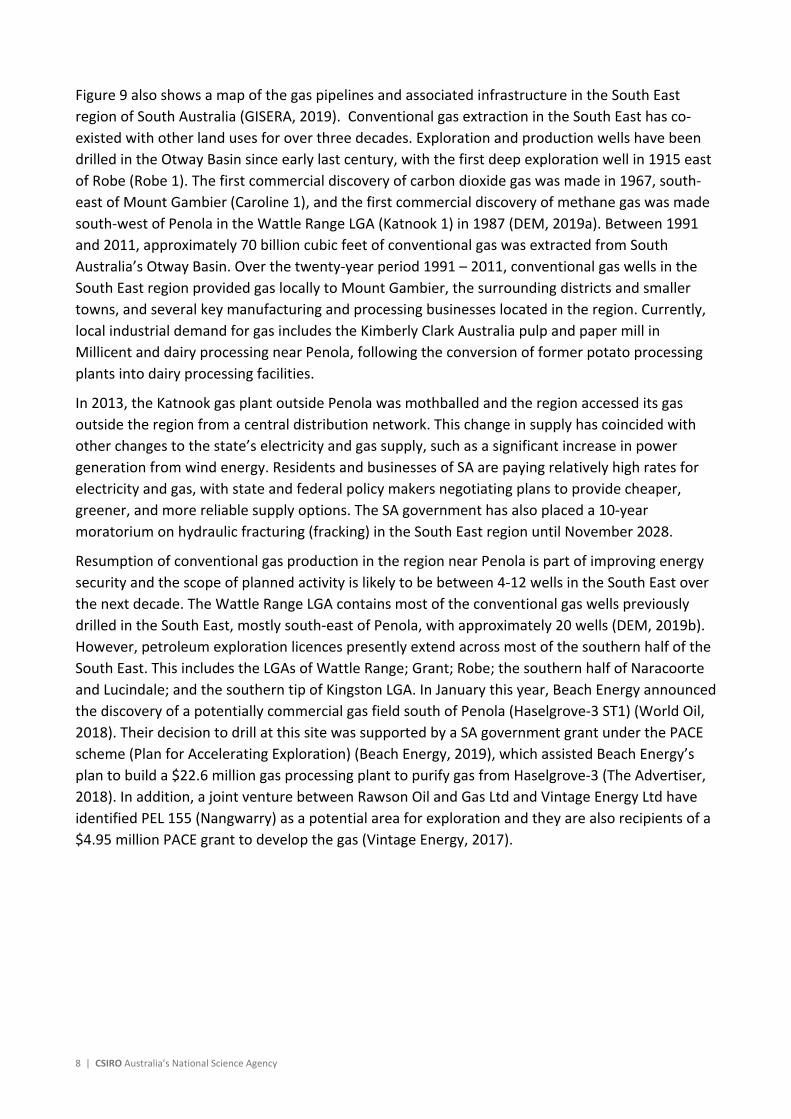
The survey comprised approximately 170 questions covering six main topics. Figure 10 shows the
initial part of the survey included screening and demographic quota questions. Within the three
targeted LGAs there were three main towns or areas of interest: Penola and surrounds, Millicent
and surrounds, and Mount Gambier and surrounds. Participants were asked which of the three
towns they felt most part of. This town and surrounds became the subsequent reference for
community related questions for that participant. For example, if a participant identified Millicent
and surrounds as their community then all subsequent questions were framed in relation to ‘the
town and surrounds of Millicent’. These three towns and surrounds make‐up three ‘subregions’,
which are used for reporting results. Residents also identified whether they lived in or out‐of‐
town.
The survey proceeded with community wellbeing questions, followed by attitudes and perceptions
about conventional gas development and the sector, then knowledge and information questions,
and finally a few more demographic questions. Prior to the questions about their attitudes and
perceptions of conventional gas development, residents were also given some brief background
information relating to conventional gas development in the region, as shown in Appendix A .
10 | CSIRO Australia’s National Science Agency
Figure 10 Outline of survey question topics
At the end of the survey participants were asked whether they would like to be in a prize draw for
some $50 gift vouchers as a thank‐you for completing the survey. Twenty participants were
randomly selected to receive vouchers.
ETHICS REVIEW
All procedures adhered to the National Statement on Ethical Conduct in Human Research, as well
as the ethical review processes of the CSIRO, which granted ethics approval.
3.3 Survey sample and representativeness
The sample comprised 533 residents and were sampled from the Wattle Range, Mount Gambier
and Grant LGAs in the southern Limestone Coast or lower South East region. Within that region,
there were three main areas of interest:
Penola and surrounds (108 residents from postcodes 5277, 5278, 5279 and 5263)
Millicent and surrounds (188 residents from postcode 5280)
Mt Gambier and surrounds (237 residents from postcodes 5290 and 5291)
Penola, Millicent and surrounds made up the Wattle Range LGA. Mount Gambier and surrounds
includes the LGA of Mount Gambier, which approximates the city boundary, plus the LGA of Grant
surrounding Mount Gambier, which is largely rural. See Figure 9.
Two of the three main areas of interest (Penola and surrounds and Millicent and surrounds) were
in the Wattle Range LGA, so this LGA was over sampled compared to the Mount Gambier and
Grant LGAs.
Those living out‐of‐town were also over sampled to ensure sufficient out‐of‐town residents and
farmers were included in the research.
Residents who were over‐sampled were later weighted to ensure the statistics were
representative for each subregion and the lower SE region, as shown in Table 2.
Representativeness
The sample was over‐representative of older males and under‐representative of younger adults.
Thus, to gain representative survey estimates, the sample was weighted by age, gender, and
whether respondents lived in‐ or out‐of‐town for each of the three main subregions. The data was
Initial quota screening and sorting into subregions
Community wellbeing and expected future
wellbeing
Brief background info provided
Attitudes about
conventional gas
development
Knowledge and
information questions
Demographic questions
Community wellbeing and local attitudes to conventional gas development in the South‐East of South Australia | 11
weighted using the calibrate program in Stata15 to achieve a close match to the ABS 2016
population census. The weighted sample was used in analyses of results.
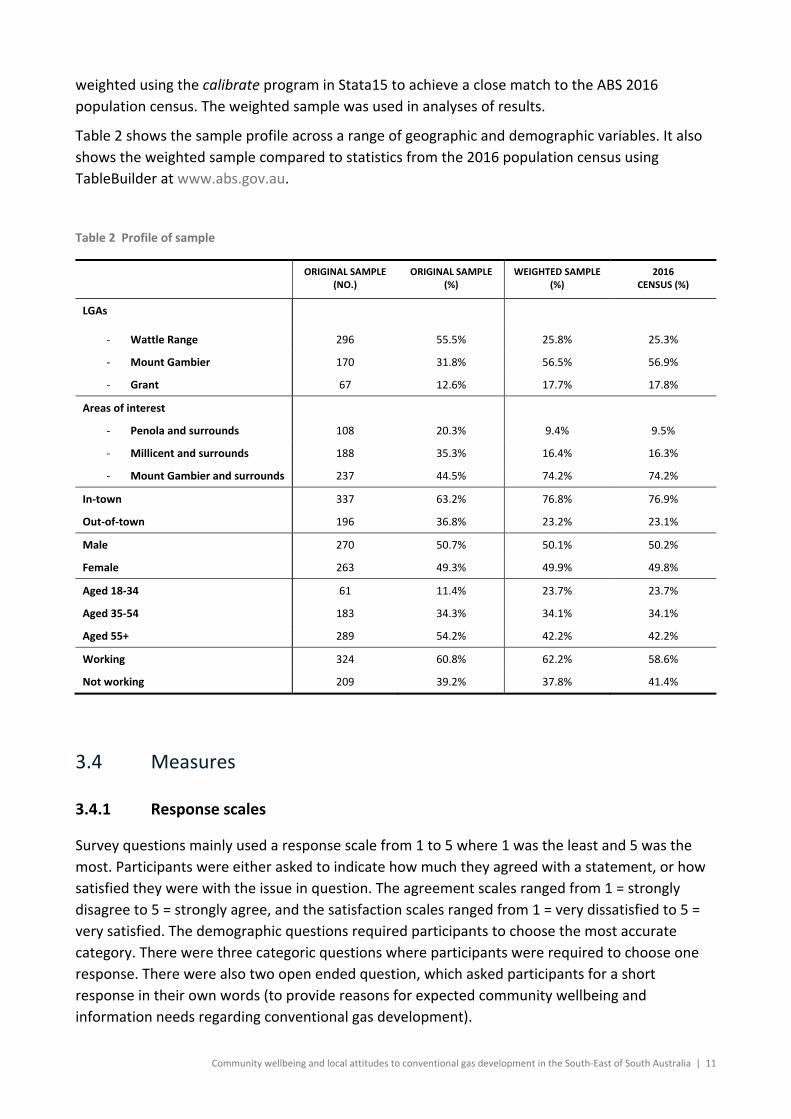
Table 2 shows the sample profile across a range of geographic and demographic variables. It also
shows the weighted sample compared to statistics from the 2016 population census using
TableBuilder at www.abs.gov.au.
Table 2 Profile of sample
ORIGINAL SAMPLE
(NO.) ORIGINAL SAMPLE
(%) WEIGHTED SAMPLE
(%) 2016
CENSUS (%)
LGAs
‐ Wattle Range 296 55.5% 25.8% 25.3%
‐ Mount Gambier 170 31.8% 56.5% 56.9%
‐ Grant 67 12.6% 17.7% 17.8%
Areas of interest
‐ Penola and surrounds 108 20.3% 9.4% 9.5%
‐ Millicent and surrounds 188 35.3% 16.4% 16.3%
‐ Mount Gambier and surrounds 237 44.5% 74.2% 74.2%
In‐town 337 63.2% 76.8% 76.9%
Out‐of‐town 196 36.8% 23.2% 23.1%
Male 270 50.7% 50.1% 50.2%
Female 263 49.3% 49.9% 49.8%
Aged 18‐34 61 11.4% 23.7% 23.7%
Aged 35‐54 183 34.3% 34.1% 34.1%
Aged 55+ 289 54.2% 42.2% 42.2%
Working 324 60.8% 62.2% 58.6%
Not working 209 39.2% 37.8% 41.4%
3.4 Measures
3.4.1 Response scales
Survey questions mainly used a response scale from 1 to 5 where 1 was the least and 5 was the
most. Participants were either asked to indicate how much they agreed with a statement, or how
satisfied they were with the issue in question. The agreement scales ranged from 1 = strongly
disagree to 5 = strongly agree, and the satisfaction scales ranged from 1 = very dissatisfied to 5 =
very satisfied. The demographic questions required participants to choose the most accurate
category. There were three categoric questions where participants were required to choose one
response. There were also two open ended question, which asked participants for a short
response in their own words (to provide reasons for expected community wellbeing and
information needs regarding conventional gas development).
12 | CSIRO Australia’s National Science Agency
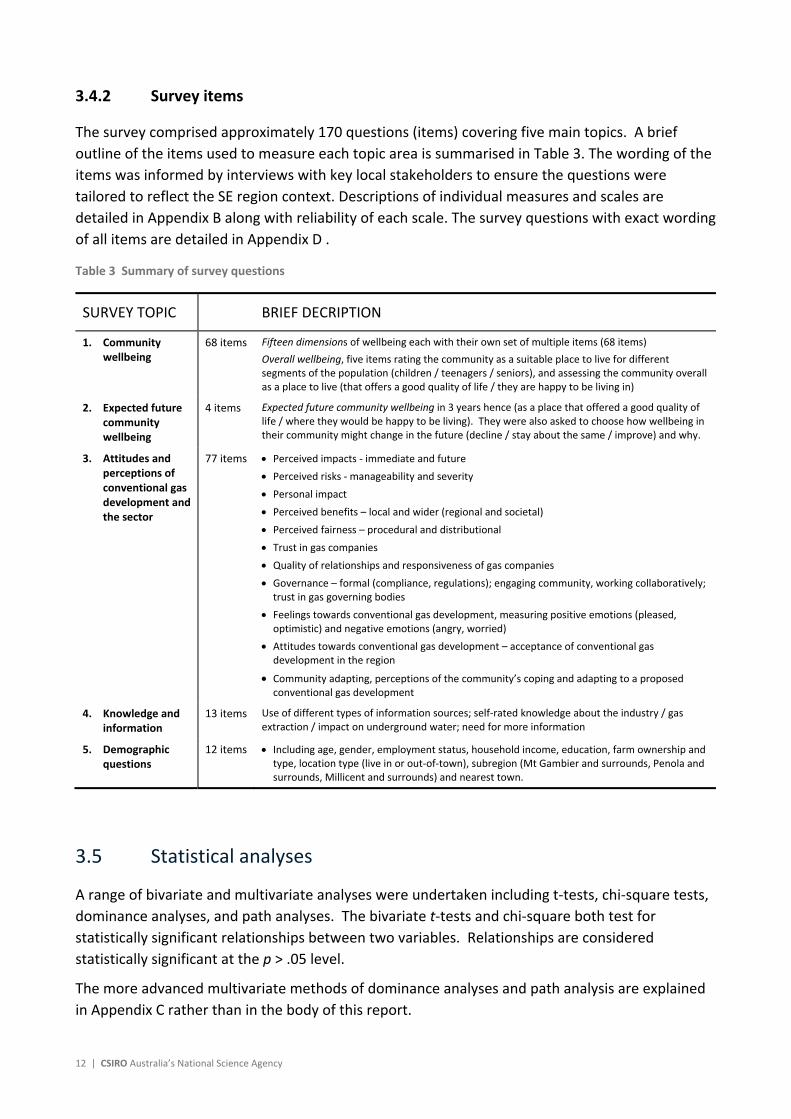
3.4.2 Survey items
The survey comprised approximately 170 questions (items) covering five main topics. A brief
outline of the items used to measure each topic area is summarised in Table 3. The wording of the
items was informed by interviews with key local stakeholders to ensure the questions were
tailored to reflect the SE region context. Descriptions of individual measures and scales are
detailed in Appendix B along with reliability of each scale. The survey questions with exact wording
of all items are detailed in Appendix D .
Table 3 Summary of survey questions
SURVEY TOPIC BRIEF DECRIPTION
1. Community wellbeing
68 items Fifteen dimensions of wellbeing each with their own set of multiple items (68 items)
Overall wellbeing, five items rating the community as a suitable place to live for different segments of the population (children / teenagers / seniors), and assessing the community overall as a place to live (that offers a good quality of life / they are happy to be living in)
2. Expected future community wellbeing
4 items Expected future community wellbeing in 3 years hence (as a place that offered a good quality of life / where they would be happy to be living). They were also asked to choose how wellbeing in their community might change in the future (decline / stay about the same / improve) and why.
3. Attitudes and perceptions of conventional gas development and the sector
77 items Perceived impacts ‐ immediate and future
Perceived risks ‐ manageability and severity
Personal impact
Perceived benefits – local and wider (regional and societal)
Perceived fairness – procedural and distributional
Trust in gas companies
Quality of relationships and responsiveness of gas companies
Governance – formal (compliance, regulations); engaging community, working collaboratively; trust in gas governing bodies
Feelings towards conventional gas development, measuring positive emotions (pleased, optimistic) and negative emotions (angry, worried)
Attitudes towards conventional gas development – acceptance of conventional gas development in the region
Community adapting, perceptions of the community’s coping and adapting to a proposed conventional gas development
4. Knowledge and information
13 items Use of different types of information sources; self‐rated knowledge about the industry / gas extraction / impact on underground water; need for more information
5. Demographic questions
12 items Including age, gender, employment status, household income, education, farm ownership and type, location type (live in or out‐of‐town), subregion (Mt Gambier and surrounds, Penola and surrounds, Millicent and surrounds) and nearest town.
3.5 Statistical analyses
A range of bivariate and multivariate analyses were undertaken including t‐tests, chi‐square tests,
dominance analyses, and path analyses. The bivariate t‐tests and chi‐square both test for
statistically significant relationships between two variables. Relationships are considered
statistically significant at the p > .05 level.
The more advanced multivariate methods of dominance analyses and path analysis are explained
in Appendix C rather than in the body of this report.

Community wellbeing and local attitudes to conventional gas development in the South‐East of South Australia | 13

14 | CSIRO Australia’s National Science Agency
Part 2 Results and Conclusions
Reporting of results
Findings reported as ‘significant’ means that they were ‘statistically significant’ at the p = .05 level.
This means there was less than a five percent chance that the findings were due to chance. This is
a convention in scientific report writing and denoted as p < .05. In some instances, scores have
been rounded to one decimal place in the graphical figures. Results of the survey are typically
described as average scores out of 5, using a scale from 1 to 5 where 1 is the least and 5 is the
most. A score below the midpoint of 3 is considered negative or unfavourable on average, except
where otherwise indicated. Results for subregions are reported as Mt Gambier, Penola, and
Millicent and refer to surrounding areas as well as the town.
Community wellbeing and local attitudes to conventional gas development in the South‐East of South Australia | 15
4 Community Wellbeing
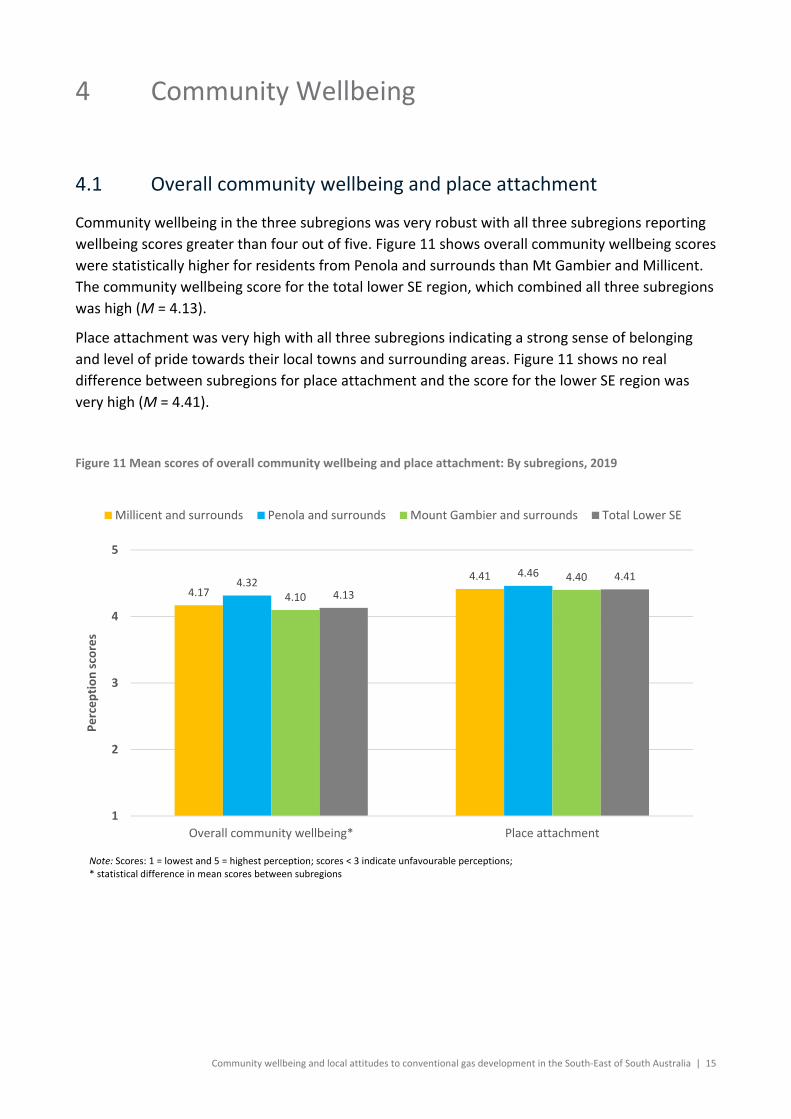
4.1 Overall community wellbeing and place attachment
Community wellbeing in the three subregions was very robust with all three subregions reporting
wellbeing scores greater than four out of five. Figure 11 shows overall community wellbeing scores
were statistically higher for residents from Penola and surrounds than Mt Gambier and Millicent.
The community wellbeing score for the total lower SE region, which combined all three subregions
was high (M = 4.13).
Place attachment was very high with all three subregions indicating a strong sense of belonging
and level of pride towards their local towns and surrounding areas. Figure 11 shows no real
difference between subregions for place attachment and the score for the lower SE region was
very high (M = 4.41).
Figure 11 Mean scores of overall community wellbeing and place attachment: By subregions, 2019
4.17
4.414.32
4.46
4.10
4.40
4.13
4.41
1
2
3
4
5
Overall community wellbeing* Place attachment
Perception scores
Millicent and surrounds Penola and surrounds Mount Gambier and surrounds Total Lower SE
Note: Scores: 1 = lowest and 5 = highest perception; scores < 3 indicate unfavourable perceptions;* statistical difference in mean scores between subregions

16 | CSIRO Australia’s National Science Agency
The individual items of overall community wellbeing showed that residents were very happy living
where they do and that they viewed their communities as great places to live and offering a good
quality of life. Figure 12 shows that people felt their communities were particularly suitable for
young children and seniors, though less so for teenagers. Penola residents indicated statistically
higher perceptions of their community than Mt Gambier and Millicent in four of the six items, as
also shown in Figure 12.
Figure 12 Overall community wellbeing items: By subregions, 2019
Differences between Farm owners and Non‐Farm owners
Figure 13 shows differences in overall community wellbeing and place attachment for farm
owners and non‐farm owners. Farm owners show statistically higher levels of both community
wellbeing and place attachment than people who don’t own farms. However, both cases show
very high levels of community wellbeing and place attachment.
Figure 13 Mean scores of overall community wellbeing and place attachment: By farm owners, 2019
1 2 3 4 5
This community is suitable for young children*
This community is suitable for teenagers
This community is suitable for seniors
Overall, this local area offers a good quality of life*
Overall, I am happy living in this local area*
This community is a great place to live*
Perception scores
Mt Gambier and surrounds Penola and surrounds Millicent and surrounds
Note: Scores: 1 = lowest and 5 = highest perception; scores < 3 indicate unfavourable perceptions; * statistical difference in mean scores between subregions
4.314.56
4.114.39
1
2
3
4
5
Overall community wellbeing* Place attachment*
Perception scores
Farm owners
Non‐Farm owners
Note: Scores: 1 = lowest and 5 = highest perception; scores < 3 indicate unfavourable perceptions;

Community wellbeing and local attitudes to conventional gas development in the South‐East of South Australia | 17
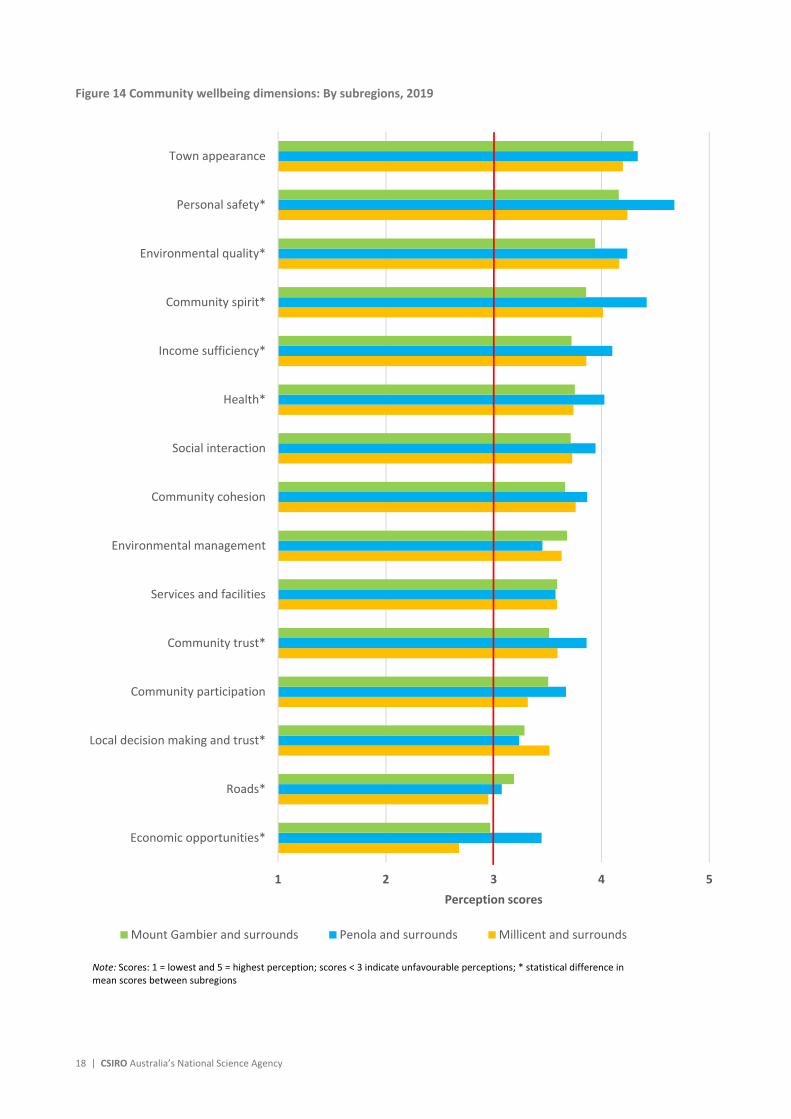
4.2 Dimensions of Community Wellbeing
The survey measured fifteen different dimensions of community wellbeing and analysed
differences between the subregions. As shown in Figure 14, all dimensions were rated positively
on average except for economic opportunities in Millicent and surrounds, which was rated
unfavourably and significantly lower than Mt Gambier and surrounds and Penola and surrounds.
Two other dimensions were rated borderline unfavourable, roads in Millicent and surrounds and
economic opportunities in Mt Gambier and surrounds. The remaining dimensions were perceived
to be more robust with town appearance, personal safety, and environmental quality rated
around four or above on average, which are high scores.
There were significant differences among the subregions in nine of the fifteen dimensions. Figure
14 shows Penola had significantly higher levels than the other subregions on seven of the
wellbeing dimensions: personal safety, environmental quality, community spirit, income
sufficiency, individual health, community participation, and economic opportunities. Millicent and
surrounds showed significantly higher perceptions of community trust, and local decision‐making
processes and trust. Mount Gambier had significantly higher satisfaction with the roads and
economic opportunities than Millicent, though still modest, while the environmental quality in
Mount Gambier was perceived to be significantly lower than the other two subregions, though still
relatively high.
18 | CSIRO Australia’s National Science Agency
Figure 14 Community wellbeing dimensions: By subregions, 2019
1 2 3 4 5
Economic opportunities*
Roads*
Local decision making and trust*
Community participation
Community trust*
Services and facilities
Environmental management
Community cohesion
Social interaction
Health*
Income sufficiency*
Community spirit*
Environmental quality*
Personal safety*
Town appearance
Perception scores
Mount Gambier and surrounds Penola and surrounds Millicent and surrounds
Note: Scores: 1 = lowest and 5 = highest perception; scores < 3 indicate unfavourable perceptions; * statistical difference in mean scores between subregions
Community wellbeing and local attitudes to conventional gas development in the South‐East of South Australia | 19
Differences between Farm owners and Non‐Farm owners
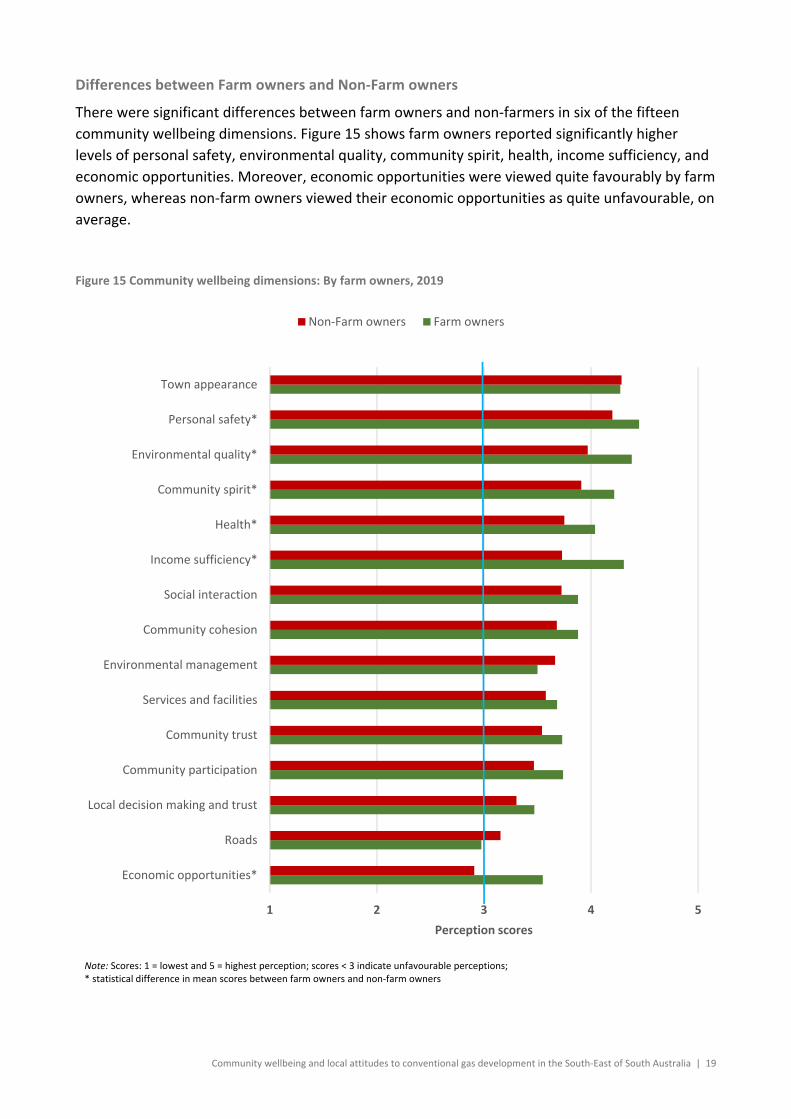
There were significant differences between farm owners and non‐farmers in six of the fifteen
community wellbeing dimensions. Figure 15 shows farm owners reported significantly higher
levels of personal safety, environmental quality, community spirit, health, income sufficiency, and
economic opportunities. Moreover, economic opportunities were viewed quite favourably by farm
owners, whereas non‐farm owners viewed their economic opportunities as quite unfavourable, on
average.
Figure 15 Community wellbeing dimensions: By farm owners, 2019
1 2 3 4 5
Economic opportunities*
Roads
Local decision making and trust
Community participation
Community trust
Services and facilities
Environmental management
Community cohesion
Social interaction
Income sufficiency*
Health*
Community spirit*
Environmental quality*
Personal safety*
Town appearance
Perception scores
Non‐Farm owners Farm owners
Note: Scores: 1 = lowest and 5 = highest perception; scores < 3 indicate unfavourable perceptions; * statistical difference in mean scores between farm owners and non‐farm owners

20 | CSIRO Australia’s National Science Agency
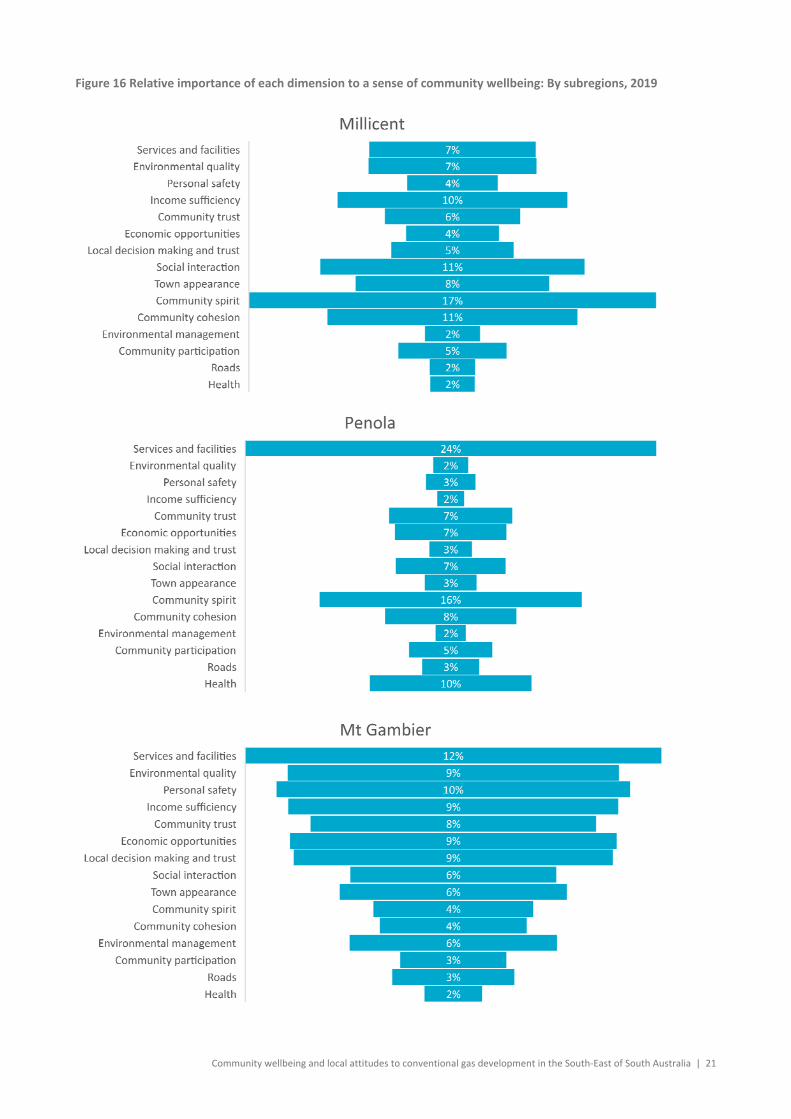
4.3 Most important dimensions of community wellbeing
Analyses showed that the most important wellbeing dimensions contributing towards a sense that
their community was a great place to live and offered a good quality of life for all ages were not
always the dimensions with the highest perceptions scores. The analyses demonstrated that
across the lower SE region the biggest drivers of community wellbeing were services and facilities,
the quality of the environment, perceptions of personal safety, income sufficiency, and
perceptions of community trust. However, there was considerable variation among the
subregions.
Differences among the subregions
In Millicent, social aspects took on a greater level of importance in explaining community
wellbeing such as the level of community spirit, the amount of social interaction, and perceptions
of community cohesion all ranking as the three most important dimensions. Income sufficiency
was the fourth most important dimension. The least important dimensions to community
wellbeing in Millicent were individual health and roads.
In Penola, services and facilities were by far the biggest drivers of community wellbeing followed
by community spirit, health, and community cohesion. In contrast to Millicent and Mt Gambier,
income sufficiency was the least important dimension contributing to a sense of community
wellbeing in Penola. Also unique to Penola was the relative high importance of health to
community wellbeing.
In Mt Gambier services and facilities were also the biggest driver of community wellbeing, though
less so than for Penola, followed by personal safety, environmental quality, and income
sufficiency. The least important drivers of community wellbeing were health, community spirit,
and roads. The relative lack of importance of community spirit as a contributor to community
wellbeing was different from the other two smaller subregions, where community spirit was in the
top two drivers of community wellbeing.
These marked differences among the three subregions suggest that initiatives for improving or
maintaining wellbeing within each of the subregions need to be very place‐based and respond to
the aspects of community life that contribute most to community wellbeing in each subregion.
One common finding for each of the subregions was that roads were ranked as one of the lowest
contributors to a sense of community wellbeing even though perceptions of roads were very low
across the region. This means that even if you think roads are bad you may still feel that your
community is a great place to live.
Figure 16 depicts the relative importance of each dimension to community wellbeing for each of
the subregions in terms of how much variation in community wellbeing was attributable to each
driver. Note the differences in the respective size of the drivers for each subregion. The value in
understanding which dimensions drive community wellbeing the most is that it helps support
decision making for targeted initiatives that contribute most to making the community a great
place to live for residents.
Community wellbeing and local attitudes to conventional gas development in the South‐East of South Australia | 21
Figure 16 Relative importance of each dimension to a sense of community wellbeing: By subregions, 2019
22 | CSIRO Australia’s National Science Agency
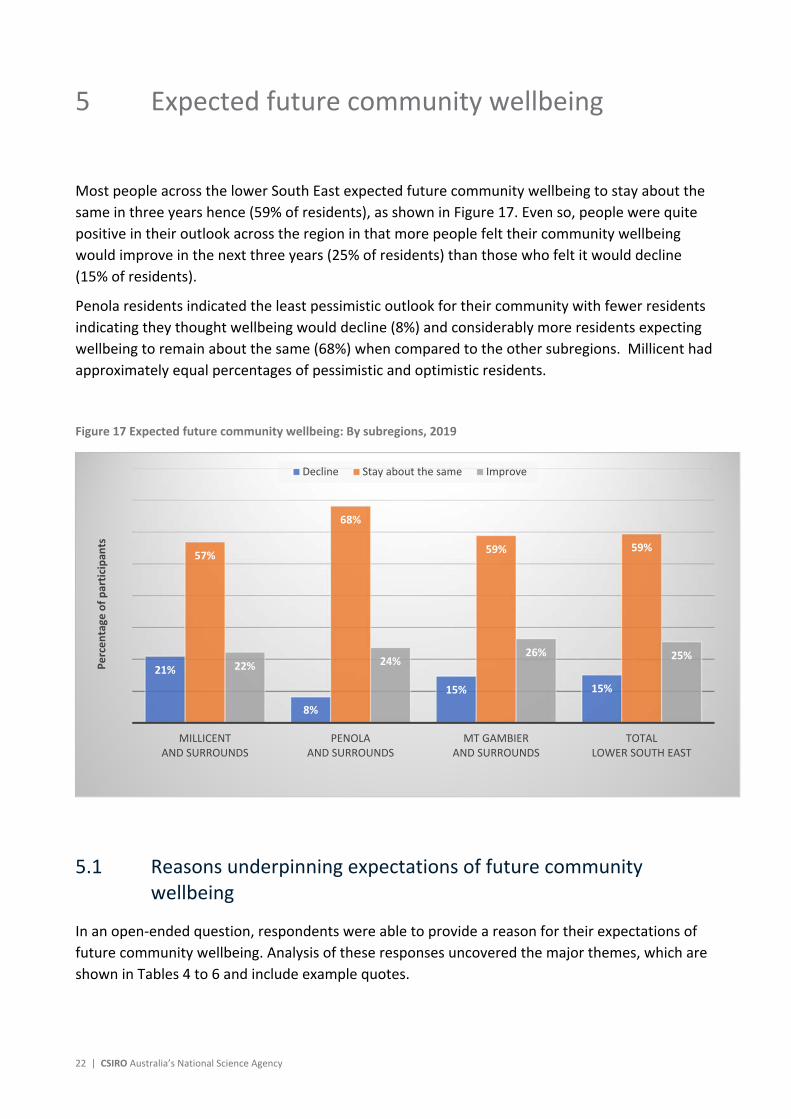
5 Expected future community wellbeing
Most people across the lower South East expected future community wellbeing to stay about the
same in three years hence (59% of residents), as shown in Figure 17. Even so, people were quite
positive in their outlook across the region in that more people felt their community wellbeing
would improve in the next three years (25% of residents) than those who felt it would decline
(15% of residents).
Penola residents indicated the least pessimistic outlook for their community with fewer residents
indicating they thought wellbeing would decline (8%) and considerably more residents expecting
wellbeing to remain about the same (68%) when compared to the other subregions. Millicent had
approximately equal percentages of pessimistic and optimistic residents.
Figure 17 Expected future community wellbeing: By subregions, 2019
5.1 Reasons underpinning expectations of future community wellbeing
In an open‐ended question, respondents were able to provide a reason for their expectations of
future community wellbeing. Analysis of these responses uncovered the major themes, which are
shown in Tables 4 to 6 and include example quotes.
21%
8%
15% 15%
57%
68%
59% 59%
22% 24%26% 25%
MILLICENT AND SURROUNDS
PENOLA AND SURROUNDS
MT GAMBIER AND SURROUNDS
TOTAL LOWER SOUTH EAST
Percentage
of participan
ts
Decline Stay about the same Improve

Community wellbeing and local attitudes to conventional gas development in the South‐East of South Australia | 23
DECLINE
Those who felt their region would decline, frequently expressed a negative outlook on economic
prospects. For example, these respondents had concerns about job losses, businesses closing and
industries declining. This theme was particularly prominent in Millicent and Mount Gambier.
Reasons for decline also commonly featured pessimistic views about a lack of services and
facilities in the area. Other reasons described less frequently included concerns about social issues
such as drug abuse and crime; population decline; deteriorating community spirit; and concerns
about industry development including conventional gas.
Table 4 Reasons for expecting future community wellbeing to decline
THEME PROPORTION OF RESPONSES*
EXAMPLE QUOTES
Negative economic outlook 56% “Because there is not enough work here to keep people here. We need more industry here”
“It is all job related, so if the big employers go belly‐up, then that is it for the rest of the jobs”
Lack of services and facilities 31% “They're taking services away”
“Lack of medical services in Millicent hospital, especially for elderly people”
Social issues 19% “The community is divided with low and high incomes and causes issues. Just common low socioeconomic issues such as drug‐use and high crime”
Population decline 13% "Younger people leaving the area"
Loss of community spirit 10% "Local community values are declining"
Impacts from industry 7% "Contamination of underground water"
Other 3% NA
*Responses could include multiple themes, therefore total proportion does not equal 100%
IMPROVE
Reasons for expecting community wellbeing to improve generally mirrored the reasons for decline
but viewed in a positive light. These reasons with accompanying example quotes are shown in
Table 5. An improvement in services and facilities was frequently described, especially in Mount
Gambier. Again, economic outlook featured prominently in responses, with respondents indicating
they felt job opportunities would increase, and business and industry conditions improve. Other
reasons included the strong community spirit of the area, a growing population, and general
optimism for the future.
Table 5 Reasons for expecting future community wellbeing to improve
THEME PROPORTION OF RESPONSES*
EXAMPLE QUOTES
Improving facilities and services
33% "Because the main facilities tend to improve and progress over time"
“Starting to offer more for young people in the area, sporting facilities”
Positive economic outlook 31% "Hopefully there'll be some more job opportunities"
“Some new businesses are opening, employment should improve”
Positive community spirit 16% "Because people do care…There is kindness here"
“I've got 2 kids with disabilities and there's more acceptance around disabilities and more understanding”

24 | CSIRO Australia’s National Science Agency
Generally optimistic 15% “Because I like to think on the positive side"
“I guess you have to be optimistic”
Increasing population 10% "A lot more new people coming into the area"
Better government support 7% "Because council have got some initiative"
Other 5% NA
Don't know 4% NA
Town upgrades, visual amenity
2% "…upgrades to old buildings and painting of murals"
*Responses could include multiple themes, therefore total proportion does not equal 100%
STAY THE SAME
Reasons for believing community wellbeing would stay the same are displayed in Table 6 and
varied greatly. However, the most prominent theme by far was the perception that the
community was slow to change or had always been the same, therefore no major change was
expected within a three‐year timeframe. Similar themes also featured again for this response
category, with many having concerns about the economy, while some felt it would remain stable.
Other themes included a positive outlook on the community’s spirit, concerns over local services
and facilities, population stability, and a lack of community investment and planning for improving
the area. A small number of respondents had concerns about the community’s unwillingness and
lack of initiative for change, a declining population and concerns about gas industry development.
Table 6 Reasons for expecting community wellbeing to stay the same
THEME PROPORTION OF RESPONSES*
EXAMPLE QUOTES
Community slow to change 38% “Never much change around here from past experience”
“Everything will stay the same. Not much happens in Millicent. Nothing in the pipeline to change anything”
Negative economic outlook 21% “No more business or industry opportunities ‐ on the decline”
“Well it doesn’t seem to go ahead. The shops are shutting and not going ahead anywhere”
Stable economy 10% “It's been pretty stable over the past 15 years. As long the farming stays the same and main employer industry stays the same, everything will stay the same this way”
“I'm not aware of any future plans of employment or job opportunities”
Positive community 9% “I just love it, all the people are really lovely here. They help if anything goes wrong, they're all at the door”
Stable population 9% "The people who live here never move away"
Concerned about local services 9% "Lack of access to specialists"
Lack of investment and planning 7% "I think the local government look after us but the state government don't"
Unwillingness to change 4% "Things don't change in parochial towns"
Population in decline 3% "Teenagers leave to get jobs"
Other 3% NA
Don't know 3% NA
Concerned about gas industry 2% "Drilling for gas...may ruin the water supply"
*Responses could include multiple themes, therefore total proportion does not equal 100%

Community wellbeing and local attitudes to conventional gas development in the South‐East of South Australia | 25
6 Attitudes and perceptions of conventional gas development
6.1 Attitudes towards conventional gas development
Attitudes towards conventional gas development in the lower SE of South Australia ranged across
a spectrum of views, as show in Figure 18.
22% of people rejected conventional gas development
13% of people embraced conventional gas development
65% of people tolerated, would be OK with it, or approved of conventional gas development
– 28% would tolerate it
– 22% would be OK with it
– 15% would approve it
Figure 18 Attitudes towards conventional gas development in the lower SE of South Australia
Differences among subregions
The range of attitudes differed among the subregions with residents from Millicent and surrounds
showing the highest proportion of people who would tolerate conventional gas development (see
Figure 19). Millicent and surrounds and Mt Gambier and surrounds also showed a more typical
‘bell‐curve’ pattern in their distribution of attitudes. In comparison, Penola and surrounds showed
a tendency for views to be more polarised with fewest people indicating the middle view, that is
being ‘OK with it’.
22%
28%
22%
15%13%
0%
10%
20%
30%
40%
50%
Reject it Tolerate it Be OK with it Approve of it Embrace it
Percentage
of participan
ts
Note: Percentages rounded to the nearest whole

26 | CSIRO Australia’s National Science Agency
Figure 19 Attitudes towards conventional gas development in the lower SE of South Australia: By subregion, 2019
Differences between Farm owners and Non‐Farm owners
Figure 20 shows farmers also demonstrated a range of views towards conventional gas
development though statistically these were not different from non‐farmers. However, farmers
were similar to Penola in that they showed a tendency for a more polarised spread of views
towards conventional gas development with fewer people being in the middle of the distribution.
‘Farmers’ included residents owning more than 40 hectares or 100 acres of agricultural land,
including vineyards.
Figure 20 Attitudes towards conventional gas development in the lower SE of South Australia: By farm ownership,
2019
20%
39%
18%
13%10%
26%28%
10%
21%
15%
22%
25% 24%
15% 14%
0%
10%
20%
30%
40%
50%
Reject it Tolerate it Be OK with it Approve of it Embrace it
Percentage
of participan
ts
Millicent Penola Mt Gambier
Note: Percentages rounded to the nearest whole percent
25%
28%
12%
21%
14%
22%
28%
23%
15% 13%
0%
10%
20%
30%
40%
50%
Reject it Tolerate it Be OK with it Approve of it Embrace it
Percentage
of participan
ts
Farm owner Non‐farm owner
Note: Percentages rounded to the nearest whole percent
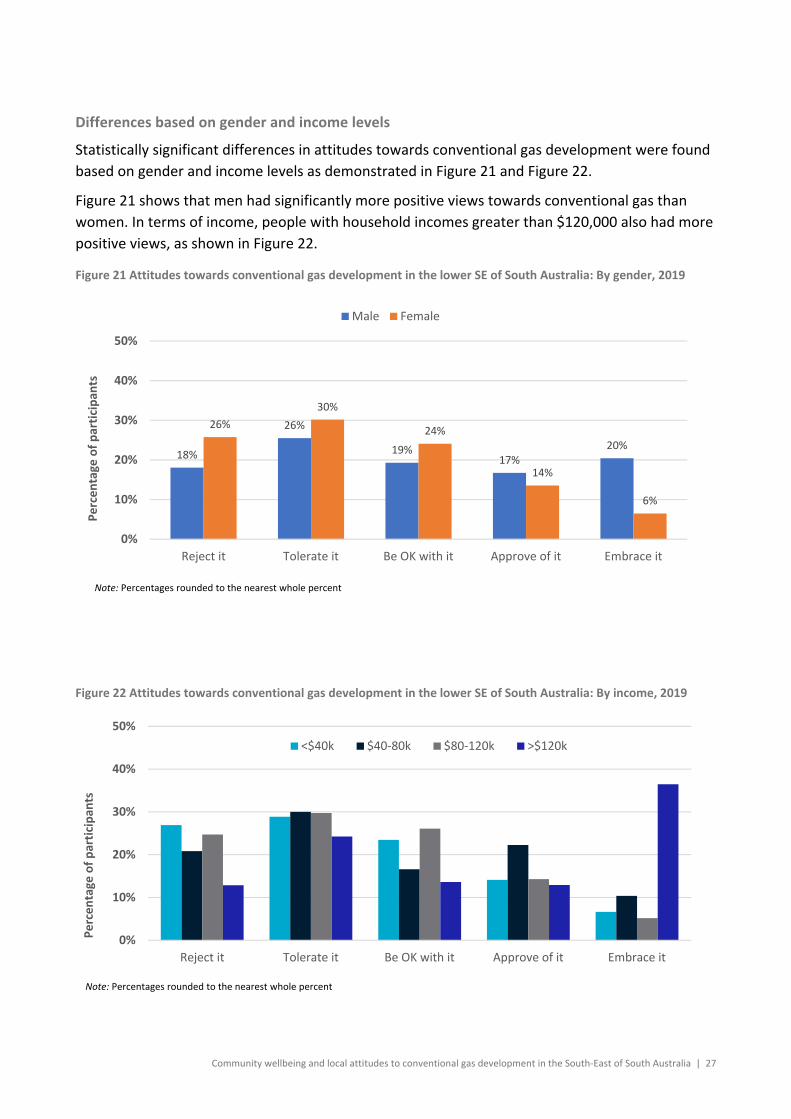
Community wellbeing and local attitudes to conventional gas development in the South‐East of South Australia | 27
Differences based on gender and income levels
Statistically significant differences in attitudes towards conventional gas development were found
based on gender and income levels as demonstrated in Figure 21 and Figure 22.
Figure 21 shows that men had significantly more positive views towards conventional gas than
women. In terms of income, people with household incomes greater than $120,000 also had more
positive views, as shown in Figure 22.
Figure 21 Attitudes towards conventional gas development in the lower SE of South Australia: By gender, 2019
Figure 22 Attitudes towards conventional gas development in the lower SE of South Australia: By income, 2019
18%
26%
19%17%
20%
26%
30%
24%
14%
6%
0%
10%
20%
30%
40%
50%
Reject it Tolerate it Be OK with it Approve of it Embrace it
Percentage
of participan
ts
Male Female
Note: Percentages rounded to the nearest whole percent
0%
10%
20%
30%
40%
50%
Reject it Tolerate it Be OK with it Approve of it Embrace it
Percentage
of participan
ts
<$40k $40‐80k $80‐120k >$120k
Note: Percentages rounded to the nearest whole percent
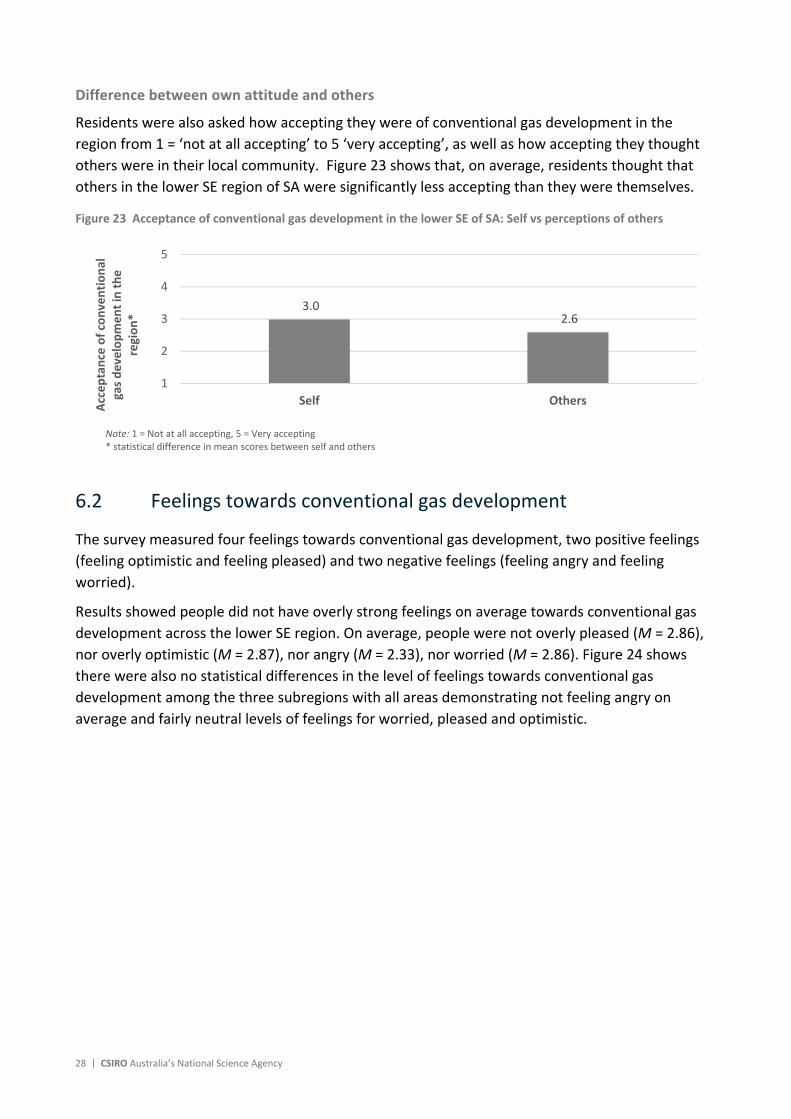
28 | CSIRO Australia’s National Science Agency
Difference between own attitude and others
Residents were also asked how accepting they were of conventional gas development in the
region from 1 = ‘not at all accepting’ to 5 ‘very accepting’, as well as how accepting they thought
others were in their local community. Figure 23 shows that, on average, residents thought that
others in the lower SE region of SA were significantly less accepting than they were themselves.
Figure 23 Acceptance of conventional gas development in the lower SE of SA: Self vs perceptions of others
6.2 Feelings towards conventional gas development
The survey measured four feelings towards conventional gas development, two positive feelings
(feeling optimistic and feeling pleased) and two negative feelings (feeling angry and feeling
worried).
Results showed people did not have overly strong feelings on average towards conventional gas
development across the lower SE region. On average, people were not overly pleased (M = 2.86),
nor overly optimistic (M = 2.87), nor angry (M = 2.33), nor worried (M = 2.86). Figure 24 shows
there were also no statistical differences in the level of feelings towards conventional gas
development among the three subregions with all areas demonstrating not feeling angry on
average and fairly neutral levels of feelings for worried, pleased and optimistic.
3.0 2.6
1
2
3
4
5
Self Others
Acceptance of conve
ntional
gas deve
lopment in the
region*
Note: 1 = Not at all accepting, 5 = Very accepting * statistical difference in mean scores between self and others
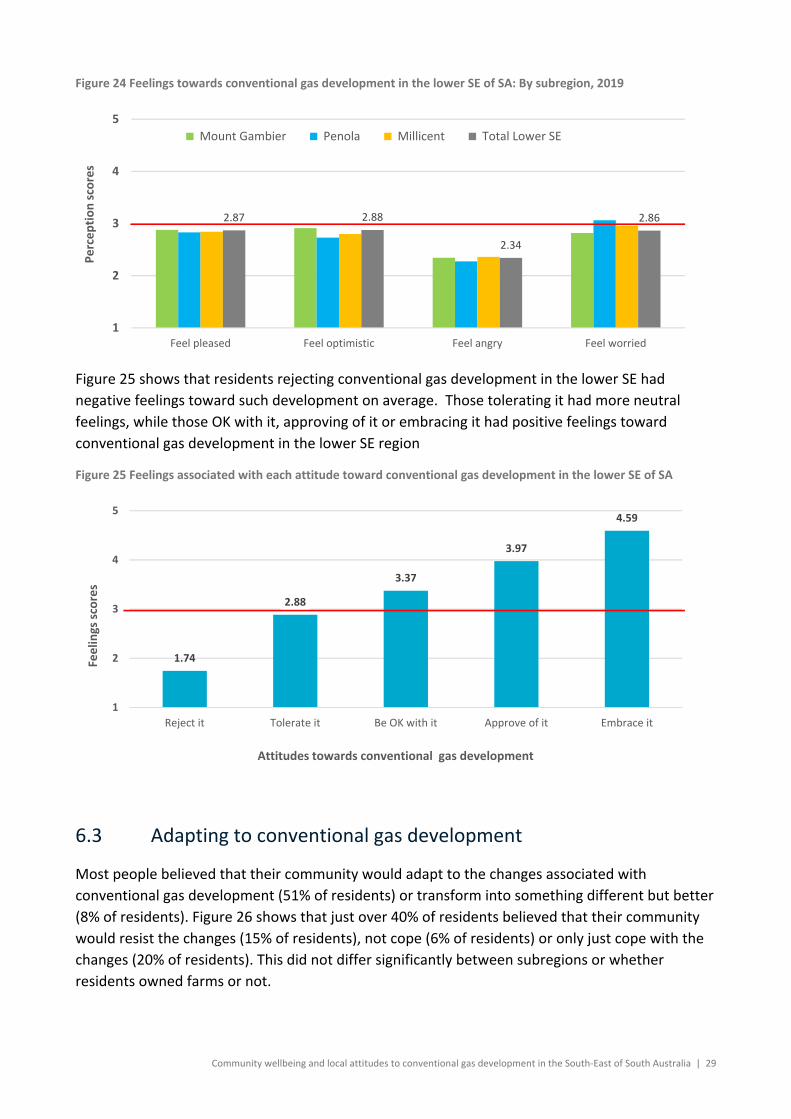
Community wellbeing and local attitudes to conventional gas development in the South‐East of South Australia | 29
Figure 24 Feelings towards conventional gas development in the lower SE of SA: By subregion, 2019
Figure 25 shows that residents rejecting conventional gas development in the lower SE had
negative feelings toward such development on average. Those tolerating it had more neutral
feelings, while those OK with it, approving of it or embracing it had positive feelings toward
conventional gas development in the lower SE region
Figure 25 Feelings associated with each attitude toward conventional gas development in the lower SE of SA
6.3 Adapting to conventional gas development
Most people believed that their community would adapt to the changes associated with
conventional gas development (51% of residents) or transform into something different but better
(8% of residents). Figure 26 shows that just over 40% of residents believed that their community
would resist the changes (15% of residents), not cope (6% of residents) or only just cope with the
changes (20% of residents). This did not differ significantly between subregions or whether
residents owned farms or not.
2.87 2.88
2.34
2.86
1
2
3
4
5
Feel pleased Feel optimistic Feel angry Feel worried
Perception scores
Mount Gambier Penola Millicent Total Lower SE
1.74
2.88
3.37
3.97
4.59
1
2
3
4
5
Reject it Tolerate it Be OK with it Approve of it Embrace it
Feelin
gs scores
Attitudes towards conventional gas development

30 | CSIRO Australia’s National Science Agency
Figure 26 Perceptions of community responses to conventional gas development in the lower SE of SA
6.4 Perceptions about conventional gas development and the sector
6.4.1 Summary of the underlying drivers
Previous research and interviews with stakeholders identified a range of issues that underpin
people’s overall attitudes and feelings towards conventional gas development. The survey asked
over 70 questions related to these issues, which are grouped together into key themes or
underlying drivers. For example, trust in the gas industry or perceptions of governance are each a
key theme or underlying driver.
The underlying drivers include:
1. Perceived impacts: more immediate issues, possible future issues, risk manageability, risk
severity
2. Perceived Benefits: local benefits, regional and societal benefits
3. Distributional fairness: perceptions of how fairly impacts and benefits are shared
4. Trust in the onshore gas industry
5. Relationship quality: perceptions of the quality of the relationship between the industry and
community
6. Procedural fairness: perceptions of how fairly the industry will treat the community
7. Governance: perceptions of formal governance (regulations and compliance), government
engaging with communities, working collaboratively with communities, trust in state
departments
8. Knowledge: awareness and understanding of the onshore conventional gas industry
15%
6%
20%
51%
8%
0%
10%
20%
30%
40%
50%
60%
Resist Not cope Only just cope Adapt to thechanges
Change intosomething
different but better
Percentage
of participan
ts
How do you believe your community would respond to conventional gas development in the SE of South Australia? ‐ choose one response
Note: Percentages rounded to the nearest whole percent

Community wellbeing and local attitudes to conventional gas development in the South‐East of South Australia | 31
We measured each of the eight key drivers, with some drivers having sub‐components. For
example, perceived impacts is a key driver and is broken down into immediate impacts and
possible future impacts.
Table 7 briefly describes each driver and sub‐component and presents the average score for each
for the total lower SE region. It also includes some additional perception scores about risk and
information needs. Figure 27 illustrates these scores for each subregion and the average score for
each subregion is presented in Appendix E . A more detailed analysis of each key driver is found in
Section 7, which allows the reader to more deeply engage with each of the concepts and gain a
more specific understanding of the driver.

32 | CSIRO Australia’s National Science Agency
Table 7 Summarising the underlying drivers and perception scores for the lower SE region
UNDERLYING DRIVER DESCRIPTION
EXAMPLES
PERCEPTION SCORES
LOWER SE REGION
PERCEIVED IMPACTS OVERALL 3.43
‐ More immediate issues Damage to underground aquifers; depletion of underground water, dust, noise, and light pollution; a threat to ‘clean’ and ‘green’ brand; threat to rural liveability; reduces region’s visual attractiveness; impact on farm property values; increased traffic; community division; health impacts
3.26
‐ Possible future issues Fracking being introduced after the moratorium; unconventional gas being introduced over time, conventional gas development extending into other farming areas; well integrity over time
3.86
Risk manageability Risks to underground water are understood by science; are understood by the community; are manageable
3.03
Risk severity Risks potentially uncontrollable; potentially disastrous; can adversely affect future generations
3.61
PERCEIVED BENEFITS OVERALL 3.05
‐ Local benefits Local employment; local business opportunities; opportunities for young people to stay in region; corporate support for local community activities; additional services and facilities; cheaper gas for local industries; cheaper gas for residents
2.98
‐ Regional and societal benefits
Improving energy security in the region; supporting the viability of big gas users; make the region more attractive to new businesses and industry; boosting the wider state economy; role in transitioning to renewable energy; role in SA future energy mix
3.13
DISTRIBUTIONAL FAIRNESS Fair to have conventional gas development in the region if your local council compensated accordingly; your community received a fair share of the benefits; if farmers compensated fairly; if good arguments for having it in this region
3.30
TRUST IN GAS COMPANY Trust local gas companies to act responsibly; in local community’s best interest’s; trust their capability; overall extent of trust
2.60
RELATIONSHIP QUALITY Gas companies would be accessible or easy to contact; open, honest and transparent; engage in genuine two‐way dialogue; respond to issues in a timely manner
2.39
PROCEDURAL FAIRNESS Gas company would listen to and respect community opinions; be prepared to change its practices in response to community sentiment; inform residents of important developments; give opportunities for communities to participate in decision making
2.45
GOVERNANCE OVERALL 2.84
‐ Formal governance Legislation and regulation could be counted on to ensure companies did the right thing; The EPA would be able to hold companies accountable for any breaches
3.02
‐ Engaging community The local council would listen to and advocate for local communities about gas development; the EPA would listen to and respond to community concerns; and inform local communities of issues with gas development as they arise.
3.00
‐ Working collaboratively Government, communities, and gas companies can work together to address problems; to make opportunities; share information, resources and learnings; proactively plan for future changes; manage any changes effectively
2.81
‐ Trust in state departments Trust state governing bodies overseeing conventional gas development to act responsibly; in local community’s best interest’s; trust their capability
2.57
KNOWLEDGE How much do you feel you know about the conventional gas industry; how aware are you that hydraulic fracturing is not needed to extract conventional gas; a relatively small amount of water is used; about the differences between conventional and unconventional gas
3.03
Need for more information How much more information do you feel you need about the local conventional gas industry
3.39
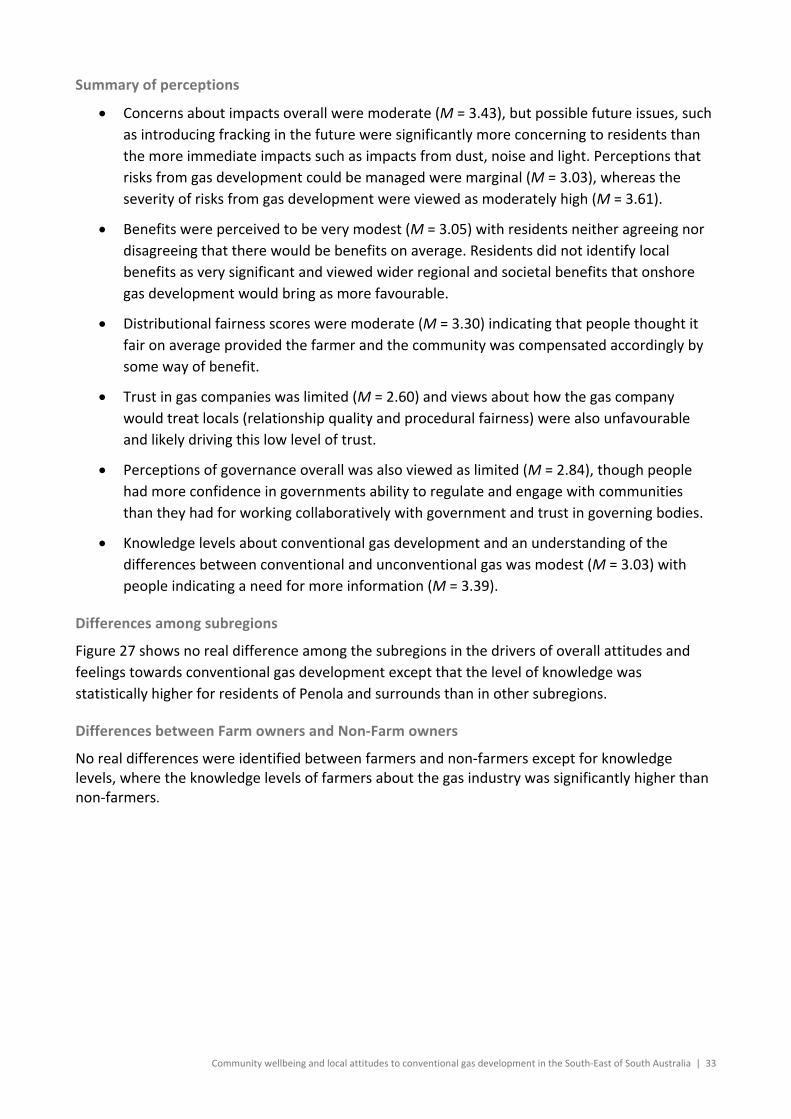
Community wellbeing and local attitudes to conventional gas development in the South‐East of South Australia | 33
Summary of perceptions
Concerns about impacts overall were moderate (M = 3.43), but possible future issues, such
as introducing fracking in the future were significantly more concerning to residents than
the more immediate impacts such as impacts from dust, noise and light. Perceptions that
risks from gas development could be managed were marginal (M = 3.03), whereas the
severity of risks from gas development were viewed as moderately high (M = 3.61).
Benefits were perceived to be very modest (M = 3.05) with residents neither agreeing nor
disagreeing that there would be benefits on average. Residents did not identify local
benefits as very significant and viewed wider regional and societal benefits that onshore
gas development would bring as more favourable.
Distributional fairness scores were moderate (M = 3.30) indicating that people thought it
fair on average provided the farmer and the community was compensated accordingly by
some way of benefit.
Trust in gas companies was limited (M = 2.60) and views about how the gas company
would treat locals (relationship quality and procedural fairness) were also unfavourable
and likely driving this low level of trust.
Perceptions of governance overall was also viewed as limited (M = 2.84), though people
had more confidence in governments ability to regulate and engage with communities
than they had for working collaboratively with government and trust in governing bodies.
Knowledge levels about conventional gas development and an understanding of the
differences between conventional and unconventional gas was modest (M = 3.03) with
people indicating a need for more information (M = 3.39).
Differences among subregions
Figure 27 shows no real difference among the subregions in the drivers of overall attitudes and
feelings towards conventional gas development except that the level of knowledge was
statistically higher for residents of Penola and surrounds than in other subregions.
Differences between Farm owners and Non‐Farm owners
No real differences were identified between farmers and non‐farmers except for knowledge levels, where the knowledge levels of farmers about the gas industry was significantly higher than non‐farmers.
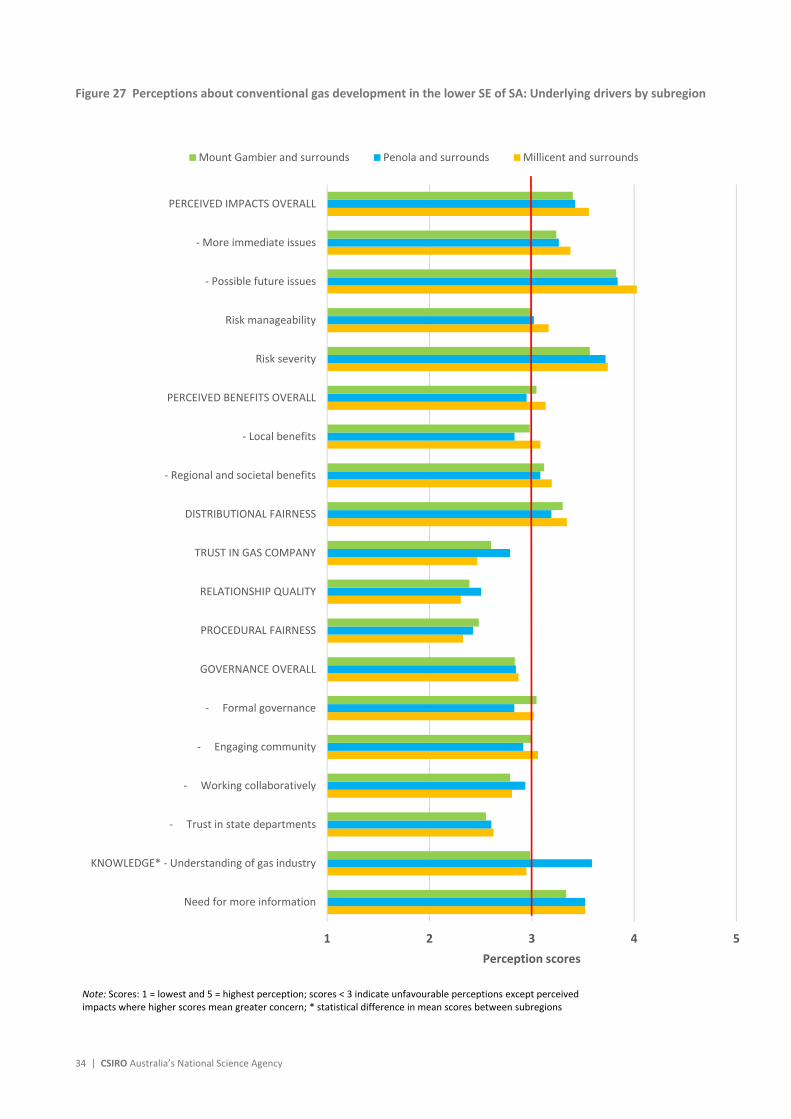
34 | CSIRO Australia’s National Science Agency
Figure 27 Perceptions about conventional gas development in the lower SE of SA: Underlying drivers by subregion
1 2 3 4 5
Need for more information
KNOWLEDGE* ‐ Understanding of gas industry
‐ Trust in state departments
‐ Working collaboratively
‐ Engaging community
‐ Formal governance
GOVERNANCE OVERALL
PROCEDURAL FAIRNESS
RELATIONSHIP QUALITY
TRUST IN GAS COMPANY
DISTRIBUTIONAL FAIRNESS
‐ Regional and societal benefits
‐ Local benefits
PERCEIVED BENEFITS OVERALL
Risk severity
Risk manageability
‐ Possible future issues
‐ More immediate issues
PERCEIVED IMPACTS OVERALL
Perception scores
Mount Gambier and surrounds Penola and surrounds Millicent and surrounds
Note: Scores: 1 = lowest and 5 = highest perception; scores < 3 indicate unfavourable perceptions except perceived impacts where higher scores mean greater concern; * statistical difference in mean scores between subregions

Community wellbeing and local attitudes to conventional gas development in the South‐East of South Australia | 35
6.5 Model of social acceptance: A framework for explaining trust and social acceptance of conventional gas development
Statistical modelling of the eight key factors contributing to trust and social acceptance showed
how the different factors work together to shape people’s overall attitude or level of acceptance
towards conventional gas development. It also shows the factors important to trust and a sense of
distributional fairness.
As Figure 28 shows, the model demonstrates that people’s trust and acceptance of the industry is
dependent on a range of factors. Moreover, each factor needs to be addressed and improved if
people’s trust in industry and acceptance of conventional gas development in their communities is
to improve.
The relationships between all these factors were positive except for perceived impacts, which
demonstrated negative relationships. A positive relationship means that when a person perceives
one factor to be high, they are more likely to perceive the corresponding factor to also be high. In
contrast, a negative relationship means that when a person perceives one factor to be high, they
are more likely to perceive the other factor to be low.
Figure 28 CSIRO model of social acceptance
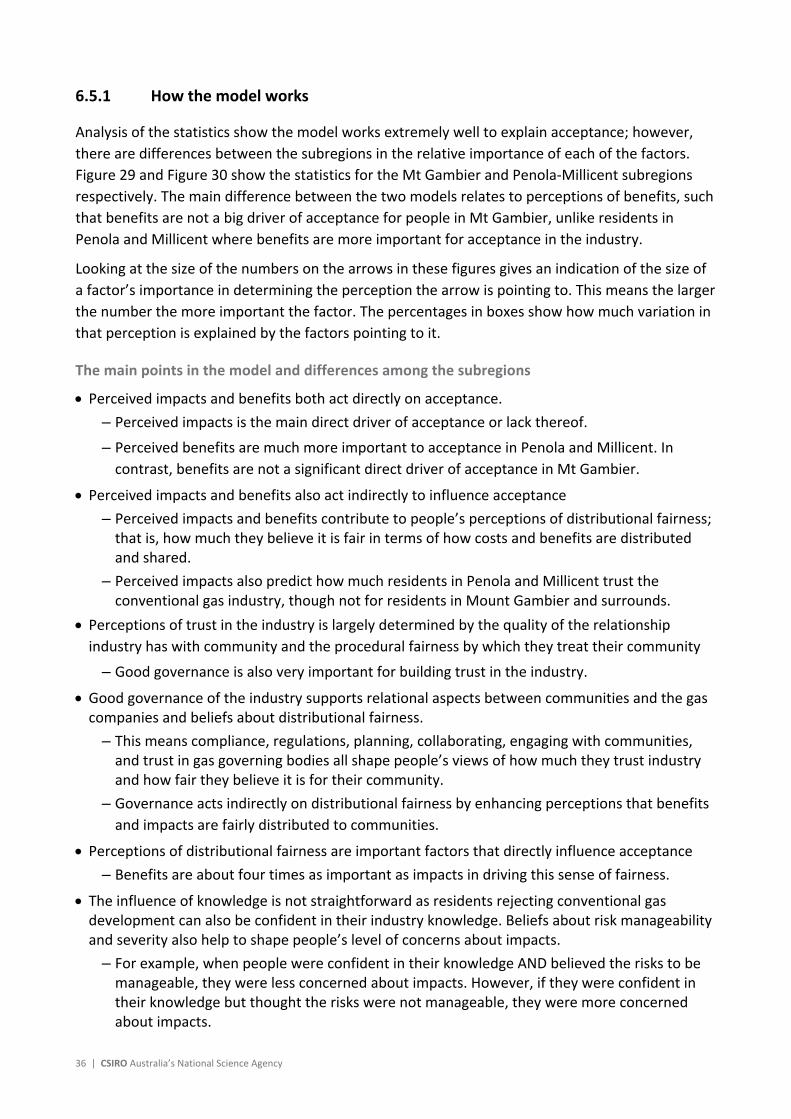
36 | CSIRO Australia’s National Science Agency
6.5.1 How the model works
Analysis of the statistics show the model works extremely well to explain acceptance; however,
there are differences between the subregions in the relative importance of each of the factors.
Figure 29 and Figure 30 show the statistics for the Mt Gambier and Penola‐Millicent subregions
respectively. The main difference between the two models relates to perceptions of benefits, such
that benefits are not a big driver of acceptance for people in Mt Gambier, unlike residents in
Penola and Millicent where benefits are more important for acceptance in the industry.
Looking at the size of the numbers on the arrows in these figures gives an indication of the size of
a factor’s importance in determining the perception the arrow is pointing to. This means the larger
the number the more important the factor. The percentages in boxes show how much variation in
that perception is explained by the factors pointing to it.
The main points in the model and differences among the subregions
Perceived impacts and benefits both act directly on acceptance.
– Perceived impacts is the main direct driver of acceptance or lack thereof.
– Perceived benefits are much more important to acceptance in Penola and Millicent. In
contrast, benefits are not a significant direct driver of acceptance in Mt Gambier.
Perceived impacts and benefits also act indirectly to influence acceptance
– Perceived impacts and benefits contribute to people’s perceptions of distributional fairness; that is, how much they believe it is fair in terms of how costs and benefits are distributed and shared.
– Perceived impacts also predict how much residents in Penola and Millicent trust the conventional gas industry, though not for residents in Mount Gambier and surrounds.
Perceptions of trust in the industry is largely determined by the quality of the relationship
industry has with community and the procedural fairness by which they treat their community
– Good governance is also very important for building trust in the industry.
Good governance of the industry supports relational aspects between communities and the gas companies and beliefs about distributional fairness.
– This means compliance, regulations, planning, collaborating, engaging with communities, and trust in gas governing bodies all shape people’s views of how much they trust industry and how fair they believe it is for their community.
– Governance acts indirectly on distributional fairness by enhancing perceptions that benefits and impacts are fairly distributed to communities.
Perceptions of distributional fairness are important factors that directly influence acceptance
– Benefits are about four times as important as impacts in driving this sense of fairness.
The influence of knowledge is not straightforward as residents rejecting conventional gas development can also be confident in their industry knowledge. Beliefs about risk manageability and severity also help to shape people’s level of concerns about impacts.
– For example, when people were confident in their knowledge AND believed the risks to be manageable, they were less concerned about impacts. However, if they were confident in their knowledge but thought the risks were not manageable, they were more concerned about impacts.

Community wellbeing and local attitudes to conventional gas development in the South‐East of South Australia | 37
Figure 29 Model of social acceptance: Mount Gambier and surrounds
Figure 30 Model of social acceptance: Penola and surrounds and Millicent and surrounds combined

38 | CSIRO Australia’s National Science Agency
7 Deeper dive into the underlying drivers of social acceptance
7.1 Possible industry effects: Concerns and benefits
7.1.1 Perceived impacts
The greatest concerns about possible negative effects of conventional gas development in the SE
of South Australia related to possible future issues such as fracking being introduced after the
moratorium, unconventional gas development being introduced over time, and maintaining the
integrity of gas wells over time from possible gas leaks. Concerns for some more immediate issues
were moderately high with concern about community division over gas development, damage to
underground aquifers, and a threat to the region’s clean and green brand raising most concern. In
contrast, concerns related to dust, noise and light pollution, increased traffic on roads, and threat
to regional tourism were of least concern, and not of concern to residents on average.
Figure 31 shows that these concerns were similar across the three subregions, with concerns
about possible health impacts the only concern statistically different between subregions. Penola
residents indicated statistically lower levels of concern for health impacts than residents from Mt
Gambier and Millicent.

Community wellbeing and local attitudes to conventional gas development in the South‐East of South Australia | 39
Figure 31 Perceived impacts about conventional gas development in the lower SE of SA: By subregion, 2019
1 2 3 4 5
Dust, noise, and light pollution
Increased traffic on the roads
A threat to regional tourism
Air contamination
Reduces the regions visual attractiveness
Health impacts*
Threat to rural liveability
Impact on farm property values
Depletion of underground water
A threat to clean and green brand for regional agriculture
Damage to the underground aquifers
Community division over gas development
OVERALL, how much of a concern, do you believe, comes withconventional gas development in the region
Conventional gas development extending into other farmingareas in the South East*
Integrity of gas wells over time (e.g. leaks)
Unconventional gas development being introduced over time(e.g., tight or shale gas)*
Fracking being introduced after the moratorium
OVERALL, how much of a concern, do you believe, there maybe in the future with gas development
Perceptions of possible impacts
Mt Gambier and surrounds Penola and surrounds Millicent and surrounds
Note: 1 = not at all concerned and 5 = very concerned* significant difference between subregions
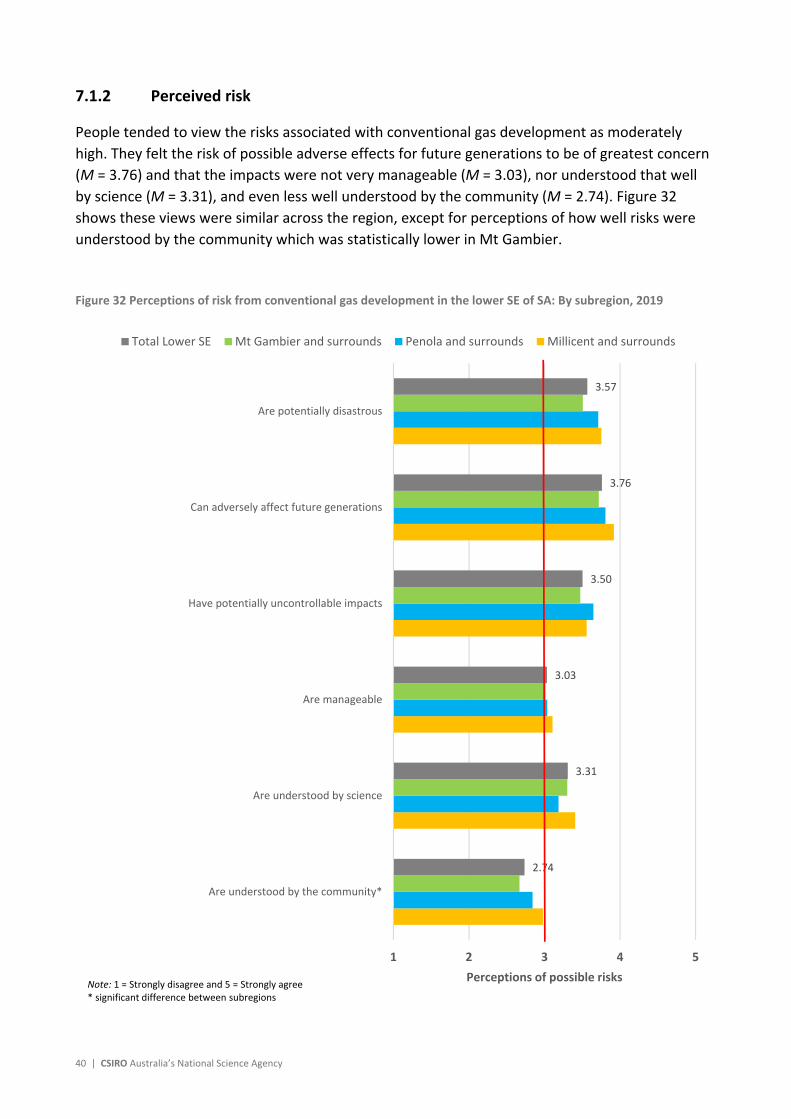
40 | CSIRO Australia’s National Science Agency
7.1.2 Perceived risk
People tended to view the risks associated with conventional gas development as moderately
high. They felt the risk of possible adverse effects for future generations to be of greatest concern
(M = 3.76) and that the impacts were not very manageable (M = 3.03), nor understood that well
by science (M = 3.31), and even less well understood by the community (M = 2.74). Figure 32
shows these views were similar across the region, except for perceptions of how well risks were
understood by the community which was statistically lower in Mt Gambier.
Figure 32 Perceptions of risk from conventional gas development in the lower SE of SA: By subregion, 2019
2.74
3.31
3.03
3.50
3.76
3.57
1 2 3 4 5
Are understood by the community*
Are understood by science
Are manageable
Have potentially uncontrollable impacts
Can adversely affect future generations
Are potentially disastrous
Perceptions of possible risks
Total Lower SE Mt Gambier and surrounds Penola and surrounds Millicent and surrounds
Note: 1 = Strongly disagree and 5 = Strongly agree* significant difference between subregions
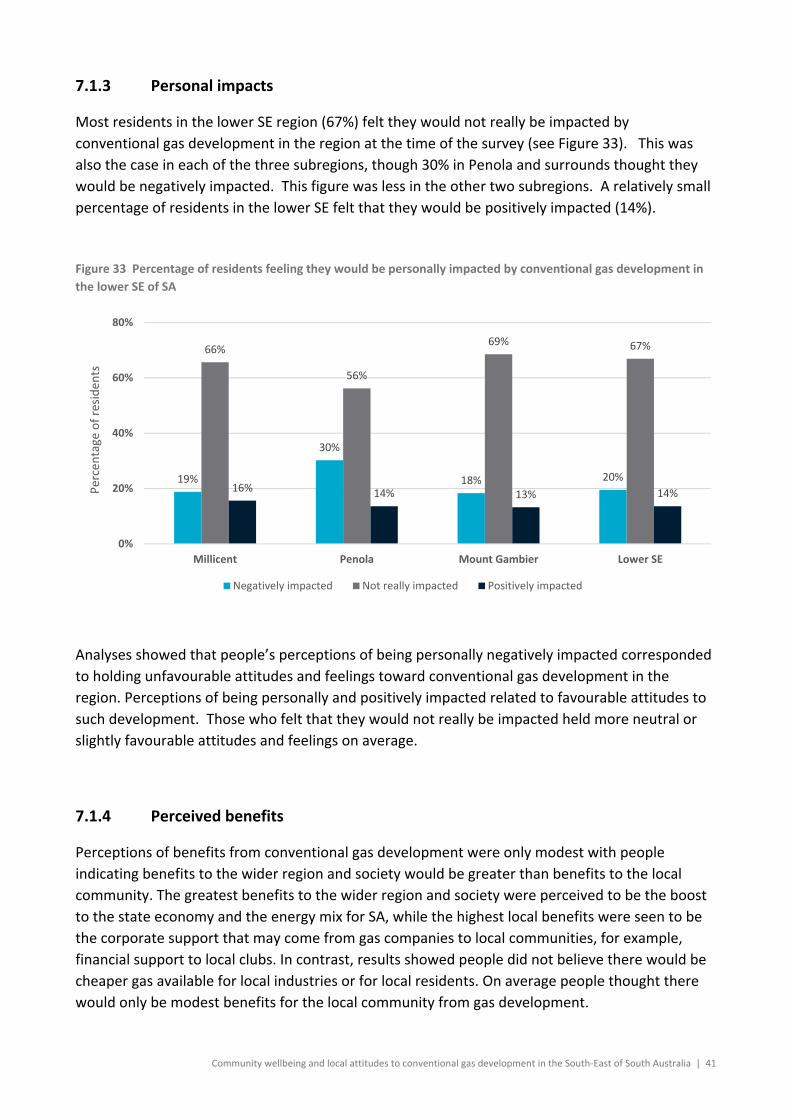
Community wellbeing and local attitudes to conventional gas development in the South‐East of South Australia | 41
7.1.3 Personal impacts
Most residents in the lower SE region (67%) felt they would not really be impacted by
conventional gas development in the region at the time of the survey (see Figure 33). This was
also the case in each of the three subregions, though 30% in Penola and surrounds thought they
would be negatively impacted. This figure was less in the other two subregions. A relatively small
percentage of residents in the lower SE felt that they would be positively impacted (14%).
Figure 33 Percentage of residents feeling they would be personally impacted by conventional gas development in
the lower SE of SA
Analyses showed that people’s perceptions of being personally negatively impacted corresponded
to holding unfavourable attitudes and feelings toward conventional gas development in the
region. Perceptions of being personally and positively impacted related to favourable attitudes to
such development. Those who felt that they would not really be impacted held more neutral or
slightly favourable attitudes and feelings on average.
7.1.4 Perceived benefits
Perceptions of benefits from conventional gas development were only modest with people
indicating benefits to the wider region and society would be greater than benefits to the local
community. The greatest benefits to the wider region and society were perceived to be the boost
to the state economy and the energy mix for SA, while the highest local benefits were seen to be
the corporate support that may come from gas companies to local communities, for example,
financial support to local clubs. In contrast, results showed people did not believe there would be
cheaper gas available for local industries or for local residents. On average people thought there
would only be modest benefits for the local community from gas development.
19%
30%
18% 20%
66%
56%
69% 67%
16% 14% 13% 14%
0%
20%
40%
60%
80%
Millicent Penola Mount Gambier Lower SE
Percentage of residen
ts
Negatively impacted Not really impacted Positively impacted
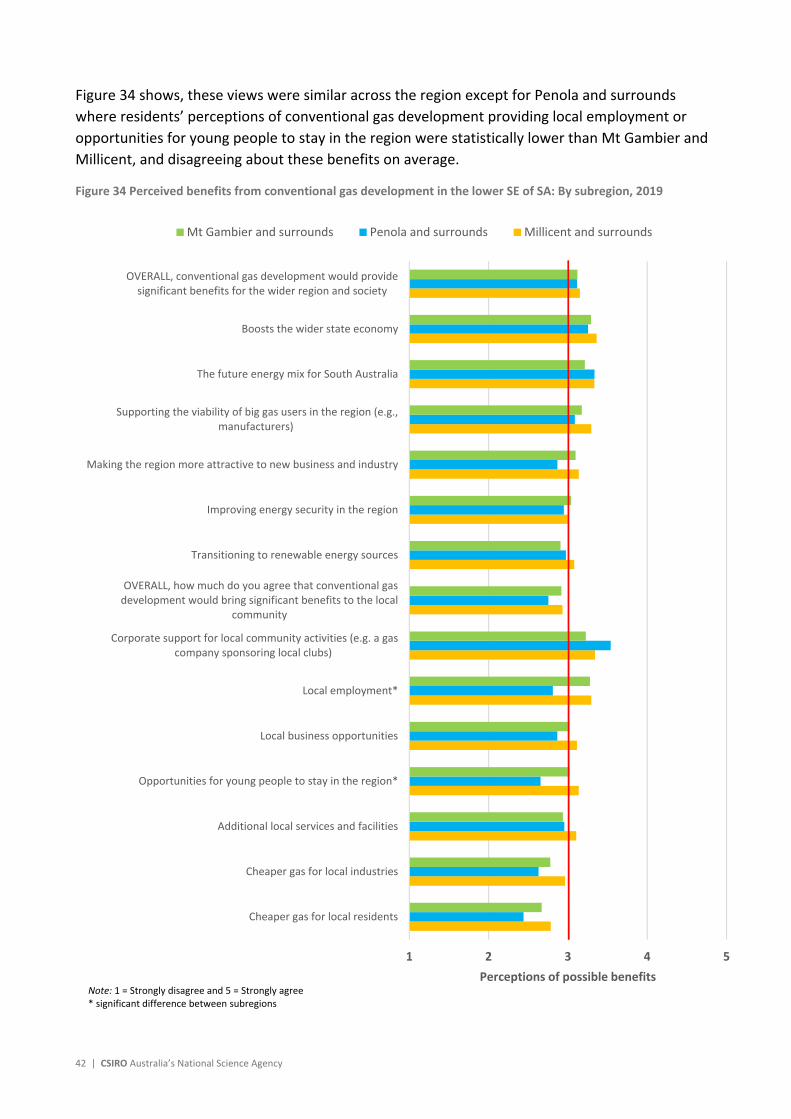
42 | CSIRO Australia’s National Science Agency
Figure 34 shows, these views were similar across the region except for Penola and surrounds
where residents’ perceptions of conventional gas development providing local employment or
opportunities for young people to stay in the region were statistically lower than Mt Gambier and
Millicent, and disagreeing about these benefits on average.
Figure 34 Perceived benefits from conventional gas development in the lower SE of SA: By subregion, 2019
1 2 3 4 5
Cheaper gas for local residents
Cheaper gas for local industries
Additional local services and facilities
Opportunities for young people to stay in the region*
Local business opportunities
Local employment*
Corporate support for local community activities (e.g. a gascompany sponsoring local clubs)
OVERALL, how much do you agree that conventional gasdevelopment would bring significant benefits to the local
community
Transitioning to renewable energy sources
Improving energy security in the region
Making the region more attractive to new business and industry
Supporting the viability of big gas users in the region (e.g.,manufacturers)
The future energy mix for South Australia
Boosts the wider state economy
OVERALL, conventional gas development would providesignificant benefits for the wider region and society
Perceptions of possible benefits
Mt Gambier and surrounds Penola and surrounds Millicent and surrounds
Note: 1 = Strongly disagree and 5 = Strongly agree* significant difference between subregions
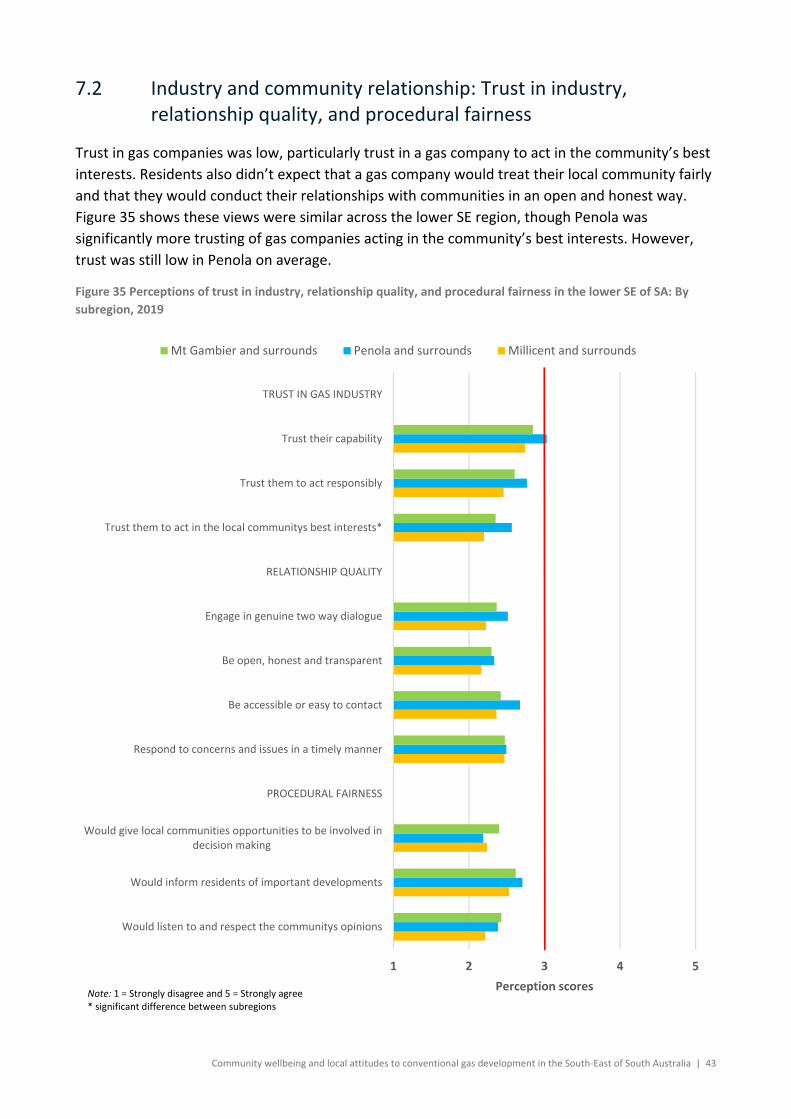
Community wellbeing and local attitudes to conventional gas development in the South‐East of South Australia | 43
7.2 Industry and community relationship: Trust in industry, relationship quality, and procedural fairness
Trust in gas companies was low, particularly trust in a gas company to act in the community’s best
interests. Residents also didn’t expect that a gas company would treat their local community fairly
and that they would conduct their relationships with communities in an open and honest way.
Figure 35 shows these views were similar across the lower SE region, though Penola was
significantly more trusting of gas companies acting in the community’s best interests. However,
trust was still low in Penola on average.
Figure 35 Perceptions of trust in industry, relationship quality, and procedural fairness in the lower SE of SA: By
subregion, 2019
1 2 3 4 5
Would listen to and respect the communitys opinions
Would inform residents of important developments
Would give local communities opportunities to be involved indecision making
PROCEDURAL FAIRNESS
Respond to concerns and issues in a timely manner
Be accessible or easy to contact
Be open, honest and transparent
Engage in genuine two way dialogue
RELATIONSHIP QUALITY
Trust them to act in the local communitys best interests*
Trust them to act responsibly
Trust their capability
TRUST IN GAS INDUSTRY
Perception scores
Mt Gambier and surrounds Penola and surrounds Millicent and surrounds
Note: 1 = Strongly disagree and 5 = Strongly agree* significant difference between subregions

44 | CSIRO Australia’s National Science Agency
7.3 Governance: Trust in government, regulations, engaging and working with the community
Figure 36 shows that perceptions of government authorities, such as the EPA, to hold gas
companies to account were modest and that confidence in legislation and trust levels in state
departments were low. The highest levels of confidence were in the EPA to listen and respond to
community concerns and the local council to listen and advocate for the local community. These
perceptions were similar across the lower SE region.
Figure 36 Perceptions of formal governance, informal governance, and trust in government: By subregion, 2019
1 2 3 4 5
Trust them to act in the local communitys best interests
Trust them to act responsibly
Trust their capability
TRUST IN STATE DEPARTMENTS
Work together to address problems with conventional gasdevelopment
Work together to maximise benefits associated with gasdevelopment
Work together to share information, resources, and learnings
Work together to proactively plan for future changes
The region together would manage any changes effectively
WORKING COLLABORATIVELY:[Government, communities, gas companies working together]
The local council would listen to and advocate for localcommunities on issues about gas development
The EPA would inform the local community of any issues withgas development as they arise
The EPA would listen to and respond to any communityconcerns
State government would listen to and respond to anycommunity concerns
ENGAGING COMMUNITIES
Legislation and regulation could be counted upon to ensurethat companies did the right thing
The Environment Protection Authority (EPA) would be able tohold companies accountable for any breaches
FORMAL GOVERNANCE
Perception scores
Mt Gambier and surrounds Penola and surrounds Millicent and surrounds
Note: 1 = Strongly disagree and 5 = Strongly agree* significant difference between subregions
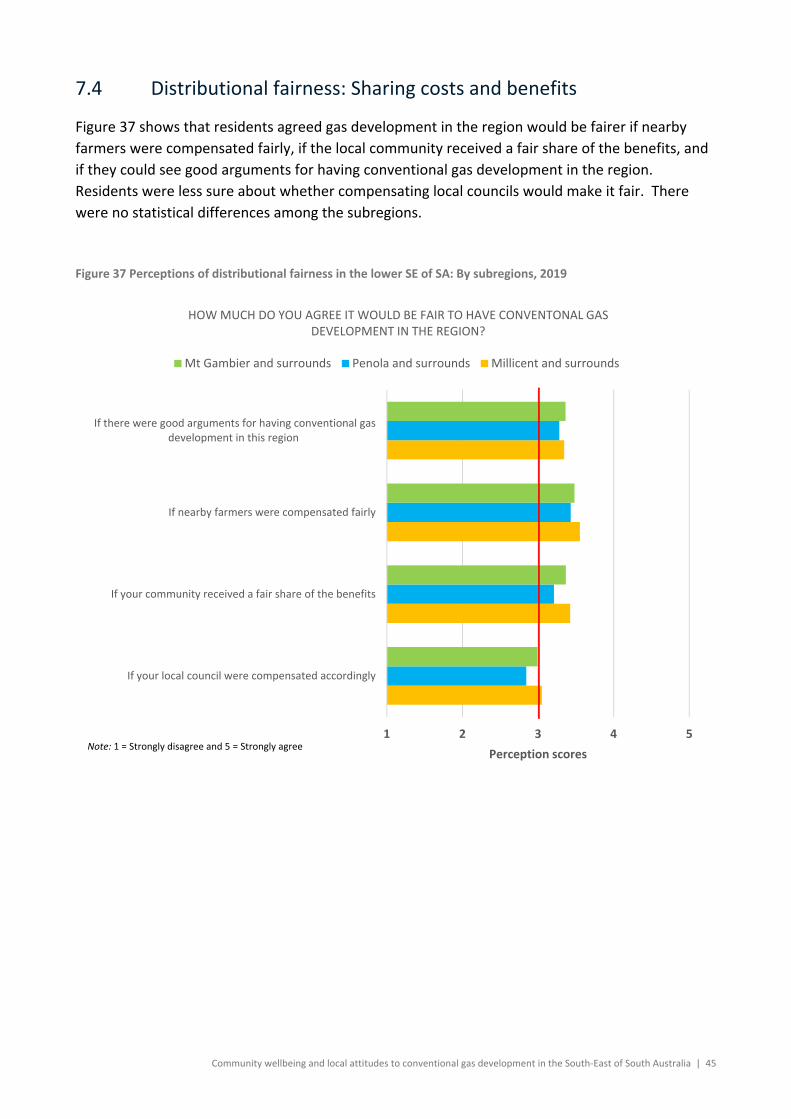
Community wellbeing and local attitudes to conventional gas development in the South‐East of South Australia | 45
7.4 Distributional fairness: Sharing costs and benefits
Figure 37 shows that residents agreed gas development in the region would be fairer if nearby
farmers were compensated fairly, if the local community received a fair share of the benefits, and
if they could see good arguments for having conventional gas development in the region.
Residents were less sure about whether compensating local councils would make it fair. There
were no statistical differences among the subregions.
Figure 37 Perceptions of distributional fairness in the lower SE of SA: By subregions, 2019
1 2 3 4 5
If your local council were compensated accordingly
If your community received a fair share of the benefits
If nearby farmers were compensated fairly
If there were good arguments for having conventional gasdevelopment in this region
Perception scores
HOW MUCH DO YOU AGREE IT WOULD BE FAIR TO HAVE CONVENTONAL GAS DEVELOPMENT IN THE REGION?
Mt Gambier and surrounds Penola and surrounds Millicent and surrounds
Note: 1 = Strongly disagree and 5 = Strongly agree

46 | CSIRO Australia’s National Science Agency
7.5 Knowledge and information
7.5.1 Knowledge confidence and awareness
Knowledge confidence and awareness was modest across the lower SE region, though statistically
lower in Mt Gambier and Millicent subregions compared to Penola. People indicated they had low
levels of confidence in how much they knew about the conventional gas industry and how it
differs from unconventional gas such as shale and coal seam gas. Apart from Penola and
surrounds, residents also had low levels of awareness and understanding of issues related to
conventional gas extraction. For example, people on average were not aware that a handful of
conventional gas wells can produce large volumes of gas that would be sufficient for the SE region,
nor were they aware that a relatively small amount of water is used in conventional gas compared
to unconventional gas. However, there was modest awareness about the lack of hydraulic
fracturing in conventional gas extraction and good awareness regarding the ten‐year hydraulic
fracturing ban in the SE. Figure 38 shows that knowledge and awareness was statistically higher in
Penola and surrounds compared to Mt Gambier and Millicent.
Figure 38 Knowledge confidence and awareness levels about conventional gas in the lower SE of SA: By subregion,
2019
1 2 3 4 5
Overall, how aware are you about conventional gasdevelopment in the south east*
_ Hydraulic fracturing (fracking) was banned in the south eastfor 10 years in late 2018*
_Hydraulic fracturing is not needed to extract conventional gasin the south east*
_A relatively small amount of water is used for thedevelopment of conventional gas resources when compared to
shale gas*
_A handful of conventional wells can produce large volumes ofgas (e.g., sufficient for the south east region)*
HOW AWARE ARE YOU THAT …
Knowledge confidence ‐ How much do you feel you understandabout the differences between conventional and
unconventional gas*
Knowledge confidence ‐ How much do you feel you know aboutconventional gas industry*
Perception scores
Mt Gambier and surrounds Penola and surrounds Millicent and surrounds
Note: For awareness questions 1 = Not at all aware and 5 = Very awareFor knowledge confidence questions 1 = Not much at all and 5 = Know a lot* significant difference between subregions
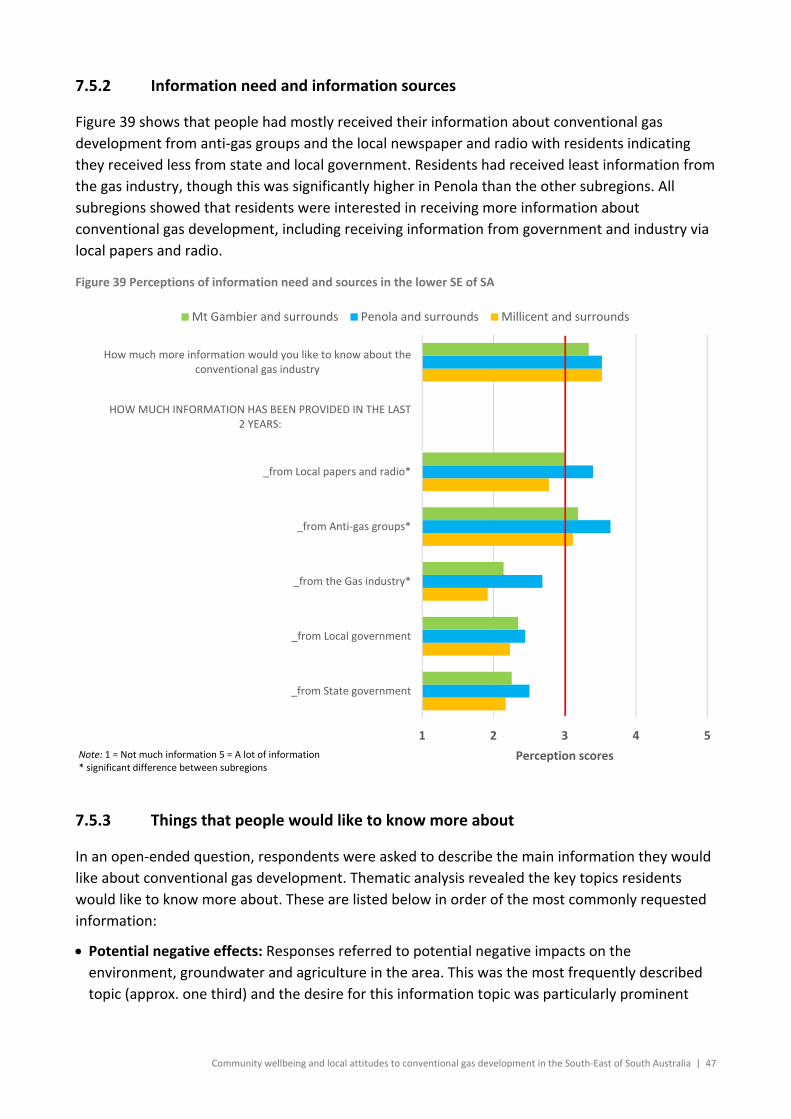
Community wellbeing and local attitudes to conventional gas development in the South‐East of South Australia | 47
7.5.2 Information need and information sources
Figure 39 shows that people had mostly received their information about conventional gas
development from anti‐gas groups and the local newspaper and radio with residents indicating
they received less from state and local government. Residents had received least information from
the gas industry, though this was significantly higher in Penola than the other subregions. All
subregions showed that residents were interested in receiving more information about
conventional gas development, including receiving information from government and industry via
local papers and radio.
Figure 39 Perceptions of information need and sources in the lower SE of SA
7.5.3 Things that people would like to know more about
In an open‐ended question, respondents were asked to describe the main information they would
like about conventional gas development. Thematic analysis revealed the key topics residents
would like to know more about. These are listed below in order of the most commonly requested
information:
Potential negative effects: Responses referred to potential negative impacts on the
environment, groundwater and agriculture in the area. This was the most frequently described
topic (approx. one third) and the desire for this information topic was particularly prominent
1 2 3 4 5
_from State government
_from Local government
_from the Gas industry*
_from Anti‐gas groups*
_from Local papers and radio*
HOW MUCH INFORMATION HAS BEEN PROVIDED IN THE LAST2 YEARS:
How much more information would you like to know about theconventional gas industry
Perception scores
Mt Gambier and surrounds Penola and surrounds Millicent and surrounds
Note: 1 = Not much information 5 = A lot of information* significant difference between subregions
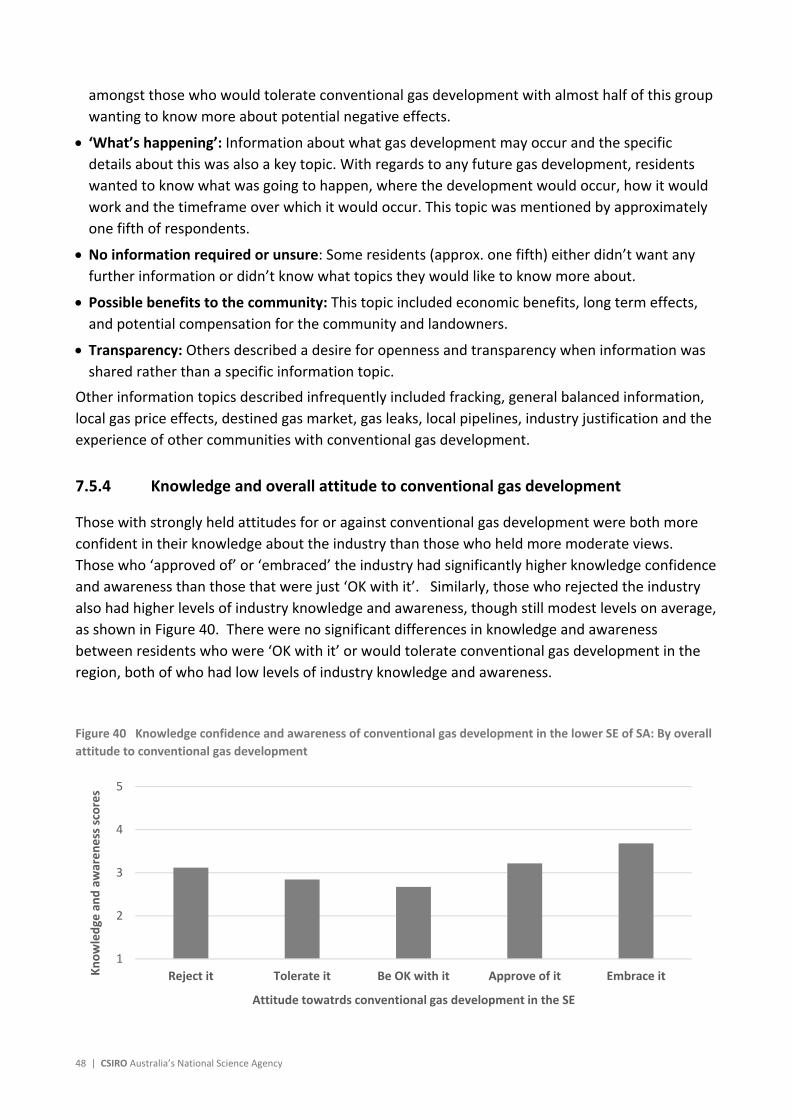
48 | CSIRO Australia’s National Science Agency
amongst those who would tolerate conventional gas development with almost half of this group
wanting to know more about potential negative effects.
‘What’s happening’: Information about what gas development may occur and the specific
details about this was also a key topic. With regards to any future gas development, residents
wanted to know what was going to happen, where the development would occur, how it would
work and the timeframe over which it would occur. This topic was mentioned by approximately
one fifth of respondents.
No information required or unsure: Some residents (approx. one fifth) either didn’t want any
further information or didn’t know what topics they would like to know more about.
Possible benefits to the community: This topic included economic benefits, long term effects,
and potential compensation for the community and landowners.
Transparency: Others described a desire for openness and transparency when information was
shared rather than a specific information topic.
Other information topics described infrequently included fracking, general balanced information,
local gas price effects, destined gas market, gas leaks, local pipelines, industry justification and the
experience of other communities with conventional gas development.
7.5.4 Knowledge and overall attitude to conventional gas development
Those with strongly held attitudes for or against conventional gas development were both more
confident in their knowledge about the industry than those who held more moderate views.
Those who ‘approved of’ or ‘embraced’ the industry had significantly higher knowledge confidence
and awareness than those that were just ‘OK with it’. Similarly, those who rejected the industry
also had higher levels of industry knowledge and awareness, though still modest levels on average,
as shown in Figure 40. There were no significant differences in knowledge and awareness
between residents who were ‘OK with it’ or would tolerate conventional gas development in the
region, both of who had low levels of industry knowledge and awareness.
Figure 40 Knowledge confidence and awareness of conventional gas development in the lower SE of SA: By overall
attitude to conventional gas development
1
2
3
4
5
Reject it Tolerate it Be OK with it Approve of it Embrace itKnowledge
and awareness scores
Attitude towatrds conventional gas development in the SE

Community wellbeing and local attitudes to conventional gas development in the South‐East of South Australia | 49

50 | CSIRO Australia’s National Science Agency
8 Demographic differences
The data was analysed to identify differences in findings based on demographic characteristics.
Differences in perceptions of community wellbeing and local attitudes and perceptions of
conventional gas development based on age, gender, and income levels were identified and are
reported in this section. Differences based on whether participants lived in a town or out‐of‐town
are also described. Differences based on subregions and farm ownership are reported in the main
part of the report. All demographic and locational differences are also summarised in tables in
Appendix E .
AGE
There were no significant differences between age categories for key overall community wellbeing
and overall attitudes and feelings towards conventional gas development. However, older
residents (55+ years) did have significantly higher place attachment and expectations about future
community wellbeing than younger residents (less than 35 years).
There were also some significant differences for several other dimensions underlying overall
community wellbeing and attitudes toward conventional gas. Older residents (55+ years) in the
lower SE rated their health, and services and facilities significantly higher than both younger age
groups. Compared to young people they also had higher ratings for personal safety, town
appearance, environmental quality, and local decision‐making and trust. However, their
community participation was rated significantly lower than middle aged residents. With regards to
conventional gas development, older residents perceived impacts to be greater and had lower
trust in governing bodies than middle aged residents, and higher knowledge confidence than
young people.
GENDER
Women in the lower SE were found to feel significantly less safe than males. They also had
significantly lower perceptions of services and facilities, environmental quality, and economic
opportunities. Social interaction, however, was significantly higher for women and there was no
difference in overall community wellbeing.
Community attitudes and feelings toward conventional gas were significantly different between
men and women, with women unfavourable towards the industry on average while men were
favourable on average. Women perceived the impacts of conventional gas to be greater, while
having lower perceptions of distributional fairness, and trust in gas companies, and lower
confidence in their knowledge.
Community wellbeing and local attitudes to conventional gas development in the South‐East of South Australia | 51
INCOME
Overall community wellbeing was rated significantly higher by residents with household incomes
over $80,000 p.a. These residents also perceived significantly higher income sufficiency, health,
economic opportunities, community participation, and social interaction than lower income
residents.
With regards to community attitudes and feelings towards conventional gas, those in the highest
household income bracket ($120,000 or more) were found to be significantly more favourable
towards its development than those in lower household‐income brackets. They were significantly
less concerned about perceived impacts and risk severity, and had higher ratings for perceptions
of risk manageability. This group was also more satisfied with informal governance compared to
the those with household incomes between $80,000 and $120,000. Those in the highest income
bracket ($120,00 or more) also had the greatest confidence in their knowledge and greatest desire
for more information.
LIVING IN‐TOWN AND OUT‐OF‐TOWN
Comparing residents living in‐town and out‐of‐town revealed significant differences for several
dimensions of community wellbeing. Those living in‐town were less satisfied with personal safety,
health and environmental quality, while being more satisfied with town appearance and social
interaction. Living in‐town or out‐of‐town didn’t have a significant bearing on attitudes toward
conventional gas development. This was the case with farm owners, who mostly live out‐of‐town.
However, as reported earlier, farmers did have significantly more knowledge about the industry
than non‐farm owners.

52 | CSIRO Australia’s National Science Agency
9 Conclusions and implications
9.1 Community wellbeing
9.1.1 Community wellbeing was very high across the lower SE region, particularly in Penola and surrounds
Community wellbeing was highest in Penola, where economic opportunities were viewed
considerably more favourably than the other subregions. However, community wellbeing was
very high across all subregions. The relatively lower ratings regarding the suitability of the local
community for teenagers (compared to suitability for seniors and children) is common in regional
areas, though they were still favourable in the lower SE.
Even though there were no real differences between people who live in town and those who live
out‐of‐town, those who own a farm indicated higher levels of community wellbeing and place
attachment. Farm owners also felt there was greater economic opportunities within their
communities than those who didn’t own a farm.
9.1.2 All subregions felt that community wellbeing would continue to be high.
All three subregions expected future community being to be high, though there was a higher
percentage of residents in Millicent who thought it may decline over the next three years, perhaps
due to concerns about economic opportunities, which were perceived to be significantly lower in
this subregion. For example, Millicent have experienced ongoing job losses related to downsizing
the Kimberly Clarke workforce, which is potentially contributing to people’s lack of confidence
about the economic future of Millicent.
9.1.3 The main drivers of community wellbeing across the region varied considerably among the subregions.
The most important dimensions of community wellbeing across the lower SE region were: services
and facilities, the quality of the environment, perceptions of personal safety, income sufficiency,
and perceptions of community trust. These can be considered as the dimensions that contribute
the most to a sense of wellbeing in the community in the lower SE region. However, there was
considerable variation among the subregions suggesting that initiatives for improving or
maintaining wellbeing within each of the subregions needs to be very place‐based, responding to
the aspects of community life that each subregion views as important.
Services and facilities were a particularly important drivers of community wellbeing for Penola and
surrounds, and community spirit was more important for enhancing community wellbeing in the
more rural subregions of Penola and Millicent compared to Mt Gambier. In contrast, having
sufficient income was more important for Mount Gambier for a sense of community wellbeing.
Income sufficiency was also important for Millicent but less so in Penola. The perceived
Community wellbeing and local attitudes to conventional gas development in the South‐East of South Australia | 53
importance of each dimension in combination with how favourably it is currently rated by local
residents helps decision makers to prioritise scarce resources for improving or maintaining
community wellbeing.
9.2 Attitudes and perceptions of conventional gas development in the SE of South Australia
9.2.1 Across the lower SE region, there were a range of views towards conventional gas development with most people indicating they would tolerate or be OK with conventional gas development in the region
Perceptions differed among the subregions with Penola tending to be more polarised than Mt
Gambier and Millicent in their views. This means that fewer people in Penola held a middle‐
ground view about gas development. This was found among both farm owners and non‐farm
owners in Penola and surrounds.
Two‐thirds of residents in the lower SE region didn’t think that they would be personally impacted
by conventional gas development, either positively or negatively. However, approximately 30% of
residents in Penola and surrounds felt they would be personally and negatively impacted.
Interestingly, residents in the lower SE perceived others in their local communities to be less
accepting of conventional gas development than they themselves were (on average). This
highlights the importance of representative surveys in capturing a more accurate understanding of
what a region thinks about conventional gas development.
9.2.2 Attitudes and perceptions differed based on gender and income and need to be factored into communication and engagement planning
Men were more positive about conventional gas development. Women were more concerned
about impacts, less trusting of gas companies, and viewed the risks associated with gas as less able
to be managed. They also reported less confidence in their knowledge about gas. Moreover,
women were negative on average in their attitudes while men were positive on average in their
attitudes. This gender difference is not uncommon in relation to the resources sector (Measham &
Zhang, 2019).
Those with higher incomes were also more positive about conventional gas. They had lower
concerns and lower perceptions of risk severity, as well as more confidence in their knowledge
about conventional gas development.
This suggests that when engaging with the community it is important for gas companies and
government to ensure there is diversity in the representation from communities. For example,
issues and problems raised by men may differ from how they are perceived by women. Similarly,
ensuring that a diversity of income levels are included in engagement when understanding
community expectations and concerns is also important. Thus, even though gas companies and
governments may plan their communications and engagement around segments of stakeholders
such as farmers, the business community, and local council, it is also important to ensure there is
54 | CSIRO Australia’s National Science Agency
diversity within these segments in terms of socioeconomic characteristics such as gender and
income.
9.2.3 Knowledge and understanding of the industry shaped people’s concerns about impacts and risk manageability, which in turn influenced acceptance
Residents in the lower SE did not believe on average that the risks associated with conventional
gas development were at this stage manageable, and most residents wanted to know more
information about conventional gas development in the region. However, it is important that
information addresses the issues that people care about so that they can assess what conventional
gas development would mean for them and their community. When providing information,
residents find local papers and radio the most popular sources of information about local
conventional gas development.
Those with more moderate views about conventional gas development were less confident in
their knowledge of the industry, while those with strong view either for or against gas
development were more confident in their existing industry knowledge. This suggests there is
opportunity to present new information to residents with more moderate attitudes to
conventional gas development in the SE region.
9.2.4 People were more concerned about possible long‐term future issues of conventional gas development than they were about more immediate impacts
The most concerning issues were fracking being introduced after the moratorium and
unconventional gas development being introduced over time, both issues of higher concern than
possible impacts to water. This suggests that many residents feel that conventional gas
development may be a ‘foot in the door’ for a transition to unconventional gas development over
the long‐term horizon. This may also reflect relative low levels of trust in the gas industry and
state government. Together these dampen acceptance for conventional gas development in the
lower SE region.
9.2.5 Conveying the benefits of a conventional gas industry beyond providing direct local jobs is important
Local communities did not perceive the benefits of conventional gas development to be high. This
applies to both local and wider benefits that the industry may bring to the region or to society. Yet
perceptions of benefits were important drivers of acceptance particularly for people in Penola and
Millicent subregions.
Understanding the extent of possible benefits and how benefits from the conventional gas
industry would be distributed to the region would be useful to residents. Communicating the
broader societal benefits on conventional gas and the role it has to play in the state’s energy mix
would also help residents who are tolerating the idea of conventional gas to be more positive
about its development in the region.
Economic issues are important to the wellbeing of these community’s and currently rated
unfavourably. Understanding how benefits can indirectly flow to the region through maintaining
Community wellbeing and local attitudes to conventional gas development in the South‐East of South Australia | 55
viability of big gas users or attracting new manufacturing plants to the region because of a more
secure gas supply would resonate with local residents, particularly around Mt Gambier and
Millicent where economic outlooks are less than positive. At this stage, people are not convinced
that conventional gas development would result in cheaper or more reliable gas nor that it would
necessarily be of benefit to large gas users.
It is also important to be accurate in communicating potential benefits as overselling benefits can
undermine trust in industry and government. Incorrect forecasting can likewise facilitate poor
decision making for local businesses who may overinvest and plan for business conditions that
don’t eventuate, if benefits are overstated.
9.2.6 Addressing people’s fears of wide‐spread future gas development is important for people to feel more positive about conventional gas
The scale of any future conventional gas development would be important to outline to residents,
including possible scenarios or ways that the industry may unfold in the region. This would help
address some people’s concerns about gas development expanding into large numbers of wells in
the future. This is particularly pertinent when people indicated in the survey they have low levels
of understanding regarding the differences between conventional and unconventional gas
development and potentially imagine a future of hundreds of wells typical of unconventional gas
extraction that they see in Queensland. Presenting likely numbers of and areas for wells would
make the imaginings of a future conventional gas industry for the SE region more tangible and
potentially less concerning for many people.
9.2.7 Good governance is key to shaping trust in the conventional gas industry
Good governance can improve relationships between the community, state government
departments and agencies, and the gas industry, as well as mitigating impacts and improving
benefits. Along with implementing good governance processes and being genuinely open to
community input, communicating to local residents how governance processes will be undertaken
and how communities can have a say and be involved is important. Research has shown that
communicating early with this type of information can have wide ranging and beneficial effects
including improving community perceptions of impacts, benefits, distributional fairness, and the
conventional gas sector more generally (Zhang, Measham, and Moffat, 2018).
9.2.8 Distributional fairness was important to acceptance, and benefits were much larger drivers of this sense of fairness than impacts
This means when people weigh up the pros and cons to decide how fair it is to have conventional
gas development in the region, benefits are key to this evaluation. While a sense of distributional
fairness is related to perceived impacts and benefits, it is also important in its own right for
enhancing social acceptance of conventional gas development in the lower SE region. Since
perceived benefits are the main driver of a sense of distributional fairness, any infrastructure,
services and facilities funding by the Royalties for Regions program would be a good vehicle for
enhancing a sense of distributional fairness in the region, particularly if royalties associated with
the conventional gas industry could be identified.

56 | CSIRO Australia’s National Science Agency
However, it is still important to note that perceived impacts are the main direct driver of social
acceptance or lack thereof. Concerns about conventional gas development in the region still need
to be alleviated, including addressing people’s concerns about possible risks and how risks could
be effectively managed.
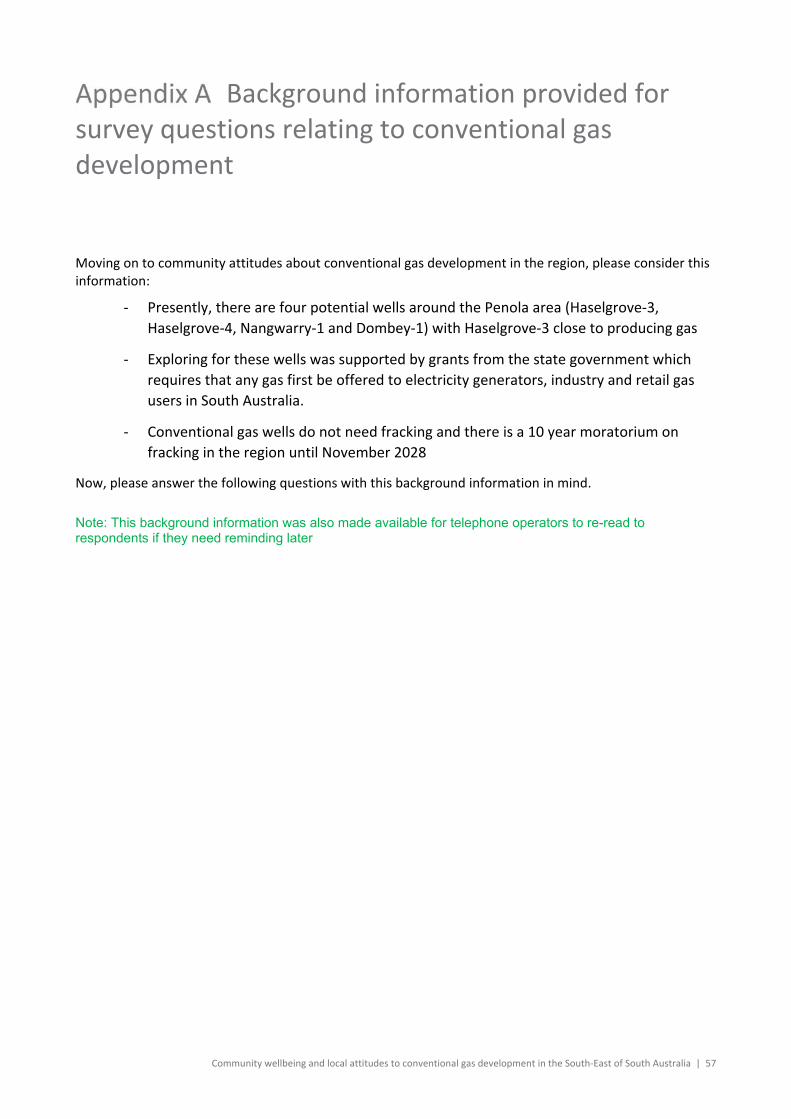
Community wellbeing and local attitudes to conventional gas development in the South‐East of South Australia | 57
Background information provided for survey questions relating to conventional gas development
Moving on to community attitudes about conventional gas development in the region, please consider this information:
‐ Presently, there are four potential wells around the Penola area (Haselgrove‐3,
Haselgrove‐4, Nangwarry‐1 and Dombey‐1) with Haselgrove‐3 close to producing gas
‐ Exploring for these wells was supported by grants from the state government which
requires that any gas first be offered to electricity generators, industry and retail gas
users in South Australia.
‐ Conventional gas wells do not need fracking and there is a 10 year moratorium on
fracking in the region until November 2028
Now, please answer the following questions with this background information in mind.
Note: This background information was also made available for telephone operators to re-read to respondents if they need reminding later

58 | CSIRO Australia’s National Science Agency
Measures and reliability of scales
Separate scales were developed for the various measures associated with community wellbeing
and perceptions of onshore conventional gas development, and the sector, by averaging the items
within the respective scale. All multi‐item measures were tested for ‘internal consistency’ or
reliability. As shown in Table 8, the reliability of all multi‐item measures (scales) usually exceeded
.80. Reliability over .90 is considered very good, over .80 is considered good, and .70 considered
adequate for scale development.
Table 8 Measures and reliability of scales used in survey
Measures of community wellbeing
No. of items
Scale type / reliability1
Survey items
Personal safety 3 Agreement . 0.76
It is safe to be alone at home during the night; to walk alone outside at night; overall feel safe living in the area
Income sufficiency 3 Agreement .92
Your income is enough for household expenses; for the lifestyle you enjoy; overall satisfied income covers living expenses
Health 5 Satisfaction .81
With diet and eating habits; exercise habits; physical health; mental health; overall satisfaction with health and wellbeing
Services and facilities 7 Satisfaction ..79
With local schools; child care facilities; sports and leisure facilities; shopping (other than for food and everyday items); medical and health services; community support services; overall satisfaction with services and facilities
Town appearance 3 Satisfaction .85
With cleanliness in the town; greenery and parks in the town; overall satisfaction with general appearance of the town
Roads 4 Satisfaction .85
With condition; safety; amount of traffic on roads; roads overall
Environmental quality 5 Satisfaction .79
With level of dust; noise; quality of the air; drinking water; overall quality of the general environment
Environmental management
3 Satisfaction .80
With quality of underground water for the future; management of parks, caves, and reserves for the future; overall management of the natural environment for the future
Local decision making and trust
6 Agreement .92
See items for sub‐scales:
‐ Local decision making 3 Agreement .86
Local council informs residents; opportunities to be heard; overall satisfied with how decisions are made for the community
‐ Trust in local leaders 3 Agreement .93
Your local council can be trusted; there are local leaders I can trust; Overall, I trust my local leaders
Economic opportunities 4 Agreement .91
There are good job opportunities; there is good job security for locals; local businesses are doing well; overall satisfied with employment and business opportunities
Community spirit 3 Agreement .90
People can rely upon one another for help; people have friendly relationships; overall there is good community spirit around here
Community cohesion 3 Agreement .88
Community is welcoming of newcomers; and people of different cultures; overall community includes everyone no matter who they are
Community trust 2 Agreement .88
People that you see around [local area] can generally; overall satisfied with levels of trust in local area

Community wellbeing and local attitudes to conventional gas development in the South‐East of South Australia | 59
Community participation 3 Agreement .89
Involved in a local organisation or club; attended several community events in the past year; overall participate regularly in community activities
Social interaction 4 Agreement .82
Regularly visit someone’s home; go out together socially; speak or text on phone; overall satisfied with level of social interaction in local area
Overall community wellbeing
5 Agreement .88
Community is suitable for young children; teenagers; seniors; overall, local area offers a good quality of life; overall, happy living in local area
Expected future wellbeing 2 Agreement . .87
In 3 years time, I will be happy living in this local area; it will offer a good quality of life
Place attachment 4 Agreement .89
Feel that I belong to this area; pleased to come back to the area if I go away; I feel proud to living in this community;
Notes: 1 The Spearman‐Brown Rho correlation was used for two item measures and Cronbach’s alpha for other measures
Table 8 continued
Measures for perceptions and attitudes about conventional gas
No. of items
Scale type / reliability1
Examples for scale items
Perceived impacts 18 Concern .97
See items for sub‐scales:
‐ More immediate issues
13 Concern .96
Damage to underground aquifers; depletion of underground water; dust, noise, light pollution; a threat to ‘clean’ and ‘green’ brand; threat to rural liveability; reduces region’s visual attractiveness; impact on farm property values; increased traffic; community division; health impacts
‐ Possible future issues
5 Concern .90
Fracking being introduced after the moratorium; unconventional gas being introduced over time, conventional gas development extending into other farming areas; well integrity over time
Risk manageability 3 Agreement
.50
Risks are understood by science; are understood by the community; are manageable
Risk severity 3 Agreement
.89
Risks potentially uncontrollable; potentially disastrous; can adversely affect future generations
Perceived benefits
15 Agreement .96
See items for sub‐scales:
‐ Local benefits 8 Agreement .93
Local employment; local business opportunities; opportunities for young people to stay in region; corporate support for local community activities; additional services and facilities; cheaper gas for local industries; cheaper gas for residents
‐ Regional and societal benefits
7 Agreement .93
Improving energy security in the region; supporting the viability of big gas users; make the region more attractive to new businesses and industry; boosting the wider state economy; role in transitioning to renewable energy; role in SA future energy mix
Distributional fairness 4 Agreement .91
Fair to have conventional gas development in the region if your local council compensated accordingly; your community received a fair share of the benefits; if farmers compensated fairly; if good arguments for having it in this region
Procedural fairness 3 Agreement .92
Conventional gas companies would listen to and respect community opinions; inform residents of important developments; give opportunities for communities to participate in decision making
Relationship quality 4 Agreement .94
Conventional gas companies would be accessible or easy to contact; open, honest and transparent; engage in genuine two‐way dialogue; respond to issues in a timely manner
Governance overall 9 Agreement .94
See items for sub‐scales:
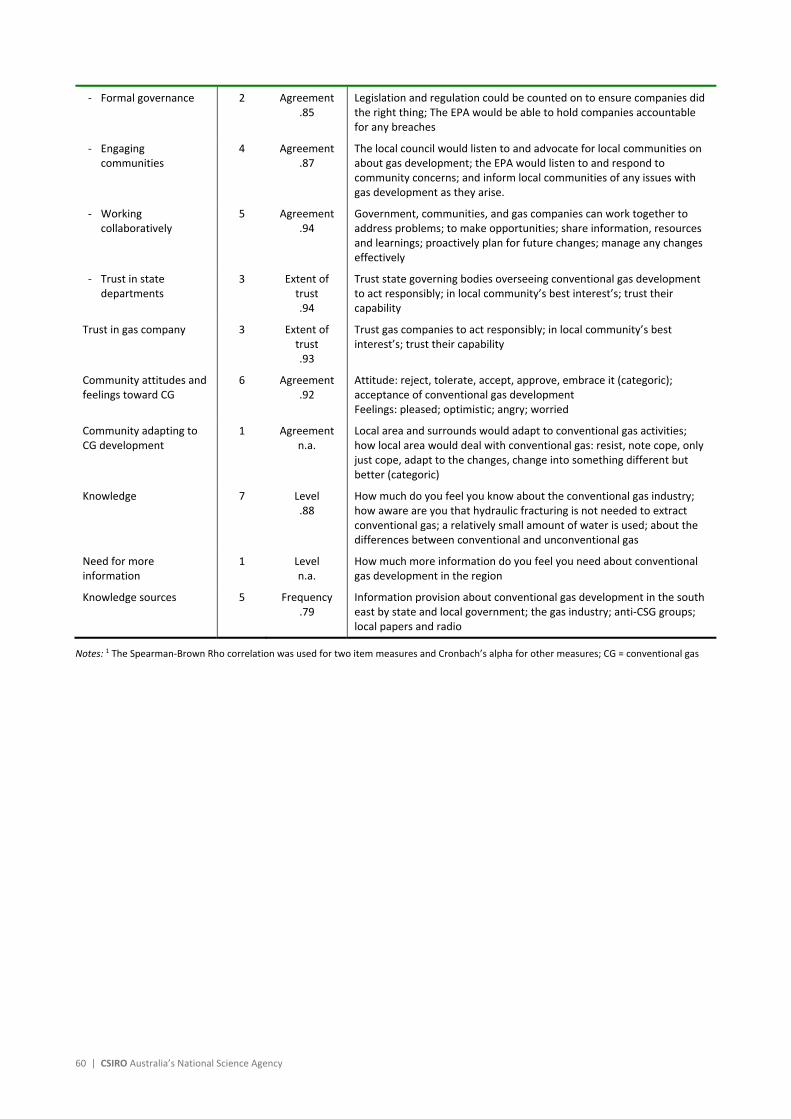
60 | CSIRO Australia’s National Science Agency
‐ Formal governance 2 Agreement .85
Legislation and regulation could be counted on to ensure companies did the right thing; The EPA would be able to hold companies accountable for any breaches
‐ Engaging communities
4 Agreement .87
The local council would listen to and advocate for local communities on about gas development; the EPA would listen to and respond to community concerns; and inform local communities of any issues with gas development as they arise.
‐ Working collaboratively
5 Agreement .94
Government, communities, and gas companies can work together to address problems; to make opportunities; share information, resources and learnings; proactively plan for future changes; manage any changes effectively
‐ Trust in state departments
3 Extent of trust .94
Trust state governing bodies overseeing conventional gas development to act responsibly; in local community’s best interest’s; trust their capability
Trust in gas company 3 Extent of trust .93
Trust gas companies to act responsibly; in local community’s best interest’s; trust their capability
Community attitudes and feelings toward CG
6 Agreement .92
Attitude: reject, tolerate, accept, approve, embrace it (categoric); acceptance of conventional gas development Feelings: pleased; optimistic; angry; worried
Community adapting to CG development
1 Agreement n.a.
Local area and surrounds would adapt to conventional gas activities; how local area would deal with conventional gas: resist, note cope, only just cope, adapt to the changes, change into something different but better (categoric)
Knowledge 7 Level .88
How much do you feel you know about the conventional gas industry; how aware are you that hydraulic fracturing is not needed to extract conventional gas; a relatively small amount of water is used; about the differences between conventional and unconventional gas
Need for more information
1 Level n.a.
How much more information do you feel you need about conventional gas development in the region
Knowledge sources 5 Frequency .79
Information provision about conventional gas development in the south east by state and local government; the gas industry; anti‐CSG groups; local papers and radio
Notes: 1 The Spearman‐Brown Rho correlation was used for two item measures and Cronbach’s alpha for other measures; CG = conventional gas
Community wellbeing and local attitudes to conventional gas development in the South‐East of South Australia | 61
Statistical analyses
Dominance analysis
Dominance analysis was used to determine the relative importance of various dimensions of
community wellbeing in predicting overall community wellbeing. General dominance statistics
were used because they are the most commonly used and easiest to interpret.
We reported the standardised versions of these statistics which calculates the percentage of the
explained variation in overall community wellbeing which can be attributed to each dimension,
adding up to 100% across all predictors. It does this by calculating the incremental contribution to
R‐squared across all models in which the independent variable is included. This involved running
regressions for each possible combination of the CWB.
Path analysis
Path analysis was used to model the social acceptance of conventional gas development and its
underlying drivers. The main advantage of path analysis over multiple regression analysis is that it
can model a range of direct and indirect paths or influences on the main dependent variable or
social acceptance in this case (McCrea, 2014). Direct paths are factors that lead directly to social
acceptance. Indirect paths lead to social acceptance via mediating or intervening factors, and
some factors have both direct and indirect paths to social acceptance.
The path models show the percentage of variation explained in each dependent variable and the
standardised regression coefficients for each path predictor of that variable, giving an indication of
the relative importance of each. Path analysis can also test how well the models fit the data. That
is, how well the correlations implied in the path model fit the actual correlations in the data
(McCrea, 2014). The path analyses in this report had good model fit (i.e., standardized root mean
squared residual of less than .05).

62 | CSIRO Australia’s National Science Agency
All survey items by Subregion
Survey item statistics by subregion
Survey item Millicent and surrounds
Penola and surrounds
Mount Gambier and surrounds
Total
COMMUNITY WELLBEING
Place attachment – Thinking about [local area] and surrounds, how much do you agree with the following statements:
I feel that I belong to this area 4.29 4.25 4.35 4.33
I am pleased to come back to the area, if I go away 4.52 4.55 4.47 4.48
I feel proud to live in this community 4.45 4.57 4.42 4.44
Overall, I feel very attached to this local area 4.40 4.47 4.37 4.38
Personal safety – Now a few questions about personal safety. On a scale from 1 to 5, how much do you agree that:
It is safe to be alone at home during the night 4.48 L 4.76 H 4.41 L 4.46
It is safe to walk alone outside at night 3.79 M 4.48 H 3.57 L 3.70
Overall, I feel safe living in the area 4.45 L 4.79 H 4.49 L 4.51
Income sufficiency ‐ Thinking about your household income, how much do you agree that:
Your income is enough for household expenses 3.88 L 4.16 H 3.73 L 3.79
Your income is enough for the lifestyle you enjoy 3.76 4.00 H 3.62 L 3.68
Overall, you are satisfied that your income covers living expenses
3.94 4.14 3.82 3.87
Health – Now on a scale from 1 = very dissatisfied to 5 = very satisfied and thinking about your health and wellbeing, how satisfied are you with
Your diet and eating habits 3.76 L 4.12 H 3.82 L 3.84
Your exercise habits 3.33 L 3.66 H 3.19 L 3.26
Your physical health 3.59 L 3.94 H 3.74 3.73
Your mental health 4.14 4.33 H 4.03 L 4.08
Overall, how satisfied are you with your health and wellbeing
3.89 4.09 3.98 3.98
Services and facilities ‐ Thinking of services and facilities for [local area] and surrounds, how satisfied are you with:
Local schools 3.66 L 3.95 H 3.71 L 3.72
Childcare facilities 3.54 3.70 3.50 3.53
Sports and leisure facilities 4.09 H 3.87 3.88 L 3.91
Shopping (other than food and everyday items) 3.17 L 3.51 H 3.52 H 3.46
Medical and health services 3.38 3.10 3.25 3.26
Community support services (e.g. meals on wheels, youth workers)
3.61 H 3.29 L 3.57 3.55
Overall, how satisfied are you with the services and facilities in your local area
3.67 3.59 3.70 3.68
Town appearance ‐ Thinking about [local area]’s general appearance, how satisfied are you with:
Cleanliness in the town 4.14 4.33 4.21 4.21
Greenery and Parks in the town 4.34 4.38 4.42 4.40

Community wellbeing and local attitudes to conventional gas development in the South‐East of South Australia | 63
Survey item Millicent and surrounds
Penola and surrounds
Mount Gambier and surrounds
Total
Overall, how satisfied are you with the general appearance of the town
4.11 4.30 4.26 4.24
Roads ‐ Thinking about the roads outside of [local area], how satisfied are you with the
Condition of the roads 2.58 L 2.88 L 2.92 H 2.86
Safety on the roads 2.93 3.09 3.08 3.06
Amount of traffic on roads 3.48 3.32 3.57 3.53
Roads overall 2.82 L 3.01 3.19 H 3.11
Environmental quality ‐ Thinking about pollution in the general environment, how satisfied are you with the
Level of dust 3.94 3.94 3.83 3.86
Level of noise 4.32 H 4.22 4.02 L 4.09
Quality of the air 4.43 H 4.50 H 4.04 L 4.15
Quality of drinking water 3.92 M 4.12 H 3.65 L 3.74
Overall quality of the general environment around [local area]
4.22 L 4.41 H 4.16 L 4.20
Environmental management ‐ Now thinking about the natural environment around [local area], how satisfied are you with the management of the
Underground water for the future 3.34 H 3.03 L 3.33 H 3.30
Management of parks, caves and reserves for the future 3.96 3.79 4.01 3.98
Overall, the management of the natural environment for the future 3.59 3.54 3.70 3.67
Local decision making ‐ Thinking about how decisions are made affecting [local area] and surrounds, how much do you agree that:
The local council informs residents of important developments
3.38 H 3.03 L 3.25 3.25
There are opportunities for your voice to be heard on issues that are important to you
3.39 3.15 3.36 3.34
Overall, I am satisfied with how decisions are made that affect [local area]
3.40 H 3.06 L 3.22 L 3.23
Trust in local leaders ‐ Thinking about trust in local leaders, how much do you agree that:
Your local council can be trusted 3.56 H 3.08 L 3.11 L 3.18
There are local community leaders I can trust 3.75 H 3.58 3.44 L 3.50
Overall, I trust my local leaders 3.63 H 3.53 3.33 L 3.40
Economic opportunities ‐ Regarding employment and business opportunities in [local area] and surrounds, how much do you agree that:
There are good job opportunities 2.56 L 3.36 H 2.95 M 2.92
There is good job security for locals 2.69 L 3.57 H 3.10 M 3.08
Local businesses are doing well 2.71 L 3.47 H 2.82 L 2.86
Overall, I am satisfied with employment and business opportunities in my local area
2.76 L 3.38 H 3.01 M 3.00
Community spirit ‐ Thinking about community spirit in [local area] and surrounds, how much do you agree that
People can rely upon one another for help 3.85 L 4.35 H 3.74 L 3.81
People have friendly relationships 4.07 L 4.43 H 3.91 L 3.99
Overall, there is good community spirit around here 4.11 M 4.48 H 3.92 L 4.01

64 | CSIRO Australia’s National Science Agency
Survey item Millicent and surrounds
Penola and surrounds
Mount Gambier and surrounds
Total
Community cohesion ‐ Thinking about how inclusive your local community is in [local area] and surrounds, how much do you agree that:
Your community is welcoming of newcomers 3.79 3.94 H 3.66 L 3.71
Your local community is welcoming of people of different cultures
3.70 3.77 3.64 3.66
Overall, your community includes everyone no matter who they are
3.79 3.89 3.69 3.72
Community trust ‐ Thinking about levels of trust in your local area, how much do you agree that:
People that you see around [local area] can generally be trusted
3.55 L 3.80 H 3.43 L 3.49
Overall, I am satisfied with levels of trust in my local area
3.63 L 3.92 H 3.59 L 3.63
Community participation ‐ Thinking about everyday interactions with people, other than those you may live with. How much do you agree that you do the following regularly
You are involved in a local organisation or club 3.36 3.56 3.60 3.56
You have attended several community events in the past year
3.46 3.82 3.56 3.57
Overall, you participate regularly in a variety of community activities
3.13 L 3.63 H 3.35 3.34
Social interaction ‐ Thinking about everyday interactions with people, other than those you may live with. How much do you agree that you do the following regularly
Visit someone’s home 3.54 3.77 3.48 3.51
Go out together socially 3.45 3.66 3.35 3.40
Speak or text on the phone 3.96 4.14 4.00 4.01
Overall, I have regular social interaction with others in my local area
3.97 4.21 4.03 4.03
Overall community wellbeing ‐ Thinking about overall community wellbeing around [local area] and surrounds, how much do you agree that:
This community is suitable for young children 4.21 L 4.50 H 4.07 L 4.14
This community is suitable for teenagers 3.55 3.67 3.52 3.54
This community is suitable for seniors 4.30 4.29 4.26 4.27
Overall, this local area offers a good quality of life 4.31 L 4.54 H 4.28 L 4.31
Overall, I am happy living in this local area 4.46 4.58 H 4.35 L 4.39
This community is a great place to live 4.37 L 4.58 H 4.30 L 4.34
EXPECTED FUTURE COMMUNITY WELLBEING
Imagining what it might be like in 3 years time, how much do you agree that:
Overall, I will be happy living in this local area 4.13 4.28 4.11 4.13
Overall, this local area will offer a good quality of life 4.18 4.35 4.15 4.17
Community wellbeing over next 3 years 2.01 2.15 2.12 2.10
CONVENTIONAL GAS PERCEPTIONS AND ATTITUDES
Perceived impacts ‐ In relation to conventional gas development, how much of a concern do you believe the following may be:
Depletion of underground water 3.54 3.59 3.45 3.48
Damage to the underground aquifers 3.72 3.78 3.63 3.65

Community wellbeing and local attitudes to conventional gas development in the South‐East of South Australia | 65
Survey item Millicent and surrounds
Penola and surrounds
Mount Gambier and surrounds
Total
A threat to clean and green brand for regional agriculture 3.63 3.60 3.52 3.54
A threat to regional tourism 3.13 3.17 2.96 3.01
Air contamination 3.17 3.10 2.98 3.03
Dust, noise, and light pollution 3.00 2.77 2.85 2.87
Increased traffic on the roads 3.05 2.95 2.86 2.90
Health impacts 3.27 H 2.85 L 3.15 3.14
Threat to rural liveability 3.31 3.15 3.16 3.19
Reduces the regions visual attractiveness 3.18 3.02 3.01 3.04
Impact on farm property values 3.57 3.36 3.46 3.47
Community division over gas development 3.85 3.68 3.65 3.69
Overall, how much of a concern, do you believe, comes with conventional gas development in the region
3.52 3.43 3.42 3.44
Potential impacts: Thinking about possible future issues, how much of a concern to you believe the following may be:
Conventional gas development extending into other farming areas in the South East
3.73 H 3.30 L 3.54 3.55
Integrity of gas wells over time (e.g. leaks) 3.85 3.62 3.70 3.72
Unconventional gas development being introduced over time (e.g., tight or shale gas)
4.06 H 4.12 H 3.77 L 3.85
Fracking being introduced after the moratorium 4.45 4.28 4.25 4.29
Overall how much of a concern, do you believe, there may be in the future with gas development
4.04 3.87 3.86 3.89
Risks ‐ How much do you agree that any risks associated with conventional gas development:
Are understood by science 3.41 3.19 3.30 3.31
Are understood by the community 2.98 H 2.84 2.67 L 2.74
Are manageable 3.11 3.04 3.02 3.03
Have potentially uncontrollable impacts 3.56 3.65 3.47 3.50
Can adversely affect future generations 3.92 3.81 3.72 3.76
Are potentially disastrous 3.75 3.71 3.51 3.57
Perceived local benefits ‐ How much do you agree that conventional gas development would provide significant local benefits such as
Local employment 3.30H 2.81L 3.28H 3.24
Opportunities for young people to stay in the region 3.14H 2.66L 3.02H 3.01
Local business opportunities 3.11 2.87 3.02 3.02
Corporate support for local community activities (e.g. a gas company sponsoring local clubs)
3.34 3.54 3.23 3.27
Additional local services and facilities 3.11 2.95 2.94 2.97
Cheaper gas for local industries 2.96 2.63 2.78 2.79
Cheaper gas for local residents 2.78 2.44 2.67 2.67
Overall, how much do you agree that conventional gas development would bring significant benefits to the local community
2.93 2.75 2.92 2.90
Perceived societal benefits ‐ How much do you agree that conventional gas development in the region has a role in:
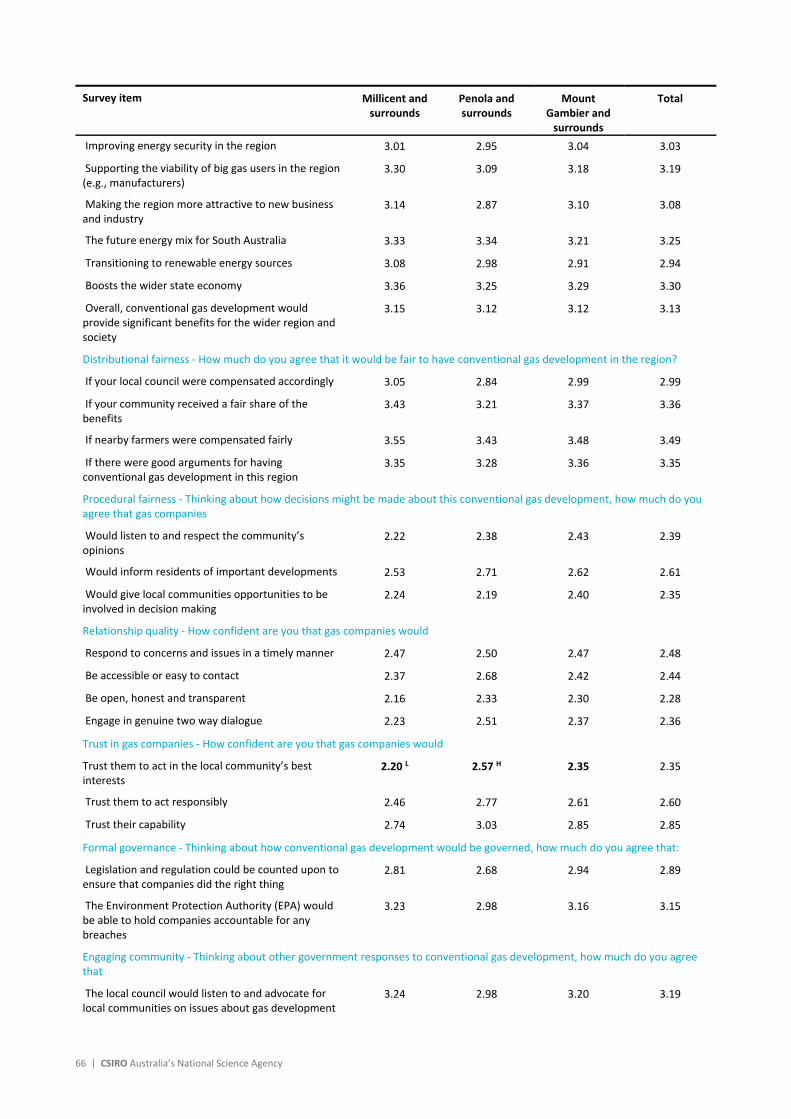
66 | CSIRO Australia’s National Science Agency
Survey item Millicent and surrounds
Penola and surrounds
Mount Gambier and surrounds
Total
Improving energy security in the region 3.01 2.95 3.04 3.03
Supporting the viability of big gas users in the region (e.g., manufacturers)
3.30 3.09 3.18 3.19
Making the region more attractive to new business and industry
3.14 2.87 3.10 3.08
The future energy mix for South Australia 3.33 3.34 3.21 3.25
Transitioning to renewable energy sources 3.08 2.98 2.91 2.94
Boosts the wider state economy 3.36 3.25 3.29 3.30
Overall, conventional gas development would provide significant benefits for the wider region and society
3.15 3.12 3.12 3.13
Distributional fairness ‐ How much do you agree that it would be fair to have conventional gas development in the region?
If your local council were compensated accordingly 3.05 2.84 2.99 2.99
If your community received a fair share of the benefits
3.43 3.21 3.37 3.36
If nearby farmers were compensated fairly 3.55 3.43 3.48 3.49
If there were good arguments for having conventional gas development in this region
3.35 3.28 3.36 3.35
Procedural fairness ‐ Thinking about how decisions might be made about this conventional gas development, how much do you agree that gas companies
Would listen to and respect the community’s opinions
2.22 2.38 2.43 2.39
Would inform residents of important developments 2.53 2.71 2.62 2.61
Would give local communities opportunities to be involved in decision making
2.24 2.19 2.40 2.35
Relationship quality ‐ How confident are you that gas companies would
Respond to concerns and issues in a timely manner 2.47 2.50 2.47 2.48
Be accessible or easy to contact 2.37 2.68 2.42 2.44
Be open, honest and transparent 2.16 2.33 2.30 2.28
Engage in genuine two way dialogue 2.23 2.51 2.37 2.36
Trust in gas companies ‐ How confident are you that gas companies would
Trust them to act in the local community’s best interests
2.20 L 2.57 H 2.35 2.35
Trust them to act responsibly 2.46 2.77 2.61 2.60
Trust their capability 2.74 3.03 2.85 2.85
Formal governance ‐ Thinking about how conventional gas development would be governed, how much do you agree that:
Legislation and regulation could be counted upon to ensure that companies did the right thing
2.81 2.68 2.94 2.89
The Environment Protection Authority (EPA) would be able to hold companies accountable for any breaches
3.23 2.98 3.16 3.15
Engaging community ‐ Thinking about other government responses to conventional gas development, how much do you agree that
The local council would listen to and advocate for local communities on issues about gas development
3.24 2.98 3.20 3.19
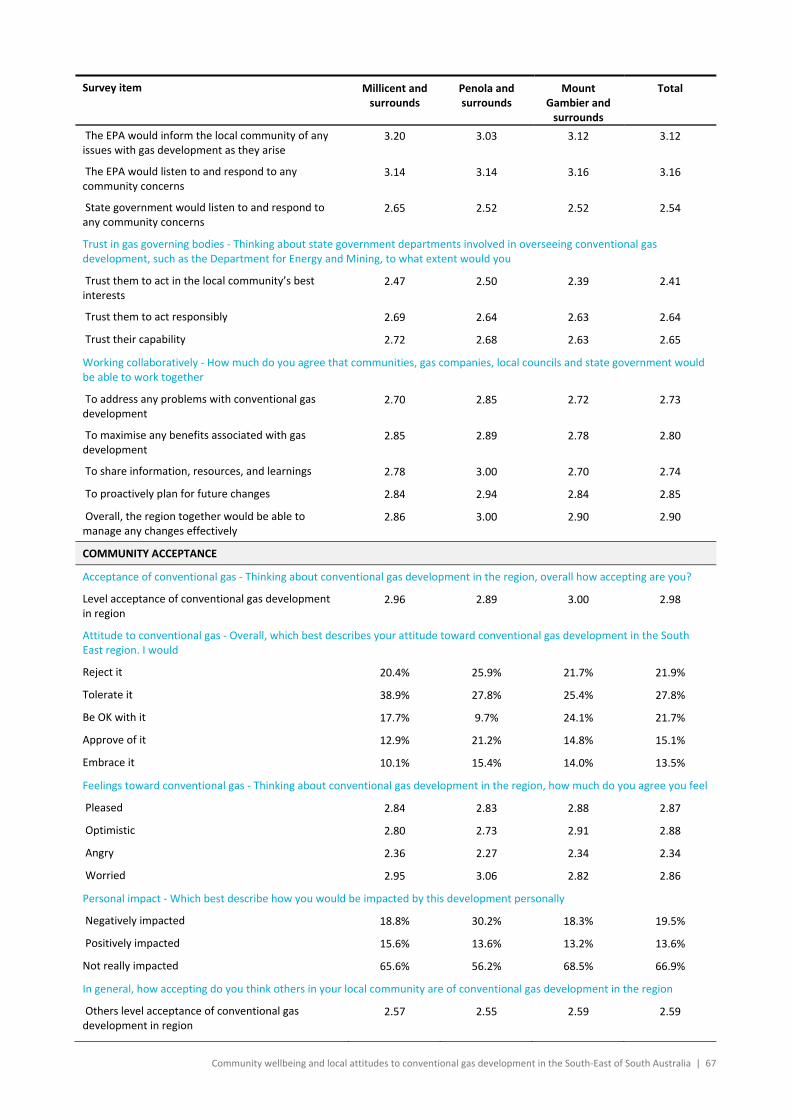
Community wellbeing and local attitudes to conventional gas development in the South‐East of South Australia | 67
Survey item Millicent and surrounds
Penola and surrounds
Mount Gambier and surrounds
Total
The EPA would inform the local community of any issues with gas development as they arise
3.20 3.03 3.12 3.12
The EPA would listen to and respond to any community concerns
3.14 3.14 3.16 3.16
State government would listen to and respond to any community concerns
2.65 2.52 2.52 2.54
Trust in gas governing bodies ‐ Thinking about state government departments involved in overseeing conventional gas development, such as the Department for Energy and Mining, to what extent would you
Trust them to act in the local community’s best interests
2.47 2.50 2.39 2.41
Trust them to act responsibly 2.69 2.64 2.63 2.64
Trust their capability 2.72 2.68 2.63 2.65
Working collaboratively ‐ How much do you agree that communities, gas companies, local councils and state government would be able to work together
To address any problems with conventional gas development
2.70 2.85 2.72 2.73
To maximise any benefits associated with gas development
2.85 2.89 2.78 2.80
To share information, resources, and learnings 2.78 3.00 2.70 2.74
To proactively plan for future changes 2.84 2.94 2.84 2.85
Overall, the region together would be able to manage any changes effectively
2.86 3.00 2.90 2.90
COMMUNITY ACCEPTANCE
Acceptance of conventional gas ‐ Thinking about conventional gas development in the region, overall how accepting are you?
Level acceptance of conventional gas development in region
2.96 2.89 3.00 2.98
Attitude to conventional gas ‐ Overall, which best describes your attitude toward conventional gas development in the South East region. I would
Reject it 20.4% 25.9% 21.7% 21.9%
Tolerate it 38.9% 27.8% 25.4% 27.8%
Be OK with it 17.7% 9.7% 24.1% 21.7%
Approve of it 12.9% 21.2% 14.8% 15.1%
Embrace it 10.1% 15.4% 14.0% 13.5%
Feelings toward conventional gas ‐ Thinking about conventional gas development in the region, how much do you agree you feel
Pleased 2.84 2.83 2.88 2.87
Optimistic 2.80 2.73 2.91 2.88
Angry 2.36 2.27 2.34 2.34
Worried 2.95 3.06 2.82 2.86
Personal impact ‐ Which best describe how you would be impacted by this development personally
Negatively impacted 18.8% 30.2% 18.3% 19.5%
Positively impacted 15.6% 13.6% 13.2% 13.6%
Not really impacted 65.6% 56.2% 68.5% 66.9%
In general, how accepting do you think others in your local community are of conventional gas development in the region
Others level acceptance of conventional gas development in region
2.57 2.55 2.59 2.59

68 | CSIRO Australia’s National Science Agency
Survey item Millicent and surrounds
Penola and surrounds
Mount Gambier and surrounds
Total
COMMUNITY RESILIENCE AND ADAPTATION
How much do you agree that [local area] and surrounds will adapt to this conventional gas development
Agreement that region will adapt to conventional gas development
3.00 3.18 3.11 3.10
Level of community adaptation ‐ Which of the following best describes how [local area] and surrounds will deal with this conventional development?
How region will deal with conventional gas development
Resist it 18.3% 17.9% 13.9% 15.0%
Not cope 3.6% 2.4% 6.4% 5.6%
Only just cope 18.0% 27.2% 19.3% 19.8%
Adapt to the changes 55.4% 47.3% 50.9% 51.3%
Change into something different but better 4.7% 5.2% 9.5% 8.3%
KNOWLEDGE AND INFORMATION
Information provision ‐ Over the last couple of years, how much information about conventional gas development in the south‐east has been provided to the community by the:
State government 2.17 2.51 2.26 2.27
Local government 2.23 2.45 2.35 2.34
Gas industry 1.92 L 2.69 H 2.14 M 2.16
Anti‐gas groups 3.11 L 3.64 H 3.19 L 3.22
Local papers and radio 2.78 L 3.40 H 3.00 M 3.00
Knowledge confidence ‐ How much do you feel you know about the conventional gas industry?
Level known about conventional gas industry 2.60 L 3.12 H 2.64 L 2.67
Information need ‐ How much more information would you like to know?
Additional information would like to know about conventional gas industry
3.52 3.52 3.34 3.39
When it comes to conventional gas development in the south east region, how aware are you that:
Hydraulic fracturing (fracking) was banned in the south east for 10 years in late 2018
3.86 L 4.42 H 3.83 L 3.89
Hydraulic fracturing is not needed to extract conventional gas in the south east
3.22 L 4.07 H 3.26 L 3.33
A relatively small amount of water is used for the development of conventional gas resources when compared to shale gas
2.70 L 3.31 H 2.67 L 2.74
A handful of conventional wells can produce large volumes of gas (e.g., sufficient for the south east region)
2.81 L 3.57 H 2.92 L 2.96
Overall, how aware are you about conventional gas development in the south east
2.86 L 3.51 H 3.01 L 3.03
When it comes to the differences between conventional and unconventional gas development (e.g. traditional vs. shale gas), how much do you feel you understand about the differences.
Level of understanding of conventional and unconventional gas
2.60 L 3.13 H 2.56 L 2.62

Community wellbeing and local attitudes to conventional gas development in the South‐East of South Australia | 69
Tables of Demographic Differences Apx Table E. 1 Demographic differences: Mean scores based on subregions (area of interest)
Dimensions Millicent and Penola and Mount Gambier SE Region
COMMUNITY WELLBEING
Personal safety 4.24L 4.68H 4.16L 4.22
Income sufficiency 3.86 4.10H 3.72L 3.78
Health 3.74L 4.03H 3.75L 3.78
Services and facilities 3.59 3.57 3.59 3.59
Town appearance 4.20 4.34 4.30 4.28
Roads 2.95L 3.08 3.19H 3.14
Environmental quality 4.16H 4.24H 3.94L 4.01
Environmental management 3.63 3.45 3.68 3.65
Local decision‐making and trust 3.52H 3.24L 3.29L 3.32
Economic opportunities 2.68L 3.44H 2.97M 2.97
Community cohesion 3.76 3.87 3.66 3.70
Community trust 3.59H 3.86L 3.51L 3.56
Community participation 3.32L 3.67H 3.51 3.49
Community spirit 4.01 4.42H 3.86L 3.94
Social interaction 3.73 3.94 3.71 3.74
Overall community wellbeing 4.17 4.32H 4.10L 4.13
Expected future wellbeing 4.15 4.32 4.13 4.15
Place attachment 4.41 4.46 4.40 4.41
CONVENTIONAL GAS PERCEPTIONS AND ATTITUDES
Perceived impacts 3.56 3.42 3.40 3.43
Risk manageability 3.16 3.02 3.00 3.61
Risk severity 3.74 3.72 3.57 3.03
Perceived benefits 3.14 2.95 3.05 3.05
Distributional fairness 3.34 3.19 3.30 3.30
Procedural fairness 2.33 2.43 2.48 2.45
Relationship quality 2.31 2.50 2.39 2.39
Governance overall 2.87 2.84 2.83 2.84
Formal governance 3.02 2.83 3.05 3.02
Engaging community 3.06 2.92 3.00 3.00
Working collaboratively 2.81 2.94 2.79 2.81
Trust in gas governing bodies 2.63 2.60 2.55 2.57
Trust in gas companies 2.47 2.79 2.60 2.60
Knowledge confidence 2.95L 3.59H 2.98L 3.03
Information need 3.52 3.52 3.34 3.39
Community attitudes and feelings toward conventional gas
2.97 2.97 3.06 3.04
Note: Bold font indicates a significant difference; Means with different superscript letters are significantly different (L = lower; H=higher)
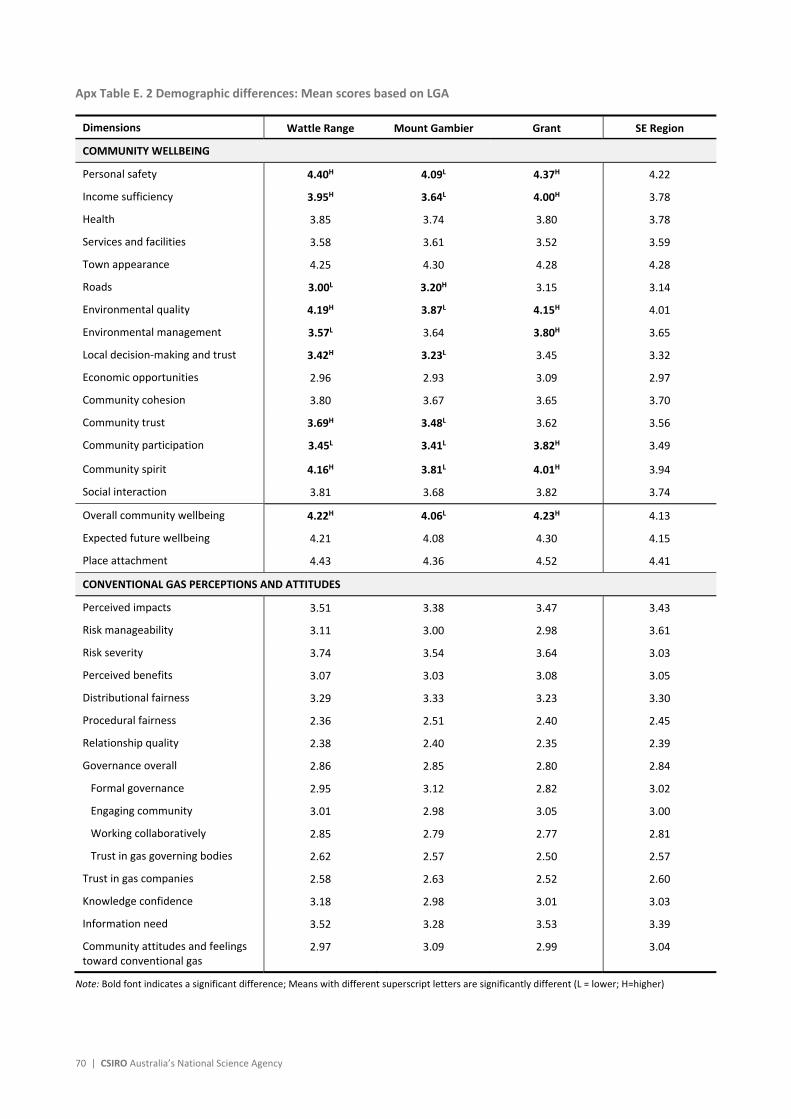
70 | CSIRO Australia’s National Science Agency
Apx Table E. 2 Demographic differences: Mean scores based on LGA
Dimensions Wattle Range Mount Gambier Grant SE Region
COMMUNITY WELLBEING
Personal safety 4.40H 4.09L 4.37H 4.22
Income sufficiency 3.95H 3.64L 4.00H 3.78
Health 3.85 3.74 3.80 3.78
Services and facilities 3.58 3.61 3.52 3.59
Town appearance 4.25 4.30 4.28 4.28
Roads 3.00L 3.20H 3.15 3.14
Environmental quality 4.19H 3.87L 4.15H 4.01
Environmental management 3.57L 3.64 3.80H 3.65
Local decision‐making and trust 3.42H 3.23L 3.45 3.32
Economic opportunities 2.96 2.93 3.09 2.97
Community cohesion 3.80 3.67 3.65 3.70
Community trust 3.69H 3.48L 3.62 3.56
Community participation 3.45L 3.41L 3.82H 3.49
Community spirit 4.16H 3.81L 4.01H 3.94
Social interaction 3.81 3.68 3.82 3.74
Overall community wellbeing 4.22H 4.06L 4.23H 4.13
Expected future wellbeing 4.21 4.08 4.30 4.15
Place attachment 4.43 4.36 4.52 4.41
CONVENTIONAL GAS PERCEPTIONS AND ATTITUDES
Perceived impacts 3.51 3.38 3.47 3.43
Risk manageability 3.11 3.00 2.98 3.61
Risk severity 3.74 3.54 3.64 3.03
Perceived benefits 3.07 3.03 3.08 3.05
Distributional fairness 3.29 3.33 3.23 3.30
Procedural fairness 2.36 2.51 2.40 2.45
Relationship quality 2.38 2.40 2.35 2.39
Governance overall 2.86 2.85 2.80 2.84
Formal governance 2.95 3.12 2.82 3.02
Engaging community 3.01 2.98 3.05 3.00
Working collaboratively 2.85 2.79 2.77 2.81
Trust in gas governing bodies 2.62 2.57 2.50 2.57
Trust in gas companies 2.58 2.63 2.52 2.60
Knowledge confidence 3.18 2.98 3.01 3.03
Information need 3.52 3.28 3.53 3.39
Community attitudes and feelings toward conventional gas
2.97 3.09 2.99 3.04
Note: Bold font indicates a significant difference; Means with different superscript letters are significantly different (L = lower; H=higher)

Community wellbeing and local attitudes to conventional gas development in the South‐East of South Australia | 71
Apx Table E. 3 Demographic differences: Mean scores based on living In‐town and Out‐of‐town
Dimensions In‐town Out‐of‐town SE Region
COMMUNITY WELLBEING
Personal safety 4.18L 4.37H 4.22
Income sufficiency 3.75 3.88 3.78
Health 3.74L 3.89H 3.78
Services and facilities 3.61 3.52 3.59
Town appearance 4.32H 4.17L 4.28
Roads 3.17 3.04 3.14
Environmental quality 3.94L 4.23H 4.01
Environmental management 3.65 3.64 3.65
Local decision‐making and trust 3.32 3.30 3.32
Economic opportunities 2.93 3.09 2.97
Community cohesion 3.71 3.66 3.70
Community trust 3.53 3.65 3.56
Community participation 3.44 3.64 3.49
Community spirit 3.91 4.02 3.94
Social interaction 3.79H 3.56L 3.74
Overall community wellbeing 4.12 4.16 4.13
Expected future wellbeing 4.15 4.16 4.15
Place attachment 4.41 4.39 4.41
CONVENTIONAL GAS PERCEPTIONS AND ATTITUDES
Perceived impacts 3.41 3.51 3.43
Risk manageability 3.04 2.98 3.61
Risk severity 3.59 3.68 3.03
Perceived benefits 3.03 3.11 3.05
Distributional fairness 3.31 3.26 3.30
Procedural fairness 2.44 2.48 2.45
Relationship quality 2.39 2.37 2.39
Governance overall 2.85 2.81 2.84
Formal governance 3.04 2.95 3.02
Engaging community 3.00 2.99 3.00
Working collaboratively 2.81 2.78 2.81
Trust in gas governing bodies 2.58 2.53 2.57
Trust in gas companies 2.60 2.60 2.60
Knowledge confidence 3.01 3.11 3.03
Information need 3.39 3.37 3.39
Community attitudes and feelings toward conventional gas
3.05 3.01 3.04
Note: Bold font indicates a significant difference; Means with different superscript letters are significantly different (L = lower; H=higher)

72 | CSIRO Australia’s National Science Agency
Apx Table E. 4 Demographic differences: Mean scores based on farm ownership
Dimensions Farm owner Non‐owner
COMMUNITY WELLBEING
Personal safety 4.45 4.20
Income sufficiency 4.31 3.73
Health 4.04 3.75
Services and facilities 3.68 3.58
Town appearance 4.27 4.29
Roads 2.98 3.15
Environmental quality 4.38 3.97
Environmental management 3.50 3.66
Local decision‐making and trust 3.47 3.30
Economic opportunities 3.55 2.91
Community cohesion 3.88 3.68
Community trust 3.73 3.54
Community participation 3.74 3.47
Community spirit 4.22 3.91
Social interaction 3.88 3.73
Overall community wellbeing 4.31 4.11
Expected future wellbeing 4.44 4.12
Place attachment 4.56 4.39
CONVENTIONAL GAS PERCEPTIONS AND ATTITUDES
Perceived impacts 3.39 3.43
Risk manageability 2.87 3.04
Risk severity 3.67 3.60
Perceived benefits 2.98 3.06
Distributional fairness 3.09 3.32
Procedural fairness 2.29 2.47
Relationship quality 2.43 2.38
Governance overall 2.70 2.86
Formal governance 2.73 3.05
Engaging community 2.85 3.02
Working collaboratively 2.75 2.81
Trust in gas governing bodies 2.41 2.58
Trust in gas companies 2.61 2.60
Knowledge confidence 3.64 2.98
Information need 3.48 3.38
Community attitudes and feelings toward conventional gas 2.91 3.05
Note: Bold font indicates a significant difference
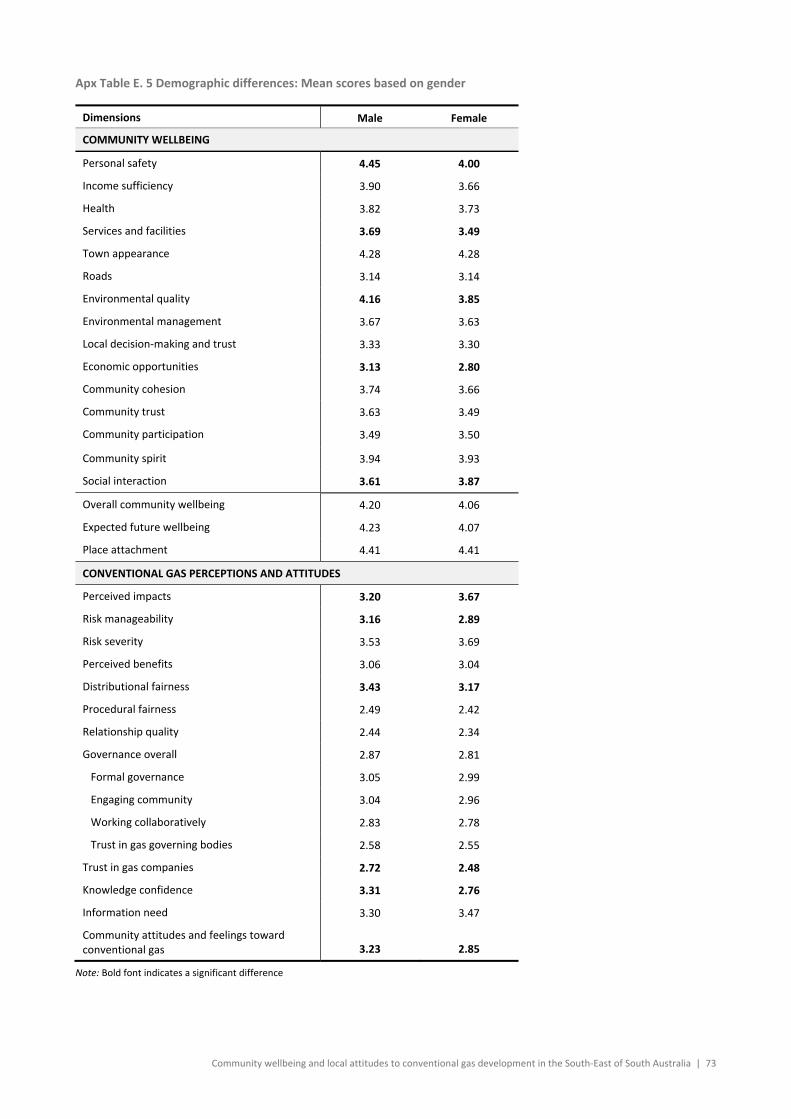
Community wellbeing and local attitudes to conventional gas development in the South‐East of South Australia | 73
Apx Table E. 5 Demographic differences: Mean scores based on gender
Dimensions Male Female
COMMUNITY WELLBEING
Personal safety 4.45 4.00
Income sufficiency 3.90 3.66
Health 3.82 3.73
Services and facilities 3.69 3.49
Town appearance 4.28 4.28
Roads 3.14 3.14
Environmental quality 4.16 3.85
Environmental management 3.67 3.63
Local decision‐making and trust 3.33 3.30
Economic opportunities 3.13 2.80
Community cohesion 3.74 3.66
Community trust 3.63 3.49
Community participation 3.49 3.50
Community spirit 3.94 3.93
Social interaction 3.61 3.87
Overall community wellbeing 4.20 4.06
Expected future wellbeing 4.23 4.07
Place attachment 4.41 4.41
CONVENTIONAL GAS PERCEPTIONS AND ATTITUDES
Perceived impacts 3.20 3.67
Risk manageability 3.16 2.89
Risk severity 3.53 3.69
Perceived benefits 3.06 3.04
Distributional fairness 3.43 3.17
Procedural fairness 2.49 2.42
Relationship quality 2.44 2.34
Governance overall 2.87 2.81
Formal governance 3.05 2.99
Engaging community 3.04 2.96
Working collaboratively 2.83 2.78
Trust in gas governing bodies 2.58 2.55
Trust in gas companies 2.72 2.48
Knowledge confidence 3.31 2.76
Information need 3.30 3.47
Community attitudes and feelings toward conventional gas 3.23 2.85
Note: Bold font indicates a significant difference

74 | CSIRO Australia’s National Science Agency
Apx Table E. 6 Demographic differences: Mean scores based on age
Dimensions 18‐34 years 35‐54 years 55+ years
COMMUNITY WELLBEING
Personal safety 3.99L 4.34H 4.26H
Income sufficiency 3.52 3.89 3.84
Health 3.61L 3.71L 3.92H
Services and facilities 3.38L 3.53L 3.75H
Town appearance 4.09L 4.29 4.39H
Roads 3.23 2.98L 3.22H
Environmental quality 3.79L 4.08H 4.07H
Environmental management 3.60 3.69 3.65
Local decision‐making and trust 3.09L 3.35 3.42H
Economic opportunities 2.85 3.07 2.95
Community cohesion 3.79 3.62 3.71
Community trust 3.43 3.53 3.66
Community participation 3.60 3.64H 3.31L
Community spirit 3.97 3.91 3.94
Social interaction 3.98 3.56 3.74
Overall community wellbeing 3.99 4.12 4.21
Expected future wellbeing 3.85L 4.13 4.33H
Place attachment 4.25L 4.37 4.53H
CONVENTIONAL GAS PERCEPTIONS AND ATTITUDES
Perceived impacts 3.35 3.31L 3.57H
Risk manageability 2.99 3.02 3.05
Risk severity 3.58 3.52 3.70
Perceived benefits 2.95 3.10 3.07
Distributional fairness 3.18 3.41 3.27
Procedural fairness 2.46 2.44 2.46
Relationship quality 2.42 2.40 2.36
Governance overall 2.88 2.90 2.77
Formal governance 3.00 3.14 2.93
Engaging community 2.98 3.11 2.93
Working collaboratively 2.87 2.79 2.78
Trust in gas governing bodies 2.69 2.67H 2.42L
Trust in gas companies 2.69 2.66 2.50
Knowledge confidence 2.78L 3.05 3.16H
Information need 3.46 3.43 3.31
Community attitudes and feelings toward conventional gas 2.99 3.18 2.95
Note: Bold font indicates a significant difference; Means with different superscript letters are significantly different (L = lower; H=higher)
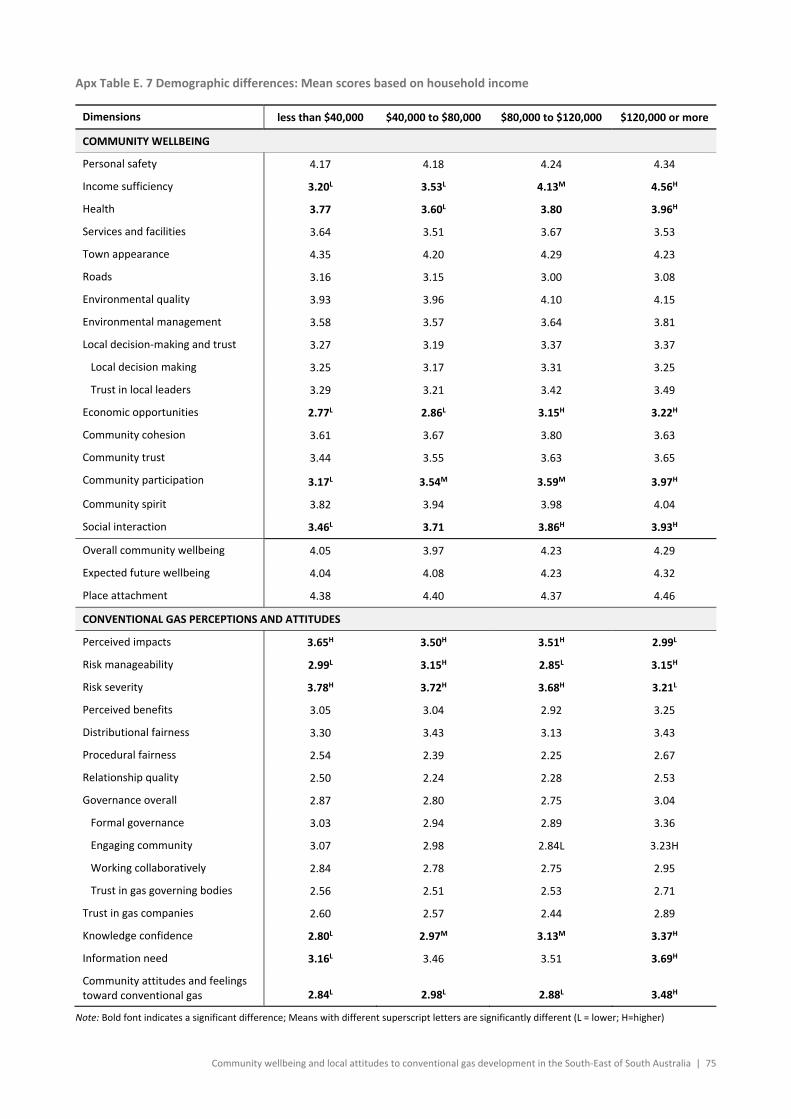
Community wellbeing and local attitudes to conventional gas development in the South‐East of South Australia | 75
Apx Table E. 7 Demographic differences: Mean scores based on household income
Dimensions less than $40,000 $40,000 to $80,000 $80,000 to $120,000 $120,000 or more
COMMUNITY WELLBEING
Personal safety 4.17 4.18 4.24 4.34
Income sufficiency 3.20L 3.53L 4.13M 4.56H
Health 3.77 3.60L 3.80 3.96H
Services and facilities 3.64 3.51 3.67 3.53
Town appearance 4.35 4.20 4.29 4.23
Roads 3.16 3.15 3.00 3.08
Environmental quality 3.93 3.96 4.10 4.15
Environmental management 3.58 3.57 3.64 3.81
Local decision‐making and trust 3.27 3.19 3.37 3.37
Local decision making 3.25 3.17 3.31 3.25
Trust in local leaders 3.29 3.21 3.42 3.49
Economic opportunities 2.77L 2.86L 3.15H 3.22H
Community cohesion 3.61 3.67 3.80 3.63
Community trust 3.44 3.55 3.63 3.65
Community participation 3.17L 3.54M 3.59M 3.97H
Community spirit 3.82 3.94 3.98 4.04
Social interaction 3.46L 3.71 3.86H 3.93H
Overall community wellbeing 4.05 3.97 4.23 4.29
Expected future wellbeing 4.04 4.08 4.23 4.32
Place attachment 4.38 4.40 4.37 4.46
CONVENTIONAL GAS PERCEPTIONS AND ATTITUDES
Perceived impacts 3.65H 3.50H 3.51H 2.99L
Risk manageability 2.99L 3.15H 2.85L 3.15H
Risk severity 3.78H 3.72H 3.68H 3.21L
Perceived benefits 3.05 3.04 2.92 3.25
Distributional fairness 3.30 3.43 3.13 3.43
Procedural fairness 2.54 2.39 2.25 2.67
Relationship quality 2.50 2.24 2.28 2.53
Governance overall 2.87 2.80 2.75 3.04
Formal governance 3.03 2.94 2.89 3.36
Engaging community 3.07 2.98 2.84L 3.23H
Working collaboratively 2.84 2.78 2.75 2.95
Trust in gas governing bodies 2.56 2.51 2.53 2.71
Trust in gas companies 2.60 2.57 2.44 2.89
Knowledge confidence 2.80L 2.97M 3.13M 3.37H
Information need 3.16L 3.46 3.51 3.69H
Community attitudes and feelings toward conventional gas 2.84L 2.98L 2.88L 3.48H
Note: Bold font indicates a significant difference; Means with different superscript letters are significantly different (L = lower; H=higher)

76 | CSIRO Australia’s National Science Agency
References
Askland, H., Askew, M., Hanley, J., Sherval, M., Farrugia, D., Threadgold, S. and Coffey, J. (2016).
Local Attitudes to Changing Land Use ‐ Narrabri Shire. Full Report. Newcastle, NSW: The
University of Newcastle, NSW Department of Primary Industries.
Australian Bureau of Agricultural and Resource Economics and Sciences (ABARES) (2019). About
my region – South‐East South Australia. Viewed 23 September 2019,
<http://www.agriculture.gov.au/abares/research‐topics/aboutmyregion/sa‐south‐east>
Australian Bureau of Statistics (ABS) (2016). TableBuilderViewed 12 September 2019
https://www.abs.gov.au/census
Beach Energy (2019). Otway Basin South Australia. Viewed 21 October 2019
<https://www.beachenergy.com.au/sa‐otway‐basin/>
Curran, G. (2017). Social licence, corporate social responsibility and coal seam gas: framing the
new political dynamics of contestation. Energy Policy, 101, 427‐435.
doi:10.1016/j.enpol.2016.10.042
Department of Energy and Mining (DEM) (2019a). Historical Highlights. Viewed 21 October 2019
<http://www.energymining.sa.gov.au/petroleum/exploration_and_development/historical_
highlights>
Department of Energy and Mining (DEM) (2019b). Holders of Petroleum and Geothermal
Tenements in South Australia. Current at September 2019. Viewed 21 October 2019
<https://sarigbasis.pir.sa.gov.au/WebtopEw/ws/samref/sarig1/image/DDD/ISP01.pdf> (See
page 39)
GISERA (Gas Industry Social and Environmental Research Alliance) (2019). Research on
conventional gas in South East South Australia: Social and economic factsheet, February
2019, https://gisera.csiro.au/project/assessing‐the‐value‐of‐locally‐produced‐conventional‐
gas‐in‐sas‐south‐east/
Grubert, E., & Skinner, W. (2017). A town divided: Community values and attitudes towards coal
seam gas development in Gloucester, Australia. Energy Research and Social Science, 30, 43‐
52. doi:10.1016/j.erss.2017.05.041
Gunningham, N., Kagan, R. A., & Thornton, D. (2004). Social license and environmental protection:
why businesses go beyond compliance. Law & Social Inquiry, 29(2), 307‐341.
McCrea, R. (2014) Modelling effects of intervening variables using path analysis, In R. J. Stimson
(Ed) Handbook for Spatially Integrated Social Science Research Methodology, Edward Elgar
McCrea, R., Walton, A. and Leonard, R., (2014). A conceptual framework for investigating
community wellbeing and resilience. Rural Society, 23 (3), 270‐282.

Community wellbeing and local attitudes to conventional gas development in the South‐East of South Australia | 77
McCrea, R., Walton, A. and Leonard, R. (2019). Rural communities and unconventional gas
development: What’s important for maintaining subjective community wellbeing and
resilience over time? Journal of Rural Studies, 68, 87‐99.
Measham, T.G. and Zhang, A. (2019). Social licence, gender and mining: Moral conviction and
perceived economic importance. Resources Policy, Vol 61, pp 363‐368
Moffat, K., & Zhang, A. (2014). The paths to social licence to operate: An integrative model
explaining community acceptance of mining. Resources Policy, 39, 61‐70.
The Advertiser (April 23 2018). Beach Energy plans new $22.6m gas plant in South East SA
Walton, A. and McCrea, R. (2017). Community wellbeing and local attitudes to coal seam gas
development Social Baseline Assessment: Narrabri project ‐ Phase 3 Survey report. Australia:
CSIRO.
Walton, A. and McCrea, R. (2018). Trends in community wellbeing and local attitudes to coal seam
gas development ‐ 2014 – 2016 ‐ 2018: Western Downs and Eastern Maranoa regions,
Queensland, Survey report. Brisbane, Australia CSIRO. https://gisera.csiro.au/project/trends‐
in‐community‐wellbeing‐and‐attitudes‐to‐csg‐development‐survey‐3/
Vintage Energy (2017). Vintage Energy/Rawson Oil and Gas Joint Venture awarded almost $5
million for gas exploration. Viewed 21 October 2019,
<http://www.vintageenergy.com.au/news/vintage‐energyrawson‐oil‐and‐gas‐joint‐venture‐
awarded‐almost‐million‐for‐gasexploration‐124.html>
World Oil (2018). Beach Energy discovers new gas field in Australia's Otway basin. Viewed 21
October 2019 http://www.worldoil.com/news/2018/1/11/beach‐energy‐discovers‐new‐gas‐
field‐in‐australias‐otway‐basin
Zhang, A., Measham, T., & Moffat, K. (2018). Preconditions for social licence: The importance of
information in initial engagement. Journal of Cleaner Production, 172(Supplement C), 1559‐
1566. doi: https://doi.org/10.1016/j.jclepro.2017.10.323
Zhang, A., & Moffat, K. (2015). A balancing act: The role of benefits, impacts and confidence in
governance in predicting acceptance of mining in Australia. Resources Policy, 44, 25‐34.
doi:10.1016/j.resourpol.2015.01.001

78 | CSIRO Australia’s National Science Agency

Community wellbeing and local attitudes to conventional gas development in the South‐East of South Australia | 79
80 | CSIRO Australia’s National Science Agency
As Australia’s national science agency and innovation catalyst, CSIRO is solving the greatest challenges through innovative science and technology.
CSIRO. Unlocking a better future for everyone.
Contact us
1300 363 400 +61 3 9545 2176 [email protected] csiro.au
For further information
Land and Water Andrea Walton +61 7 3833 5675 [email protected] Land and Water Rod McCrea +61 7 3833 5677 [email protected] https://gisera.csiro.au/research/social‐and‐economic‐impacts‐and‐opportunities/