compaction localization in porous sandstones: spatial ... · compaction localization in porous...
TRANSCRIPT
Compaction localization in porous sandstones: spatial evolution of
damage and acoustic emission activity
Patrick Bauda,*, Emmanuelle Kleina, Teng-fong Wongb
aInstitut de Physique du Globe (CNRS/ULP), 5 rue Descartes, 67084 Strasbourg, FrancebDepartment of Geosciences, State University of New York at Stony Brook, Stony Brook, NY 11794-2100, USA
Received 13 March 2003; received in revised form 8 September 2003; accepted 11 September 2003
Abstract
The coupled development of compaction and strain localization may significantly impact the stress field, strain partitioning and fluid
transport. To investigate the phenomenon of compaction localization, mechanical deformation and microstructural observations were
conducted on the Darley Dale, Rothbach, Berea, Bentheim and Diemelstadt sandstones with porosities ranging from 13 to 24%. The
constitutive behavior, failure mode, acoustic emission (AE) activity and spatial distribution of damage were investigated. While our
observations reveal a broad spectrum of geometric complexity associated with failure modes, two end-members can be distinguished: shear
bands at relatively high angles and arrays of discrete compaction bands subperpendicular to the maximum compression direction,
respectively. A hybrid localization mode involving high-angle shear bands and diffuse compaction bands was observed in sandstones with
intermediate porosities. The discrete compaction bands in our laboratory samples are qualitatively similar to localization structures observed
in the field. Whereas the development of high-angle shear bands is characterized by the continuous accumulation of AE, discrete bands are
associated with episodic surges in AE that are characterized by an overall strain hardening trend punctuated by episodic stress drops.
q 2003 Elsevier Ltd. All rights reserved.
Keywords: Compaction bands; Sandstone; Acoustic emissions; Localization; Microstructure
1. Introduction
Strain localization occurs on all scales, from small
laboratory samples up to crustal fault zones. Since localized
deformation can significantly influence the stress field,
strain partitioning and fluid transport, it is important to have
a fundamental understanding of the mechanics of strain
localization in rock. Shear and extensile discontinuities in
the forms of faults and joints have been investigated quite
thoroughly in the field and laboratory. These phenomena are
accompanied by dilatancy, and accordingly attention has
focused on strain localization that occurs in a dilatant rock.
In contrast the development of localized failure in a
compactant rock has not been studied systematically until
recently.
Indeed there may be a misconception that a compactant
rock does not fail in a localized mode. However, recent
geologic (Mollema and Antonellini, 1996) and laboratory
(DiGiovanni et al., 2000; Olsson and Holcomb, 2000; Klein
et al., 2001) studies have documented the occurrence of
strain localization in compactant porous sandstones. The
localized failure mode can be in the forms of conjugate
shear or compaction bands oriented at relatively high angles
(up to 908) to the maximum compression (s1) direction.
Reassessment of bifurcation theory (Olsson, 1999; Issen and
Rudnicki, 2000) and more extensive laboratory and
microstructural investigations demonstrate the occurrence
of such compaction localization phenomena in sandstones
(with porosities ranging from 13 to 28%), generally
associated with stress states in the transitional regime
from brittle faulting to cataclastic flow (Wong et al., 2001).
Previous studies have focused on the mechanical
behavior of porous sandstones in the two end-members of
brittle faulting and cataclastic flow (Handin et al., 1963;
Schock et al., 1973; Wong et al., 1997; Baud et al., 2000;
Besuelle et al., 2000). Under low effective pressure, damage
is localized along a shear band, while the material under-
goes dilatancy and strain softening (Menendez et al., 1996;
Mair et al., 2000; Wu et al., 2000; Besuelle et al., 2003;
0191-8141/$ - see front matter q 2003 Elsevier Ltd. All rights reserved.
doi:10.1016/j.jsg.2003.09.002
Journal of Structural Geology 26 (2004) 603–624
www.elsevier.com/locate/jsg
* Corresponding author. Tel.: þ33-3-902-40083; fax: þ33-3-902-40125.
E-mail address: [email protected] (P. Baud).

El Bied et al., 2002). At higher effective pressure, the
material compacts and hardens with damage distributed
homogeneously in the samples.
The spatial distribution of damage in both regimes was
studied in detail at different stages of the deformation by
Menendez et al. (1996) and Wu et al. (2000) on Berea and
Darley Dale sandstones, respectively. In the brittle regime,
axial intragranular cracking and shear rupture of cemented
grain contacts were observed in the rocks prior to failure. In
the cataclastic flow regime, grain crushing and pore collapse
were identified as the dominant mechanisms operative
during cataclastic flow. In this study, we adopt a similar
methodology to study four porous sandstones, focusing on
several key questions on compaction localization.
While Wong et al. (2001) have documented that the
stress states for the onset of compaction localization are
associated with the transitional regime between brittle
faulting and cataclastic flow, there have not been any
systematic investigations of the spatial evolution of damage.
How do the localized failure modes accommodate the
progressive accumulation of deformation? The preliminary
studies have documented two distinct modes of localization:
once initiated a localized band may widen to develop a
diffuse band of damage to accommodate the cumulative
strain (Olsson, 1999), or alternatively further compaction is
accommodated by the initiation of additional discrete bands
that remain relatively narrow (Klein et al., 2001). What are
the micromechanical processes associated with these
localization modes and how are they related to the
microstructure? How do the microstructure and geometric
attributes of compaction bands in these laboratory-deformed
samples compare with field observations? Acoustic emis-
sion (AE) measurements have proved to be an effective tool
for characterizing the micromechanics. Damage processes
involved with grain crushing and pore collapse are
manifested by intense AE activity (Wong et al., 1997)
while the development of localization is associated with
spatial clustering of AE events (Olsson and Holcomb,
2000). Do the development of diffuse and discrete bands
associated have distinct AE signatures?
To address these questions, we investigated the mech-
anical behavior, localized failure mode and deformation
microstructure of five sandstones with porosities ranging
from 13 to 24%. The samples were deformed at stress states
at the brittle–ductile transition, and we characterized
quantitatively the evolution of porosity, AE activity, as
well as microcrack density and its anisotropy in the failed
samples. The mechanical and microstructural data are
compared with field observations and theoretical
predictions.
2. Experimental methodology
Darley Dale, Rothbach, Berea, Bentheim and Diemel-
stadt sandstones (with nominal porosities of 13, 20, 21, 23
and 24%, respectively) are used in this study. The Darley
Dale, Rothbach and Berea sandstones were from the same
block studied by Wong et al. (1997), and the Bentheim
sandstone was from the same block studied by Wong et al.
(2001). The petrophysical properties are compiled in
Table 1.
The samples were cored perpendicular to their sedimen-
tary bedding and then ground to a cylindrical shape, with
diameter of 18.4 mm and length of 38.1 mm. The Berea,
Darley Dale, Diemelstadt and Rothbach sandstones samples
were saturated with distilled water and deformed under fully
drained conditions at a fixed pore pressure of 10 MPa.
Adjustment of a pressure generator kept the pore pressure
constant, and the pore volume change was recorded by
monitoring the piston displacement of the pressure gen-
erator with a displacement transducer (DCDT). The porosity
change was calculated from the ratio of the pore volume
change to the initial bulk volume of the sample. For
Bentheim sandstone, the nominally dry samples were dried
in vacuum for a week at 80 8C. Longitudinal and transverse
strains were measured by two electric resistance strain
gauges (Baud et al., 2000). The volumetric strain was
calculated from the strain gauge data by summing the axial
strain and twice the transverse strain.
The sandstone samples were deformed at a nominal axial
strain rate of 1.3 £ 1025 s21 in the conventional triaxial
configuration at room temperature and under confining
pressures ranging from 40 to 395 MPa (Wong et al., 1997;
Baud et al., 2000). To record AE activity during triaxial
experiments, we used a piezoelectric transducer mounted on
the spacer attached to the jacketed sample. The AE signals
were conditioned by a preamplifier (gain 40 dB, frequency
response 1.5 kHz–5 MHz). To distinguish AE events from
electric noise, a discriminator was used to check the
amplitude and oscillational characteristics of the incoming
signal. (See Zhang et al. (1990) for details.)
Samples at different stages of deformation were unloaded
and retrieved from the pressure vessel. The deformed
samples were first impregnated with epoxy and then sawed
along a plane parallel to the axial direction to prepare
petrographic thin-sections. Using optical microscopy the
damage states in the thin-sections were characterized. As
described later some of the samples failed locally along
diffuse bands, with intense damage at the center of a band
that decreased laterally. To identify such a diffuse band it is
necessary to resolve in fine detail the spatial distribution of
crack density. For each of these samples an area of
16.3 £ 35.4 mm2 centrally located in the thin section was
divided into 10 £ 29 subregions, each of which had an area
of 1.63 £ 1.22 mm2. A stereological technique (Wu et al.,
2000) was used to measure the crack densities (in the two
orthogonal directions parallel and perpendicular to s1). In
each subregion a test array made up of five lines (spaced
0.24 mm apart) in the axial direction and another five lines
in the orthogonal direction (spaced 0.33 mm apart) was
used. Reflected images were acquired at a magnification of
P. Baud et al. / Journal of Structural Geology 26 (2004) 603–624604
100 £ , and we counted the number of crack intersections
with the test array.
We denote the linear intercept density (number of crack
intersections per unit length) for the array oriented parallel
to s1 by PkL, and that for the perpendicular array by P’
L . For
each of the 290 subregions these two stereological
parameters (PkL and P’
L ) provide a quantitative measure of
the crack density and anisotropy. Since the spatial
distribution of damage is approximately axisymmetric in a
triaxially compressed sample, the crack surface area per unit
volume (Sv) is given by:
Sv ¼p
2P’
L þ 2 2p
2
� �Pk
L ð1Þ
and the anisotropy of crack distribution can be characterized
by the stereological parameter:
V23 ¼P’
L 2 PkL
P’L þ 4=p2 1ð ÞPk
L
ð2Þ
that represents the ratio between the surface area of cracks
parallel to s1 and the total crack surface area (Underwood,
1970; Wong, 1985).
3. Mechanical data
In this paper we will use the convention with the
compressive stresses and compactive strains taken as
positive. We will denote the maximum and minimum
(compressive) principal stresses by s1 and s3, respectively.
The pore pressure will be denoted by Pp, and the difference
Pc 2 Pp between the confining pressure (Pc ¼ s2 ¼ s3) and
pore pressure will be referred to as the ‘effective pressure’
Peff. The effective mean stress (s1 þ 2s3)/3 2 Pp will be
denoted by P and the differential stress s1 2 s3 by Q.
We performed a series of experiments through the
brittle–ductile transition. The conditions were chosen such
that dilatancy was absent in all these experiments. To
underscore the compactive failure behavior, we plot in Fig.
1a–d the effective mean stress as a function of porosity
change. The nonhydrostatic and hydrostatic loadings are
coupled in a conventional triaxial compression experiment.
If the axial stress increases by an increment Ds1 while the
confining and pore pressures are maintained constant, then
the effective mean stress P and differential stress Q would
increase by the amounts Ds1/3 and Ds1, respectively. If
porosity change is elastic then it is solely controlled by the
hydrostatic stresses and independent of the differential
stress, and therefore the triaxial data (solid curves) in Fig. 1
should coincide with the hydrostat (dashed curves).
Any deviation from the hydrostat would imply that the
porosity change in a triaxial compression experiment
depends on not only the effective mean stress, but also the
deviatoric stresses. This in turn implies the onset of inelastic
yield. In all the experiments shown in Fig. 1 the triaxial
curve for a given effective pressure coincided with the
hydrostat up to a critical stress state (indicated by C p),
beyond which there was an accelerated decrease in porosity
in comparison with the hydrostat. At stress levels beyond
C p the deviatoric stress field provided a significant
contribution to the compactive strain, and this phenomenon
of inelastic yield by ‘shear-enhanced compaction’ (Wong
et al., 1997) is attributed to the inception of grain crushing
and pore collapse in the sandstone (Menendez et al., 1996).
Table 2 compiles data of the compactive yield stress C p for
the samples used in this study.
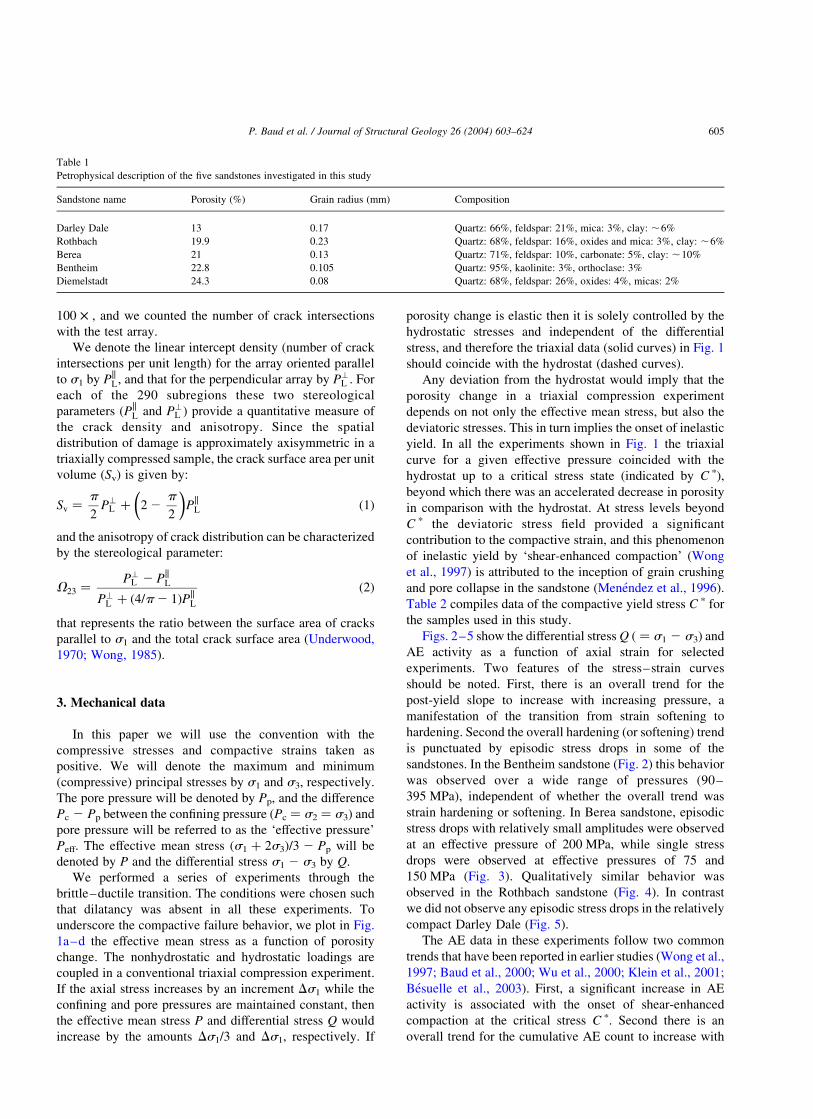
Figs. 2–5 show the differential stress Q ( ¼ s1 2 s3) and
AE activity as a function of axial strain for selected
experiments. Two features of the stress–strain curves
should be noted. First, there is an overall trend for the
post-yield slope to increase with increasing pressure, a
manifestation of the transition from strain softening to
hardening. Second the overall hardening (or softening) trend
is punctuated by episodic stress drops in some of the
sandstones. In the Bentheim sandstone (Fig. 2) this behavior
was observed over a wide range of pressures (90–
395 MPa), independent of whether the overall trend was
strain hardening or softening. In Berea sandstone, episodic
stress drops with relatively small amplitudes were observed
at an effective pressure of 200 MPa, while single stress
drops were observed at effective pressures of 75 and
150 MPa (Fig. 3). Qualitatively similar behavior was
observed in the Rothbach sandstone (Fig. 4). In contrast
we did not observe any episodic stress drops in the relatively
compact Darley Dale (Fig. 5).
The AE data in these experiments follow two common
trends that have been reported in earlier studies (Wong et al.,
1997; Baud et al., 2000; Wu et al., 2000; Klein et al., 2001;
Besuelle et al., 2003). First, a significant increase in AE
activity is associated with the onset of shear-enhanced
compaction at the critical stress C p. Second there is an
overall trend for the cumulative AE count to increase with
Table 1
Petrophysical description of the five sandstones investigated in this study
Sandstone name Porosity (%) Grain radius (mm) Composition
Darley Dale 13 0.17 Quartz: 66%, feldspar: 21%, mica: 3%, clay: ,6%
Rothbach 19.9 0.23 Quartz: 68%, feldspar: 16%, oxides and mica: 3%, clay: ,6%
Berea 21 0.13 Quartz: 71%, feldspar: 10%, carbonate: 5%, clay: ,10%
Bentheim 22.8 0.105 Quartz: 95%, kaolinite: 3%, orthoclase: 3%
Diemelstadt 24.3 0.08 Quartz: 68%, feldspar: 26%, oxides: 4%, micas: 2%
P. Baud et al. / Journal of Structural Geology 26 (2004) 603–624 605

strain, a manifestation of the progressive increase of
damage.
However there is also an important attribute of the AE
activity (not evident in the cumulative count presented in
earlier studies), which we will highlight here by differ-
entiating the cumulative count to obtain the AE rate. Two
distinct types of activity can be identified on the basis of the
AE rate.
† In experiments on the Bentheim, Rothbach and Berea
sandstones that showed episodic stress drops, each of the
stress drops was associated with an appreciable surge in
AE rate (Figs. 2–4). A larger stress drop is associated
with a more significant surge in AE rate. Such activity
associated with multiple pulses of AE events and peaks
in the AE rate will be referred to as ‘p-type’. As
discussed below our microstructural observations
showed that p-type AE activity is associated with the
spatial clustering of damage in zones aligned perpen-
dicular to s1.
† In samples that underwent compactive failure without
any stress drops (Figs. 3–5) a monotonic decrease of
AE rate was usually observed after an initial surge at
the critical stress C p. Such AE activity will be referred
to as the ‘m-type’. Similar AE activity has also been
observed in experiments under high confinement when
compactive failure occurred without any development
of strain localization. Our microstructural observations
showed that m-type AE activity in samples that failed
by compaction localization is associated with the
development of diffuse damage zones at relatively
high angles to s1.
Preliminary experiments were also conducted to inves-
tigate the development of compaction localization in the
Fig. 1. (a) Effective mean stress versus porosity reduction of Darley Dale sandstone. For reference, the hydrostat is shown as a dashed curve. (b) Effective mean
stress versus porosity reduction of Berea sandstone. (c) Effective mean stress versus porosity reduction of Rothbach sandstone. (d) Mean stress as a function of
volumetric strain of nominally dry Bentheim sandstone.
P. Baud et al. / Journal of Structural Geology 26 (2004) 603–624606

Table 2
Mechanical data of the samples investigated in this study
Effective pressure
(MPa)
Compactive yield stress (C p) Maximum axial
strain (%)
Acoustic emission
activity
Comments on failure modes
Differential stress:
Q ¼ s1 2 s3 (MPa)
Effective mean stress:
P ¼ (s1 þ 2s3)/3 2 Pp (MPa)
Darley Dale sandstone
80 251 164 3 m-type Conjugate high-angle shear bands
90 264 178 2.66 m-type Conjugate high-angle shear bands
95 269 186 3.75 m-type Conjugate high-angle shear bands
110 270 200 3.96 m-type Cataclastic flow
Berea sandstone
50 182 111 2.5 m-type Conjugate high-angle shear bands
60 179 120 2.66 m-type Conjugate high-angle shear bands
75 184 137 2.4 m-type Conjugate high-angle shear bands
90 190 154 2.4 m-type Conjugate high-angle shear bands
150 191 214 3.2 p-type Diffuse compaction bands
200 178 260 3.6 p-type Discrete and diffuse compaction bands
Rothbach sandstone
40 112 77 2.6 m-type Conjugate high-angle shear bands
55 117 95 3 m-type Conjugate high-angle shear bands
90 122 130 4.4 m-type Conjugate high-angle shear bands
130 125 172 3.6 p-type Diffuse compaction bands
Bentheim sandstone
90 239 170 2.9 p-type Discrete compaction bands þ high-angle shear bands
120 245 202 3.8 p-type Discrete compaction bands
150 240 230 2.2a p-type Discrete compaction bands
180 230 257 4.4 p-type Discrete compaction bands
250 191 314 7a p-type Discrete compaction bands
300 170 357 3.1 p-type Discrete compaction bands
350 136 396 9.5a p-type Discrete compaction bands
395 90 425 3 p-type Discrete compaction bands
Diemelstadt sandstone
80 79 107 3.5 m-type Diffuse compaction bands
160 28 170 4 p-type Discrete compaction bands
a The microstructure of this sample was not studied.
P.
Ba
ud
eta
l./
Jou
rna
lo
fS
tructu
ral
Geo
log
y2
6(2
00
4)
60
3–
62
46
07

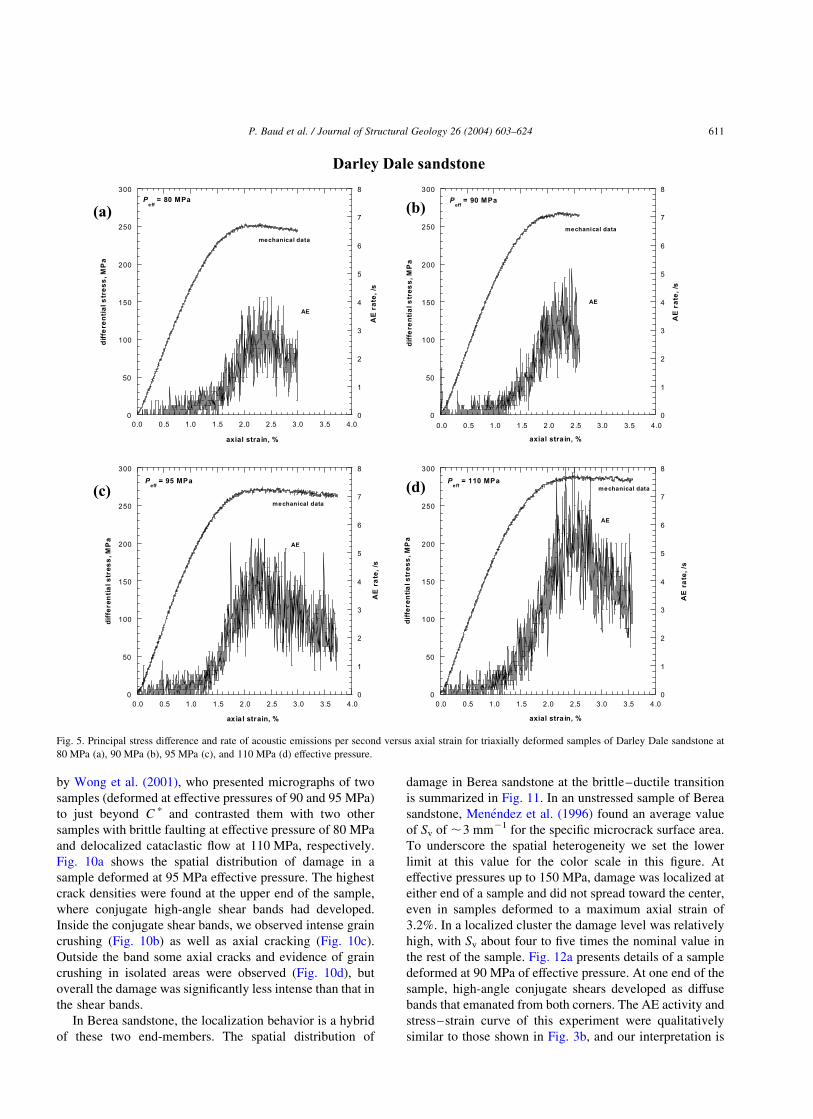
Diemelstadt sandstone at effective pressures of 80 and
160 MPa. The mechanical data and AE activity are shown in
Fig. 6.
4. Microscopic observations and quantitative evaluation
of damage
The preliminary data of Wong et al. (2001) demonstrate
that compaction localization develops in stress states
associated with the brittle–ductile transition. Mechanical
data (Wong et al., 1997; Klein et al., 2001) as well as
microstructural observations of the brittle and ductile end-
members (Menendez et al., 1996; Wu et al., 2000; Wong
et al., 2001; Besuelle et al., 2003) have guided us in
identifying the pressure ranges that correspond to the
transitional regime of interest (Table 2).
For each pressure condition a sample was deformed to
beyond the onset of shear-enhanced compaction, and the
microstructure in the deformed sample was then investi-
gated. The maximum axial strain attained in each sample is
compiled in Table 2. It is of importance to investigate not
only the onset but also the development of compaction
localization, which would require detailed microstructural
observations on a suite of several samples compacted to
different stages at the same pressure condition. While it is
beyond the scope of the present study to undertake such an
involved endeavor for all five sandstones, we have focused
on the initial development of compaction localization, with
the exception of the Bentheim sandstone for which the
development of localization as a function of strain was also
investigated. Experimental conditions under which the
samples were deformed are compiled in Table 2, with
comments on the type of AE activity and failure mode.
Damage evolution is quantified by the spatial distribution
of microcrack density. The development of an elongate,
connected cluster of anomalous damage (manifested by
high crack density) that extends over several grains is
considered as a proxy for compaction localization. Since our
observations have revealed a broad spectrum of geometric
attributes associated with compaction localization, it is
important to first define several terms adopted in later
discussion.
† A localized structure that is subperpendicular to the
maximum principal stress s1 will be referred to as a
‘compaction band’(Olsson, 1999; Issen and Rudnicki,
2000). A localized structure that subtends a relatively
high angle (say 45–808) to s1 will be referred to as a
‘high-angle shear band’. It should be noted that the latter
is akin to a ‘compactive shear band’ as described by
Besuelle (2001).
† A localized tabular structure of only a few (say #3)
grains thick will be referred to as a ‘discrete band’. A
structure with a thickness of many more grains will be
referred to as a ‘diffuse band’. High-angle shear bands
commonly develop as conjugate sets of diffuse bands.
A compaction band may be discrete or diffuse. Discrete
compaction bands commonly develop as a subparallel
array, with the cumulative strain accommodated by the
initiation of additional discrete bands. In contrast, a
diffuse compaction band accommodates the cumulative
strain by the lateral propagation of damage.
5. Two end-members of compaction localization
Our microstructural observations have revealed a
broad spectrum of geometric complexity associated with
Fig. 2. Principal stress difference and rate of acoustic emissions as AE per second versus axial strain for triaxially deformed dry samples of Bentheim sandstone
at 120 MPa (a) and 300 MPa (b) of confining pressure. Principal stress s1 was along the axial direction.
P. Baud et al. / Journal of Structural Geology 26 (2004) 603–624608

compaction localization, with two end-members rep-
resented by the Bentheim and Darley Dale sandstones. As
one of the end-members the Bentheim sandstone is
distinguished by three localization characteristics. First,
compaction localization was observed over the widest range
of pressure (90–395 MPa). Second, the stress–strain curve
is punctuated by episodic stress drops, accompanied by
p-type AE activity. Third, subparallel arrays of discrete
compaction bands were commonly observed (Table 2). This
localization mode was documented by Wong et al. (2001),
who presented micrographs of four Bentheim sandstone
samples (deformed at confining pressures of 90, 120, 180
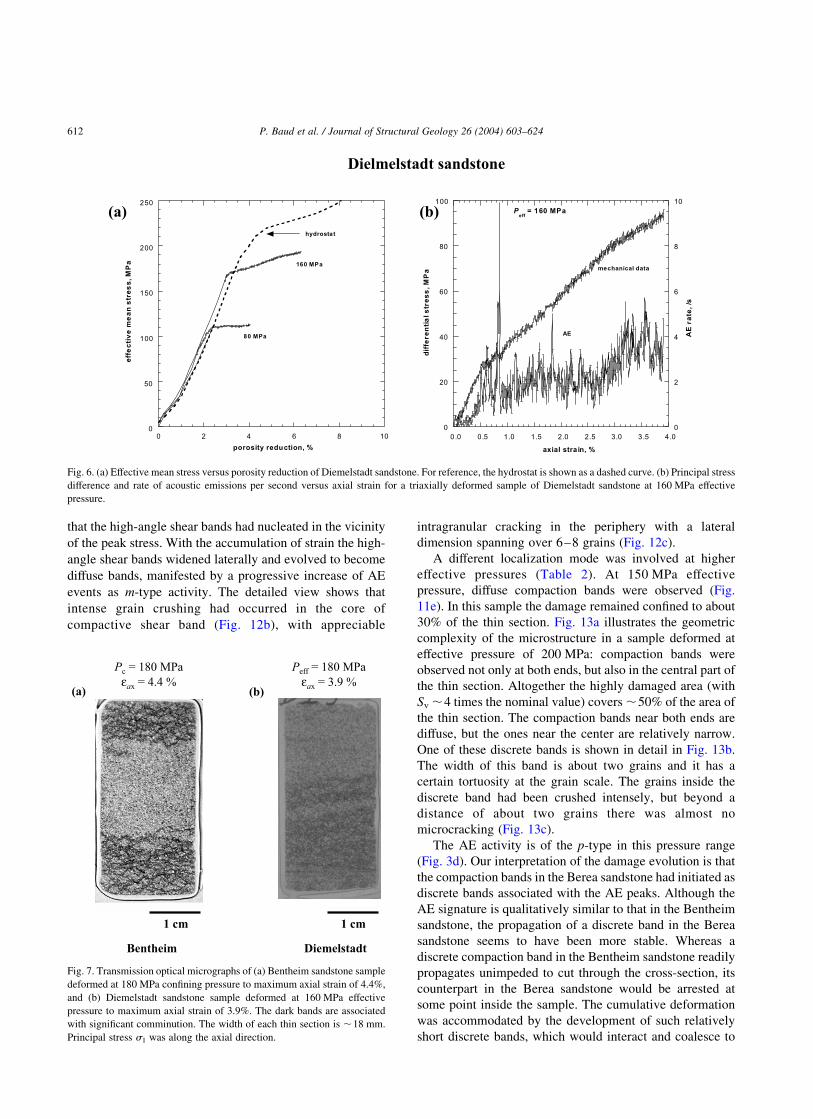
and 300 MPa) to just beyond C p. Fig. 7a shows the
microstructure of such a sample deformed to an axial strain
of 4% at 180 MPa confining pressure.
Here we also present additional microstructure that
illustrates the evolution of localization with strain. Fig. 8
presents the micrographs of four samples deformed at
300 MPa confining pressure to axial strains of 1.4–6.0%.
The onset of shear-enhanced compaction was manifested
by discrete compaction bands that initiated in short
segments near either end of the sample (Fig. 8a). With
increasing strain the discrete bands cut through the cross-
section of the sample, and as the cumulative number of
bands increased, they clustered to constitute two
subparallel arrays that spread towards the center of the
sample (Fig. 8b and c). At 6% axial strain the discrete
compaction bands were pervasive in the sample (Fig.
8d). Mechanical tests to higher strain showed that
episodic stress drops and AE surges were inhibited
beyond ,6% axial strain. That the numbers of discrete
bands, stress drop events and AE peaks are correlated
implies that an individual stress drop event arises from
the unstable propagation of a discrete compaction band
Fig. 3. Principal stress difference and rate of acoustic emissions per second versus axial strain for triaxially deformed samples of Berea sandstone at 55 MPa (a),
75 MPa (b), 150 MPa (c), and 200 MPa (d) effective pressure.
P. Baud et al. / Journal of Structural Geology 26 (2004) 603–624 609

normal to s1, with intensive grain-scale cracking that
induces a concomitant surge of AE activity.
Although a discrete compaction band has an overall
direction subperpendicular to s1, it appears tortuous on the
grain scale under the microscope. A few of them intersect
each other, rendering it difficult to unambiguously deter-
mine the number of such discrete bands in the highly
strained samples. The detailed view in Fig. 9 shows that
typically the average width of a discrete compaction band is
,0.5 mm, comparable with the grain size. Inside the band,
the grains had been crushed to form very small fragments,
so the bands can be identified by relatively dark areas of
intense comminution visible by eye in a thin section. In the
Bentheim sandstone the damage in the discrete bands is so
intense that it is very difficult to determine quantitatively
the crack densities except at very high magnification.
Outside the bands, few cracks were observed and the
damage was negligible beyond a lateral distance of about
two or three grains.
Our preliminary study of Diemelstadt sandstone indi-
cates that its localization mode is similar to that of Bentheim
sandstone. Fig. 7b shows the development of discrete
compaction bands in a saturated sample of the Diemelstadt
sandstone deformed to an axial strain of 3.9% at effective
pressure of 160 MPa. The shear-enhanced compaction was
accompanied by small stress drops and p-type AE activity
(Fig. 6).
The other end-member of compaction localization is
represented by the Darley Dale sandstone with three distinct
characteristics. First, localization was observed over the
narrowest range of effective pressure (80 – 95 MPa).
Second, the AE activity is of the m-type (Fig. 5). Third,
high-angle shear bands were observed in all our failed
samples (Table 2). This localization mode was documented
Fig. 4. Principal stress difference and rate of acoustic emissions per second versus axial strain for triaxially deformed samples of Rothbach sandstone at 40 MPa
(a), 55 MPa (b), 90 MPa (c), and 130 MPa (d) effective pressure.
P. Baud et al. / Journal of Structural Geology 26 (2004) 603–624610
by Wong et al. (2001), who presented micrographs of two
samples (deformed at effective pressures of 90 and 95 MPa)
to just beyond C p and contrasted them with two other
samples with brittle faulting at effective pressure of 80 MPa
and delocalized cataclastic flow at 110 MPa, respectively.
Fig. 10a shows the spatial distribution of damage in a
sample deformed at 95 MPa effective pressure. The highest
crack densities were found at the upper end of the sample,
where conjugate high-angle shear bands had developed.
Inside the conjugate shear bands, we observed intense grain
crushing (Fig. 10b) as well as axial cracking (Fig. 10c).
Outside the band some axial cracks and evidence of grain
crushing in isolated areas were observed (Fig. 10d), but
overall the damage was significantly less intense than that in
the shear bands.
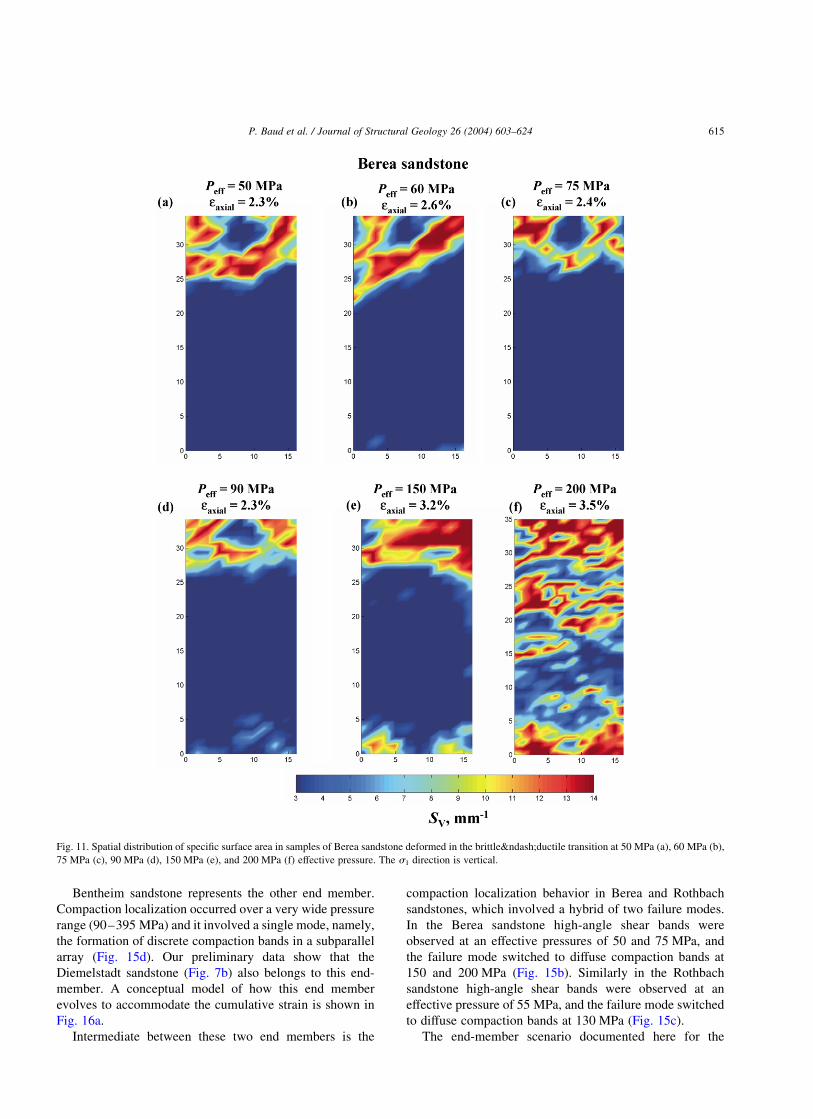
In Berea sandstone, the localization behavior is a hybrid
of these two end-members. The spatial distribution of
damage in Berea sandstone at the brittle–ductile transition
is summarized in Fig. 11. In an unstressed sample of Berea
sandstone, Menendez et al. (1996) found an average value
of Sv of ,3 mm21 for the specific microcrack surface area.
To underscore the spatial heterogeneity we set the lower
limit at this value for the color scale in this figure. At
effective pressures up to 150 MPa, damage was localized at
either end of a sample and did not spread toward the center,
even in samples deformed to a maximum axial strain of
3.2%. In a localized cluster the damage level was relatively
high, with Sv about four to five times the nominal value in
the rest of the sample. Fig. 12a presents details of a sample
deformed at 90 MPa of effective pressure. At one end of the
sample, high-angle conjugate shears developed as diffuse
bands that emanated from both corners. The AE activity and
stress–strain curve of this experiment were qualitatively
similar to those shown in Fig. 3b, and our interpretation is
Fig. 5. Principal stress difference and rate of acoustic emissions per second versus axial strain for triaxially deformed samples of Darley Dale sandstone at
80 MPa (a), 90 MPa (b), 95 MPa (c), and 110 MPa (d) effective pressure.
P. Baud et al. / Journal of Structural Geology 26 (2004) 603–624 611
that the high-angle shear bands had nucleated in the vicinity
of the peak stress. With the accumulation of strain the high-
angle shear bands widened laterally and evolved to become
diffuse bands, manifested by a progressive increase of AE
events as m-type activity. The detailed view shows that
intense grain crushing had occurred in the core of
compactive shear band (Fig. 12b), with appreciable
intragranular cracking in the periphery with a lateral
dimension spanning over 6–8 grains (Fig. 12c).
A different localization mode was involved at higher
effective pressures (Table 2). At 150 MPa effective
pressure, diffuse compaction bands were observed (Fig.
11e). In this sample the damage remained confined to about
30% of the thin section. Fig. 13a illustrates the geometric
complexity of the microstructure in a sample deformed at
effective pressure of 200 MPa: compaction bands were
observed not only at both ends, but also in the central part of
the thin section. Altogether the highly damaged area (with
Sv ,4 times the nominal value) covers ,50% of the area of
the thin section. The compaction bands near both ends are
diffuse, but the ones near the center are relatively narrow.
One of these discrete bands is shown in detail in Fig. 13b.
The width of this band is about two grains and it has a
certain tortuosity at the grain scale. The grains inside the
discrete band had been crushed intensely, but beyond a
distance of about two grains there was almost no
microcracking (Fig. 13c).
The AE activity is of the p-type in this pressure range
(Fig. 3d). Our interpretation of the damage evolution is that
the compaction bands in the Berea sandstone had initiated as
discrete bands associated with the AE peaks. Although the
AE signature is qualitatively similar to that in the Bentheim
sandstone, the propagation of a discrete band in the Berea
sandstone seems to have been more stable. Whereas a
discrete compaction band in the Bentheim sandstone readily
propagates unimpeded to cut through the cross-section, its
counterpart in the Berea sandstone would be arrested at
some point inside the sample. The cumulative deformation
was accommodated by the development of such relatively
short discrete bands, which would interact and coalesce to
Fig. 6. (a) Effective mean stress versus porosity reduction of Diemelstadt sandstone. For reference, the hydrostat is shown as a dashed curve. (b) Principal stress
difference and rate of acoustic emissions per second versus axial strain for a triaxially deformed sample of Diemelstadt sandstone at 160 MPa effective
pressure.
Fig. 7. Transmission optical micrographs of (a) Bentheim sandstone sample
deformed at 180 MPa confining pressure to maximum axial strain of 4.4%,
and (b) Diemelstadt sandstone sample deformed at 160 MPa effective
pressure to maximum axial strain of 3.9%. The dark bands are associated
with significant comminution. The width of each thin section is ,18 mm.
Principal stress s1 was along the axial direction.
P. Baud et al. / Journal of Structural Geology 26 (2004) 603–624612

form the complex and diffuse structures. At effective
pressures beyond 250 MPa, the AE activity is of the m-
type and damage distribution in a failure sample is
delocalized (Menendez et al., 1996).
The hybrid localization behavior we observed in
Berea sandstone is qualitatively similar to that in
Rothbach sandstone. Preliminary microstructural obser-
vations on the latter have been presented by Besuelle
et al. (2003). In Fig. 14 we show a series of
micrographs to illustrate the localization modes.
Between 40 and 90 MPa (Fig. 14a–c), the compaction
localization was predominately by conjugate shear
bands, whereas diffuse compaction bands were observed
at 130 MPa of effective pressure (Fig. 14d).
6. Discussion
6.1. Compaction localization and failure mode in the
brittle–ductile transition: the influence of stress and
porosity
Wong et al. (2001) concluded that localized failure
modes involving compaction bands and high-angle shear
Fig. 8. Transmission optical micrographs of Bentheim sandstone samples deformed at 300 MPa confining pressure after different levels of axial strain: 1.4%
(a), 3.1% (b), 4% (c), and 6% (d). The dark bands are associated with significant comminution. The width of each thin section is ,18 mm. Principal stress s1
was along the axial direction.
Fig. 9. Mosaic of micrograph showing the details of a discrete compaction band. The width of the band is about two grains. Principal stress s1 was along the
axial direction.
P. Baud et al. / Journal of Structural Geology 26 (2004) 603–624 613

bands could develop in sandstones (with porosities ranging
from 13 to 28%) while undergoing shear-enhanced
compaction. They also observed that the phenomenon of
compaction localization is associated with stress states in
the transitional regime from brittle faulting to cataclastic
flow. While these conclusions are corroborated in the
present study, we have also elucidated the influence of
pressure and porosity on the localization modes.
In Fig. 15 we summarize in the stress space the influence
of effective pressure on the brittle–ductile transition and
localization mode in four sandstones. We do not provide a
summary on the Diemelstadt sandstone due to the
preliminary nature of our data at this stage (Fortin et al.,
2003). The open symbols correspond to the peak stress for
samples that fail by brittle faulting. The dark symbols
correspond to the compactive yield stress C p for the onset of
shear-enhanced compaction. Damage maps that indicate the
localization mode are also shown for selected stress states.
In addition to data acquired in this study, we have included
the mechanical and microstructural data of Wong et al.
(1997), Baud et al. (2000), Wu et al. (2000), Klein et al.
(2001), Wong et al. (2001) and Besuelle et al. (2002).
The brittle–ductile transition and localization modes in
the Darley Dale sandstone represent one of the end members
(Fig. 15a). In an experiment at 10 MPa effective pressure the
sample failed by development of a shear band at ,308 to s1,
which is characteristic of the brittle faulting regime. At
effective pressures $110 MPa the samples failed by
distributed cataclastic flow without any indication of strain
localization. In the transitional regime compaction localiz-
ation developed in the form of a high-angle shear band
(,458 to s1) at effective pressure of 80 MPa and conjugate
shear bands at effective pressures of 90 and 95 MPa.
Compaction localization occurs in a very narrow range of
effective pressures and it involves a single mode, namely,
the development of high-angle shear bands.
Fig. 10. (a) Spatial distribution of specific surface area in a sample of Darley Dale sandstone deformed at Peff ¼ 95 MPa. (b) Extensive grain crushing in a
compaction zone. (c) Area where axial cracking dominate. (d) Area outside the compaction zone where damage was important. The s1 direction is vertical.
P. Baud et al. / Journal of Structural Geology 26 (2004) 603–624614
Bentheim sandstone represents the other end member.
Compaction localization occurred over a very wide pressure
range (90–395 MPa) and it involved a single mode, namely,
the formation of discrete compaction bands in a subparallel
array (Fig. 15d). Our preliminary data show that the
Diemelstadt sandstone (Fig. 7b) also belongs to this end-
member. A conceptual model of how this end member
evolves to accommodate the cumulative strain is shown in
Fig. 16a.
Intermediate between these two end members is the
compaction localization behavior in Berea and Rothbach
sandstones, which involved a hybrid of two failure modes.
In the Berea sandstone high-angle shear bands were
observed at an effective pressures of 50 and 75 MPa, and
the failure mode switched to diffuse compaction bands at
150 and 200 MPa (Fig. 15b). Similarly in the Rothbach
sandstone high-angle shear bands were observed at an
effective pressure of 55 MPa, and the failure mode switched
to diffuse compaction bands at 130 MPa (Fig. 15c).
The end-member scenario documented here for the
Fig. 11. Spatial distribution of specific surface area in samples of Berea sandstone deformed in the brittle–ductile transition at 50 MPa (a), 60 MPa (b),
75 MPa (c), 90 MPa (d), 150 MPa (e), and 200 MPa (f) effective pressure. The s1 direction is vertical.
P. Baud et al. / Journal of Structural Geology 26 (2004) 603–624 615

Darley Dale sandstone (Fig. 15a) corresponds to the
conventional conception of how failure mode evolves
during the brittle–ductile transition (Bernabe and Brace,
1990; Mair et al., 2002), involving high-angle conjugate
shear bands that may readily appear on the exterior surface
of a failed sample. Since compaction band formation was
inhibited in the Darley Dale sandstone that has the lowest
porosity, our data suggest that compaction bands develop
preferentially in more porous sandstones. To elucidate the
development of compaction bands in the other sandstones it
was necessary to conduct detailed AE and microstructural
observations (DiGiovanni et al., 2000; Olsson and Hol-
comb, 2000; Wong et al., 2001). Our microstructural
observations not only document the pervasive occurrence
of compaction bands as a mode of localization, but also
highlight the geometric complexity of such bands, which
may propagate as discrete or diffuse entities.
6.2. Bifurcation analysis, damage evolution and AE activity
The mechanics of compaction localization can be
analyzed as a bifurcation in the constitutive response of a
porous medium. Critical conditions for the inception of
localization and orientations of the compactive shear and
Fig. 12. (a) Spatial distribution of specific surface area in a sample of Berea sandstone deformed at Peff ¼ 90 MPa. (b) Extensive grain crushing in a compaction
zone. (c) Area in the periphery of the compaction zone where axial cracking dominate. (d) No damage outside the compaction zone. The s1 direction is vertical.
P. Baud et al. / Journal of Structural Geology 26 (2004) 603–624616

compaction bands can be derived as functions of the
constitutive parameters. The simplest approach is to
adopt a constitutive relation whereby the yield envelope
and inelastic volumetric change can be characterized by
the pressure-sensitivity parameter m and dilatancy factor
b, respectively (Rudnicki and Rice, 1975; Olsson, 1999;
Besuelle, 2001). For this model with one yield surface,
Issen and Rudnicki (2000) derived the general condition
bþ m # 2ffiffi3
pfor inception of compaction band under
axisymmetric compression. Wong et al. (2001) observed
that the mechanical data on sandstone samples that
failed by compaction localization satisfy the conditions
2ffiffi3
p=2 , b , 0 and m . 2
ffiffi3
p=2, which disagree with
the theoretical prediction for the constitutive model with
one yield surface. They attributed the discrepancy to the
inadequacy of this constitutive model, and argued that
since failure in the transitional regime involves the
partitioning of damage between at least two mechanism
(axial microcracks that may grow and coalesce to form
a shear fault, and pores that collapse while grains are
crushed) it may be necessary to use a more elaborate
model such as that formulated by Issen (2002) that
incorporates two yield surfaces. Predictions of this
recent model are in better agreement with the mechan-
ical data of Wong et al. (2001) for the Berea, Bentheim
and Darley Dale sandstones.
While bifurcation analysis provides a very useful
framework for understanding the mechanics of compaction
localization, it has an intrinsic limitation that the analysis
applies only to the onset of constitutive instability in an
initially homogeneous material and does not provide any
information on the subsequent propagation behavior or
geometric attributes of the localization structures. In
particular this continuum approach cannot explain why
compaction bands may develop as discrete or diffuse
structures.
An explanation may lie in the microstructure. Discrete
compaction bands have primarily been observed in highly
porous materials with relatively homogeneous and regular
pore structures. In cellular solids such as honeycombs
(e.g. Papka and Kyriakides, 1999) and metal foams (e.g.
Bastawros et al., 2000) subparallel arrays of discrete
compaction bands have been observed to develop while
the stress–strain curves registered episodic stress drops. The
I ! II transformation in ice occurs at critical stress states
(Durham et al., 1983) qualitatively similar to the compac-
tive yield envelopes shown in Fig. 15. This transformation is
associated with a significant volume reduction (of ,21%)
Fig. 13. (a) Spatial distribution of specific surface area in a sample of Berea sandstone deformed at Peff ¼ 200 MPa. This sample presented diffused compaction
zones as well as discrete compaction bands (b) mosaic of micrographs showing the transition between a discrete compaction band and an undamaged zone. (c)
Some areas of the sample remained undamaged. The s1 direction is vertical.
P. Baud et al. / Journal of Structural Geology 26 (2004) 603–624 617

and it has been observed to involve discrete compaction
bands (Kirby et al., 1992). In the present study arrays of
discrete compaction bands were observed only in the two
most porous sandstones.
However, porosity may not be the only microstructural
attribute that promotes the development of discrete
compaction bands. In the Castlegate sandstone Olsson and
Holcomb’s (2000) AE data indicate that the mode of
compaction localization involves diffuse and not discrete
bands, even though it has an initial porosity of 28%, which
is higher than those of the five sandstones investigated in
this study. Since rather limited stress conditions were
considered in their study, it is unclear whether discrete
compaction bands may actually develop in Castlegate
sandstone under other pressure conditions associated with
the brittle–ductile transition. Klein et al. (2001) speculated
that discrete compaction band is predominant in the
Bentheim sandstone possibly due to its relatively homo-
geneous mineralogy (with 95% quartz) and well-sorted
grain sizes. However we document in this study that the
mode of compaction localization in the Diemelstadt
sandstone is very similar to the Bentheim sandstone, and
since the former has a modal composition with 26% feldspar
(Table 1), this implies that mineralogical homogeneity may
not be necessary for the development of discrete compaction
bands. Other than having similar porosities, both Bentheim
and Diemelstadt sandstones have a relatively narrow grain
size distribution (Klein, 2002). If the propagation of discrete
bands over long distances are readily arrested in an
aggregate with relatively disperse grain sizes and small
pores, this may provide a plausible explanation for the
absence of arrays of discrete compaction bands in the other
sandstones.
Our microstructural observations suggest that the
compaction bands in Berea and Rothbach sandstones
initiated as short discrete features that were arrested before
propagating across the sample, and many such short discrete
bands subsequently coalesced to develop a mosaic of diffuse
bands. A conceptual model of how diffuse bands may
develop from coalescence is illustrated in Fig. 16b. Since
the experiments on the Bentheim sandstone presented here
were for nominally dry samples, one may also speculate that
the propagation of discrete bands may also be stabilized in
the presence of water. However, we have performed parallel
experiments on samples saturated with water and the failure
mode and microstructure are qualitatively similar to what
we present here for the dry samples. It should also be noted
that a similar localization mode was observed in saturated
samples of the Diemelstadt sandstone.
A deeper understanding of the micromechanics will help
address some of these intriguing questions on compaction
localization. It is useful in such an investigation to integrate
AE and microstructural observations. We have demon-
strated that categorization of AE activity into the p- and
m-types provides a diagnostic tool for distinguishing the
development and absence of compaction bands. In p-type
AE activity the occurrence of multiple pulses strongly
suggest that compaction bands nucleate as discrete features
Fig. 14. Spatial distribution of specific surface area in samples of Rothbach sandstone deformed in the brittle-ductile transition at 40 MPa (a), 55 MPa (b),
90 MPa (c), and 130 MPa (d) effective pressure. The s1 direction is vertical.
P. Baud et al. / Journal of Structural Geology 26 (2004) 603–624618

even though they may subsequently coalesce into a more
diffuse structure. Even though our study used a single AE
transducer, more extensive AE measurements using mul-
tiple AE transducers can provide detailed information on the
AE locations and spatial clustering of damage. In particular,
the evolution of diffuse compaction bands in the Castlegate
sandstone (with 28% porosity) has been carefully mapped
out by Olsson and Holcomb (2000).
The intensity of damage can be inferred from either the
mechanical or stereological data. For the Bentheim
sandstone the failed samples did not show appreciable
barreling, with the implication that the porosity reduction
was mainly due to axial shortening with negligible radial
strains. Indeed if we plot the volumetric strain as a function
of axial strain for samples deformed in the regime where
compaction bands developed, they follow a linear trend with
slope close to unity (Fig. 17). As an example we analyzed
the data for the experiment at 300 MPa confining pressure.
From the mechanical and AE data (Fig. 2b) we estimate that
an AE pulse typically occurred over an inelastic axial strain
of ,0.2% (corresponding to a shortening of D‘ , 76 mm in
a sample of nominal length 38.1 mm). Since our micro-
structural observations (Fig. 9) indicate that the damage due
to one such pulse was sustained primarily in a single discrete
compaction band with a lateral dimension of one to two
grains (‘ , 500 mm), we infer that the localized compac-
tion inside the band would be D‘/‘ , 15%. Since the
Bentheim sandstone has an initial porosity of 23%, such
inelastic deformation would necessitate significant pore
collapse. Indeed the inelastic compaction and comminution
in the discrete bands were so intense that we found it
difficult to quantify the damage unless we resorted to
microscopic observations under very high magnifications.
In the other sandstones we conducted stereological
Fig. 15. Peak stresses and yield stresses at the onset of shear-enhanced compaction for Darley Dale (a), Berea (b), Rothbach (c) and Bentheim sandstones (d).
P. Baud et al. / Journal of Structural Geology 26 (2004) 603–624 619

measurements to map out the damage intensity. While the
damage maps provide details on the spatial distribution, for
comparative purposes it is also useful to evaluate the
average values. However, because damage was distributed
in a very heterogeneous way in most of our samples
averaging over the entire sample would not provide useful
information on the localized damage. Therefore in Table 3
we present for each deformed sample several average values
of the stereological parameters computed for localized areas
where Sv exceeded a certain threshold. The first threshold
values correspond to the nominal damage in unstressed
samples (Menendez et al., 1996; Wu et al., 2000), and hence
the computed averages correspond to the stress-induced
damage.
Our measurements for samples deformed in the transi-
tional regime are in overall agreement with previous data of
Menendez et al. (1996) and Wu et al. (2000) for samples
deformed in the brittle faulting and ductile flow regimes. An
anisotropy factor V23 on the order of 0.1 was observed in
most of the sample, indicating that stress-induced aniso-
tropy may play an important role in the development of
compaction localization as suggested recently in Rudnicki’s
(2002) bifurcation analysis. It should also be noted that Eqs.
(1) and (2) are valid only for an axisymmetric distribution of
microcracks (Wong, 1985), and therefore the stereological
parameters so derived may not truly represent the damage in
samples that developed high-angle shear bands that cannot
be approximated as axisymmetric deformation.
6.3. Comparison with field observations
Systematic studies in the rock mechanics laboratory have
demonstrated that compaction localization is associated
with stress states in the transitional regime from brittle
faulting to cataclastic flow. The stress states are in the range
typically encountered in sedimentary formations (Fig. 15).
The laboratory results therefore suggest that localized
structures such as compaction bands and high-angle shear
bands can be pervasive in sandstone formations, not just
limited to the aeolian Navajo sandstone in which they were
first observed (Mollema and Antonellini, 1996). Indeed
Sternlof and Pollard (2002) recently documented field
evidence for the abundant development of compaction
bands in the Jurassic Aztec sandstone of southeastern
Nevada.
While a number of localized structures have been
postulated to be subperpendicular to s1, it should be noted
that the operative deformation mechanisms are distinctly
different. In a mature strike-slip fault (such as the San
Andreas system), fault normal compression is attributed to
mechanical weakness in both absolute and relative senses
(Rice, 1992; Hickman et al., 1995). Diffusive mass transfer
(pressure solution) may also induce stylolites to develop as
discrete surfaces oriented normal to s1 (Fletcher and
Pollard, 1981). Since they can act as barriers to fluid
transport and influence the stress field and strain partitioning
in accretionary prisms and sedimentary formations, an
important question is to what extent and under what
conditions these localized compactant structures would
occur. Recognition of such structures in the field would
elucidate the tectonic processes by which localization in
sandstone formations (Aydin and Johnson, 1978) and
accretionary prisms (Byrne et al., 1993) develop. In
geotechnical problems on a smaller scale, it has also been
proposed that borehole breakouts in highly porous sand-
stone may occur by the propagation of compaction bands
(Olsson, 1999; Haimson, 2001; Klaetsch and Haimson,
2002).
Fig. 16. Conceptual models for the initiation and development of (a)
discrete and (b) diffuse compaction bands in porous sandstones.
Fig. 17. Volumetric strain versus axial strain for a sample of Bentheim
sandstone deformed at 180 MPa. After C p, the slope of the curve is close to
one.
P. Baud et al. / Journal of Structural Geology 26 (2004) 603–624620

Table 3
Quantitative microstructural data of deformed samples
Effective pressure (MPa) Crack density for linear intercepts
perpendicular to s1 (P’L : mm21)
Crack density for linear intercepts
parallel to s1 (PkL: mm21)
Crack area per unit volume
(Sv: mm21)
Anisotropy factor (V23)
Berea sandstone
50
Sv . 4 5.53 4.83 10.76 0.1
Sv . 6 5.89 5.11 11.45 0.11
Sv . 8 6.29 5.47 12.22 0.1
60
Sv . 4 5.23 4.71 10.24 0.06
Sv . 6 5.75 5.06 11.02 0.09
Sv . 8 6.25 5.52 12.18 0.09
75
Sv . 4 5.19 4.35 10.02 0.13
Sv . 6 5.56 4.66 10.73 0.12
Sv . 8 6.44 5.35 12.41 0.14
90
Sv . 4 4.58 4.05 8.93 0.086
Sv . 6 5.34 4.66 10.39 0.1
Sv . 8 5.87 5.12 11.42 0.1
150
Sv . 4 5.34 5.15 10.06 0.03
Sv . 6 5.98 5.79 11.88 0.02
Sv . 8 6.29 6.11 12.5 0.02
200 4.4 4.19 8.7 0.006
Sv . 4 5.52 5.09 10.85 0.04
Sv . 6 6.38 5.81 12.52 0.064
Sv . 8 6.95 6.29 13.62 0.067
Darley Dale sandstone
80 3.78 3.3 7.35 0.05
Sv . 2 3.78 3.31 7.35 0.05
Sv . 4 4.05 3.49 7.86 0.08
Sv . 6 4.87 3.95 9.34 0.14
Sv . 8 5.71 4.48 10.9 0.17
90 3.54 3.09 6.89 0.07
Sv . 2 3.54 3.09 6.89 0.07
Sv . 4 3.83 3.31 7.44 0.09
Sv . 6 4.73 3.94 9.12 0.12
Sv . 8 5.62 4.49 10.76 0.16
95 3.59 2.99 6.92 0.12
Sv . 2 3.71 3.08 7.16 0.12
Sv . 4 4.32 3.56 8.3 0.14
Sv . 6 4.96 4.04 9.53 0.15
Sv . 8 5.66 4.56 10.84 0.16
110 3.31 2.81 6.04 0.11
Sv . 2 3.36 2.84 6.5 0.11
Sv . 4 3.44 2.91 6.66 0.12
Sv . 6 3.85 3.19 7.42 0.14
Sv . 8 4.56 3.7 8.75 0.15
Rothbach sandstone
40 2.03 1.9 4 0.008
Sv . 2 2.21 2.04 4.35 0.029
Sv . 8 5.29 4.58 10.28 0.104
55 1.96 1.87 3.88 20.012
Sv . 2 2.31 2.16 4.56 0.035
Sv . 8 4.92 4.61 9.69 0.04
90 3.17 2.87 6.21 0
Sv . 2 3.8 3.39 7.43 0.045
Sv . 8 5.74 4.86 11.1 0.12
130 3.58 3.38 7.07 0.027
Sv . 2 3.58 3.38 7.07 0.027
Sv . 10 6.11 5.52 11.97 0.08
P. Baud et al. / Journal of Structural Geology 26 (2004) 603–624 621

The field observations (Mollema and Antonellini, 1996;
Sternlof and Pollard, 2002) point to subparallel arrays of
relatively narrow compaction bands akin to what are
characterized as discrete compaction bands in the present
study. However, the laboratory studies have also documen-
ted the alternative development of compaction bands as
diffuse structures. A question therefore arises as to whether
diffuse compaction bands also develop in the field, and if so,
why they have not been observed.
While this is a question that can only be addressed by
more systematic investigations in the field, we have begun
to identify the key microstructural attributes that are
favorable for the development of compaction localization
in the form of discrete bands, such as those in the Bentheim
and Diemelstadt sandstones, as well as in cellular solids and
ice. One should also keep in mind that even in laboratory-
deformed sandstones, the complex mosaic of diffuse
compaction bands could not be delineated without compre-
hensive and tedious measurements, especially in the highly
deformed samples with diffuse bands covering a relatively
large proportion of the sample. As discussed above, we had
to conduct stereological measurements at relatively fine
scale to map out the spatial heterogeneity of damage in the
Berea and Rothbach sandstones. Similarly, the diffuse
compaction bands in the Castlegate sandstone could not
have been resolved by Olsson and Holcomb (2000) without
their high-resolution AE measurement system.
While the laboratory studies have provided a very useful
analog for understanding the mechanics of compaction
localization in the field, there are several apparent
discrepancies. Grain crushing as a mechanism of pore
collapse seems to be not as pronounced in the field examples
as the discrete compaction bands in our Bentheim and
Diemelstadt sandstone samples. In many instances the
compaction bands in the field have propagated transverse to
the bedding (K. Sternlof, personal communication, 2002),
whereas the samples in this study were all cored
perpendicular to bedding and therefore the compaction
bands had all propagated parallel to the bedding. These
outstanding questions should be addressed by a more
systematic integration of mechanical data, structural
observations and theoretical analyses in future studies.
Most laboratory studies on initially intact samples
show that compaction localization tends to initiate and
cluster near either end of a sample, with the implication
that the bands have possibly been triggered by the local
stress heterogeneity due to the end-constraints. In
geologic settings structural and stress heterogeneities
are pervasive on all scales, and a deeper understanding
of how they control the initiation of compaction
localization necessitates studying the process under
well-defined conditions of stress concentration. To
address this question Vajdova and Wong (2003)
recently conducted triaxial compression tests on cir-
cumferentially notched samples of Bentheim sandstone,
and their data illustrate how compaction bands can
initiate from the notch tips and propagate by sequential
increments as ‘anti-cracks’ in a manner analogous to
field observations.
7. Conclusion
Integrating mechanical deformation, AE and microstruc-
tural observations, we have demonstrated that localized
failure modes involving compaction bands and high-angle
shear bands can develop in five sandstones with porosities
ranging from 13 to 24% while they undergo shear-enhanced
compaction. We also confirm that such phenomena of
compaction localization are commonly associated with
stress states in the transitional regime from brittle faulting to
cataclastic flow. Our observations have documented a broad
spectrum of geometric complexity associated with compac-
tion localization, and we identify two end-members of
localization mode: shear bands at relatively high angles and
arrays of discrete compaction bands subperpendicular to the
maximum compression direction, which have been
observed in the most compact (Darley Dale) and porous
(Bentheim and Diemelstadt) sandstones, respectively. In
(Berea and Rothbach) sandstones with intermediate poros-
ities we also observed a hybrid localization mode involving
high-angle shear bands and diffuse compaction bands.
The various localization modes are manifested by
distinct AE signatures. Whereas the development of high-
angle shear bands is characterized by the continuous
accumulation of AE (m-type activity), discrete bands are
associated with episodic surges in AE ( p-type activity) that
are characterized by an overall strain hardening trend
punctuated by episodic stress drops. The number of discrete
bands correlates with the number of AE surges and stress
drops.
The discrete compaction bands in our sandstone samples
are akin to those documented in cellular solids and metal
foams with highly porous and relatively homogeneous
structures. A similar localization mode has been observed in
ice during the high-pressure I ! II transformation that
involves 21% volume reduction. In relation to tectonic
deformation, arrays of discrete compaction bands with
qualitatively similar features have also been documented in
Navajo and Aztec sandstone formations.
Acknowledgements
We thank Veronika Vajdova for her precious help in the
laboratory, Michel Darot for helping to collect extra
Bentheim sandstone, and Jerome Fortin for helping with
the experiments on Diemelstadt sandstone. Kurt Sternlof
and Dave Pollard have graciously shared with us their field
observations. We thank Pierre Besuelle, Joanne Fredrich,
Yves Gueguen, Bezalel Haimson, Dave Holcomb, Steve
Kirby, Bill Olsson and John Rudnicki for stimulating
P. Baud et al. / Journal of Structural Geology 26 (2004) 603–624622

discussions regarding compaction localization. Patrick
Baud was partially supported by Universite Louis Pasteur.
The research at Stony Brook was partially supported by the
National Science Foundation under grants EAR-0106580
(in collaboration with Kathleen Issen of Clarkson Univer-
sity) and INT-9815570 (in collaboration with Yves
Gueguen of Ecole Normale Superieure, Paris).
References
Aydin, A., Johnson, A.M., 1978. Development of faults as zones of
deformation bands and as slip surfaces in sandstone. Pure and Applied
Geophysics 116, 931–942.
Bastawros, A.-F., Bart-Smith, H., Evans, A.G., 2000. Experimental analysis
of deformation mechanisms in a closed-cell aluminum alloy foam.
Journal of the Mechanics and Physics of Solids 48, 301–322.
Baud, P., Zhu, W., Wong, T.-f., 2000. Failure mode and weakening effect of
water on sandstone. Journal of Geophysical Research 105,
16371–16389.
Bernabe, Y., Brace, W.F., 1990. Deformation and fracture of Berea
sandstone. In: Duba, A.G., Durham, W.B., Handin, J.W., Wang, H.F.
(Eds.), The Brittle–Ductile Transition in Rocks. American Geophysical
Union Monograph 56, pp. 91–101.
Besuelle, P., 2001. Compacting and dilating shear bands in porous rocks:
theoretical and experimental conditions. Journal of Geophysical
Research 106, 13435–13442.
Besuelle, P., Desrues, J., Raynaud, S., 2000. Experimental characterization
of the localization phenomenon inside a Vosges sandstone in a triaxial
cell. International Journal of Rock Mechanics and Mining Sciences 37,
1223–1237.
Besuelle, P., Baud, P., Wong, T.-f., 2003. Failure mode and spatial
distribution of damage in Rothbach sandstone in the brittle-ductile
transition. Pure and Applied Geophysics 160, 851–868.
Byrne, T., Maltman, A., Stephenson, E., Soh, W., Knipe, R., 1993.
Deformation structures and fluid flow in the toe region of the Nankai
accretionary prism. Proceedings of the ODP, Scientific Results 131,
83–192.
DiGiovanni, A.A., Fredrich, J.T., Holcomb, D.J., Olsson, W.A., 2000.
Micromechanics of compaction in an analogue reservoir sandstone.
Proceedings of the 4th North American Rock Mechanics Symposium,
pp. 1153–1160.
Durham, W.B., Heard, H.C., Kirby, S.H., 1983. Experimental deformation
of polycrystalline H2O ice at high pressure and low temperature:
preliminary results. Journal of Geophysical Research 88, B377–B392.
El Bied, A., Sulem, J., Martineau, F., 2002. Microstructure of shear zones in
Fontainebleau sandstone. International Journal of Rock Mechanics and
Mining Sciences 39, 917–932.
Fletcher, R.C., Pollard, D.D., 1981. Anticrack model for pressure solution
surfaces. Geology 9, 419–424.
Fortin, J., Baud, P., Wong, T.-f., 2003. Mechanical Compaction of
Diemelstadt Sandstone: From Compacting Shear Bands to Compaction
Bands (abstract), EGS-AGU Meeting, Nice.
Haimson, B.C., 2001. Fracture-like borehole breakouts in high porosity
sandstone: are they caused by compaction bands? Physics and
Chemistry of the Earth (A) 26, 15–20.
Handin, A., Hager, R.V., Friedman, M., Feather, J.N., 1963. Experimental
deformation of sedimentary rock under confining pressure: pore
pressure effects. Bulletin of the American Association of Petroleum
Geologists 47, 717–755.
Hickman, S., Sibson, R., Bruhn, R., 1995. Introduction to special issue:
mechanical involvement of fluids in faulting. Journal of Geophysical
Research 100, 12831–12840.
Issen, K.A., 2002. The influence of constitutive models on localization
conditions for porous rock. Engineering Fracture Mechanics 69,
1891–1906.
Issen, K.A., Rudnicki, J.W., 2000. Conditions for compaction bands in
porous rock. Journal of Geophysics Research 105, 21529–21536.
Kirby, S.H., Durham, W.B., Stern, L., 1992. The ice I ! II transformation:
mechanisms and kinetics under hydrostatic and nonhydrostatic
conditions. In: Maeno, N., Hondoh, T. (Eds.), Physics and Chemistry
of Ice, Hokkaido University Press, Sapporo, pp. 456–463.
Klaetsch, A.R., Haimson, B., 2002. Porosity-dependent fracture-like
breakouts in St. Peter sandstone. In: Hammah et al. (Eds.), NARMS-
TAC 2002, University of Toronto, ISB: 0-7727-6708-4, vol. 2, pp.
1365–1371.
Klein, E., 2002. Micromecanique des Roches Granulaires Poreuses:
Experimentation et Modelisation, These de doctorat, Universite Louis
Pasteur, Strasbourg, France.
Klein, E., Baud, P., Reuschle, T., Wong, T.-f., 2001. Mechanical behavior
and failure mode of Bentheim sandstone under triaxial compression.
Physics and Chemistry of the Earth (A) 26, 21–25.
Mair, K., Main, I., Elphick, S., 2000. Sequential growth of deformation
bands in the laboratory. Journal of Structural Geology 22, 25–42.
Mair, K., Elphick, S.C., Main, I.G., 2002. Influence of confining pressure on
the mechanical and structural evolution of laboratory deformation band.
Geophysical Research Letters 29(10) (DOI: 10.1029/2001L013964).
Menendez, B., Zhu, W., Wong, T.-f., 1996. Micromechanics of brittle
faulting and cataclastic flow in Berea sandstone. Journal of Structural
Geology 18, 1–16.
Mollema, P.N., Antonellini, M.A., 1996. Compaction bands: a structural
analog for anti-mode I cracks in aeolian sandstone. Tectonophysics 267,
209–228.
Olsson, W.A., 1999. Theoretical and experimental investigation of
compaction bands in porous rock. Journal of Geophysical Research
104, 7219–7228.
Olsson, W.A., Holcomb, D.J., 2000. Compaction localization in porous
rock. Geophysical Research Letters 27, 3537–3540.
Papka, S.D., Kyriakides, S., 1999. Biaxial crushing of honeycombs—Part I:
experiments. International Journal of Solids and Structures 36,
4367–4396.
Rice, J.R., 1992. Fault stress states, pore pressure distributions, and the
weakness of the San Andreas fault. In: Evans, B., Wong, T.-f. (Eds.),
Fault Mechanics and Transport Properties of Rocks, Academic Press,
San Diego, pp. 475–504.
Rudnicki, J.W., 2002. Conditions for compaction and shear bands in a
transversely isotropic material. International Journal of Solids and
Structures 39, 3741–3756.
Rudnicki, J.W., Rice, J.R., 1975. Conditions for the localization of
deformation in pressure sensitive dilatant materials. Journal of the
Mechanics and Physics of Solids 23, 371–394.
Schock, R.N., Heard, H.C., Stephens, D.R., 1973. Stress-strain behavior of
a granodiorite and two graywackes on compression to 20 Kilobars.
Journal of Geophysical Research 78, 5922–5941.
Sternlof, K., Pollard, D.D., 2002. Numerical modeling of compactive
deformation bands as granular “anti-cracks”. Eos Translations AGU 83
(47), T11F-10.
Underwood, E.E., 1970. Quantitative Stereology, Addison Wesley, Read-
ing, 274pp.
Vajdova, V., Wong, T.-f., 2003. Incremental propagation of discrete
compaction bands: acoustic emission and microstructural observations
on circumferentially notched samples of Bentheim sandstone. Geophy-
sical Research Letters 30 (14), 1775DOI: 10.1029/2003GL017750.
Wong, T.-f., 1985. Geometric probability approach to the characterization
and analysis of microcracking in rocks. Mechanics of Materials 4,
261–276.
Wong, T.-f., David, C., Zhu, W., 1997. The transition from brittle faulting
to cataclastic flow in porous sandstones: mechanical deformation.
Journal of Geophysical Research 102, 3009–3025.
Wong, T.-f., Baud, P., Klein, E., 2001. Localized failure modes in a
compactant porous rock. Geophysical Research Letters 28, 2521–2524.
P. Baud et al. / Journal of Structural Geology 26 (2004) 603–624 623

Wu, X.Y., Baud, P., Wong, T.-f., 2000. Micromechanics of compressive
failure and spatial evolution of anisotropic damage in Darley Dale
sandstone. International Journal of Rock Mechanics and Mining
Sciences 37, 143–160.
Zhang, J., Wong, T.-f., Davis, M.D., 1990. High pressure embrittlement and
shear-enhanced compaction in Berea sandstone: acoustic emission
measurement and microstructural observation. In: Hustrulid, W.A.,
Johnson, G.A. (Eds.), Rock Mechanics Contributions and Chal-
lenges, Proceedings of 31st U.S. Symposium on Rock Mechanics,
pp. 653–660.
P. Baud et al. / Journal of Structural Geology 26 (2004) 603–624624