company departmentalisation decision: zimbabwe …amity.edu/userfiles/admaa/bae0fpaper 1.pdf · 1 v...
TRANSCRIPT

1Amity Journal of Operations Management
Volume 1 Issue 2 2016 AJOM
ADMAA
Amity Journal of Operations Management1(2), (1-12)
©2016 ADMAA
Company Departmentalisation Decision: Zimbabwe Mutare Companies Miss the Point
Stanley MurairwaAfrica University, Mutare, Zimbabwe
(Received: 08/08/2016; Accepted: 12/12/2017)
AbstractMany Zimbabwean companies are facing production viability challenges due to not only economic
challenges, but also human associated errors. The research established the number of production functions and awareness of the three production functions model in Mutare companies. This article discovered that there are twenty production functions and many Zimbabwean companies were nursing, failing companies with archaic traditional antipyretic antidote. The companies professed ignorance of the well-publicised three production functions model (3PFM) for minimising the aggregate production cost. A Zimbabwean company has at least nine independent production functions. The research grouped the current production functions into four: operations, marketing, auditing and finance (OFAM). There is no convincing explanation on why Zimbabwean companies should not reduce the number of production functions. The Zimbabwean companies that are facing viability challenges could be revived if the management adopts and implements the four production functions model (4PFM). The current Zimbabwean companies’ departmentalisation decisions are expensive and counterproductive.
Keywords: Departmentalisation, Production Functions, Major Functions, Support Functions, Functions Classification
JEL Classification: M1, M11
Paper Classification: Research Paper
IntroductionThe Zimbabwean companies are doing it all wrong. The companies have more than three
production functions despite the fact that the country is facing economic challenges. Many companies have closed operations (Chinamasa, 2015) due to high production costs that rendered them economically non-competitive. The researchers, such as Evans (1993), Reid and Sanders

2 Amity Journal of Operations ManagementADMAA
Volume 1 Issue 2 2016AJOM
(2010), Porter (2011) and Stevenson (2015) have identified the Operations, Finance and Marketing functions as the three primary production functions in any company. The combination is referred to as the three production functions model (3PFM) in Murairwa (2016). Russell and Taylor (2011) identified four primary functional areas including human resources (HR). In contrast, Slack, Chambers and Johnston (2010) identified three functions including product/service development function and relegated the finance function to the group of production supporters. However, these are not the only production functions found in Zimbabwean companies. There are support functions such as HR, accounting and auditing, research and development (R&D), information technology (IT) and traffic functions just to mention a few.
The Zimbabwean companies created many production functions without strategies in place to optimise the revenue variables. A company implements a production system to produce products. The production system converts inputs into outputs of greater value for the company’s customers. The production system, that is part of the production supply chain, utilises only the labour, products and financial markets to produce products. The objectives of this research are to: (a) establish whether Zimbabwean companies are aware of the 3PFM, (b) establish whether the 3PFM is a strategy for minimising production cost and (c) determine the ideal number of production functions. The research, therefore, endeavours to address these objectives and encourages Zimbabwean companies to reduce the number of production functions.
Literature ReviewMeyr, Wagner and Rohde (2005) presented four production functions, namely, procurement,
production, distribution and sales. Russell and Taylor (2011) and Jonker (2010) identified four production functions, namely, Marketing, Operations, Finance and HR and presented their interaction during production. Kumar and Suresh (2009) and Dessler (2003) presented a production system which covers the operations, inputs, conversion and outputs. Jonker (2010) asserted that Operations required inputs in order to produce outputs. Porter (2011) stated that all companies implement operations because they produce products. However, the researcher went on to state other functions such as Marketing, Finance and HR that are required to support the operations function. The company’s value chain adapted from Stevenson (2015), Porter (2011), Russell and Taylor (2011), Jonker (2010), Reid and Sanders (2010), Kumar and Suresh (2009) and Dessler (2003) is shown in Figure 1.
Figure 1. Company’s Value Chain

3Amity Journal of Operations Management
Volume 1 Issue 2 2016 AJOM
ADMAA
Figure 1 implements the 3PFM through the supply, production and distribution (SPD) chains. The SPD chains carry out economic activities that include procuring, producing, selling, renting, leading, controlling, monitoring, evaluating, recruiting and investing among others. The supply chain outlines the supply, production and distribution functions. The general interaction of the production functions {adapted from Stevenson (2015), Russell and Taylor (2011) and Slack et al. (2010)} in any company is shown in Figure 2.
Figure 2. Interaction of the Production Functions
Figure 2 portrays the interaction of the production functions. The interaction of the company’s production functions determines its economic competiveness and profitability. However, profitability is a game of numbers. Therefore, choosing the number of production functions is an important departmentalisation decision that should be strategically thought out because it could either aid or impair the prosperity of the company. It is the latter that companies should guard against when deciding on the number of production functions to implement.
Major function The major function (MF) performs activities that fulfil the mission of the company. It
implements the operations activities to produce products for the customers. Thus, the Operations function is the MF of the company. The product/service development function by Slack et al. (2010) is an activity of the MF. The Operations function converts inputs into outputs of greater value to customers. The Operations Manager ensures that the labour, raw materials, capital and technology are available for production. The Operations function produces, plans, procures, manages, maintains, develops, recruits, selects, organizes, arranges, locates, designs, measures, controls and schedules, among other activities. Thus, the Operations function implements the activities that are also carried out by the general support functions.
Super support function The super support function (SSF) implements unique activities that directly support the
Operations function. The activities can only be successfully performed by a colony of team members. The SSF consists of the marketing and finance functions. The marketing function identifies customers and distributes products that are produced by the Operations function. Thus, the marketing function sells, distributes, promotes researches and recruits among other activities. On the other hand, the finance function sources and distributes funds to the other production functions. Thus, the finance function keeps records, prepares accounts, provides management information, manages wages and investments, raises funds, collects funds, recruits, audits and accounts among other activities. Just like the marketing function (MF), the SSF also implements some of the activities of the general support functions.

4 Amity Journal of Operations ManagementADMAA
Volume 1 Issue 2 2016AJOM
General Support Function The general support function (GSF) duplicates and centralises activities that can be performed
efficaciously by the MF and SSF. The GSF is composed of the accounting, HR, IT, traffic, audit, R&D, engineering and sales functions among others. The duplication of activities increases the aggregate production cost. The Accounting and HR functions are the most popular general support functions with scholars and practitioners. The Accounting function manages wages, collects and pays cash, procures and manages property and inventory. The HR function recruits, provides safety, compensates, builds and trains team members.
According to Stevenson (2015), Porter (2011), Jonker (2010), Kumar and Suresh (2009), Meyr et al. (2005) and Dessler (2003), a company requires only the MF (Operations function) to produce the products for the customers. The other functions that are presented in Figure 2 are support functions. The support functions are classified into two distinctive groups, namely, the SSF and GSF as discussed earlier. The SSF ensures the availability of funds and demand for the company’s production and products respectively. The conceptual contributions of the functions to the company’s value chain are presented in Figure 3.
Figure 3. Functions’ Contributions to the Production System
Figure 3 illustrates that the MF’s labour cost and the value of the activities are proportional. Since production is continuous and profit oriented, companies should sell the products to customers in order to get revenue for sustaining the production cycle. In order to sustain, the companies need to implement the SSF activities. This adds proportional labour cost and activities’ value to the MF variables. Figure 3 shows that the SSF activities are totally different from the MF activities. However, the argument is on whether the GSF should be implemented autonomously or not especially for companies in non-performing economies. The GSF activities are performed by the MF and SSF as portrayed in Figure 3. Thus, implementing the GSF independently would unnecessarily increase the production labour cost. The centralised concept that brought about the autonomy of the GSF is currently hounding the Zimbabwean companies. The MF and SSF should recruit the team members and select appropriate technologies that are suitable for their activities. The set up of the functions during production are as presented in Figure 4.

5Amity Journal of Operations Management
Volume 1 Issue 2 2016 AJOM
ADMAA
Figure 4. Interaction of the Production Functions
Figure 4 shows that the activities of the Auditing function (AF) are performed in all the production functions. However, regardless of the advocacy by researchers such as Stevenson (2015), Porter (2011), Russell and Taylor (2011), Slack et al. (2010) and Evans (1993), for companies to reduce the number of production functions, many Zimbabwean companies are reluctant to adopt the idea. This research modifies the 3PFM by making the AF an autonomous production function. According to Al-Matari, Al-Swidi and Fadzil (2014), the AF determines the reliability, reality and integrity of financial and operational information that are generated from different production functions. The researchers further stated that the AF evaluates the control systems, assesses plans and procedures, monitors policies and procedures and safeguards established funds. Al-Matari et al. (2014) concluded that the AF activities help in evaluating the work of the other production functions. An independent AF enhances its independence and ensures that the team members are free from management influence (Al-Khaddash, Al Nawas and Ramadan, 2013).
Research GapMany Zimbabwean companies are facing production challenges. A number of researchers
including Stevenson (2015), Porter (2011), Reid and Sanders (2010) and Evans (1993) advocated for the 3PFM consisting of the Operations, Marketing and Finance functions. However, there is no attempt to specify the consequences of the other functions. This poses the following questions: (a) Are companies aware of the 3PFM? (b) Is the 3PFM a strategy to minimise production costs? (c) What is the ideal number of production functions?
Methodology
Type of studyThis is a survey on Mutare companies in Zimbabwe to collect data for the research.
Research SampleThe data was collected from 150 company management who volunteered to participate in
the survey. At each company, the researcher collected data from at most four volunteered team members at managerial level. Thus, at least 38 companies participated in the survey.
Data Collection MethodsThe researcher visited Mutare urban and industrial areas to collect data from the chief
executive officers (CEO), managers, directors and supervisors of companies who were willing to

6 Amity Journal of Operations ManagementADMAA
Volume 1 Issue 2 2016AJOM
participate (Murairwa, 2015) in the survey. The questionnaire was distributed to the respondents to complete during the focused discussion. This reduced the number of incomplete questionnaire.
Data Analysis ToolsThe research applied the difference of two proportions test at with hypothesis
vs . The test statistic formula is:
................................................................................................... (1)
where p is the sample proportion, π is population proportion and is the pooled proportion. The H0 is rejected if the zcal lies outside the range ±z(tab (0.025,∞))=±1.96.
Results
Response rateAll the 150 questionnaires distributed to volunteered respondents were returned for data
analysis. Nevertheless, 4.67% were incomplete and could not be analysed for this research. Thus, 95.33% were analysed, presented, discussed and interpreted henceforth.
Respondent characteristics The respondents were females (23.08%) and males (76.92%). The managers (44.06%) and
supervisors (41.26%) were 85.32% of the respondents. This means 14.68% of the respondents were the CEOs (3.50%) and Directors (11.19%). The percentage distribution of the respondents by company type and size is presented in Table 1.
Table 1: Percentage Responses by Company Size and Type
Company Type Company size
TotalSmall Small-Medium Medium Medium-Large Large
Manufacturing 4.90 2.80 6.29 4.90 4.90 23.78
Services 2.10 3.50 4.20 5.59 25.87 41.26
Both 1.40 4.90 7.69 7.69 13.29 34.97
Total 8.39 11.19 18.18 18.18 44.06 100.00
Table 1 shows that 44.06% respondents were from large companies while the other four company sizes provided statistically the same proportion of respondents. The service companies provided 41.26% respondents while the goods and hybrid companies provided 23.78% and 34.97% respondents respectively. Statistically, the difference between the service and goods response proportions is significant. This suggests that there are more service companies than manufacturing companies in Mutare.

7Amity Journal of Operations Management
Volume 1 Issue 2 2016 AJOM
ADMAA
Data Analysis, Results, Discussion and Interpretation
Awareness of the 3PFMThe research investigated the Mutare companies’ awareness of the 3PFM and production level
and presented the results in Table 2.
Table 2: Difference of two proportions test of awareness of 3PFM and production level
Awareness
Production level
TotalVery high High Average Low
Aware Count 33a 37a, b 2b 2a 74
% of Total 23.08 25.87 1.40 1.40 51.75
Not-aware Count 26a 35a, b 8b 0a 69
% of Total 18.18 24.48 5.59 0.00 48.25
Total Count 59 72 10 2 143
% of Total 41.26 50.35 6.99 1.40 100.00
Each subscript letter denotes a subset of production categories whose column proportions do not differ significantly from each other at the 0.05 level.
Table 2 shows that the proportional difference between the aware and not-aware per each production level is statistically insignificant at 5% level of significance. Thus, aware and not-aware responses are statistically the same. The aggregate response percentages are 51.75% (aware, p1) and 48.25% (not aware, p2). The difference of two proportions test at 5% level of significance is:
versus , ±Ztab(0.025,∞) = ±1.96 and . There
is no evidence to reject H0. This means that the difference between the aggregate aware and not-aware response proportions is statistically insignificant. Thus, half of the Mutare companies’ management was not aware of the 3PFM.
The research investigated whether the management would, in difficult economic conditions, retrench team members in the 3PFM. The results are presented in Figure 5. Of all the respondents, 12.29%, 24.48% and 7.69% would retrench team members from Operations, Marketing and Finance functions respectively. The research expected zero percentages for the three functions. It is evident that the Mutare companies lack knowledge of the 3PFM as discovered earlier.

8 Amity Journal of Operations ManagementADMAA
Volume 1 Issue 2 2016AJOM
Figure 5: Percentage of Retrenchment Decision
The 3PFM is a strategy for minimising production cost The research investigated whether the 3PFM is a strategy for minimising production cost and
presented the results in Figure 6.
Figure 6: Strategies to Minimise Production Cost
Figure 6 shows that 55.94% of the respondents wanted Mutare companies to employ skilled team members in order to minimise production cost. However, it was encouraging to note that 32.87% of the respondents proposed the 3PFM as a strategy to minimise aggregate production cost. The other strategies suggested by the respondents were rebranding (19.58%), reengineering (13.29%) and retrenching (6.99%). The results reveal that the Mutare companies considered the 3PFM to be a strategy for minimising aggregate production cost. This is interesting but one wonders why the Mutare companies are not implementing the model?
9Amity Journal of Operations Management
Volume 1 Issue 2 2016 AJOM
ADMAA
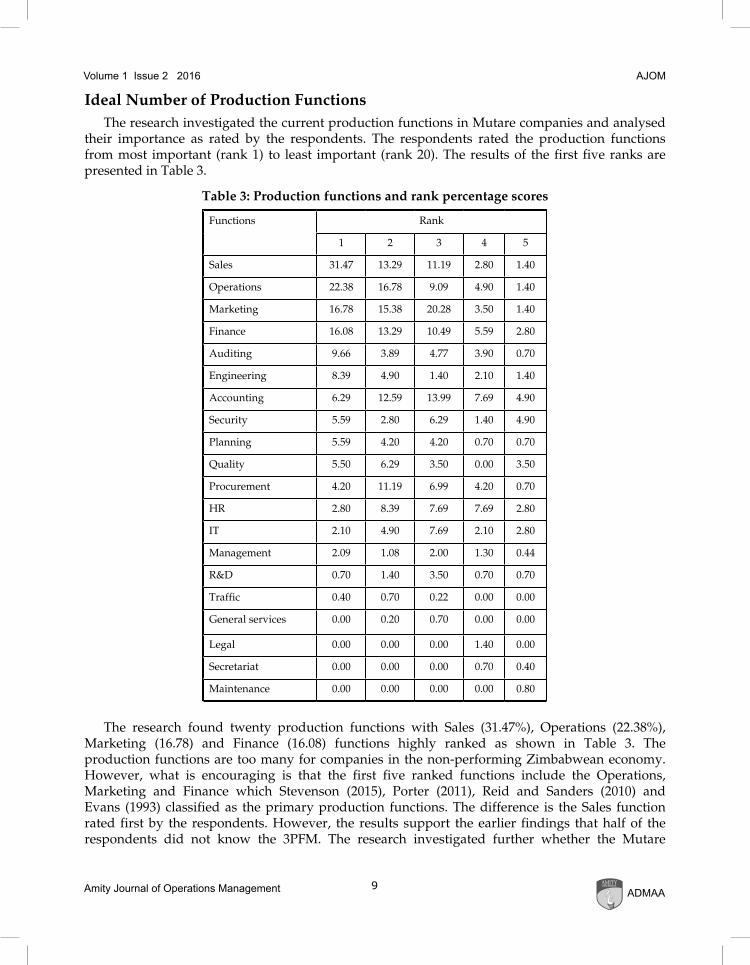
Ideal Number of Production FunctionsThe research investigated the current production functions in Mutare companies and analysed
their importance as rated by the respondents. The respondents rated the production functions from most important (rank 1) to least important (rank 20). The results of the first five ranks are presented in Table 3.
Table 3: Production functions and rank percentage scores
Functions Rank
1 2 3 4 5
Sales 31.47 13.29 11.19 2.80 1.40
Operations 22.38 16.78 9.09 4.90 1.40
Marketing 16.78 15.38 20.28 3.50 1.40
Finance 16.08 13.29 10.49 5.59 2.80
Auditing 9.66 3.89 4.77 3.90 0.70
Engineering 8.39 4.90 1.40 2.10 1.40
Accounting 6.29 12.59 13.99 7.69 4.90
Security 5.59 2.80 6.29 1.40 4.90
Planning 5.59 4.20 4.20 0.70 0.70
Quality 5.50 6.29 3.50 0.00 3.50
Procurement 4.20 11.19 6.99 4.20 0.70
HR 2.80 8.39 7.69 7.69 2.80
IT 2.10 4.90 7.69 2.10 2.80
Management 2.09 1.08 2.00 1.30 0.44
R&D 0.70 1.40 3.50 0.70 0.70
Traffic 0.40 0.70 0.22 0.00 0.00
General services 0.00 0.20 0.70 0.00 0.00
Legal 0.00 0.00 0.00 1.40 0.00
Secretariat 0.00 0.00 0.00 0.70 0.40
Maintenance 0.00 0.00 0.00 0.00 0.80
The research found twenty production functions with Sales (31.47%), Operations (22.38%), Marketing (16.78) and Finance (16.08) functions highly ranked as shown in Table 3. The production functions are too many for companies in the non-performing Zimbabwean economy. However, what is encouraging is that the first five ranked functions include the Operations, Marketing and Finance which Stevenson (2015), Porter (2011), Reid and Sanders (2010) and Evans (1993) classified as the primary production functions. The difference is the Sales function rated first by the respondents. However, the results support the earlier findings that half of the respondents did not know the 3PFM. The research investigated further whether the Mutare

10 Amity Journal of Operations ManagementADMAA
Volume 1 Issue 2 2016AJOM
companies were facing challenges with the current departmentalisation decision and presented the results in Table 4.
Table 4: Percentages of respondents satisfied and facing problems with current functions
Satisfaction Yes Facing problemsNo
Total
Female Male Total Female Male Total Female Male Total
Satisfied 2.10 15.38 17.48 12.59 30.77 43.36 14.69 46.15 60.84
Unsatisfied 5.59 18.88 24.48 2.80 11.89 14.69 8.39 30.77 39.16
Total 7.69 34.27 41.96 15.38 42.66 58.04 23.08 76.92 100.00
Table 4 shows the unsatisfied (39.16%) and satisfied (60.84%) respondents with the current departmentalisation decision. On the other hand, 41.96% respondents stated that their companies were experiencing problems in managing many functions. The difference between the unsatisfied (39.16%) and facing problems (41.96%) response proportions is statistically insignificant. Thus, the difference between respondents who were unsatisfied and those facing challenges with the current departmentalisation decision was the same. Some of the challenges discovered during discussions were high production cost due to over-staffing and high utility and stationery costs and conflict among team members from different production functions due to overlapping activities. The Auditing function is the fifth ranked production function. The Audit function formulates policy, plans, implements, analyses, reviews and reports. These activities are performed by a single team in all production functions. Thus, the research proposes for an independent Auditing function in support of AI-Khaddash et al. (2013). This creates the four production functions model (4PFM) consisting of the Operations, Finance, Auditing and Marketing (OFAM) functions. The 4PFM distributes the GSF activities to the OFAM functions. The OFAM functions and their major activities are presented in Figure 7.
Figure 7: Four Production Functions Model (4PFM)

11Amity Journal of Operations Management
Volume 1 Issue 2 2016 AJOM
ADMAA
With the 4PFM, the GSF activities would be performed by each OFAM manager. For instance, the operations manager would identify the required labour and recruit. The Zimbabwean companies should reduce the number of production functions by implementing the 4PFM.
ConclusionThe Zimbabwean companies should decentralise all GSF activities. Thus, the Zimbabwean
companies should implement the four production functions model (4PFM) that consists of the Operations, Finance, Auditing and Marketing (OFAM) functions. The Zimbabwean companies should revisit their departmentalisation decisions in order to accommodate the new production model. The adoption of the 4PFM would minimise the company’s aggregate production cost. The Zimbabwean companies are failing not only because of the non-performing economy but also due to sabotage, negligence and incompetence by highly educated and multi-skilled management. In order to facilitate the adoption of the new production model a favourable environment should be created.
Area for further studiesThe findings of this research could be enhanced by further investigating the four production
functions model (4PFM) in order to determine the production function resource distribution model. The model will assist companies to distribute resources to the four production functions.
ReferencesAl-Khaddash, H., Al Nawas, R. & Ramadan, A. (2013). Factors affecting the quality of Auditing: The Case of
Jordanian Commercial Banks. International Journal of Business and Social Science, 4 (11), 206 – 222.
Al-Matari, M. E., Al-Swidi, K. A. & Fadzil, H. F. (2014). The Effect of the Internal Audit and Firm Performance: A Proposed Research Framework. International Review of Management and Marketing, 4 (1), 34 – 41.
Chinamasa, P. A. (2015). The 2015 national budget statement “Towards an Empowered Society and Inclusive Economic Growth”. Presented to the Parliament of Zimbabwe on 27 November 2014.
Dessler, G. (2003). The Basics of Operations Management. Prentice Hall.
Evans, R. J. (1993). Production/Operations Management; Quality, Performance and Value. West Publishing Company.
Jonker, A. J. B. (2010). Operations Management: An International Perspective. MBA Hanze University of Applied Sciences Groningen : The Netherlands.
Kumar, S.A. & Suresh, N. (2009). Operations Management (with Skill Development, caselets and cases). India: New Delhi: New Age International Publishers.
Meyr, H., Wagner, M. & Rohde, J. (2005). Structure of Advanced Planning Systems In Stadtler, H. / Kilger, C. (Eds) Supply Chain Management and Advanced Planning – Concepts, Models, Software and Case Studies, Berlin, (109-115).
Murairwa, S. (2015). Voluntary sampling design. International Journal of Advanced Research in Management and Social Science, 4(2),185 – 200.
Murairwa. S. (2016). Sustainable continuous production improvement strategies: A framework for reviving failing companies in Zimbabwe. Amity Journal of Operations Management (AJOM), 1(1).

12 Amity Journal of Operations ManagementADMAA
Volume 1 Issue 2 2016AJOM
Porter, A. (2011). Operations Management. Ventus publishing ApS.
Reid, D. R., & Sanders, N. R. (2010). Operations Management. (4th Edition). Wiley.
Russell, S. R. & Taylor, W. B. (2011), Operations Management. John Wiley & Sons, USA; INC.
Slack, N. Chambers, S and Johnston, R. (2010). Operations Management. Prentice Hall.
Stevenson, W. J. (2015). Operations Management. (11th Edition). The McGraw-Hill companies.
Author’s Profile
Stanley Murairwa is a Lecturer at Africa University (AU) in the College of Business, Peace, Leadership and Governance (CBPLG) in Zimbabwe. He is the Head of Business Sciences Department. He obtained Ph.D. degree in Decision Science from Universiti Utara Malaysia (UUM), Malaysia, M.Sc. degree in Operations Research (Distinction) from National University of Science and Technology (NUST), Zimbabwe, B.Sc. Special Honours degree in Statistics from University of Zimbabwe (UZ), Diploma in Statistics from University of Zimbabwe (UZ), Diploma in Management Information System from The Institute for the Management of Information Systems (IMIS), United Kingdom and a two year In-House Statistical Training Programme (ISTP) Part-A and Part-B certificates from Zimbabwe National Statistics Agency (ZIMSTAT). His areas of research interest include Heuristics, Production/Operations Management and Applied Statistics. His publications appear in Amity Journal of Marketing (AJM), Amity Journal of Operations Management (AJOM),International Journal of Research and Development Organisation (IJRDO),International Journal of Advanced Research in Management and Social Sciences, European Journal of Scientific Research (EJSR), International Journal of Statistics And Systems (IJSS), International Conference on Mathematics, Statistics, and Their Applications and International Conference on Quantitative Sciences and Its Applications (ICOQSIA2010).