company initiating report - static...
TRANSCRIPT

12th January, 2018
Strong brand and parentage ICICI Life is a joint venture between ICICI Bank, India's second largest private sector bank in terms of assets, and Prudential Corporation Holdings (British multinational life insurance and financial services company). The ICICI brand and the bank’s wide distribution network, particularly among salaried and affluent individuals, gives ICICI Life a big competitive advantage in terms of acquiring new customers.
Well placed on distribution ICICI Life has a more balanced premium sourcing mix with agency channel accounting for ~23% while bancassurance accounts for the rest ~57%. The company offers its customers an extensive multi-channel sales network to access its products and services across India which includes the branches of bank partners, individual agents, corporate agents, employees, offices and website. The company had a network of 521 offices with 10,663 employees and 121,016 advisors across India as of FY16. ICICI Life’s agency channel is the second largest in the private sector, after SBI Life. Overall, the strong distribution capability has thus enabled the company to maintain healthy momentum in new business growth despite facing the brunt of major regulatory changes in the past.
Key operational matrices on consistent uptrend ICICI Life has shown positive traction in most of its operational parameters: 1) Value of new business grew by 61.7% YoY in FY17, 2) Persistency, a key parameter for gauging stickiness of the business, continues to rise and stood at 85.7% (13th Month) for FY17 vs. 79.0% in FY16, and is one of the best in industry, 3) High solvency ratio of 2.8x as of FY17, compared with the regulatory requirement of a minimum of 1.5x and 4) Cost and productivity ratios have also improved significantly in the past three years and are now one of the best among peers.
Outlook and Valuation ICICI Life remains outperformer in private life insurance space despite challenging business environment. The untapped opportunity and penetration in life insurance provides ample scope for the company to grow its portfolio at a rapid pace. As a result, ICICI Life will continue to deliver strong return ratios with RoE at 22% and return on embedded value (ROEV) at 15% in FY19E. Hence, we initiate coverage (IC) on ICICI Life and assigned BUY rating with a target price (TP) of Rs450/- where we value the company at 3.5x FY19E embedded value (EV). EV is a common valuation measure in the insurance industry which measures potential future profits from existing business.
RETAIL EQUITY RESEARCH
ICICI Pru Life Insurance (ICICI Life) Rating as per Large Cap 12 month investment period Life Insurance
BSE CODE: 540133 NSE CODE: ICICIPRULI CMP Rs. 407 TARGET Rs. 450 RETURN 11%
Bloomberg CODE: IPRU:IN SENSEX: 34,503
Company Data
Market Cap (cr) Rs. 58,424
Outstanding Shares (cr) 143.5
Free Float 19%
Dividend Yield (%) 1.2
52 week high Rs. 508
52 week low Rs. 330
6m average volume (cr) 0.1
Beta 0.8
Face value Rs. 10
Shareholding (%) Q4 FY17 Q1 FY18 Q2 FY18
Promoters 80.7 80.7 80.7
FII’s 6.0 6.3 5.8
MFs/Insti 3.3 3.4 3.5
Public 10.0 9.6 10.0
Others - - -
Total 100.0 100.0 100.0
Price Performance 3 Month 6 Month 1 Year
Absolute Return 0.9% -16.8% 20.6%
Absolute Sensex 8.4% 8.7% 27.1%
Relative Return* -7.5% -25.5% 6.6%
*over or under performance to benchmark index
Y.E Mar (Rs cr) FY17A FY18E FY19E
Net Premium 22,155 26,586 31,904
Growth (%) 16.6 20.0 20.0
New Business (%) 10.1 11.2 12.3
Net Profit 1,682 1,748 1,843
Growth (%) 1.9 3.9 5.4
EPS (Rs) 11.7 12.2 12.8
Growth (%) 1.7 3.9 5.4
BV (Rs) 45 51 60
EV (Rs) 113 121 129 RoE 28.7 23.7 22.0 RoEV 16.5 15.7 15.0
P/E 34.7 33.4 31.7
P/EV 3.6 3.4 3.2
Solvency (%) 281 270 260
COMPANY INITIATING REPORT
BUY
Best play on life insurance sector… ICICI Life was among India’s first private sector life insurance companies and offers its customers vast and diversified products in life insurance, health insurance and pension products & services.
• ICICI Life has strengthened its position in a highly competitive industry and remained the market leader among private life insurers with an overall market share of 12.0% and private market share of 22.3% in FY17.
• We believe that Indian life insurance industry is at the cusp of enormous growth driven by strong surge in volumes on the back of shifting preference of individuals to financial savings from physical savings.
• ICICI Life is well-positioned to capture the strong growth of Indian life insurance sector given its superior operational metrics and distribution tie-ups coupled with fast growing protection premiums.
• Thus, we believe that ICICI Life will deliver healthy return ratios with RoE at 22% and ROEV at 15% in FY19E. Hence, we initiate coverage on ICICI Life and assign BUY rating with a TP of Rs450 (3.5x FY19E EV).
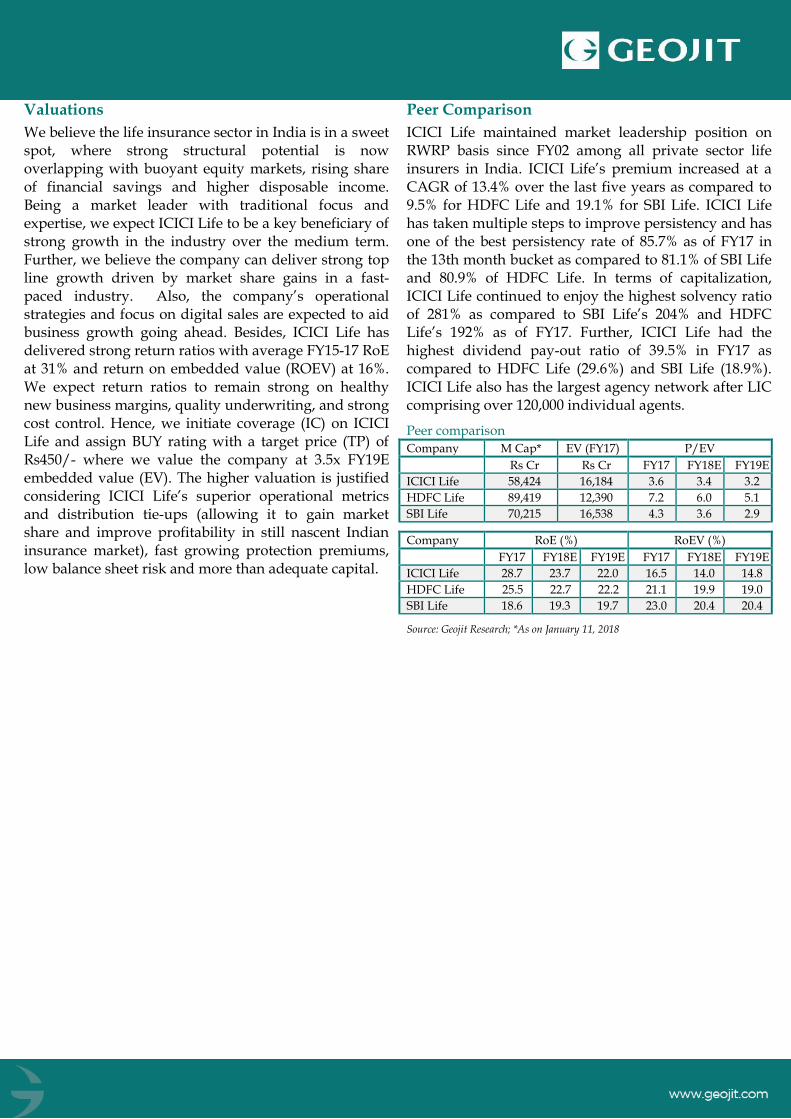
Valuations
We believe the life insurance sector in India is in a sweet spot, where strong structural potential is now overlapping with buoyant equity markets, rising share of financial savings and higher disposable income. Being a market leader with traditional focus and expertise, we expect ICICI Life to be a key beneficiary of strong growth in the industry over the medium term. Further, we believe the company can deliver strong top line growth driven by market share gains in a fast-paced industry. Also, the company’s operational strategies and focus on digital sales are expected to aid business growth going ahead. Besides, ICICI Life has delivered strong return ratios with average FY15-17 RoE at 31% and return on embedded value (ROEV) at 16%. We expect return ratios to remain strong on healthy new business margins, quality underwriting, and strong cost control. Hence, we initiate coverage (IC) on ICICI Life and assign BUY rating with a target price (TP) of Rs450/- where we value the company at 3.5x FY19E embedded value (EV). The higher valuation is justified considering ICICI Life’s superior operational metrics and distribution tie-ups (allowing it to gain market share and improve profitability in still nascent Indian insurance market), fast growing protection premiums, low balance sheet risk and more than adequate capital.
Peer Comparison
ICICI Life maintained market leadership position on RWRP basis since FY02 among all private sector life insurers in India. ICICI Life’s premium increased at a CAGR of 13.4% over the last five years as compared to 9.5% for HDFC Life and 19.1% for SBI Life. ICICI Life has taken multiple steps to improve persistency and has one of the best persistency rate of 85.7% as of FY17 in the 13th month bucket as compared to 81.1% of SBI Life and 80.9% of HDFC Life. In terms of capitalization, ICICI Life continued to enjoy the highest solvency ratio of 281% as compared to SBI Life’s 204% and HDFC Life’s 192% as of FY17. Further, ICICI Life had the highest dividend pay-out ratio of 39.5% in FY17 as compared to HDFC Life (29.6%) and SBI Life (18.9%). ICICI Life also has the largest agency network after LIC comprising over 120,000 individual agents.
Peer comparison
Company M Cap* EV (FY17) P/EV
Rs Cr Rs Cr FY17 FY18E FY19E
ICICI Life 58,424 16,184 3.6 3.4 3.2
HDFC Life 89,419 12,390 7.2 6.0 5.1
SBI Life 70,215 16,538 4.3 3.6 2.9
Company RoE (%) RoEV (%)
FY17 FY18E FY19E FY17 FY18E FY19E
ICICI Life 28.7 23.7 22.0 16.5 14.0 14.8
HDFC Life 25.5 22.7 22.2 21.1 19.9 19.0
SBI Life 18.6 19.3 19.7 23.0 20.4 20.4
Source: Geojit Research; *As on January 11, 2018

Investment Rationale
Sustained market leadership position
ICICI Prudential Life Insurance (ICICI Life) is the market leader in private life insurance space since FY02 aided by its strong brand, distribution capabilities and product portfolio. The company has an overall market share of 12.0% and private market share of 22.3% in terms of retail weighted received premium (RWRP) in FY17. It has the highest assets under management (AUM) amongst the private insurers at Rs1,306bn (Rs601bn of equity AUMs) at the end of H1FY18. ICICI Life has also maintained its dominant position in the industry on the basis of new business premium earned by delivering steady business growth partly backed by its focus on ULIP products. It holds a market share of 11.3% in new business premium in terms of annual premium equivalent (APE) terms as of H1FY18 (23.5% amongst private players). We expect the company to strengthen its market leadership position further and deliver new business premium at a CAGR of ~20% over FY17-19E thereby gaining further market share.
Diversified product mix
ICICI Life offers a vast product basket to customers which includes unit linked as well as non-linked insurance products. In terms of customer segments, it caters to individual as well as group customers.
Product Portfolio
Source: Company, Geojit Research
ICICI Life is focused more on ULIPs as compared to all other large peers. ULIPs comprised 84% of its FY17 APE as compared to 25-50% for its peers. This is the growth engine for ICICI Life.
Trend in product mix on APE basis
Product Mix FY15 FY16 FY17
Savings 98.4 97.3 96.1
- ULIP 83.1 80.8 84.1
- Participating 13.2 14.1 9.6
- Non-participating 0.6 0.4 1.1
- Group 1.5 2.0 1.3
Protection 1.6 2.7 3.9
Source: Company, Geojit Research
The company has positioned itself more towards the individual segment as compared to group. Its strong brand pull and vast reach gives it a clear competitive edge over peers. The group business market consists of credit life (protection) and pension funds.
Diversified multi-channel distribution network gives a competitive edge
It is hardly a secret that distribution is the king in the life insurance business as it is a category driven by push factors. In this aspect, the company has a leg up on most of its competition. ICICI Life offers its customers access to its products and services through an extensive multi-channel sales network across India including branches of its bank partners, individual agents, corporate agents, employees, offices and website.
Trend in premium sourcing mix on APE basis
% of total retail APE
Distribution Channels FY15 FY16 FY17
Bancassurance 58.4 57.4 57.0
Agency 24.4 23.8 23.3
Direct 8.8 9.9 12.0
Corp. Agency & Brokers 7.0 7.0 6.1
Group 1.4 1.9 1.6
Source: Company, Geojit Research
ICICI Life has a strong bancassurance channel because of its parent, ICICI Bank. Besides, it has another two banca partners, Standard Chartered Bank (SCB) in India and Capital Small Finance Bank (CSFB). It enabled the company to maintain healthy momentum in new business growth, mainly in ULIPs despite being faced with major regulatory actions in the past. In FY17, bancassurance contributed 56.9% of its retail APE. A
large customer base and an expanding footprint of these banks would throw up significant growth opportunities for ICICI Life over the long term.
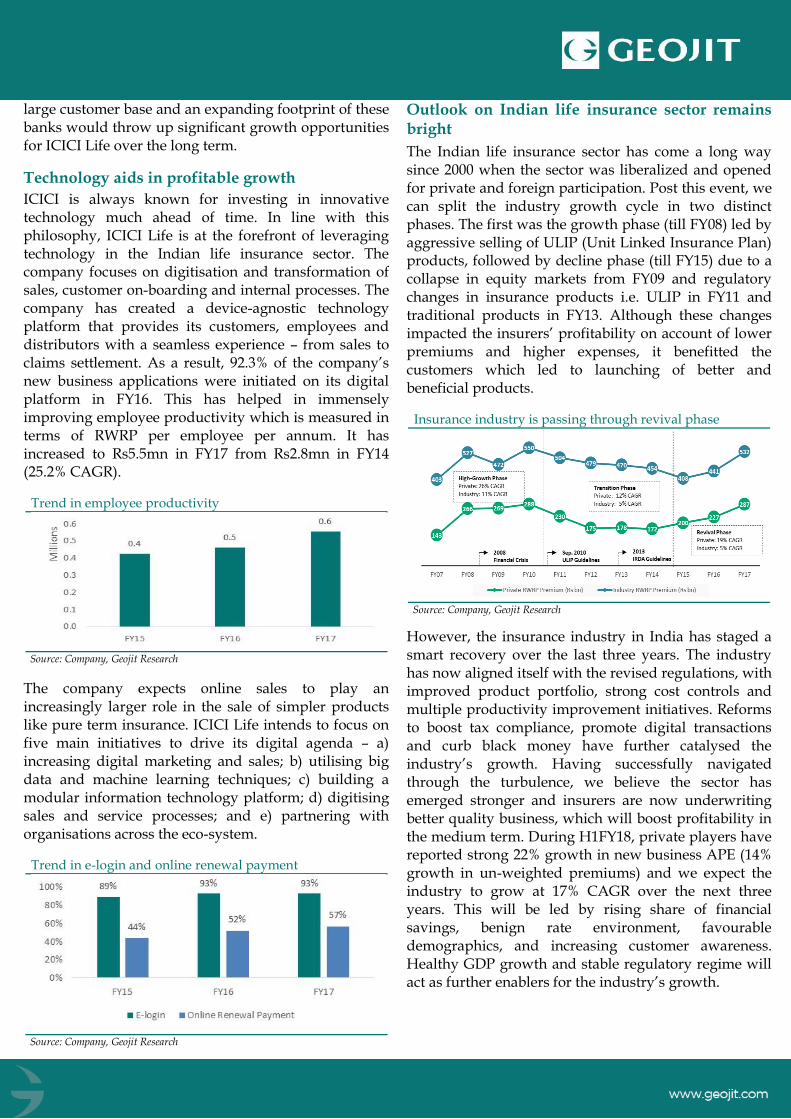
Technology aids in profitable growth
ICICI is always known for investing in innovative technology much ahead of time. In line with this philosophy, ICICI Life is at the forefront of leveraging technology in the Indian life insurance sector. The company focuses on digitisation and transformation of sales, customer on-boarding and internal processes. The company has created a device-agnostic technology platform that provides its customers, employees and distributors with a seamless experience – from sales to claims settlement. As a result, 92.3% of the company’s new business applications were initiated on its digital platform in FY16. This has helped in immensely improving employee productivity which is measured in terms of RWRP per employee per annum. It has increased to Rs5.5mn in FY17 from Rs2.8mn in FY14 (25.2% CAGR).
Trend in employee productivity
Source: Company, Geojit Research
The company expects online sales to play an increasingly larger role in the sale of simpler products like pure term insurance. ICICI Life intends to focus on five main initiatives to drive its digital agenda – a) increasing digital marketing and sales; b) utilising big data and machine learning techniques; c) building a modular information technology platform; d) digitising sales and service processes; and e) partnering with organisations across the eco-system.
Trend in e-login and online renewal payment
Source: Company, Geojit Research
Outlook on Indian life insurance sector remains bright
The Indian life insurance sector has come a long way since 2000 when the sector was liberalized and opened for private and foreign participation. Post this event, we can split the industry growth cycle in two distinct phases. The first was the growth phase (till FY08) led by aggressive selling of ULIP (Unit Linked Insurance Plan) products, followed by decline phase (till FY15) due to a collapse in equity markets from FY09 and regulatory changes in insurance products i.e. ULIP in FY11 and traditional products in FY13. Although these changes impacted the insurers’ profitability on account of lower premiums and higher expenses, it benefitted the customers which led to launching of better and beneficial products.
Insurance industry is passing through revival phase
Source: Company, Geojit Research
However, the insurance industry in India has staged a smart recovery over the last three years. The industry has now aligned itself with the revised regulations, with improved product portfolio, strong cost controls and multiple productivity improvement initiatives. Reforms to boost tax compliance, promote digital transactions and curb black money have further catalysed the industry’s growth. Having successfully navigated through the turbulence, we believe the sector has emerged stronger and insurers are now underwriting better quality business, which will boost profitability in the medium term. During H1FY18, private players have reported strong 22% growth in new business APE (14% growth in un-weighted premiums) and we expect the industry to grow at 17% CAGR over the next three years. This will be led by rising share of financial savings, benign rate environment, favourable demographics, and increasing customer awareness. Healthy GDP growth and stable regulatory regime will act as further enablers for the industry’s growth.

An under-penetrated life insurance market provides significant growth opportunity Insurance penetration (premiums as % of GDP) is used as the barometer to gauge the development of insurance in a particular market and as the below chart suggests life insurance penetration in India is still much below the world average. This points to strong growth potential in the Indian insurance industry.
Life insurance penetration (premiums as % of GDP) of select countries in 2016
Source: Company, Geojit Research
The current life insurance penetration of 2.8% reflects a significant improvement from 1.6% in FY01 but lower than the peak penetration of 4.1% achieve in FY11, driven by aggressive selling of unit linked products. The decline in penetration was partly due to regulatory changes made by IRDAI which rendered products, especially ULIP which were being aggressively sold, unfeasible for the insurers to sell. However, over the years, insurers have redesigned their products and have become compliant as per the IRDAI Regulations. We expect penetration level to increase in the next few years with large private insurers growing their businesses as they have tailored the products to the customer needs.
Historical development of life insurance penetration in India
Source: Company, Geojit Research
Demographic strength
Currently, India has one of the youngest populations in the world with a median age of 28 years. It is estimated that 90% of India’s population will remain below 60
years of age by 2020. Increase in proportion of individuals in the age bracket of 25-49, which is the target population for the industry, is expected to boost industry growth. Rapid urbanization coupled with high share of working population with rising affluence is expected to provide impetus to growth in the Indian life insurance sector.
Life Insurance – capturing higher share in financial savings The share of financial savings has begun to increase on the back of lower inflation, government impetus towards increasing formalization of the economy and subdued returns from physical assets. In FY17, led by demonetisation, incremental flow of financial savings in life insurance segments surged by 65.6%. Therefore, share of life insurance in total household financial savings (gross) increased from 17.6% in FY16 to 24.2% in FY17. Within financial savings, we expect the share of insurance to increase further, as a benign rate environment keep savers away from fixed deposits and increases the attractiveness of life insurance products for savings/protection. Moreover, with expectations of recovery in GDP growth and continued buoyancy in capital markets, we expect that ULIPs will continue to do well and dominate the bouquet of insurance products.
Increasing share of life insurance in household financial savings
Source: Company, Geojit Research
Financial savings to see an up-tick ahead
Source: Company, Geojit Research
Financial Analysis
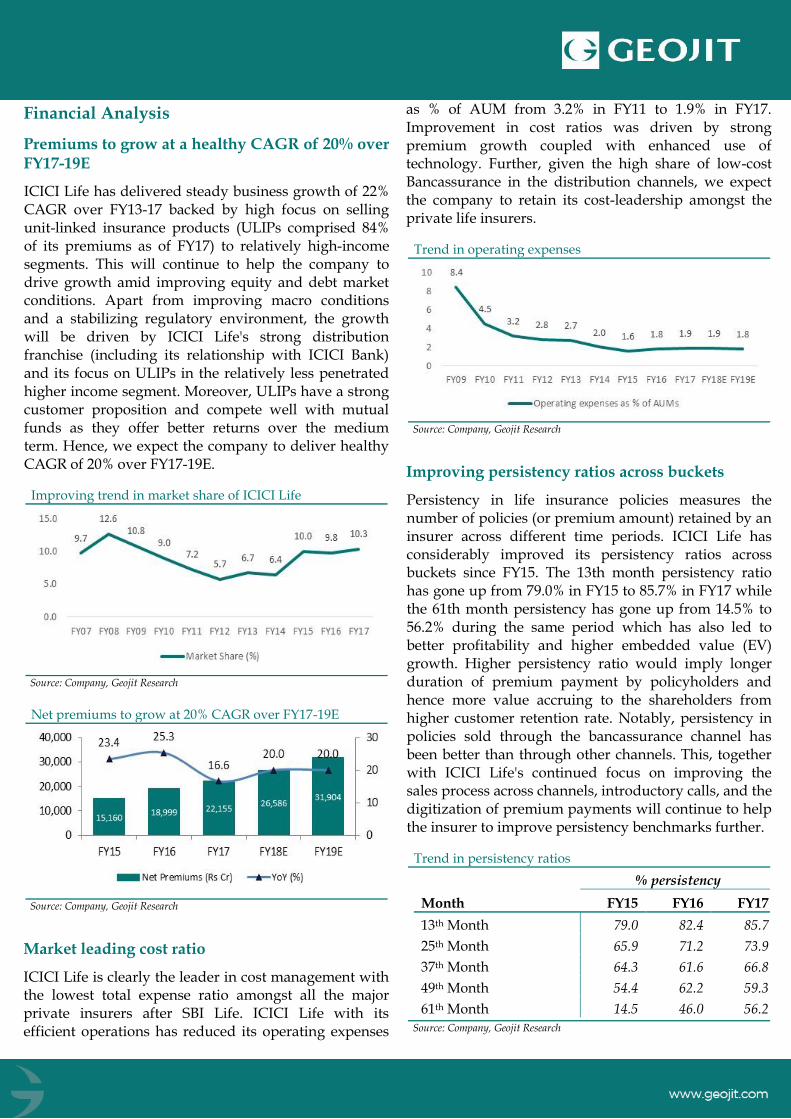
Premiums to grow at a healthy CAGR of 20% over FY17-19E
ICICI Life has delivered steady business growth of 22% CAGR over FY13-17 backed by high focus on selling unit-linked insurance products (ULIPs comprised 84% of its premiums as of FY17) to relatively high-income segments. This will continue to help the company to drive growth amid improving equity and debt market conditions. Apart from improving macro conditions and a stabilizing regulatory environment, the growth will be driven by ICICI Life's strong distribution franchise (including its relationship with ICICI Bank) and its focus on ULIPs in the relatively less penetrated higher income segment. Moreover, ULIPs have a strong customer proposition and compete well with mutual funds as they offer better returns over the medium term. Hence, we expect the company to deliver healthy CAGR of 20% over FY17-19E.
Improving trend in market share of ICICI Life
Source: Company, Geojit Research
Net premiums to grow at 20% CAGR over FY17-19E
Source: Company, Geojit Research
Market leading cost ratio
ICICI Life is clearly the leader in cost management with the lowest total expense ratio amongst all the major private insurers after SBI Life. ICICI Life with its efficient operations has reduced its operating expenses
as % of AUM from 3.2% in FY11 to 1.9% in FY17. Improvement in cost ratios was driven by strong premium growth coupled with enhanced use of technology. Further, given the high share of low-cost Bancassurance in the distribution channels, we expect the company to retain its cost-leadership amongst the private life insurers.
Trend in operating expenses
Source: Company, Geojit Research
Improving persistency ratios across buckets
Persistency in life insurance policies measures the number of policies (or premium amount) retained by an insurer across different time periods. ICICI Life has considerably improved its persistency ratios across buckets since FY15. The 13th month persistency ratio has gone up from 79.0% in FY15 to 85.7% in FY17 while the 61th month persistency has gone up from 14.5% to 56.2% during the same period which has also led to better profitability and higher embedded value (EV) growth. Higher persistency ratio would imply longer duration of premium payment by policyholders and hence more value accruing to the shareholders from higher customer retention rate. Notably, persistency in policies sold through the bancassurance channel has been better than through other channels. This, together with ICICI Life's continued focus on improving the sales process across channels, introductory calls, and the digitization of premium payments will continue to help the insurer to improve persistency benchmarks further.
Trend in persistency ratios
% persistency
Month FY15 FY16 FY17
13th Month 79.0 82.4 85.7
25th Month 65.9 71.2 73.9
37th Month 64.3 61.6 66.8
49th Month 54.4 62.2 59.3
61th Month 14.5 46.0 56.2
Source: Company, Geojit Research
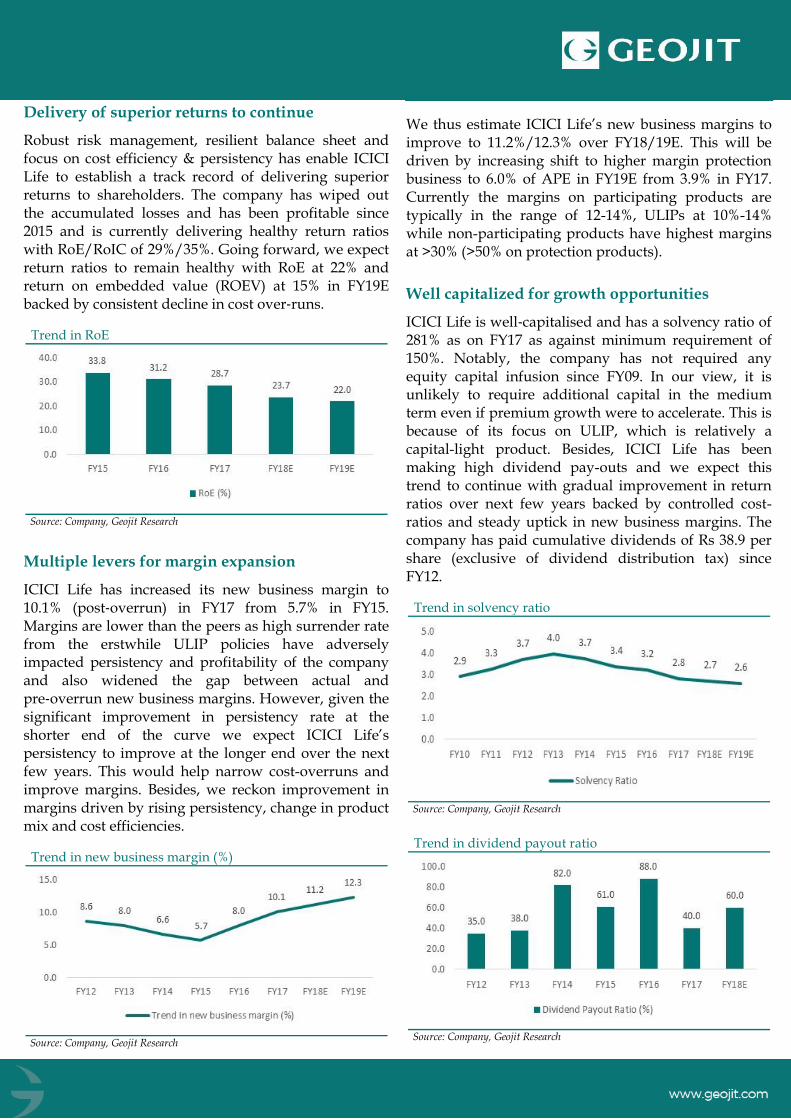
Delivery of superior returns to continue
Robust risk management, resilient balance sheet and focus on cost efficiency & persistency has enable ICICI Life to establish a track record of delivering superior returns to shareholders. The company has wiped out the accumulated losses and has been profitable since 2015 and is currently delivering healthy return ratios with RoE/RoIC of 29%/35%. Going forward, we expect return ratios to remain healthy with RoE at 22% and return on embedded value (ROEV) at 15% in FY19E backed by consistent decline in cost over‐runs.
Trend in RoE
Source: Company, Geojit Research
Multiple levers for margin expansion
ICICI Life has increased its new business margin to 10.1% (post‐overrun) in FY17 from 5.7% in FY15. Margins are lower than the peers as high surrender rate from the erstwhile ULIP policies have adversely impacted persistency and profitability of the company and also widened the gap between actual and pre‐overrun new business margins. However, given the significant improvement in persistency rate at the shorter end of the curve we expect ICICI Life’s persistency to improve at the longer end over the next few years. This would help narrow cost-overruns and improve margins. Besides, we reckon improvement in margins driven by rising persistency, change in product mix and cost efficiencies.
Trend in new business margin (%)
Source: Company, Geojit Research
We thus estimate ICICI Life’s new business margins to improve to 11.2%/12.3% over FY18/19E. This will be driven by increasing shift to higher margin protection business to 6.0% of APE in FY19E from 3.9% in FY17. Currently the margins on participating products are typically in the range of 12-14%, ULIPs at 10%-14% while non-participating products have highest margins at >30% (>50% on protection products).
Well capitalized for growth opportunities
ICICI Life is well‐capitalised and has a solvency ratio of 281% as on FY17 as against minimum requirement of 150%. Notably, the company has not required any equity capital infusion since FY09. In our view, it is unlikely to require additional capital in the medium term even if premium growth were to accelerate. This is because of its focus on ULIP, which is relatively a capital-light product. Besides, ICICI Life has been making high dividend pay-outs and we expect this trend to continue with gradual improvement in return ratios over next few years backed by controlled cost-ratios and steady uptick in new business margins. The company has paid cumulative dividends of Rs 38.9 per share (exclusive of dividend distribution tax) since FY12.
Trend in solvency ratio
Source: Company, Geojit Research
Trend in dividend payout ratio
Source: Company, Geojit Research
ICICI Pru Life Insurance: Business overview
ICICI Pru Life Insurance (ICICI Life) is a joint venture between ICICI Bank Ltd and Prudential Corporation Holdings Ltd, a part of Prudential Group. ICICI Life commenced its operations in FY01 and was among India’s first private sector life insurance companies. The company offers its customers vast and diversified products in life insurance, health insurance and pension products & services to cater to the specific needs of customers in different life stages, enabling them to meet their long-term savings and protection needs. It offers its customers access to its products and services through an extensive multi-channel sales network across India, including through the branches of bank partners, individual agents, corporate agents, its employees, offices and website. ICICI Life remains the market leader among private life insurers in terms of retail weighted received premium (RWRP) with an overall market share of 12.0% and private market share of 22.3% in FY17. Notably, the company has consistently been the market leader among private sector life insurance companies in India on a RWRP basis since FY02. ICICI Life is the first insurance company in India to be listed on the NSE and BSE. ICICI Life has a wholly owned subsidiary, ICICI Prudential Pension Funds Management Company Limited, which is registered as a fund manager with the Pensions Fund Regulatory and Development Authority of India (PFRDA).
Key risks:
➢ Product concentration risk: Over 85% of RWRP was in ULIPs as of FY17. This makes the company prone to cyclicality of the stock markets, as retail investors generally purchase ULIPs during stock market booms and vice-versa. This could impact new business premiums as well as margins. Additionally, the company has a low share of non-participating business, which is a high-margin segment.
➢ Regulatory risk: Regulatory changes can be a
key risk to the insurance industry and regulator has been tough in last few years to safeguard policyholder interest especially on mis‐selling, commission pay-outs and expense capping.
➢ Termination of bancassurance agreement: Banks which have entered into bancassurance agreements with the company are ICICI Bank, Standard Chartered Bank and Capital Small Finance Bank Limited. These are the main distribution channels for company’s insurance products. Currently, both ICICI Bank and Standard Chartered Bank exclusively distribute company’s insurance products in India. Thus, any termination of, disruption to, or any other adverse change in relationship with the banks could significantly reduce product sales and growth opportunities.
➢ Interest rate risk: Given the company’s
substantial portion of investments is held in debt securities, the interest rate fluctuations can affect investment income.
Consolidated Financials
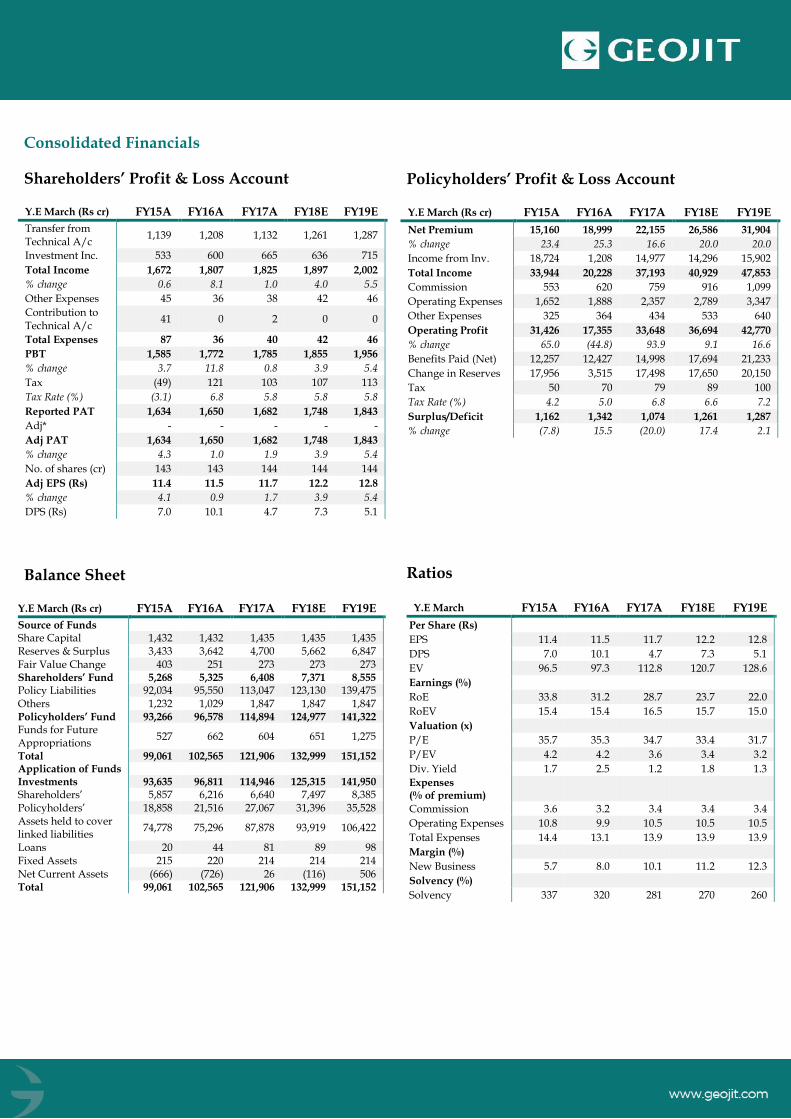
Shareholders’ Profit & Loss Account
Y.E March (Rs cr) FY15A FY16A FY17A FY18E FY19E
Transfer from Technical A/c
1,139 1,208 1,132 1,261 1,287
Investment Inc. 533 600 665 636 715
Total Income 1,672 1,807 1,825 1,897 2,002
% change 0.6 8.1 1.0 4.0 5.5
Other Expenses 45 36 38 42 46
Contribution to Technical A/c
41 0 2 0 0
Total Expenses 87 36 40 42 46
PBT 1,585 1,772 1,785 1,855 1,956
% change 3.7 11.8 0.8 3.9 5.4
Tax (49) 121 103 107 113
Tax Rate (%) (3.1) 6.8 5.8 5.8 5.8
Reported PAT 1,634 1,650 1,682 1,748 1,843
Adj* - - - - -
Adj PAT 1,634 1,650 1,682 1,748 1,843
% change 4.3 1.0 1.9 3.9 5.4
No. of shares (cr) 143 143 144 144 144
Adj EPS (Rs) 11.4 11.5 11.7 12.2 12.8
% change 4.1 0.9 1.7 3.9 5.4
DPS (Rs) 7.0 10.1 4.7 7.3 5.1
Balance Sheet
Y.E March (Rs cr) FY15A FY16A FY17A FY18E FY19E
Source of Funds Share Capital 1,432 1,432 1,435 1,435 1,435 Reserves & Surplus 3,433 3,642 4,700 5,662 6,847 Fair Value Change 403 251 273 273 273 Shareholders’ Fund 5,268 5,325 6,408 7,371 8,555 Policy Liabilities 92,034 95,550 113,047 123,130 139,475 Others 1,232 1,029 1,847 1,847 1,847 Policyholders’ Fund 93,266 96,578 114,894 124,977 141,322 Funds for Future Appropriations
527 662 604 651 1,275
Total 99,061 102,565 121,906 132,999 151,152 Application of Funds Investments 93,635 96,811 114,946 125,315 141,950 Shareholders’ 5,857 6,216 6,640 7,497 8,385 Policyholders’ 18,858 21,516 27,067 31,396 35,528 Assets held to cover linked liabilities
74,778 75,296 87,878 93,919 106,422
Loans 20 44 81 89 98 Fixed Assets 215 220 214 214 214 Net Current Assets (666) (726) 26 (116) 506 Total 99,061 102,565 121,906 132,999 151,152
Policyholders’ Profit & Loss Account
Y.E March (Rs cr) FY15A FY16A FY17A FY18E FY19E
Net Premium 15,160 18,999 22,155 26,586 31,904
% change 23.4 25.3 16.6 20.0 20.0
Income from Inv. 18,724 1,208 14,977 14,296 15,902
Total Income 33,944 20,228 37,193 40,929 47,853
Commission 553 620 759 916 1,099
Operating Expenses 1,652 1,888 2,357 2,789 3,347
Other Expenses 325 364 434 533 640
Operating Profit 31,426 17,355 33,648 36,694 42,770
% change 65.0 (44.8) 93.9 9.1 16.6
Benefits Paid (Net) 12,257 12,427 14,998 17,694 21,233
Change in Reserves 17,956 3,515 17,498 17,650 20,150
Tax 50 70 79 89 100
Tax Rate (%) 4.2 5.0 6.8 6.6 7.2
Surplus/Deficit 1,162 1,342 1,074 1,261 1,287
% change (7.8) 15.5 (20.0) 17.4 2.1
Ratios
Y.E March FY15A FY16A FY17A FY18E FY19E
Per Share (Rs)
EPS 11.4 11.5 11.7 12.2 12.8
DPS 7.0 10.1 4.7 7.3 5.1
EV 96.5 97.3 112.8 120.7 128.6
Earnings (%)
RoE 33.8 31.2 28.7 23.7 22.0
RoEV 15.4 15.4 16.5 15.7 15.0
Valuation (x)
P/E 35.7 35.3 34.7 33.4 31.7
P/EV 4.2 4.2 3.6 3.4 3.2
Div. Yield 1.7 2.5 1.2 1.8 1.3
Expenses (% of premium)
Commission 3.6 3.2 3.4 3.4 3.4
Operating Expenses 10.8 9.9 10.5 10.5 10.5
Total Expenses 14.4 13.1 13.9 13.9 13.9
Margin (%)
New Business 5.7 8.0 10.1 11.2 12.3
Solvency (%)
Solvency 337 320 281 270 260

Recommendation Summary (last 3 years)
Dates Rating Target
12-Jan-2018 BUY 450
Source: Bloomberg, Geojit Research *Initiating Coverage
Investment Rating Criteria Large Cap Stocks; Mid Cap and Small Cap;
Buy - Upside is 10% or more. Hold - Upside or downside is less than 10%. Reduce - Downside is 10% or more.
Buy - Upside is 15% or more. Accumulate* - Upside between 10% - 15%. Hold - Absolute returns between 0% - 10%. Reduce/Sell - Absolute returns less than 0%. To satisfy regulatory requirements, we attribute ‘Accumulate’ as Buy and ‘Reduce’ as Sell.
The recommendations are based on 12 month horizon, unless otherwise specified. The investment ratings are on absolute positive/negative return basis. It is possible that due to volatile price fluctuation in the near to medium term, there could be a temporary mismatch to rating. * For reasons of valuations/return/lack of clarity/event we may revisit rating at appropriate time. Please note that the stock always carries the risk of being upgraded to BUY or downgraded to a HOLD, REDUCE or SELL.
Geojit Financial Services Limited has outsourced the preparation of this research report to DION Global Solutions Limited whose relevant disclosures are
available hereunder. However, Geojit's research desk have reviewed this report for any untrue statement of material fact or any false or misleading
information.
General Disclosures and Disclaimers
CERTIFICATION
I, Kaushal Patel, employee of Dion Global Solutions Limited (Dion) is engaged in preparation of this report and hereby certify that all the views expressed in
this research report (report) reflect my personal views about any or all of the subject issuer or securities.
Disclaimer
This report has been prepared by Dion and the report & its contents are the exclusive property of the Dion and the client cannot tamper with the report or
its contents in any manner and the said report, shall in no case, be further distributed to any third party for commercial use, with or without consideration.
Geojit Financial Services Limited has outsourced the assignment of preparation of this report to Dion.
Recipient shall not further distribute the report to a third party for a commercial consideration as this report is being furnished to the recipient solely for the
purpose of information.
Dion has taken steps to ensure that facts in this report are based on reliable information but cannot testify, nor make any representation or warranty, express
or implied, to the accuracy, contents or data contained within this report. It is hereby confirmed that wherever Dion has employed a rating system in this
report, the rating system has been clearly defined including the time horizon and benchmarks on which the rating is based.
Descriptions of any company or companies or their securities mentioned herein are not intended to be complete and this report is not, and should not be
construed as an offer or solicitation of an offer, to buy or sell any securities or other financial instruments. Dion has not taken any steps to ensure that the
securities referred to in this report are suitable for any particular investor. This report is not to be relied upon in substitution for the exercise of independent
judgment. Opinions or estimates expressed are current opinions as of the original publication date appearing on this report and the information, including
the opinions and estimates contained herein, are subject to change without notice. Dion is under no duty to update this report from time to time.
Dion or its associates including employees engaged in preparation of this report and its directors do not take any responsibility, financial or otherwise, of
the losses or the damages sustained due to the investments made or any action taken on basis of this report, including but not restricted to, fluctuation in the
prices of securities, changes in the currency rates, diminution in the NAVs, reduction in the dividend or income, etc.
The investments or services contained or referred to in this report may not be suitable for all equally and it is recommended that an independent investment
advisor be consulted. In addition, nothing in this report constitutes investment, legal, accounting or tax advice or a representation that any investment or
strategy is suitable or appropriate to individual circumstances or otherwise constitutes a personal recommendation of Dion.

Geojit Financial Services Ltd. (formerly known as Geojit BNP Paribas Financial Services Ltd.), Registered Office: 34/659-P, Civil Line Road, Padivattom, Kochi-682024, Kerala, India. Phone: +91 484-2901000, Fax: +91 484-2979695, Website: geojit.com. For investor queries: [email protected], For grievances: [email protected], For compliance officer: [email protected].
Corporate Identity Number: L67120KL1994PLC008403, SEBI Regn.Nos.: NSE: INB/INF/INE231337230 I BSE:INB011337236 & INF011337237 | MSEI: INE261337230, INB261337233 & INF261337233, Research Entity SEBI Reg No: INH200000345, Investment Adviser SEBI Reg No: INA200002817, Portfolio Manager:INP000003203, NSDL: IN-DP-NSDL-24-97, CDSL: IN-DP-CDSL-648-2012, ARN Regn.Nos:0098, IRDA Corporate Agent (Composite) No.: CA0226. Research Entity SEBI Registration Number: INH200000345
REGULATORY DISCLOSURES:
Dion is engaged in the business of developing software solutions for the global financial services industry across the entire transaction lifecycle and inter-
alia provides research and information services essential for business intelligence to global companies and financial institutions. Dion is listed on BSE
Limited (BSE) and is also registered under the SEBI (Research Analyst) Regulations, 2014 (SEBI Regulations) as a Research Analyst vide Registration No.
INH100002771. Dion’s activities were neither suspended nor has it defaulted with requirements under the Listing Agreement and / or SEBI (Listing
Obligations and Disclosure Requirements) Regulations, 2015 with the BSE in the last five years. Dion has not been debarred from doing business by BSE /
SEBI or any other authority.
In the context of the SEBI Regulations, we affirm that we are a SEBI registered Research Analyst and in the course of our business, we issue research reports
/research analysis etc that are prepared by our Research Analysts. We also affirm and undertake that no disciplinary action has been taken against us or our
Analysts in connection with our business activities.
In compliance with the above mentioned SEBI Regulations, the following additional disclosures are also provided which may be considered by the reader
before making an investment decision:
1. Disclosures regarding Ownership
Dion confirms that:
(i) It/its associates have no financial interest or any other material conflict in relation to the subject company (ies) covered herein at the time of
publication of this report.
(ii) It/its associates have no actual / beneficial ownership of 1% or more securities of the subject company (ies) covered herein at the end of the
month immediately preceding the date of publication of this report.
Further, the Research Analyst confirms that:
(i) He, his associates and his relatives may have financial interest in the subject company (ies) covered herein, and they may have other material
conflict in the subject company at the time of publication of this report.
(ii) He, his associates and his relatives have no actual/beneficial ownership of 1% or more securities of the subject company (ies) covered herein at the
end of the month immediately preceding the date of publication of this report.
2. Disclosures regarding Compensation:
During the past 12 months, Dion or its Associates:
(a) Have not managed or co-managed public offering of securities for the subject company (b) may have received any compensation for investment banking
or merchant banking or brokerage services from the subject company (c) may have received compensation for products or services other than investment
banking or merchant banking or brokerage services from the subject (d) Have not received any compensation or other benefits from the subject company or
third party in connection with this report.
3. Disclosure regarding the Research Analyst’s connection with the subject company:
It is affirmed that I, Kaushal Patel employed as Research Analyst by Dion and engaged in the preparation of this report have not served as an officer,
director or employee of the subject company
4. Disclosure regarding Market Making activity:
Neither Dion /its Research Analysts have engaged in market making activities for the subject company.
Copyright in this report vests exclusively with Dion.
Please ensure that you have read the “Risk Disclosure Documents for Capital Market and Derivatives Segments” as prescribed by the Securities and
Exchange Board of India before investing.