company presentation - datalogic.com · fare clic per modificare lo stile del titolo company...
TRANSCRIPT

Fare clic per modificare lo stile del titolo
Company Presentation
Star ConferenceMilan, 5th March 2008

2© Copyright Datalogic 2007
�THE GROUP
�DATALOGIC OFFER
�FINANCIAL HIGHLIGHTS
3© Copyright Datalogic 2007
Datalogic Mission
“Promote and provide business solutions for datamanagement by offering high value systems, products and services to mark, capture, computeand communicate (M&3CTM) information anywhere and anytime, to generate a high ROI for our Customers”
Datalogic Values
� Enthusiasm� Commitment� Professionalism
� Ethics� Persistence� Teamwork
Datalogic Vision
““To be Top of To be Top of MindMind whenwhen thinkingthinking aboutabout needsneedsin the in the itemitem identificationidentification valuevalue chainchain””

4© Copyright Datalogic 2007
A Wide International Coverage
8 Manufacturing Plants 5 R&D Centers
32 Sales & Service Offices serving more than 100 countries

5© Copyright Datalogic 2007
2001 – 2007: a history of growth...
111,7131,5
146,3
205,9
381,6404,0
118,0
50,1
16,1 17,0 21,3 25,2 31,5 38,2
2001 2002 2003 2004* 2005* 2006* 2007*Rev enues
EBITDA
Laservall AcquisitionLaser Marking sectorClosing: Dec 2004Pr ice: €14mConsolidated from 1H04
Informatics AcquisitionAutomatic and identif ication sectorClosing: March 2005Pr ice: €18.2m Consolidated for 10 months
PSC AcquisitionClosing: November 2005Pr ice: approximately USD 195 mConsolidated for 1 month
Note: (*) IAS compliant
(In million Euro)
CAGR 2001 – 2007 = 24%

6© Copyright Datalogic 2007
2001 – 2007: Share Performance
0,060,22
1,22
0,180,150,05
Dividend FY01
Dividend FY 02
Div idend FY03
Div idend FY04*
Dividend FY 05
Div idend FY06
(In Euro)
IPO Price (29th March 2001) = € 20,00
Share price (20th Febr. 2008) = € 6,01 (split 4*1) = € 24,04+20%
Tot. extraordinary dividends paied:
€ 3,81m
Dividend of € 1,22 per share, of which € 1 Extraordinary
In May 2006, splitting of share capital (4 shares for each existing)
(0,06*4) = € 0,24
€ 0,58mTot. ordinary dividends paied: € 1,70m € 2,11m € 2,69m € 3,49m
€ 12,35m= € 26,73m for six years
on ~12m shares on ~15,9m shares on~63,6m shares
Note: The BoD (held on February 14th, 2008) will propose to the Shareholders AGM a dividend equal to Euro 0,07 per share (withcoupon detachment on April 28th 2008 and payment on May 2nd 2008)
7© Copyright Datalogic 2007
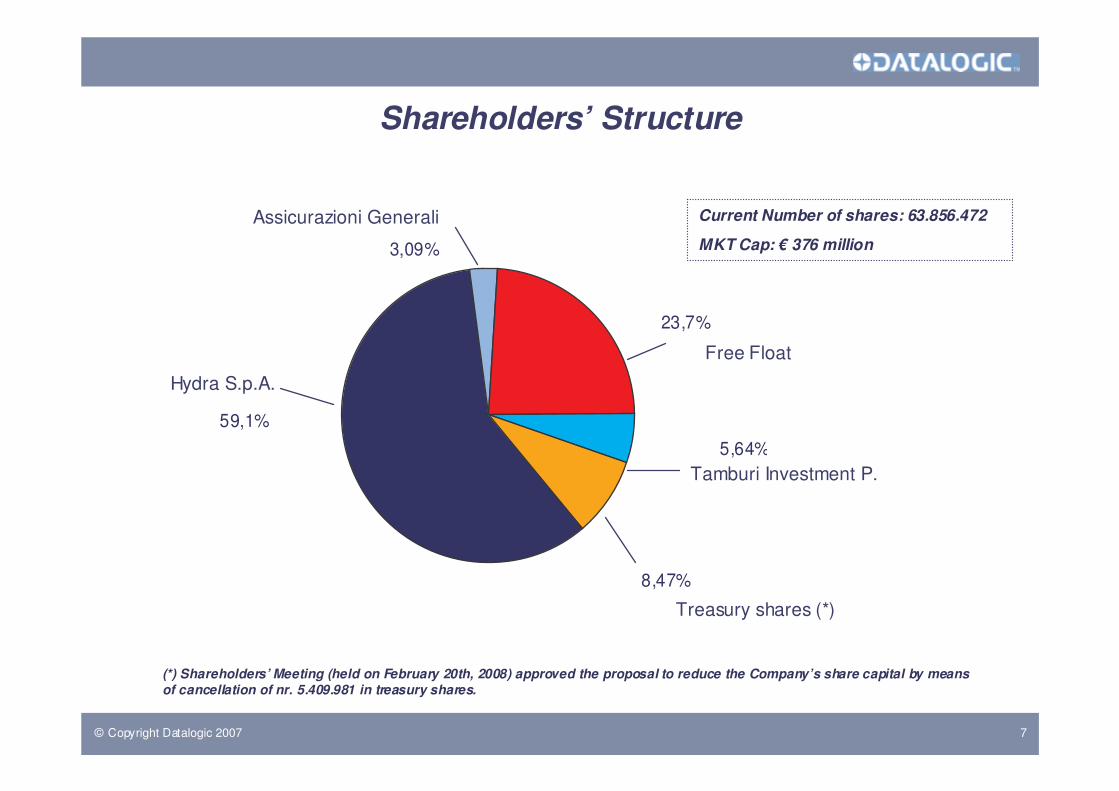
Shareholders’ Structure
5,64%
3,09%
23,7%
59,1%
8,47%
Current Number of shares: 63.856.472
MKT Cap: € 376 million
Assicurazioni Generali
Free Float
Tamburi Investment P.
Hydra S.p.A.
Treasury shares (*)
(*) Shareholders’ Meeting (held on February 20th, 2008) approved the proposal to reduce the Company’s share capital by meansof cancellation of nr. 5.409.981 in treasury shares.

8© Copyright Datalogic 2007
3rd Player in the ADC Market

9© Copyright Datalogic 2007
Datalogic Group: current structure
Datalogic MobileHQ Bologna, Italy
Datalogic AutomationHQ Bologna, Italy
Business DevelopmentHQ Bologna, Italy
Datalogic ScanningHQ Eugene, OR, USA
DATALOGIC SpAHQ BOLOGNA, CORPORATE
Steering CommitteeExecutive Management
Board of Directors

10© Copyright Datalogic 2007
�THE GROUP
�DATALOGIC OFFER
�FINANCIAL HIGHLIGHTS

11© Copyright Datalogic 2007
Hand Held ScannersDatalogic Scanning Division
#2 Worldwide Market Share 16,3%
� CompetitorsEMEA Symbol, MetrologicAMERICAS Symbol, Metrologic, Intermec, HHPASIA Symbol, Denso, Opticon

12© Copyright Datalogic 2007
Fixed Position Scanners for RetailDatalogic Scanning Division
#1 WorldwideMarket Share 25,1%
� CompetitorsEMEA NCR, Symbol, AMERICAS NCR, SymbolASIA Fujitsu

13© Copyright Datalogic 2007
Mobile ComputersDatalogic Mobile Division#4 in EMEA and #4 Worldwide
Emea Market Share 8,9% - Worldwide Market Share 5,9%
� CompetitorsEMEA Symbol, Psion-TeklogixAMERICAS Symbol, Intermec

14© Copyright Datalogic 2007
Unattended Scanning Systems - IndustrialDatalogic Automation Division
#1 in EMEA and #3 WorldwideEmea Market Share 27,3% - Worldwide Market Share 13,7%
� CompetitorsEMEA SickAMERICAS Accu-SortASIA Toheken
15© Copyright Datalogic 2007
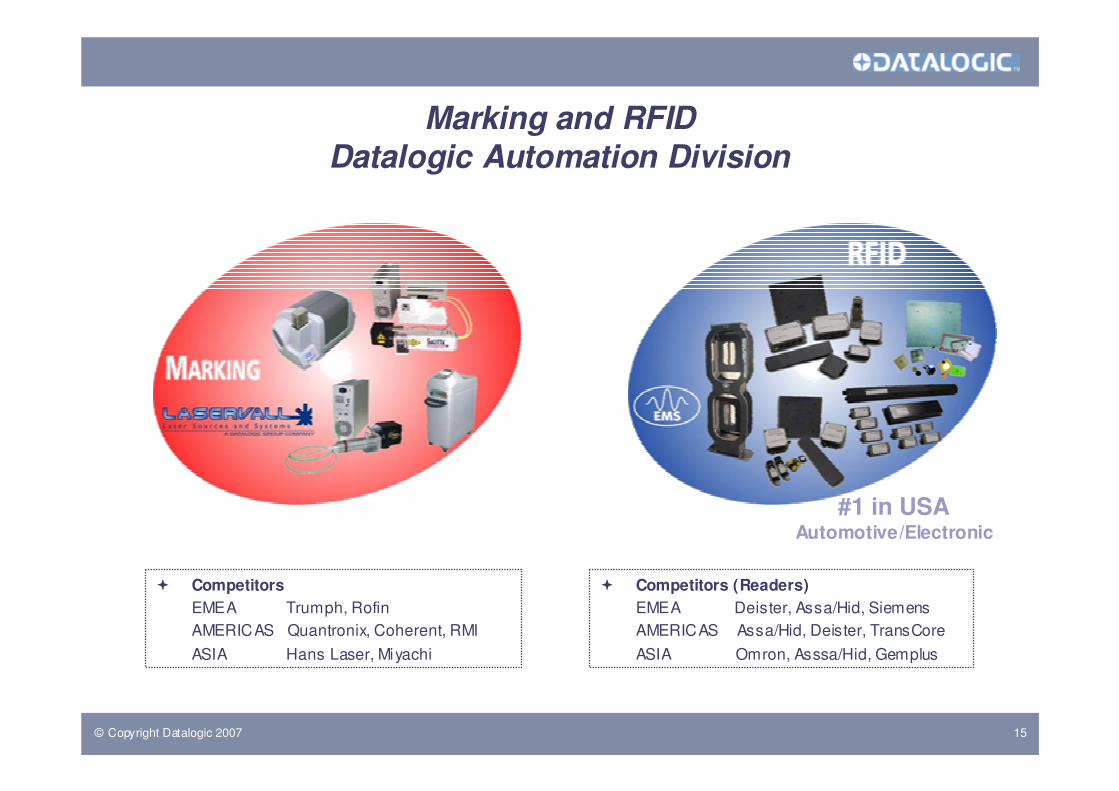
Marking and RFIDDatalogic Automation Division
#1 in USAAutomotive/Electronic
� CompetitorsEMEA Trumph, RofinAMERICAS Quantronix, Coherent, RMIASIA Hans Laser, Miyachi
� Competitors (Readers)EMEA Deister, Assa/Hid, SiemensAMERICAS Assa/Hid, Deister, TransCoreASIA Omron, Asssa/Hid, Gemplus

16© Copyright Datalogic 2007
212 installations at 31st Dec. 07
Business Development Division
Enterprise Business Solutions SMB Barcode Solutions - Informatics
17© Copyright Datalogic 2007
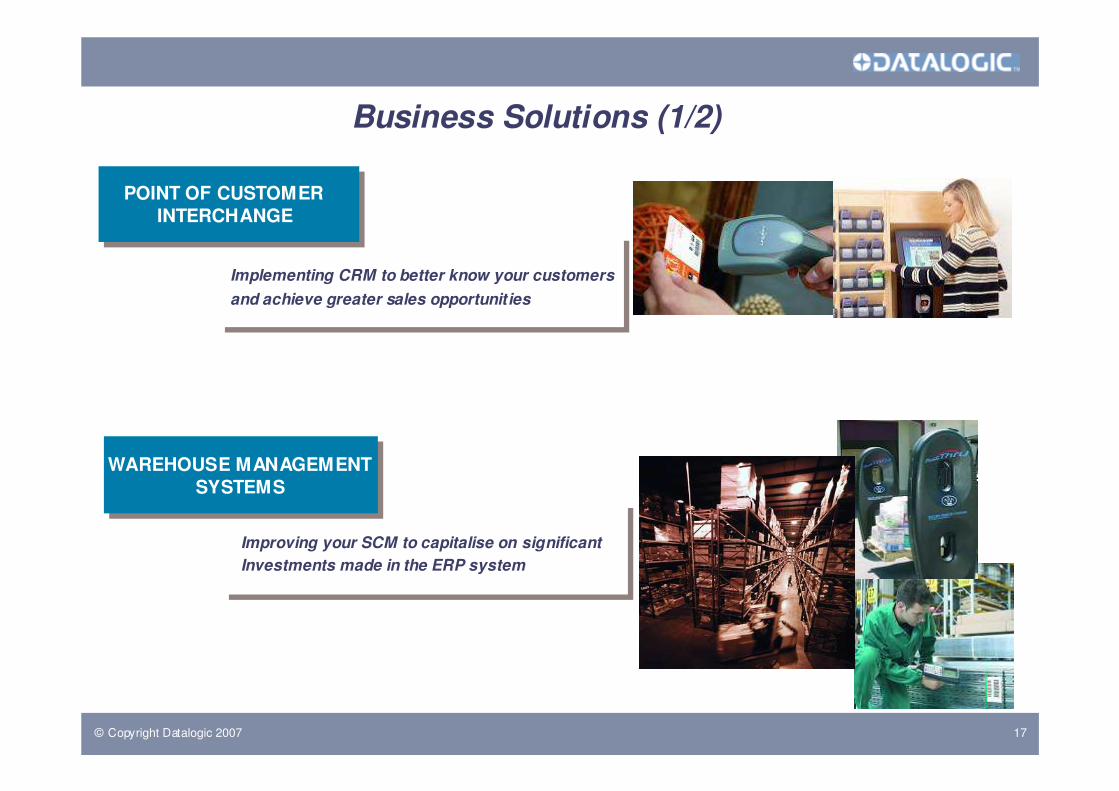
Business Solutions (1/2)Business Solutions (1/2)
POINT OF CUSTOMER INTERCHANGE
Implementing CRM to better know your customersand achieve greater sales opportunities
WAREHOUSE MANAGEMENTSYSTEMS
Improving your SCM to capitalise on significantInvestments made in the ERP system
18© Copyright Datalogic 2007
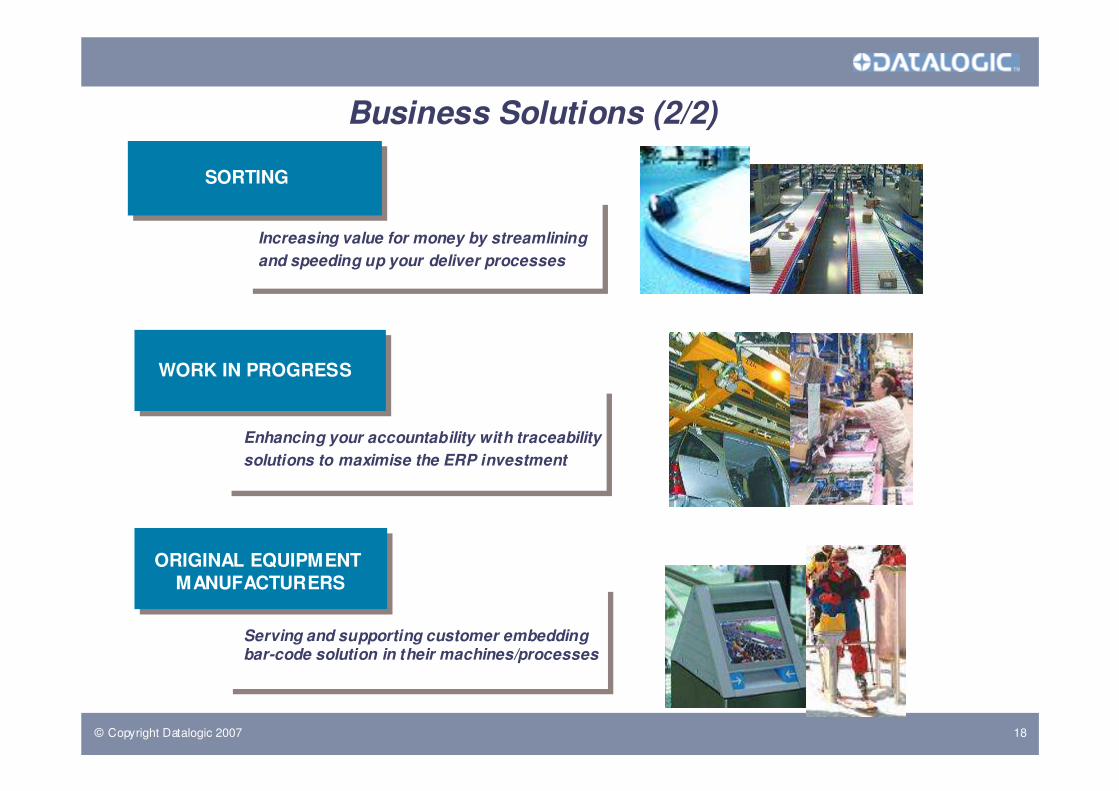
Business Solutions (2/2)Business Solutions (2/2)
SORTING
Increasing value for money by streamliningand speeding up your deliver processes
WORK IN PROGRESS
Enhancing your accountability with traceabilitysolutions to maximise the ERP investment
ORIGINAL EQUIPMENTMANUFACTURERS
Serving and supporting customer embeddingbar-code solution in their machines/processes

19© Copyright Datalogic 2007
�THE GROUP
�DATALOGIC OFFER
�FINANCIAL HIGHLIGHTS

20© Copyright Datalogic 2007
Consolidated Income StatementFY06 % FY07 % Ratios
Revenues 381.614 100,0% 404.027 100,0% 5,9%COGS (214.544) -56,2% (224.298) -55,5%Gross Operating Margin 167.070 43,8% 179.729 44,5% 7,6%R&D (26.313) -6,9% (24.992) -6,2%G&A (28.752) -7,5% (36.746) -9,1%Distribution Costs (83.915) -22,0% (77.503) -19,2%Other Rev/(Charges) (2.056) -0,5% (2.695) -0,7%Ordinary Operating Profit (EB ITANR) (*) 26.034 6,8% 37.793 9,4% 45,2%Not recurring costs/rev (6.315) -1,7% (2.622) -0,6%Amort. intang. assets from acquis. (4.345) -1,1% (4.087) -1,0%Operating Profit (EBIT) 15.374 4,0% 31.084 7,7% 102,2%Financial (costs)/rev. (5.160) -1,4% (4.608) -1,1%Results from equity investments (53) 0,0% 396 0,1%Foreing exchange (costs)/rev. (1.128) -0,3% (253) -0,1%EB T 9.033 2,4% 26.619 6,6% 194,7%Taxes (4.767) -1,2% (8.536) -2,1%Net Income 4.266 1,1% 18.083 4,5% 323,9%Third Parties Income (141) 0,0% 0 0,0%Group Net Income 4.125 1,1% 18.083 4,5% 338,4%
Depreciation (8.309) -2,2% (7.655) -1,9%Amortization (3.894) -1,0% (4.646) -1,1%EB ITD A 38.237 10,0% 50.094 12,4% 31,0%
(*) Ordinary Operating Profit before not recurring costs/revenues and amortization of intangible assets from acquisition (EBITANR)
(Euro/1.000)

21© Copyright Datalogic 2007
Segment Reporting: April – Dec. 2007
Mobile Automation Business Dev.
Scanning C ost not allocated
Adj. Total Group
Revenues 65.907 55.995 34.051 145.945 4.447 (6.383) 299.962COGS (39.125) (27.607) (19.503) (87.002) (122) 7.112 (166.247)Gross Operating Margin 26.782 28.388 14.548 58.943 4.325 729 133.715% on total rev . 40,6% 50,7% 42,7% 40,4% 97,3% -11,4% 44,6%R&D (3.430) (5.130) (627) (8.439) (441) 82 (17.985)G&A (6.185) (8.239) (2.757) (12.805) (1.106) 1.649 (29.443)Distribution Costs (14.715) (12.627) (7.531) (27.880) (87) 5.199 (57.641)Other Rev/(Charges) 5.224 957 (114) 1.270 (1.117) (8.016) (1.796)
Ordinary Operating Profit (EB ITANR) (*)
7.676 3.349 3.519 11.089 1.574 (357) 26.850
% on total rev . 11,6% 6,0% 10,3% 7,6% 35,4% 5,6% 9,0%Not recurring costs/rev (173) 1.171 0 (9) (208) (2.178) (1.397)Amort. intang. assets from acquis. (289) (971) (431) (1.342) 0 0 (3.033)Operating Profit (EBIT) 7.214 3.549 3.088 9.738 1.366 (2.535) 22.420% on total rev . 10,9% 6,3% 9,1% 6,7% 30,7% 39,7% 7,5%
Depreciation&Amortization (2.090) (2.168) (274) (3.617) (1.089) 0 (9.238)EB ITD A 9.766 5.517 3.793 14.706 2.663 (357) 36.088% on total rev . 14,8% 9,9% 11,1% 10,1% 59,9% 5,6% 12,0%
(*) Ordinary Operating Profit before not recurring costs/revenues and amortization of intangible assets from acquisition (EBITANR)
(Euro/1.000)

22© Copyright Datalogic 2007
Revenues Details
4Q07 %
Datalog ic Mob ile 24.222 23%
Datalog ic Automation 20.350 19%
Datalog ic Scanning 50.970 48%
Business Development 10.977 10%
Revenues (*) 106.519 100%
FY06 FY07 Var. %
Italy 37.973 39.653 4%
E urope 153.694 168.219 9%
North America 124.504 116.442 -6%
ROW 65.443 79.713 22%
Revenues 381.614 404.027 6%
Row20%
Italy10%
Europe41%
North America
29%
FY07 REVENUES BY GEOGRAPHIC AREA
(Euro/1.000)
4Q07 REVENUES BY DIVISION
BD10%
DL Scanning
48%
DL Automation
19%
DL Mobile23%
(*) Including intersegment sales and before adjustments for € 28
23© Copyright Datalogic 2007
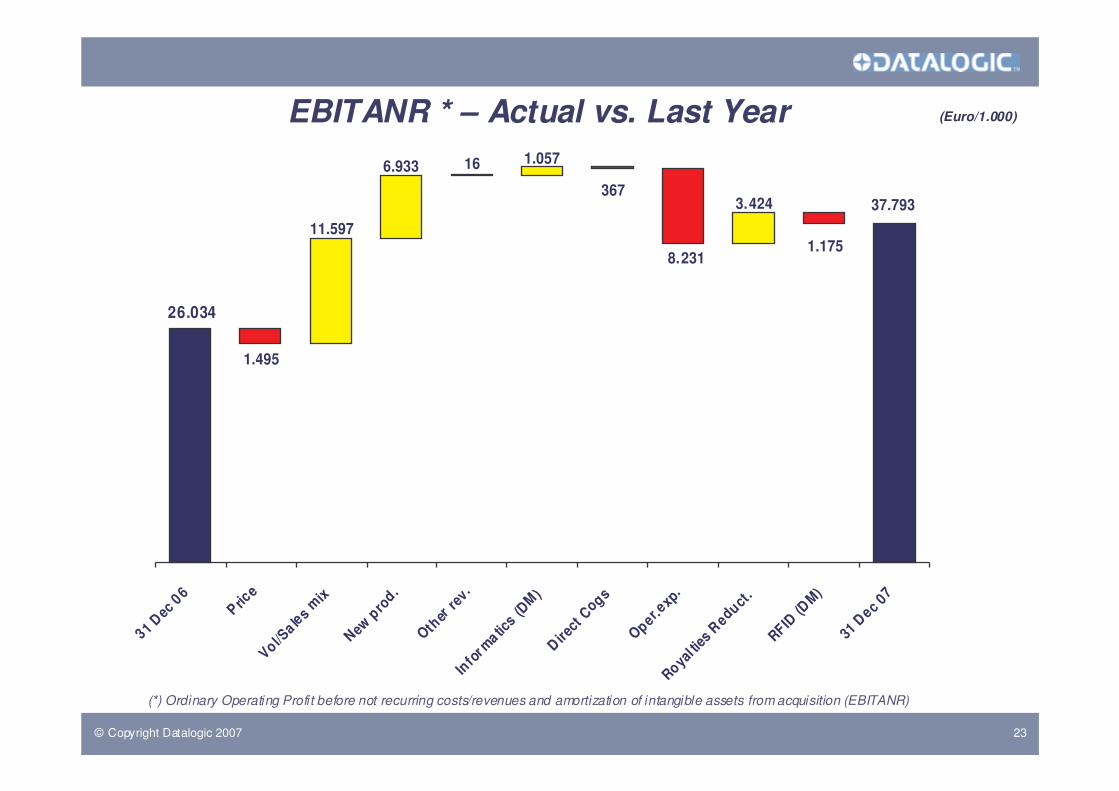
EBITANR * – Actual vs. Last Year
26.034
8.231
1.057166.933
11.597
1.495
3.424367
37.793
1.175
31 Dec
06
P rice
Vol/Sa le s
mix
New p
rod.
Other
rev.
Info
rma tic
s (DM )
Direct
Cogs
Oper.e
xp.
Royal ti
es R
educt
.
RFID (D
M)
31 D
ec 07
(Euro/1.000)
(*) Ordinary Operating Profit before not recurring costs/revenues and amortization of intangible assets from acquisition (EBITANR)

24© Copyright Datalogic 2007
Consolidated Balance Sheet
FY06 FY07
Fixed Assets 227.254 204.065Receivables 90.917 101.685Inventory 52.005 51.158Payables (78.042) (85.413)Net Working Capital 64.880 67.430Employees' severance Indemn. (7.624) (6.565)Risk Funds (10.503) (10.818)Other liabilities (29.040) (18.086)Net Invested Capital 244.967 236.026
Equity 186.610 173.482Net Financial Position -58.357 -62.544
(Euro/1.000)

25© Copyright Datalogic 2007
Net Debt
58.35762.544
2.49419.946
12.564
3.661
34.075
Net D
ebt D
ec06
Operat
ing c
ash
Flow
NWC
Capex
Purch
./sale
own shar
es
D ivide
nds
Escro
w Reim
burse
men
t
Other
sNet
Deb
t Dec
07
3.805
4.208
Acc. Rec. - 4.958
Inventory + 847
Acc. Payables - 3.281
Other + 3.731
Net Income +18.083
Deprec&Amort +16.388
Result Eq. inv. -396
(Euro/1.000)