company presentation for the first quarter of fiscal year
TRANSCRIPT

© 2021 NTT DATA Corporation
August 5, 2021NTT DATA Corporation
Company Presentation for the First Quarter of Fiscal Year Ending March 31, 2022 This English text is a translation of
the Japanese original. The Japanese Original is authoritative.
INDEX
Cautionary Statement Regarding Forward-looking Statements
※Forecast figures in this document are based on current economic and market conditions. As changes in the global economy and information services market are possible, NTT DATA Group cannot guarantee their accuracy.
※Services, products, and other names contained within this handout are trademarks, registered or otherwise, of NTT DATA Corporation or other companies.
1. Results for the First Quarter of Fiscal Year Ending March 31, 2022
2. Appendices
• Business topics
• Explanatory details of financial results and forecasts
• Mid- to long-term financial trends
© 2021 NTT DATA Corporation 1

© 2021 NTT DATA Corporation 2
1
Results for the First Quarter of Fiscal Year Ending March 31, 2022

2021/3 1st Quarter Results (Apr-Jun)
2022/3 1st Quarter Results (Apr-Jun)
YoY(Amount)
YoY(Rate)
New Orders Received 615.4 589.8 -25.6 -4.2%
Net Sales 530.9 590.8 +59.9 +11.3%
Operating Income(Operating income margin)
26.7(5.0%)
47.3(8.0%)
+20.6(+3.0P)
+77.1%
Net Income Attributable to Shareholders of NTT DATA 19.1 31.1 +11.9 +62.3%
Results for the First Quarter of Fiscal Year Ending March 31, 2022
(Billions of Yen, %)
Favorable results in both domestic and overseas businesses, and steady progress toward full-year forecasts.• New orders received decreased due to fewer orders of domestic large-scale projects than the previous fiscal year.• Net sales increased due to sales growth in all segments and the impact of foreign exchange rates.• Operating income increased due to sales growth and seeing results of overseas Structural Transformation.
3© 2021 NTT DATA Corporation
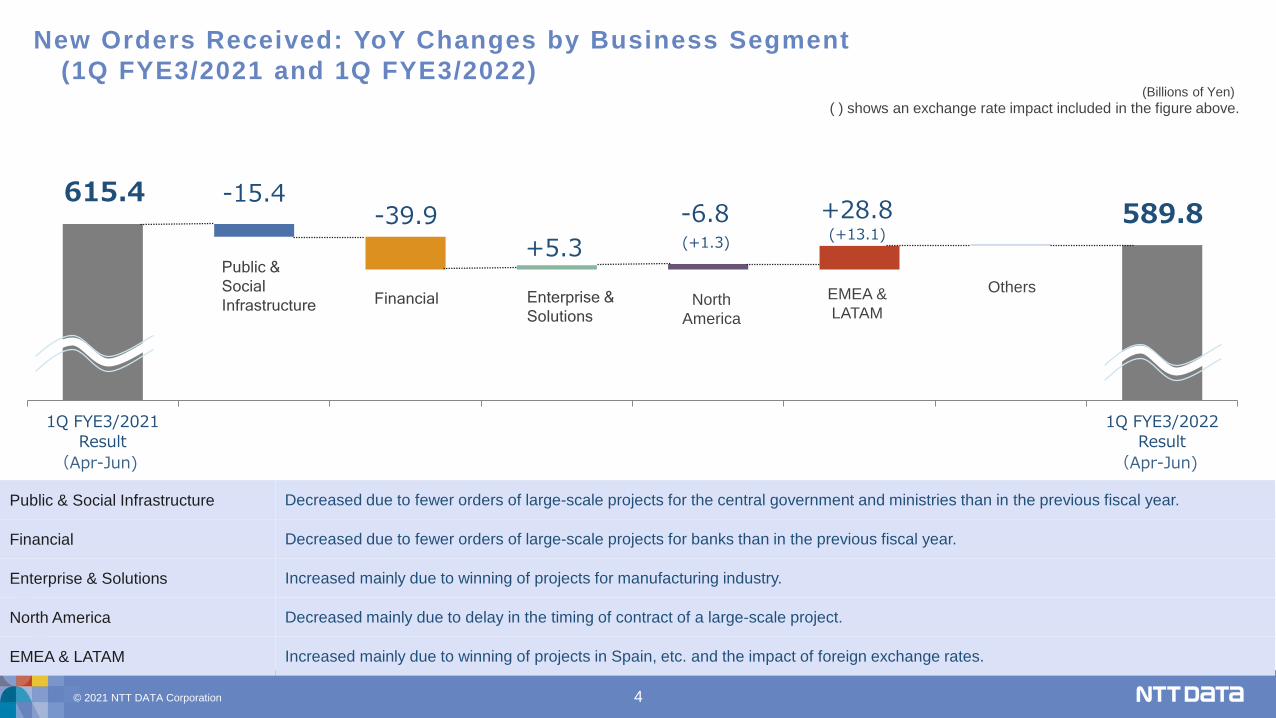
615.4 589.8
-15.4-39.9
+5.3 -6.8 +28.8
1Q FYE3/2021Result
1Q FYE3/2022Result
(Apr-Jun) (Apr-Jun)
(+13.1)
New Orders Received: YoY Changes by Business Segment(1Q FYE3/2021 and 1Q FYE3/2022)
(Billions of Yen)
Public & Social Infrastructure Decreased due to fewer orders of large-scale projects for the central government and ministries than in the previous fiscal year.
Financial Decreased due to fewer orders of large-scale projects for banks than in the previous fiscal year.
Enterprise & Solutions Increased mainly due to winning of projects for manufacturing industry.
North America Decreased mainly due to delay in the timing of contract of a large-scale project.
EMEA & LATAM Increased mainly due to winning of projects in Spain, etc. and the impact of foreign exchange rates.
( ) shows an exchange rate impact included in the figure above.
Public & Social Infrastructure Financial Enterprise &
SolutionsEMEA & LATAM
North America
(+1.3)
Others
© 2021 NTT DATA Corporation 4

530.9
590.8
+12.6 +8.5 +11.5 +9.0
+25.7
1QFYE3/2021Results
1QFYE3/2022Results
(Apr-Jun) (Apr-Jun)
Net Sales: YoY Changes by Business Segment(1Q FYE3/2021 and 1Q FYE3/2022) (Billions of Yen)
( ) shows an exchange rate impact included in the figure above.
(+13.3)
Others
Public & Social Infrastructure
FinancialEnterprise & Solutions
EMEA & LATAMNorth
America
(+2.1)
Public & Social Infrastructure Increased mainly due to the expansion in the scale of services for the telecom industry.
Financial Increased mainly due to the expansion in the scale of services for financial institutions.
Enterprise & Solutions Increased mainly due to the expansion in the scale of services for manufacturing industry and retail and service sectors.
North America Increased mainly due to the expansion in the scale of services for Healthcare and financial institutions driven by less impact of Covid-19, and also the impact of foreign exchange rate.
EMEA & LATAM Increased due to the expansion in the scale of services driven by less impact of Covid-19 mainly in Spain, and also the impact of foreign exchange rate.
© 2021 NTT DATA Corporation 5

Public & Social Infrastructure Although there was an increase by sales growth, remained on per with the last fiscal year mainly due to cost increase by proposal activity for expanding our business fields.
Financial Increased mainly due to sales growth.
Enterprise & Solutions Increased mainly due to sales growth and increased profitability driven by less impact of covid-19.
North America Increased due to sales growth, decrease in the expense and seeing results of Structural Transformation.
EMEA & LATAM Increased due to sales growth and seeing results of Structural Transformation.
26.7
47.3
-0.4 +2.0 +5.5
+5.6 +5.7
1QFYE3/2021Results
1QFYE3/2022Results
(Apr-Jun)
Operating Income: YoY Changes by Business Segment(1Q FYE3/2021 and 1Q FYE3/2022) (Billions of Yen)
( ) shows an exchange rate impact included in the figure above.
(+0.5)
(+0.1)
Others
Public & Social Infrastructure
FinancialEnterprise & Solutions
EMEA & LATAMNorth America
(Apr-Jun)
© 2021 NTT DATA Corporation 6

Public & Social Infrastructure (1Q FYE3/2021 and 1Q FYE3/2022)
New Orders Received Decreased due to fewer orders of large-scale projects for the central government and ministries than in the previous fiscal year.
Net Sales Increased mainly due to the expansion in the scale of services for the telecom industry.
Operating Income Although there was an increase by sales growth, remained on per with the last fiscal year mainly due to cost increase by proposal activity for expanding our business fields.
2021/3 1st Quarter Results (Apr-Jun)
2022/3 1st Quarter Results (Apr-Jun)
YoY(Amount)
YoY(Rate)
New Orders Received 173.1 157.7 -15.4 -8.9%
Net Sales 109.3 121.9 +12.6 +11.5%
Operating Income(Operating income margin)
11.0(10.0%)
10.6(8.7%)
-0.4(-1.4P)
-3.5%
(Billions of Yen, %)
© 2021 NTT DATA Corporation 7

2021/3 1st Quarter Results (Apr-Jun)
2022/3 1st Quarter Results (Apr-Jun)
YoY(Amount)
YoY(Rate)
New Orders Received 170.7 130.9 -39.9 -23.3%
Net Sales 138.1 146.6 +8.5 +6.2%
Operating Income(Operating income margin)
10.6(7.7%)
12.6(8.6%)
+2.0(+0.9P)
+19.3%
Financial (1Q FYE3/2021 and 1Q FYE3/2022)
New Orders Received Decreased due to fewer orders of large-scale projects for banks than in the previous fiscal year.
Net Sales Increased mainly due to the expansion in the scale of services for financial institutions.
Operating Income Increased mainly due to sales growth.
(Billions of Yen, %)
© 2021 NTT DATA Corporation 8
2021/3 1st Quarter Results (Apr-Jun)
2022/3 1st Quarter Results (Apr-Jun)
YoY(Amount)
YoY(Rate)
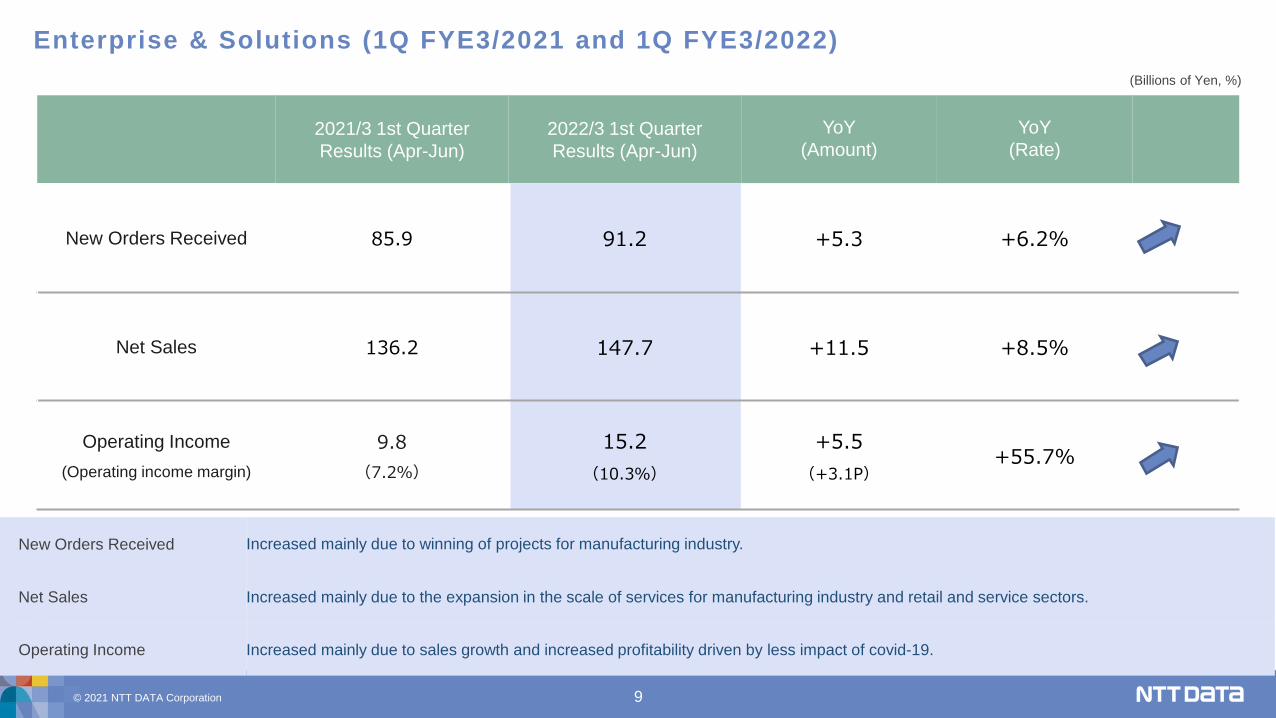
New Orders Received 85.9 91.2 +5.3 +6.2%
Net Sales 136.2 147.7 +11.5 +8.5%
Operating Income(Operating income margin)
9.8(7.2%)
15.2(10.3%)
+5.5(+3.1P)
+55.7%
Enterprise & Solutions (1Q FYE3/2021 and 1Q FYE3/2022)
New Orders Received Increased mainly due to winning of projects for manufacturing industry.
Net Sales Increased mainly due to the expansion in the scale of services for manufacturing industry and retail and service sectors.
Operating Income Increased mainly due to sales growth and increased profitability driven by less impact of covid-19.
(Billions of Yen, %)
© 2021 NTT DATA Corporation 9

2021/3 1st Quarter Results (Apr-Jun)
2022/3 1st Quarter Results (Apr-Jun)
YoY(Amount)
YoY(Rate)
New Orders Received 77.1 70.3 -6.8 -8.8%
Net Sales 105.0 114.0 +9.0 +8.6%
EBITA(EBITA margin)
1.5(1.4%)
7.2(6.3%)
+5.7(+4.9P)
-
Operating Income(Operating income margin)
-1.3(-1.3%)
4.3(3.7%)
+5.6(+5.0P)
-
North America (1Q FYE3/2021 and 1Q FYE3/2022)
New Orders Received Decreased mainly due to delay in the timing of contract of a large-scale project.
Net Sales Increased mainly due to the expansion in the scale of services for Healthcare and financial institutions driven by less impact of Covid-19, and also the impact of foreign exchange rate.
EBITA Increased due to sales growth, decrease in the expense and seeing results of Structural Transformation.
Operating Income Increased due to sales growth, decrease in the expense and seeing results of Structural Transformation.
(*1)
(Billions of Yen, %)
(*1) EBITA = operating income + amortization of intangible assets subject to purchase price allocation (PPA) arising from acquisition and others.
© 2021 NTT DATA Corporation 10

2021/3 1st Quarter Results (Apr-Jun)
2022/3 1st Quarter Results (Apr-Jun)
YoY(Amount)
YoY(Rate)
New Orders Received 101.3 130.1 +28.8 +28.4%
Net Sales 105.9 131.6 +25.7 +24.2%
EBITA(EBITA margin)
-0.7(-0.6%)
5.0(3.8%)
+5.7(+4.5P)
-
Operating Income(Operating income margin)
-1.6(-1.6%)
4.0(3.1%)
+5.7(+4.6P)
-
EMEA & LATAM (1Q FYE3/2021 and 1Q FYE3/2022)
(*1)
New Orders Received Increased mainly due to winning of projects in Spain, etc. and the impact of foreign exchange rates.
Net Sales Increased due to the expansion in the scale of services driven by less impact of Covid-19 mainly in Spain, and also the impact of foreign exchange rate.
EBITA Increased due to sales growth and seeing results of Structural Transformation.
Operating Income Increased due to sales growth and seeing results of Structural Transformation.
(Billions of Yen, %)
(*1) EBITA = operating income + amortization of intangible assets subject to purchase price allocation (PPA) arising from acquisition and others.
© 2021 NTT DATA Corporation 11

(Reference) Initiatives to Improve Profitability
Initiatives Status of Progress
Grow digital and consultingImprove profitability in traditional services
• On track Won several digital & consulting deals, including digitalization in traditional domain.
Strengthen digital capabilities by enhanced digital talent management
• Further strengthening digital capabilities through acquisitionsCompleted the acquisition of Nexient to strengthen digital focus areas including application development and modernization in cloud environment.
Accelerate portfolio reshaping for continuous business domain transformation
• Transitioning to digital-centric business domainAccelerated divestitures of non-core/non-digital businesses.
Integrate into a global brand to increase presence for Clients
• On track Operations to be integrated under NTT DATA EMEAL, a new regional headquarters, from the middle of September, 2021.
Develop a stronger ability to adapt to the digital shift in markets and changes in work styles
• Executing initiatives as plannedExecuting office optimization to adapt to changing working styles
Increase digital capabilities by securing more digital talent & assets
• On track Increasing digital projects by expanding digital talent pool.
North Am
ericaEM
EA
・LATAM
© 2021 NTT DATA Corporation 12

© 2021 NTT DATA Corporation 13
Appendices - Business topics -
2

In October 2020, NTT DATA established the Social Design Office . Since then, actions have been implemented to develop a more valuable social system from the consumer’s perspective. As a part of this action, in June 2021, NTT DATA launched cashless service for the national treasury, a total service that enables cashless application both at the counter and online platform of the central government.
This is Japan’s first service that enables payment by credit card or transportation IC card upon application at the counter by aligning with multiple related systems required to process the payment to the national treasury at the counter and by handling the accounting process specific to the central government. If each ministry and agency use this service, the applicant making the payment to the national treasury (Note 1) can pay without bringing in cash at the counter and buying a revenue stamp, which is required for cash payment. Likewise, in online application, this service allows the applicant to make a payment just by inputting their credit card number and other details, leading to the considerably improved usability.
NTT DATA will continue promoting their cashless payment service to the national treasury by proposing this service to ministries and agencies sequentially. Moreover, we will effectuate the implementation of self-registers and automated certificate issuers at the counter to further reduce the burden of applicants and ministry officials.
NTT DATA Launches Japan’s First Service that Enables Cashless Payment to the Central Government at the Counter
(Note 1) Payment to the national treasuryPayment of revenues and taxes to the nation by individuals and corporations.
Pr incipal Measures Taken in the 1st Quarter of FYE March 31, 2022 (1/4)
© 2021 NTT DATA Corporation 14
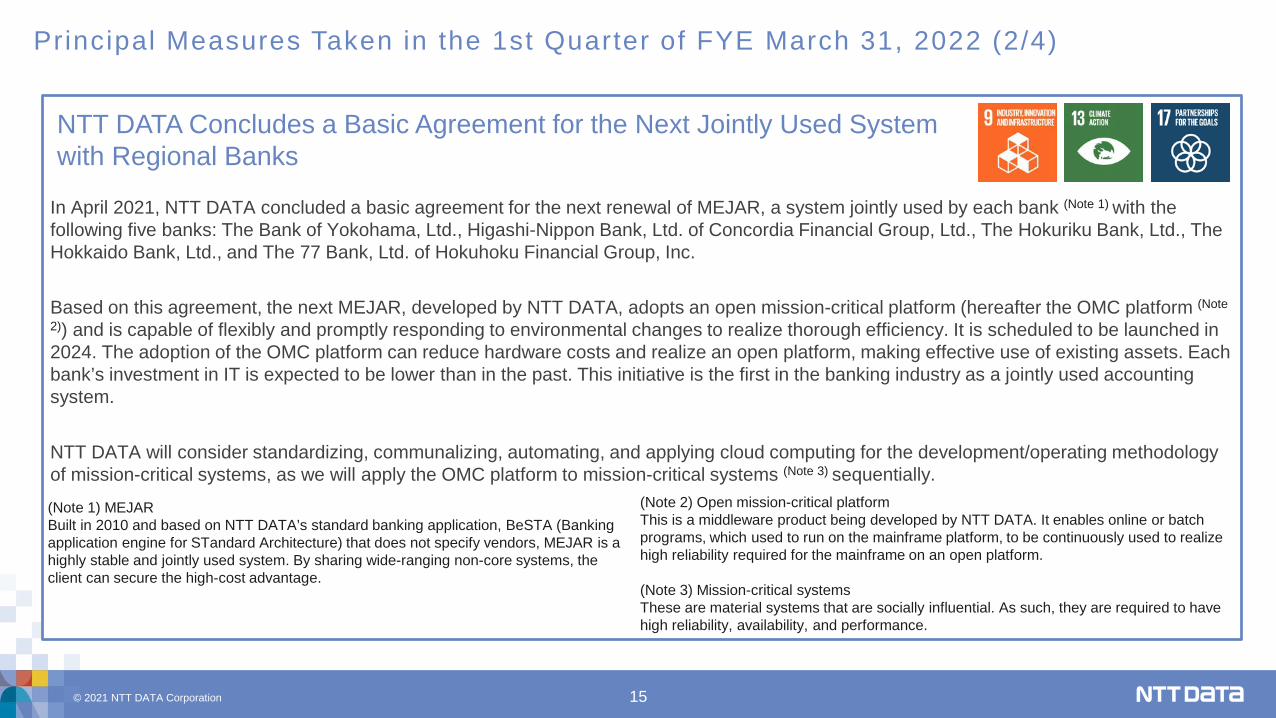
In April 2021, NTT DATA concluded a basic agreement for the next renewal of MEJAR, a system jointly used by each bank (Note 1) with the following five banks: The Bank of Yokohama, Ltd., Higashi-Nippon Bank, Ltd. of Concordia Financial Group, Ltd., The Hokuriku Bank, Ltd., The Hokkaido Bank, Ltd., and The 77 Bank, Ltd. of Hokuhoku Financial Group, Inc.
Based on this agreement, the next MEJAR, developed by NTT DATA, adopts an open mission-critical platform (hereafter the OMC platform (Note
2)) and is capable of flexibly and promptly responding to environmental changes to realize thorough efficiency. It is scheduled to be launched in 2024. The adoption of the OMC platform can reduce hardware costs and realize an open platform, making effective use of existing assets. Each bank’s investment in IT is expected to be lower than in the past. This initiative is the first in the banking industry as a jointly used accounting system.
NTT DATA will consider standardizing, communalizing, automating, and applying cloud computing for the development/operating methodology of mission-critical systems, as we will apply the OMC platform to mission-critical systems (Note 3) sequentially.
Pr incipal Measures Taken in the 1st Quarter of FYE March 31, 2022 (2/4)
NTT DATA Concludes a Basic Agreement for the Next Jointly Used System with Regional Banks
(Note 1) MEJARBuilt in 2010 and based on NTT DATA’s standard banking application, BeSTA (Banking application engine for STandard Architecture) that does not specify vendors, MEJAR is a highly stable and jointly used system. By sharing wide-ranging non-core systems, the client can secure the high-cost advantage.
(Note 2) Open mission-critical platformThis is a middleware product being developed by NTT DATA. It enables online or batch programs, which used to run on the mainframe platform, to be continuously used to realize high reliability required for the mainframe on an open platform.
(Note 3) Mission-critical systemsThese are material systems that are socially influential. As such, they are required to have high reliability, availability, and performance.
© 2021 NTT DATA Corporation 15

Principal Measures Taken in the 1st Quarter of FYE March 31, 2022 (3/4)
In May, 2021, NTT DATA launched work support services that use WorkLink, which is a platform that simultaneously allows the user to use work support based on the 3D manual (Note 1) realized by Augmented Reality (AR) and work support by experts in a remote location, developed by Scope AR in the United States.
The spread of Covid-19 infection has increased the need for remote work support or pre-work training. NTT DATA is the first Japanese company to sign a partnership agreement with Scope AR, a company that provides the WorkLink platform for work support in manufacturing/maintenance in the manufacturing industry and maintenance/inspection in utilities industry such as electricity, gas, and water. We are determined to provide Scope AR’s platform coupled with our 3D manual creation support service to users. Based on product manuals or maintenance procedure manuals that they own, this support service helps the user import into a 3D manual by scanning work target equipment and to additionally implement the work procedure in 3D animation that cannot be expressed by existing manuals, thereby supporting high-quality 3D manuals. Through DX consulting as field services, we will also provide the services in collaboration with other integration services including ServiceNow that contribute to efficient operation.
By the end of FY2024, we aim to sell these services to more than 100 companies in the manufacturing, utilities, and distribution industries.
NTT DATA Launches On-Site Work Support Services through AR-technology-enabled 3D Manual
(Note 1) 3D manualA manual that displays work target equipment or operation procedures reproduced into 3D images on the user’s monitor.
© 2021 NTT DATA Corporation 16

Principal Measures Taken in the 1st Quarter of FYE March 31, 2022 (4/4)
NTT DATA Services, a subsidiary of NTT DATA Corporation, accelerated our digital expertise through acquisition. By utilizing enhanced digital offerings, NTT DATA Services is supporting clients in accelerating digital transformation.
• NTT DATA Services acquired Nexient, LLC, a cloud-native (Note1) company that expands NTT DATA’s differentiating transformation, modernization and cloud app development experience, in June 2021. With Nexient’s agile, product-minded development disciplines with U.S.-based delivery, NTT DATA added user-centric full stack product development capabilities and will speed the ability to offersophisticated digital transformation services to clients, including digital product strategy, product design and development, and platform transformation. Through this acquisition, NTT DATA also enhanced the hiring and training process in this field.
• NTT DATA Services has been awarded a large multi-year contract extension with a leading global hospitality company as their digital partner for IT outsourcing including application development and maintenance in July 2021. Our strong delivery performance in the past and digital expertise such as in cloud and ServiceNow were instrumental in extending the contract (Note2) .
NTT DATA continues its journey to be the preferred digital partner in the market and supports clients in accelerating digital transformation in North America and globally.
Enhanced digital expertise through acquisition and accelerated digital transformation services to support clients with Long-Term Relationships
(Note 1) Cloud-nativeAn approach to take the advantages of the cloud computing model for application development or maintenance, etc.(Note 2) This deal will be included in our new orders received in 2nd Quarter.
© 2021 NTT DATA Corporation 17
© 2021 NTT DATA Corporation 18
Appendices -Explanatory details of financial results and forecasts-
2

Overview of Consolidated Result2021/3 1st Quarter
Results (Apr-Jun)
2022/3 1st QuarterResults
(Apr-Jun)
YoY(%)
FY Ended 2021/3Results
(Full-Year)
FY Ending 2022/3Forecasts(Full-Year)
New Orders Received 615.4 589.8 -4.2 2,223.3 2,200.0Order Backlog 2,738.8 2,794.7 +2.0 2,735.1 2,744.0
Net Sales 530.9 590.8 +11.3 2,318.7 2,360.0(Main item) Overseas Net Sales(*1) 217.5 253.2 +16.4 907.2 906.0Cost of Sales 400.1 437.9 +9.4 1,734.1 1,732.0Gross Profit 130.8 152.9 +16.9 584.6 628.0SG&A Expenses 104.1 105.6 +1.5 445.4 448.0
Selling Expenses 40.2 40.8 +1.6 171.7 180.0R&D Expenses 5.2 4.0 -22.6 22.7 17.0Other Administrative Expenses 58.8 60.8 +3.5 250.9 251.0
Operating Income 26.7 47.3 +77.1 139.2 180.0Operating Income Margin(%) 5.0 8.0 +3.0P 6.0 7.6
Financial Income and Costs/Share of Profit/Loss of Entities for Using Equity Method 0.5 1.7 +274.7 -8.7 -5.0
Income Before Income Taxes 27.1 49.0 +80.4 130.5 175.0Income Taxes and Others(*2) 8.0 17.9 +124.0 53.6 69.0Net Income Attributable toShareholders of NTT DATA 19.1 31.1 +62.3 76.8 106.0
Capital Expenditures 38.2 35.8 -6.4 169.5 175.0Depreciation and Amortization/Loss on Disposal of Property and Equipment and Intangibles(*3) 41.7 44.3 +6.2 178.4 170.0
(*1) The total of external net sales of North America and EMEA & LATAM Segments and China & APAC regions. (*2) “Income Taxes and Others” includes “corporate income taxes” and “net income attributable to non-controlling interests.”(*3) The figures for FYE 3/2020 and later were calculated excluding lease depreciation expenses (10.5 billion yen as the result of FYE 3/2021 1st Quarter, 10.8 billion yen as the result of FYE
3/2022 1st Quarter, 42.8 billion yen as the result of FYE 3/2021 and 35.0 billion yen as the forecast for FYE 3/2022 (estimate)).
(Billions of Yen,%)
© 2021 NTT DATA Corporation 19

2021/3 1st QuarterResults
(Apr-Jun)
2022/3 1st QuarterResults
(Apr-Jun)
FY Ended 2021/3Results
(Full-Year)
FY Ending 2022/3Forecasts(Full-Year)
Public & Social Infrastructure 173.1 157.7 481.6 509.0 (Main item) Central Government and Related Agencies,
Local Government, and Healthcare 135.4 93.3 280.6 300.0
Telecom and Utility 14.8 28.1 108.5 114.0 Financial 170.7 130.9 542.2 442.0 (Main item) Banks, Insurance, Securities, Credit Corporations, Financial
Infrastructure/Network Services 146.0 102.3 431.8 328.0
Cooperative Financial Institutions 15.8 19.3 83.1 88.0
Enterprise & Solutions(*1) 85.9 91.2 344.0 358.0 (Main item) Retail, Payment and Other Services 21.7 22.7 89.2 85.0
Manufacturing 51.5 57.3 209.5 226.0 Data Center, Network, and Other Solutions 12.7 11.3 45.3 47.0
North America 77.1 70.3 344.5 366.0 EMEA & LATAM 101.3 130.1 475.9 482.0
Order Backlog 2,738.8 2,794.7 2,735.1 2,744.0Public & Social Infrastructure 562.3 576.4 515.1 553.0Financial 877.4 916.8 894.9 847.0Enterprise & Solutions 150.9 158.8 150.6 165.0North America 796.1 728.4 762.9 737.0EMEA & LATAM 333.8 397.7 392.8 405.0
Consolidated New Orders Received and Order Backlog
(*1) New Orders Received of Enterprise & Solutions from clients outside the NTT DATA Group does not include orders taken via other segments.(*2) New Orders Received of Enterprise & Solutions were reviewed in terms of the details recorded.
Details of Consolidated New Orders Received (to Clients Outside the NTT DATA Group)
Detail of Consolidated Order Backlog
© 2021 NTT DATA Corporation 20
(Billions of Yen,%)
(*2)

2021/3 1st QuarterResults
(Apr-Jun)
2022/3 1st QuarterResults
(Apr-Jun)
FY Ended 2021/3Results
(Full-Year)
FY Ending 2022/3Forecasts(Full-Year)
Public & Social Infrastructure 91.0 101.3 452.0 474.0(Main item) Central Government and Related Agencies,
Local Government, and Healthcare 51.4 50.9 252.9 270.0
Telecom and Utility 21.1 28.0 107.4 108.0Financial 120.0 127.3 518.1 538.0(Main item) Banks, Insurance, Securities, Credit Corporations, Financial
Infrastructure/Network Services 93.0 99.7 390.3 410.0
Cooperative Financial Institutions 23.9 25.5 103.6 104.0Enterprise & Solutions(*1) 99.4 105.6 427.8 445.0(Main item) Retail, Payment and Other Service 36.1 37.3 147.2 153.0
Manufacturing 50.0 53.3 220.1 225.0Data Center, Network, and Other Solutions 12.9 14.4 58.7 67.0
North America 103.7 112.5 422.8 391.0EMEA & LATAM 104.8 130.0 446.7 471.0
Consulting 61.9 78.0 283.2 310.0Integrated IT Solution 147.4 151.6 608.2 630.0System & Software Development 119.2 130.6 551.2 580.0Maintenance & Support 180.2 209.4 785.9 750.0Others 22.2 21.3 90.2 90.0Net Sales by Products and Services Total 530.9 590.8 2,318.7 2,360.0
Consolidated Net Sales(Billions of Yen)Detail of Consolidated Net Sales (to Clients Outside the NTT DATA Group)
(Billions of Yen)
(*1) Net Sales of Enterprise & Solutions from clients outside the NTT DATA Group does not include sales of projects undertaken through other segments.(*2) Net Sales of Enterprise & Solutions were reviewed in terms of the details recorded. (*3) The figures for Net Sales by Products and Services (to Clients Outside the NTT DATA Group) show results based on the revision of the categories and the details recorded.
Net Sales by Products and Services (to Clients Outside the NTT DATA Group) (*3)
© 2021 NTT DATA Corporation 21
(*2)

Net Sales
Operating Income
New Orders Received
(Billions of Yen,%)
Trends in Quarter (Consolidated)
© 2021 NTT DATA Corporation 22

Foreign Exchange Rates (used for the conversion of the amount of orders received and incomes and expenditures)
(Yen,%)
2021/3 1st QuarterResults
(Apr-Jun)
2022/3 1st QuarterResults
(Apr-Jun)
YoY(%)
FY Ended 2021/3Results
(Full-Year)
FY Ending 2022/3
Forecasts(Full-Year)
YoY(%)
① ② (②-①)/ ① ③ ④ (④-③) / ③
USD 107.53 109.52 +1.9% 106.09 104.00 -2.0%
EUR 118.59 131.94 +11.3% 123.77 125.00 +1.0%
© 2021 NTT DATA Corporation 23

© 2021 NTT DATA Corporation 24
Appendices - Mid- to long-term financial trends -
2

Trend of Order Backlog and Net Sales
1,161.91,251.1
1,301.9 1,343.7
1,511.81,614.8
1,732.4
2,117.12,039.7
2,163.62,266.8 2,318.7
2,360.0
1,156.51,131.9 1,140.2
1,341.4 1,355.8
1,544.5
2,411.32,371.5 2,369.2
2,457.1
2,636.32,735.1 2,744.0
0.0
500.0
1,000.0
1,500.0
2,000.0
2,500.0
3,000.0
2011/3 2012/3 2013/3 2014/3 2015/3 2016/3 2017/3 2018/3 2018/3 2019/3 2020/3 2021/3 2022/3
Net Sales Year-end Order Backlog
(Billions of yen)
JGAAP IFRSForecasts
© 2021 NTT DATA Corporation 25

Overseas Net Sales and Profitability Trends
(Billions of yen)
(*1) The figures for the periods until FYE 3/2017 are those for the former Global Segment, and from FYE 3/2018 and later, are the total of North America/EMEA & LATAM Segments and China and APAC. (*2) Net sales to Clients Outside the NTT DATA Group. (*3) EBITA (JGAAP) = operating income (JGAAP) + amortization of goodwill and intangible assets subject to purchase price allocation (PPA) arising from acquisition and others(*3) EBITA (IFRS) = operating income (IFRS) + amortization of intangible assets subject to purchase price allocation (PPA) arising from acquisition and others
(*1)
(*2)
(*3)
4.7%3.2%
5.2% 5.3% 4.8%4.8%
2.3% 3.2%0.7%
-0.8%
4.6%
-10.0%
0.0%
10.0%
20.0%
0.0
500.0
1,000.0
1,500.0
Overseas Net Sales
EBITA Margin
(*2)
JGAAP IFRS
(Billions of yen) 2013/3 2014/3 2015/3 2016/3 2017/3 2018/3 2018/3 2019/3 2020/3 2021/3 2022/3Forecast
Overseasnet sales 231.3 298.7 449.0 504.4 586.3 911.1 831.3 881.1 906.7 907.2 906.0
EBITA(*3) 10.8 9.6 23.5 26.6 28.2 43.4 19.4 28.3 6.4 -7.2 41.5
(*2)
© 2021 NTT DATA Corporation 26

EBITDA Trend
© 2021 NTT DATA Corporation 27
(Billions of yen)
(*1) The figures for FYE 3/2020 and later were calculated excluding lease depreciation expenses (38.3 billion yen as the result of FYE 3/2020, 42.8 billion yen as the result of FYE 3/2021 and 35.0 billion yen as the forecast for FYE 3/2022 (estimate)).
-3.4%
2.4% 0.7%
-12.0%
16.8%
5.8% 9.2% 5.6% 8.5%
-4.1%
8.3% 9.3%
-20.0%
-10.0%
0.0%
10.0%
20.0%
30.0%
40.0%
50.0%
60.0%
70.0%
-100.0
-50.0
0.0
50.0
100.0
150.0
200.0
250.0
300.0
350.0
Goodwill Amortization etc.Loss on Retirement of Fixed AssetDepreciationOperation IncomeEBITDA Growth Rate
(*1)
JGAAP IFRS
(Billions of yen) 2011/3 2012/3 2013/3 2014/3 2015/3 2016/3 2017/3 2018/3 2018/3 2019/3 2020/3 2021/3 2022/3Forecast
Operation Income 78.3 80.4 85.6 62.5 84.0 100.8 117.1 123.5 123.1 147.7 130.9 139.2 180.0Depreciation(*1) 152.2 148.3 140.0 138.0 146.8 147.9 154.5 160.0 158.1 158.0 160.9 171.6 170.0
Loss on Retirement of Fixed Asset 6.3 11.3 13.8 5.6 11.6 7.2 5.4 3.2 3.1 2.7 2.9 6.8 -
Goodwill Amortization etc. 5.7 8.3 10.7 14.0 14.7 16.0 20.0 26.9 - - 1.0 2.7 -
EBITDA 242.6 248.5 250.3 220.2 257.3 272.1 297.1 313.7 284.2 308.4 295.7 320.3 350.0

JGAAP IFRS
2011/3 2012/3 2013/3 2014/3 2015/3 2016/3 2017/3 2018/3 2018/3 2019/3 2020/3 2021/3 2022/3Forecast
Net Income Attributable toShareholders of NTT DATA
(Billions of yen)43.0 38.8 54.3 37.2 46.9 79.4 85.7 85.1 82.4 93.6 75.1 76.8 106.0
EPS (yen) 30.73 27.69 38.73 26.59 33.45 56.64 61.15 60.68 58.75 66.75 53.58 54.79 75.58
EPS Trend
© 2021 NTT DATA Corporation 28
(*1) “Net Income Attributable to Owners of Parent” based on JGAAP.(*2) Figures based on JGAAP include adjustments for goodwill amortization and others (including impairment loss).(*3) Conducted stock split which shall split of common stock at a ratio of 1:5 as of the effective date of July 1, 2017. EPS is referring to the amount after stock split.
(Yen)
0.00
10.00
20.00
30.00
40.00
50.00
60.00
70.00
80.00
(*1,2)
(*3)

JGAAP IFRS
(Billions of yen) 2011/3 2012/3 2013/3 2014/3 2015/3 2016/3 2017/3 2018/3 2018/3 2019/3 2020/3 2021/3
Net Income Attributable toShareholders of NTT DATA 43.0 38.8 54.3 37.2 46.9 79.4 85.7 85.1 82.4 93.6 75.1 76.8
Equity EOY 620.0 632.5 688.9 728.4 839.8 823.3 904.6 963.3 826.2 925.7 939.7 1,072.9
ROE Trend
7.1%6.2%
8.2%
5.3%6.0%
9.6% 9.9%9.1%
10.3% 10.7%
8.1% 7.6%
0.0%
5.0%
10.0%
15.0%
(*1) ROE = net income attributable to shareholders of NTT DATA / average equity during the period.(*2) “Net Income Attributable to Owners of Parent” based on JGAAP.(*3) Figures based on JGAAP include adjustments for goodwill amortization and others (including impairment loss).
(*2,3)
(*3)
(*1)
© 2021 NTT DATA Corporation 29

ROIC Trend
© 2021 NTT DATA Corporation 30
(Billions of yen)
4.8% 4.6%5.1%
3.6%
4.6%
5.5%6.1%
5.8% 5.9%
6.8%
5.8%5.9%
0.0%
2.0%
4.0%
6.0%
8.0%
10.0%
0.0
250.0
500.0
750.0
1,000.0
1,250.0
1,500.0
1,750.0Interest-bearing Liabilities
Net Asset
ROIC
(*1) The figures based on JGAAP are the total of borrowings, bonds, and lease payables. The figures based on IFRS are the total of borrowings and bonds.(*2) ROIC = (operating income × (1- effective tax rate)) / (average net assets during the period + average interest-bearing liabilities during the period)
(*2)
(*1)
(*1)
JGAAP IFRS
(Billions of yen) 2011/3 2012/3 2013/3 2014/3 2015/3 2016/3 2017/3 2018/3 2018/3 2019/3 2020/3 2021/3
Operating Income 78.3 80.4 85.6 62.5 84.0 100.8 117.1 123.5 123.1 147.7 130.9 139.2
Effective Tax Rate 40.69% 40.69% 38.01% 38.01% 35.64% 33.06% 30.86% 30.86% 30.86% 30.62% 30.62% 30.62%
Net Asset 630.3 639.7 684.2 709.8 806.2 773.6 833.7 868.8 860.5 966.8 987.4 1,126.5Interest-bearing
Liabilities 414.4 380.2 378.3 412.9 446.9 407.0 650.8 592.0 586.3 605.0 598.0 578.9

D/E Ratio Trend
JGAAP IFRS
(Billions of yen) 2011/3 2012/3 2013/3 2014/3 2015/3 2016/3 2017/3 2018/3 2018/3 2019/3 2020/3 2021/3
Net Asset 630.3 639.7 684.2 709.8 806.2 773.6 833.7 868.8 860.5 966.8 987.4 1,126.5
(Main Item)Net AssetNon-controlling Interests 28.7 34.0 32.8 32.9 32.7 32.7 31.5 35.0 34.3 41.1 47.7 53.6
Interest-bearing Liabilities 414.4 380.2 378.3 412.9 446.9 407.0 650.8 592.0 586.3 605.0 598.0 578.9
0.690.63
0.580.61
0.58
0.55
0.81 0.71 0.710.65 0.64
0.54
0.00
0.25
0.50
0.75
1.00
1.25
1.50
(*1) D/E ratio = interest-bearing liabilities / (net asset – non-controlling interests)(*2) The figures based on JGAAP are the total of borrowings, bonds, and lease payables. The figures based on IFRS are the total of borrowings and bonds.
(*1)
(*2)
© 2021 NTT DATA Corporation 31

Consolidated Cash Flow Dividend Payout Trend
JGAAP IFRS
(Billions of yen) 2011/3 2012/3 2013/3 2014/3 2015/3 2016/3 2017/3 2018/3 2018/3 2019/3 2020/3 2021/3 2022/3Forecast
Net Income Attributable toShareholders of NTT DATA 43.0 38.8 54.3 37.2 46.9 79.4 85.7 85.1 82.4 93.6 75.1 76.8 106.0
Depreciation 152.2 148.3 140.0 138.0 146.8 147.9 154.5 160.0 158.1 158.0 160.9 171.6 170.0Loss on Retirement of Fixed
Asset 6.3 11.3 13.8 5.6 11.6 7.2 5.4 3.2 3.1 2.7 2.9 6.8 -
Capital Investment -139.0 -133.9 -122.1 -147.7 -140.9 -134.0 -158.1 -198.6 -194.8 -179.2 -193.8 -169.5 -175.0Consolidated Cash Flow 62.5 64.5 86.0 33.2 64.5 100.6 87.6 49.6 48.7 75.1 45.1 85.7 101.0
Dividends per Share(JPY) 12 12 12 12 12 14 15 15 15 17 18 18 19Total Dividends 16.8 16.8 16.8 16.8 16.8 19.6 21.0 21.0 21.0 23.8 25.2 25.2 26.6
(*1) Consolidated Cash Flow = net income attributable to shareholders of NTT DATA + depreciation cost + loss on retirement of fixed assets – capital investment(*2) For “weighted average of past 5 yrs.” in IFRS, figures based on JGAAP are used for FYE 3/2017 and earlier. (*3) “Net Income Attributable to Owners of Parent” based on JGAAP.(*4) Figures based on JGAAP include adjustments for goodwill amortization and others (including impairment loss). (*5) The figures for FYE 3/2020 and later were calculated excluding lease depreciation expenses (38.3 billion yen as the result of FYE 3/2020, 42.8 billion yen as the result of FYE 3/2021 and 35.0 billion yen as
the forecast for FYE 3/2022 (estimate)). (*6) Conducted stock split which shall split of common stock at a ratio of 1:5 as of the effective date of July 1, 2017. EPS is referring to the amount after stock split.
(*1)
26.9%
26.1%19.6%
50.6%
26.1%19.5%
24.0%
42.3% 43.2%
31.7%
56.0%
29.5%26.4%
34.1% 35.9%
28.4% 29.1%27.0% 24.9% 24.5%
28.4%
28.5% 27.2%31.0%
34.0% 34.3%
0.0%
10.0%
20.0%
30.0%
40.0%
50.0%
60.0%
Consolidated Cash Flow Dividend PayoutConsolidated Cash Flow Dividend Payout (Weighted Average of Past 5 yrs.)
(*3,4)
(*2)
(*5)
(*6)
© 2021 NTT DATA Corporation 32

© 2021 NTT DATA Corporation