company values - procurementaustralia · company values procurement australia will be ... aubrey...
TRANSCRIPT


COMPANY VALUES
Procurement Australia will be the leading partner of strategic sourcing and procurement solutions which add measurable business value to our clients.
2

Maps Group Ltd trading as Procurement Australia is a public company which negotiates and facilitates contracts for common use goods and services on behalf of its Members. Procurement Australia offers suppliers targeted access to Local Government, Trusts, Not for Profit, TAFE, Universities, Libraries, Water Boards and other statutory bodies, through its ISO9001 accredited tender and contract management processes. Procurement Australia operates from a head office located in Melbourne. The company services over 700 Members across Australia.
ABOUT MAPS GROUP LIMITED
Our mission is to act as the member advocate/agent and fulfil their needs by creating mutual benefit for Members and suppliers, through value added and innovative procurement services. Procurement Australia suppliers are authorised contractors who have tendered and been accepted to sell goods and services through the Procurement Australia contracts.
Our suppliers incorporate a diverse group covering many market sectors and organisations, including high profile national and multinational brands.
‘South Gippsland has been a regular user of the Procurement Australia Truck Plant & Equipment tender for many years and we are always provided with an industry best outcome and supplier support.’
Fred Huitema, Manager Infrastructure Maintenance, South Gippsland Shire:
3

‘THIN CLIENTS’ + ‘THE CLOUD’ = WORK & COST EFFICIENCIES
2014 PROCUREMENT AUSTRALIA AWARDS
During the year, Procurement Australia migrated its computer systems to a cloud-based server enabled by a 10Mbps/10Mbps Telstra fibre-based internet service, enabling staff to move away from traditional workstations.
Connecting directly to a data centre hosting our servers, Procurement Australia’s staff work on what are known as ‘thin clients’ which operate 24/7 via ‘cloud’ infrastructure. This development brings with it unlimited access to Help Desk facilities.
This is all made possible through a number of Microsoft Windows virtual servers operating Tier 1 equipment that includes a Dell M1000 BladeCentre, EMC VNX5300 Storage Area Network with Solid State Drives, and a Fortinet 1240B Firewall/Web 2.0 Security Device, the very latest in remote access technology.
Combined with all new Microsoft software, Procurement Australia’s IT infrastructure is fully compliant with the latest in IT security and other protocols.
2 Collaboration and Innovation in Procurement Award (Bunnings).Latrobe City Council’s ‘Doing Business with Latrobe City Council’ was awarded for showing demonstrated teamwork, tangible outcomes and practical collaboration.
3 Special Mention Award.The Salvation Army Australia – Southern Territory, were awarded for decentralised contract management and ongoing stakeholder buy-in to deliver lower total cost.
4 Sustainable Procurement Award (AGL).Glen Eira City Council’s Environmental Action Plan was recognised as an outstanding entry and innovative concept with a simple central intent, good engagement, outcomes focused, whilst delivering community and environmental benefits.
5 The Inaugural Social Procurement Award (Procurement Australia).City of Melbourne for demonstrating strong Corporate Social Responsibilities in Procurement.
6 Supplier of the Year Award (Procurement Australia).Midstate Credit Management as voted by our Members.
We were delighted to acknowledge winners of Procurement Australia’s 2014 Awards at our MATTER 2014 Conference dinner held in the Olympic Room of the MCG in August this year.
Sponsored by AGL, Bunnings, CIPS and Procurement Australia, the Awards were judged by Aubrey Janessen, City of Glen Eira; Molley Qi, City of Melbourne; Noel Erwin, City of Moreland; and Silke Therhaag, City of Moonee Valley who selected our celebrated winners:
1 The Jacinta Bartlett Award for Individual Excellence (CIPS).Inspired by the memory of Jacinta Bartlett, a highly respected member of the Victorian Local Government community who lost her life in the Black Saturday bushfires, this award acknowledges her professionalism and commitment by recognising others for their leadership, innovation, creativity and help to the sector.
This year, Tony Kerr, Procurement Services, City of Greater Geelong was recognised for his outstanding contribution to enhancing the City’s procurement of goods and services, whilst delivering results beyond expectation which met legislative demands.
The Award’s Selection Criteria demand demonstrated excellence, significant contribution and being an inspirational role model for Local Government procurement professionals.
Procurement Australia’s new Office Products Tender and Contract is saving Members more than 20% on current spend on like for like products through a sole source arrangement across all states.
Aggregated buying power generates savings in excess of 20%:
1 23 45 6
4
SPEAKER PROFILES
MCG OLYMPIC ROOM
21 - 22 AUGUST 2014
make your actionscOuntMATTER 2014
©ElmwoodPortions of these creative concepts may contain material subject to the rights of third parties, and is intended only for creative reference by the client. They do not provide accurate representation of final photography, final illustration or final printed colours and finishes. No usage or ownership rights to this material are conveyed to either Elmwood or the client, and these rights must first be acquired by either party prior to their use. Procurement Australia - Pull Up Banners / 16 September 2014
Pull Up BannersOption 3a
WE'RE OILS, ELECTRICITY, PLUMBING...
AND EVERYTHING IN BETWEEN
We’re buying and supplying made simple
WE'RE TRUCKS, LIBRARY BOOKS, HARDWARE...
AND EVERYTHING IN BETWEEN
We’re buying and supplying made simple
WANT SMART SOLUTIONS?
WE'RE ALL ABOUT FRESH IDEAS
We’re buying and supplying made simple
WE'RE BUYING AND SUPPLYING MADE SIMPLE
WE'RE PROCUREMENT AUSTRALIA
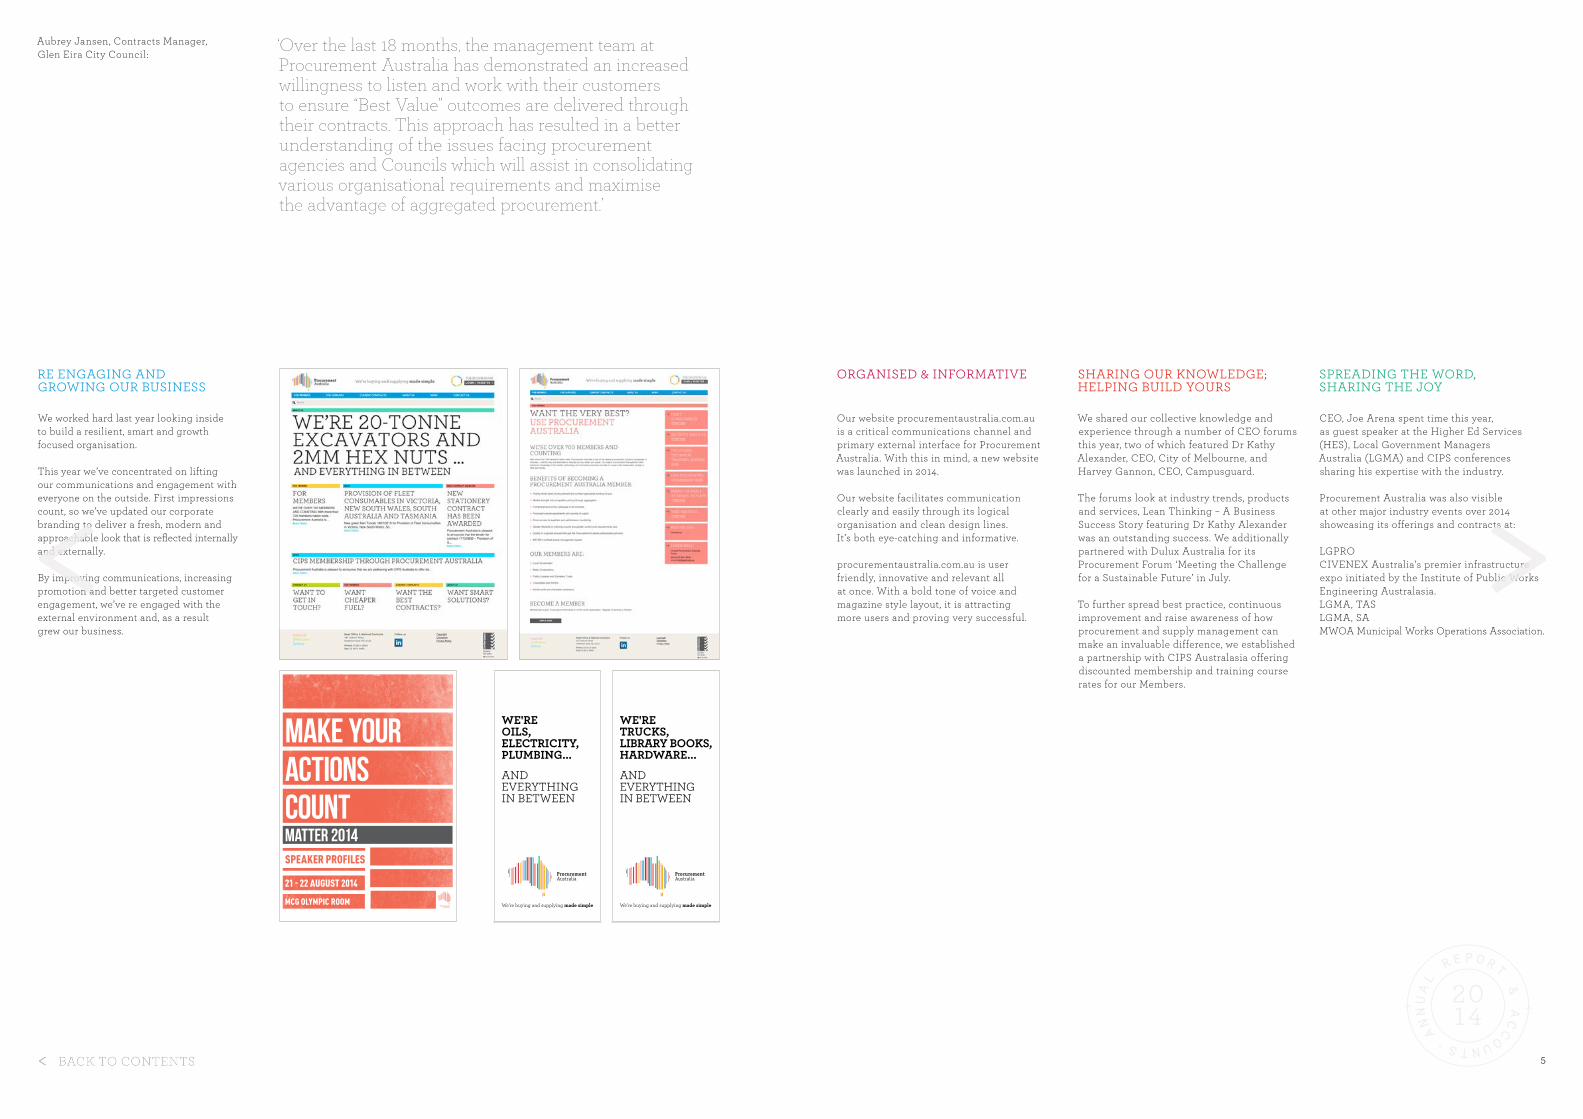
‘Over the last 18 months, the management team at Procurement Australia has demonstrated an increased willingness to listen and work with their customers to ensure “Best Value” outcomes are delivered through their contracts. This approach has resulted in a better understanding of the issues facing procurement agencies and Councils which will assist in consolidating various organisational requirements and maximise the advantage of aggregated procurement.’
Aubrey Jansen, Contracts Manager, Glen Eira City Council:
RE ENGAGING AND GROWING OUR BUSINESS
We worked hard last year looking inside to build a resilient, smart and growth focused organisation.
This year we’ve concentrated on lifting our communications and engagement with everyone on the outside. First impressions count, so we’ve updated our corporate branding to deliver a fresh, modern and approachable look that is reflected internally and externally.
By improving communications, increasing promotion and better targeted customer engagement, we’ve re engaged with the external environment and, as a result grew our business.
Our website procurementaustralia.com.au is a critical communications channel and primary external interface for Procurement Australia. With this in mind, a new website was launched in 2014.
Our website facilitates communication clearly and easily through its logical organisation and clean design lines. It’s both eye-catching and informative.
procurementaustralia.com.au is user friendly, innovative and relevant all at once. With a bold tone of voice and magazine style layout, it is attracting more users and proving very successful.
ORGANISED & INFORMATIVE SHARING OUR KNOWLEDGE; HELPING BUILD YOURS
We shared our collective knowledge and experience through a number of CEO forums this year, two of which featured Dr Kathy Alexander, CEO, City of Melbourne, and Harvey Gannon, CEO, Campusguard.
The forums look at industry trends, products and services, Lean Thinking – A Business Success Story featuring Dr Kathy Alexander was an outstanding success. We additionally partnered with Dulux Australia for its Procurement Forum ‘Meeting the Challenge for a Sustainable Future’ in July.
To further spread best practice, continuous improvement and raise awareness of how procurement and supply management can make an invaluable difference, we established a partnership with CIPS Australasia offering discounted membership and training course rates for our Members.
SPREADING THE WORD, SHARING THE JOY
CEO, Joe Arena spent time this year, as guest speaker at the Higher Ed Services (HES), Local Government Managers Australia (LGMA) and CIPS conferences sharing his expertise with the industry.
Procurement Australia was also visible at other major industry events over 2014 showcasing its offerings and contracts at:
LGPRO CIVENEX Australia’s premier infrastructure expo initiated by the Institute of Public Works Engineering Australasia. LGMA, TASLGMA, SAMWOA Municipal Works Operations Association.
5

‘There have been many pleasing developments over the past 12 months, a great settling down of the significant decisions made in 2013/14 and I feel quite privileged to be able to speak of them here.’
I became Chair at our Annual General Meeting in February this year. I first joined the Board in 1992, the year of Procurement Australia’s incorporation, and have been connected to the organisation since its foundation in 1985. I am looking forward to my tenure as Chair and excited to be part of a promising future.
On behalf of our Members, Board Members, the Executive Team and staff, I express our sincere thanks and gratitude to my predecessor and fellow Board Member, Marianne Di Giallonardo, for her contribution to the company over a nine year period, the last four of which were as Chair of the Board.
Keith Yeo also stepped down from the Board in 2014 and I extend my appreciation and thanks also to Keith for his seven year term, depth of financial experience and counsel he generously gave to the Board and company staff.
Procurement Australia has always had great resources at Board level to draw upon for support and guidance. We benefit from innumerable years of Local Government management experience and knowledge. From May this year we have begun profiting from this with two new Board appointments complementing our existing strong team which includes John Ravlic, Susan Riley and Lydia Wilson.
It is our pleasure to be able to work with the highly experienced Stephen Griffin who is Chief Executive of Victoria’s State Emergency Services, and the well-credentialed Vijaya Vaidyanath, Chief Executive of Yarra City Council. Welcome to you both.
You can read more about Stephen and Vijaya in the following Board Report however; briefly, Stephen became Chief Executive of Victoria’s State Emergency Services in 2014 having been Chief Executive of the City of Greater Geelong since 2009 and brings to us extensive Local Government and great management expertise.
Before becoming Chief Executive at Yarra City Council in 2012, Vijaya was Director, Corporate and Business Services with Darebin City Council and held CEO roles with key New Zealand councils, Waitakere City and Rodney. Renowned for her innovation, integrity and inspiring leadership, Vijaya has extensive experience in shared services and procurement.
So with a new look, balanced Board, a strong Executive Team, well-researched strategic plan and a high performing staff; I believe Procurement Australia is in a position to better serve our clients and suppliers additionally maintaining and building on our position as the leading aggregator buying group in Australia.
Our financial performance this year signals that continued improvement and gains in bottom line profit have been achieved which brings great satisfaction to the Board and I am sure to you as shareholders.
‘2015 will be our 30th year. We will mark this significant point in time with a suitable fanfare.’
And finally, our strong external program of events is further helping to expand learning, business and networks. We had outstanding success with our CEO Forum Lean Thinking – A Business Success Story featuring City of Melbourne’s Dr Kathy Alexander, we partnered with Dulux Australia for its Procurement Forum Meeting the Challenge for a Sustainable Future in July which will be rolled out to other states following its great success, and we are looking forward to continuing in this vein.
2015 will be our 30th year since starting as MAPS. We will mark this significant point in time with suitable fanfare.
It will be a year in which we reflect and consider the remarkable amount of change and development we have faced since inception in 1985; when Procurement Australia was a grouping of 14 Melbourne based Local municipal councils operating out of a single office at the Victoria Market.
With a turnover of almost $14 million today, we have come a long way and we look forward to sharing with you the most remarkable moments that have occurred through the decades.
Thank you to our Board, our excellent Executive Management Team and employees, our Members, suppliers and all those associated with the company.
Ken McNamaraChair, Board of Management.28 November 2014.
Our Chief Executive, Joe Arena, will expand on this and cover the key achievements during the year in his review. I’d like to talk about three areas – raising industry standards, promoting professional development and delivering sustainable results – and how we are working to achieve solid outcomes in each.
First, our annual conference in August, Matter 2014 – (Your Choices Matter), was a great success attracting participants and exhibitors from around Australia. We approached Matter 2014 from the view that the environment within which our Members operate, demands proven, well managed buying practices that deliver cost savings over the long term.
We strove to give attendees an insight into the future; how to get there sustainably and how to maintain the momentum for a prosperous future by applying processes and making choices that matter. We’ve had excellent feedback from the conference participants and are motivated to achieve even greater initiatives in 2015, our 30th year.
Second, our partnership with CIPS – the Chartered Institute of Procurement and Supply Australasia – gives Members significant advantage and motivation to join us in raising industry standards and promoting professional development. It’s such a great opportunity and we are delighted with the uptake so far. Linking Members from around Australia with procurement and supply experts and specialists means we are sharing the innovation and experience for mutual benefit.
6

‘Last year I spoke of the significant changes that had taken place to help position Procurement Australia for the future. Twelve months on, I am very pleased to announce a strong turnaround in our financial position with record profit and record dividends, the direct result of actions taken in 2013/14.
This Report gives me the opportunity to thank our Board, my Executive Team and our dedicated employees for putting in the hard yards over the last 12 months to enable a significant profit to be delivered, and an improved organisation to emerge. It also allows me to speak of Procurement Australia’s many achievements during the year and set the scene for 2014/15.’
Procurement Australia took big steps in organisational development in 2013/14. A new Chair and two Board Member appointments, and several general staff arrangements were put in place.
As Chief Executive with a mandate to improve our performance for Members and shareholders, I cannot speak highly enough of the collaborative, cooperative and committed team effort this new group of people have offered me. Thank you.
I know our Chair, Ken McNamara, has already addressed the matter of professional development and the benefits a diverse range of skills, experience and capabilities can bring an organisation if orchestrated correctly but I wanted to comment too on this important topic.
If we follow our vision of being the leading partner of strategic sourcing and procurement solutions for our clients, we can make great strides.
These improvements work to buoy management and staff who also enjoy supporting great charities such as The Smith Family, Red Cross Australia, and Conservation of the Orang-utans, Wildlife Victoria and the Development of Drinking Water in Third World Countries through a voluntary giving scheme.
I believe we are now on the right path, and I invite you to continue along it with me. This year we focussed on our five year strategic plan developed in 2013. The strong vision and direction that plan established and the targets it set have been invaluable, providing the framework for us to perform.
The plan is proving to be the effective corporate and business strategy we sought to deliver both long term profitable growth and commercial sustainability. It works because it focuses us on our key target markets within which we can then identify and prioritise business opportunities.
It also helped build Procurement Australia’s new organisational structure which is needed to achieve our growth and sustainability objectives, additionally outlining a clear program of activity for implementation.
As a result, Procurement Australia is a leaner, more efficient organisation better aligned with its client base which has grown and reinvigorated with a raft of innovative products and services available and in the pipeline, the result of a more strategic approach to our work.
We are now both proactive and reactive following our restructure which allows us to refocus on core operations delivering cost effective, relevant and sustainable buying solutions our Members really want.
We are now in a position to set and reach inspired goals in terms of sustainable efficiencies, whilst enhancing savings for our clients, and the ongoing development of our sector’s professional skills and capabilities.
We set the base for 2014/15 with the consultativereview approach adopted in 2013/14, re-establishing strong communications and relationships with our Members and suppliers.
This approach gave us a clear and strong understanding of what we needed to deliver to be successful in delivering to clients’ needs and running a profitable organisation.
Our hard work has paid off in more than financial ways with some very exciting initiatives to be launched, and in the pipeline for 2014/15. As heralded last year, they are leading edge, sustainable products delivering both cost savings and improved environmental impacts, enhancing quality and performance for our clients.
‘This much improved financial situation has supported the declaration of a record shareholder dividend of 21.5 cents per share.’
7

Maggie Dowling, Chief Executive OfficerCouncil Solutions:
‘With our own Stationery contract expiring in 2014 a number of our member councils partnered with Procurement Australia for their Stationery, Cut Sheet Paper, IT Consumables-Peripherals & Office Machines tender. The process was very well managed and the resulting contract has delivered significant value to the participating Councils.’
A winner in the achievements to be mentioned here are our successful Tender Reference Groups.
The involvement of clients from around Australia, and the framework we have adopted in running these groups has seen increased numbers of clients sharing the spoils. For example, over 55 per cent more clients took advantage of the Stationery, Cut Sheet Paper, IT Peripherals and Office Machines contract struck during the year, with participant numbers increasing from 38 to 59.
Typically, Tender Reference Groups meet around five times during the tender period and involve up to seven clients working to set specifications, reviewing submissions and making recommendations.
At year end we had Tender Reference Groups in place for the Greenfield Category Tender – Tree Pruning & Associated Services.
Sitting alongside our Tender Reference Groups are the Contract Briefings we held for Members and suppliers in Adelaide, Melbourne and Sydney Greenfield Category Tenders.
We saw the successful completion of one Greenfield Category Tender in 2013/14 being the Hire of Plant and Trucks tender for NSW’s Southern Sydney Regional Organisation of Councils (SSROC). Greenfield tenders in development at year’s end were Tree Pruning & Associated Services, Traffic Control & Pavement Marking Services, and Security & Associated Services.
It’s been a busy year in Existing Category Tenders too. Nine were run during the year with a number still to complete – Mobile Garbage Bins, Printing & Associated Services, Bulk Fuels, Retail Fuels, the ‘OneCard’ Fuel Card Solution, Water and Waste Water Treatment Chemicals, Retail Electricity & Street Lighting (SSROC), and the Quarterly Truck, Plant & Equipment tender.
Request for Quotations were opened for Yarra City Council (IT Products & Services), Bellingen Shire Council (Photocopiers, Printers & Associated Products & Services), and Wyndham City Council (Library Books, AV Media, Periodicals, Subscriptions – Library Open Day).
Administrative improvements have been made too. We introduced CertTracker, a system outsourcing the management of over 2,000 insurance and WorkCover Certificates of Currency required from our vendors annually. Cerberus was introduced to automate and enable electronic communication in vendor contracting.
Externally, we ran an extremely successful annual conference and awards event, ‘Matter 2014’, in August attracting many delegates from around Australia. Its focus being the sustainable future of procurement.
We established a partnership with the peak procurement industry body, CIPS Australasia, which is dedicated to best-practice, continuous improvement and raising awareness of how procurement and supply management can make an invaluable difference. Benefits include discounted CIPS membership and training course rates for our Members.
As portended last year, the significant organisational changes and strategic directions that we put in place in 2013/14 have translated into positive outcomes.
The financial result for the year ending 30th September 2014 is a record operating profit of $910,536 – the best since incorporation in 1992.
This is over a 200% turnaround from 2012/13’s loss. While some of this improvement has come from the company restructure, encouragingly top line revenues have increased $1,323,825 year on year.
Total revenues from ordinary activities grew 10.5% to $13,966,230 up from $12,642,405 last year. Sales rebate revenue grew more than 15% to $4,521,803, the result of Members increased purchasing from Procurement Australia’s contract portfolio, a great result.
This much improved financial situation has supported the declaration of a record shareholder dividend of 21.5 cents per share.
Our ISO9001 accreditation was retained and remains as strong evidence of our capacity to deliver nationally under a robust governance framework.
Last year, after I had spent much time meeting our clients, suppliers and peers, I said I was proud to have joined an organisation that was well respected and fundamental to the market it served. This year I am even more proud to see just how much more respected and valued Procurement Australia has become.
With our committed Board, strong leadership team, dedicated workforce and established strategy in place, I look forward to taking Procurement Australia to the next level.
Joe ArenaChief Executive Officer.15 December 2014.
TOTAL REVENUES FROM ORDINARY ACTIVITIES UP 10.5% FROM LAST YEAR
RECORD OPERATING PROFIT FOR THE 2014 FINANCIAL RESULT
8

Founding Director, Ken McNamara, took up the role of Chair of Procurement Australia at the Annual General Meeting in February 2014 following Marianne Di Giallonardo’s resignation after a four year term. Ken was first appointed a Director in 1992, the year of Procurement Australia’s incorporation.
This year in May we welcomed two new Board Members – Vijaya Vaidyanath and Stephen Griffin, joining existing Directors John Ravlic, Susan Riley, and Lydia Wilson. They bring a wealth of experience and high credentials, offering great resources and support to the Executive Management team. Procurement Australia’s Board now comprises:
1 2 3
Mr Ken McNamara, Chair.
CE, Dip CE, DipAppScTp, BAppScPlan, FIE (Aust), FIMM, FAICDAppointed Chair: 21 February 2014Chair of the Board, Chair of Finance & Governance Committee
A founding Director of Procurement Australia, Ken is a civil engineer, town planner and company Director. With extensive experience as a Chief Executive, City Engineer and Consultant in Local Government, Ken is a Sessional Member of the Victorian Civil and Administrative Tribunal and a member of Planning Panels Victoria. He has served as a Government appointed independent chair of a number of major infrastructure projects including the Geelong Bypass, Sugarloaf Pipeline, Peninsula Link, Barwon Heads Bridge Echuca-Moama Bridge Projects, and the Western Highway – Anthony’s Cutting Project. Ken has direct expertise in governance, tendering and contract management together with an expansive understanding of procurement procedures across a range of public sectors.
Lydia Wilson, Chair, Sustainability Victoria.
BA, BSW, GAICD, FAIMAppointed: 26 February 2010Chair, Strategy Committee
Lydia has more than 22 years’ experience at Senior Executive level in Local Government, including 13 as a Chief Executive most recently with the City of Manningham and previously with the City of Yarra and the Shire of Macedon Ranges. Before becoming Chair of Sustainability Victoria, Lydia chaired the Victorian Government’s Ministerial Advisory Committee on Waste and Resource Recovery. As well as her chair roles, Lydia provides leadership and management consulting services in the areas of corporate governance, CEO performance and councillor support primarily to Local Government organisations, and is an Associate of SACS Consulting.
Susan Riley, Deputy Lord Mayor, City of Melbourne.
MAICDAppointed Director: 18 September 2009Member, Strategy Committee
With a 25 plus year career in publishing and media, and a three year involvement with the City of Melbourne, Susan brings to the Board extensive business and networking expertise, and significant knowledge of Local Government management issues. A sitting member on all of the City’s Committees including Audit, and Deputy Chair of Marketing Melbourne, Susan is integral to the City’s leadership team. She is also Member of the Australian Institute of Company Directors, and a strong advocate for small business, women in business and community development. Susan holds many important Board roles linked to business and community in Melbourne and Victoria.
Mr John Ravlic, Principal, Ravim RBC.
MLM, BBS, FLGMA Appointed Director: 29 July 2012 Member, Strategy Committee
John has more than 30 years’ Local Government experience gained in Victoria and Western Australia bringing a wealth of strategic planning and management insight with specific expertise in human resources, industrial relations, corporate management and marketing and communications. Prior to recently establishing Ravim RBC, a boutique consultancy working with Local Government, John was Chief Executive of Local Government Managers Australia (LGMA) for nine years where he drove a number of transformative sector initiatives including LGMA’s Climate Futures Program, its National Workforce Strategy 2020, the Year of Women in Local Government 2010, and the Indigenous Employment Program – Green Paper.
4 5
Vijaya Vaidyanath, Chief Executive Officer, Yarra City Council.
MBA, MA (Economics), F John F Kennedy School of Government, FNZIM, MSLGM, ICMA (USA), ALGA, MAV, LGPAAppointed: 23 May 2014Member, Finance & Governance Committee
Prior to taking up the Chief Executive role at Yarra City Council in 2012, Vijaya was Director, Corporate and Business Services with Darebin City Council after having been Chief Executive of New Zealand’s Waitakere City Council for eight years and, Chief Executive of Rodney Council. Vijaya was a senior banker with the Reserve Bank of India before migrating to New Zealand. Renown for her innovation, integrity and inspiring leadership, Vijaya has extensive experience in shared services and procurement. By example, Yarra City Council is Victoria’s first carbon neutral Council under the Australian Government’s National Carbon Offset Standard.
Stephen J Griffin, Chief Executive Officer, State Emergency Services.
BAppSc, DipEd, GradDip LG, MB ManAppointed: 23 May 2014 Member, Finance & Governance Committee
Stephen became Chief Executive of Victoria’s State Emergency Services in 2014 having been Chief Executive of the City of Greater Geelong since 2009. With a Local Government career spanning 28 years, Stephen started at the City of Melbourne in 1986 where he held both specific and general management positions before moving to Werribee-Wyndham City Council. Here he managed Recreation, Enterprise Support and became Director of Corporate Services at a time when the municipality was one of the fastest growing in Australia. Previously General Manager, Corporate Services at the City of Greater Geelong in 2007, Stephen brings extensive Local Government and broad management expertise.
6
1 2 34 5 6
9

1 23 4
Joe Arena, Chief Executive Officer.Richard Day, Chief Financial Officer, Company Secretary.Brendan Hoare, Director, Strategic Sourcing.Liz Van Doorn, Director, Marketing and Sales.
David Howes, Contracts & Procurement Manager, Southern Sydney Regional Organisation of Councils (SSROC):
‘Procurement Australia are a valued partner to SSROC and their commitment to excellence and world class procurement is what forms the basis and strength of our partnership with them. Thank you Joe and all your team.’
1
Joe ArenaChief Executive Officer.
MBA, BBus, GAICD, ASA, MCIPSA qualified and highly experienced leader, Joe has an accounting background with vast financial operations experience in the areas of procurement, taxation, banking, investments, accounting, finance, and fleet management. Prior to joining Procurement Australia, Joe was Director, Financial Operations with La Trobe University, an organisation with an operating budget of more than $650m spread over five campuses. A specialist in fostering collaborative client relationships, Joe drives the development and implementation of Procurement Australia’s strategic plan, ensuring the business has the right people, structure and systems in place to meet and exceed its business and client objectives.
2
Richard DayChief Financial Officer, Company Secretary.
FCCA, CPA, MIPARichard is a Fellow Chartered Certified Accountant (FCCA) a Certified Practicing Accountant (CPA) and member of The Institute of Public Accountants (MIPA). Prior to immigrating to Australia in 2008, Richard held senior finance roles in the advertising and hospitality industries working for international companies such as The WPP Group’s – Young & Rubicam Ireland and The Hilton Group. He has considerable experience at both Company Secretary and Director levels and joined Procurement Australia in November 2012.
3
Brendan Hoare Director, Strategic Sourcing.
BBusWith a procurement career spanning more than 15 years, Brendan came to Procurement Australia in 2011 having held previous positions of Director, Strategic Procurement with University of Melbourne and prior to that,Procurement Director at Victoria’s largest public health service, Monash Health(previously Southern Health). With solid financial management expertise involving diverse procurement portfolios, Brendan is responsible for Procurement Australia’s strategic procurement, tender and contracting functions and commercial and contractual outcomes, pursuing greenfield categories and identifying expansion opportunities.
4
Liz Van DoornDirector, Marketing and Sales.
Graduate, National Art School. Liz is an award winning, marketing and communications specialist with strong strategic marketing experience in the Government, travel, health, energy, hospitality and technology sectors. A specialist in local economic strategies, having studied with the Centre for Local Economic Strategies in Manchester in the UK, Liz has also been a senior lecturer at RMIT University’s School of Applied Communications. Leading the implementation of Procurement Australia’s strategic five year plan and driving marketing strategies, Liz’s role involves strategic planning, economic and social strategy, financial and segment management, public sector relations and strategic marketing communications.
10

DIRECTORS
The Directors present their report together with the financial statements of Maps Group Limited (“the Company”) for the year ended 30th September 2014 and the Auditors’ Report thereon.
The Directors of the Company in office at any time during or since the financial year are:
Mr Ken McNamara CE, Dip CE, DipAppScTp, BAppScPlan, FIE (Aust), FIMM, FAICD (Chair of Board of Directors) Appointed: 1992 Chair from: 21 February 2014 Chair of Finance & Governance Committee
Mr John Ravlic MLM, BBS, FLGMA (Non-Executive Director)Appointed: 29 July 2012Principal – Ravim RBC
Ms Susan Riley (Non-Executive Director) Appointed: 18 September 2009 Deputy Lord Mayor – City of Melbourne
Ms Lydia C. Wilson BA, BSW, GAICD, FAIM (Non-Executive Director) Appointed: 26 February 2010 Practitioner at Lydia Wilson Leadership Development Chair of Strategy Committee
Mr Stephen Griffin (Non-Executive Director) Appointed: 23 May 2014 Chief Executive Officer – Victoria State Emergency Service
Ms Vijaya Vaidyanath MBA, MA (Economics) (Non-Executive Director) Appointed: 23 May 2014 Chief Executive Officer – Yarra City Council
DIRECTORS RESIGNING THEIR OFFICE AT 21 FEBRUARY 2014
Ms Marianne Di Giallonardo MBA, GradDipBus, BA, Dip YW, FLGPRO, MAIM, MIPPA, MLGMA, MAHRI, MAICD (Previously – Chair of Board of Directors) Appointed: 16 February 2005 Chair from: 26 February 2010 Resigned: 21 February 2014 Member of Finance & Governance CommitteeDirector of Corporate Services – Maroondah City Council
Mr Keith Yeo DipBusAcc, GradDipAcc, GradDipMan, FCPA, FLGPRO (Non-Executive Director) Appointed: 21 February 2007 Resigned: 21 February 2014 Director of Corporate Services – Banyule City Council
COMPANY SECRETARY
Mr Richard Day FCCA, CPA, MIPAAppointed: 30 November 2012
DIRECTORS’ MEETINGS
The number of Directors’ meetings (including meetings of Committees of Directors) and number of meetings attended by each of the Directors of the Company during the financial year are:
Director Directors’ meetings Finance & Governance Strategy Committee meetings
No. eligible to attend
No. attended No. eligible to attend
No. attended No. eligible to attend
No. attended
Mr Ken McNamara 6 6 6 6 – 1
Mr Stephen Griffin 3 2 1 0 – –
Mr John Ravlic 6 6 – – 4 2
Ms Susan Riley 6 5 – – 4 3
Ms Vijaya Vaidyanath 3 3 1 0 – –
Ms Lydia C. Wilson 6 4 – – 4 4
Ms Marianne Di Giallonardo 1 1 2 2 – –
Mr Keith Yeo 1 1 2 2 – –
Number eligible to attend – reflects the number of meetings held for the time the Director held office during the year. Number attended – number of meetings attended by each member in the reporting year.
11
Principal ActivitiesThe principal activities of the Company during the course of the financial year were the establishment of general supply contracts, the promotion of those contracts, facilitating the OneCard fuel purchasing product, developing the Engine Room e-Procurement platform and conducting an annual awards dinner and conference. There were no significant changes in the nature of the activities of the Company during the year.
ResultThe operating profit for the year ended 30th September 2014 attributable to the Members of Maps Group Limited was $910,536 (The result for the year ended 30th September 2013 was a loss of $928,782).
REVIEW OF OPERATIONS
RevenuesTotal revenues from ordinary activities grew to $13,966,230 ($12,642,405 year end 30th September 2013) the increase driven by improved sales rebate revenues and the OneCard fuel and management fee revenue.
ContractsRebate revenue of $4,521,803 accounted for 32% of total revenue improving in excess of 15% above the comparable figure recorded for the previous year of $3,906,940.
OneCard – Fuel and ManagementIn order to reflect both the substance of transactions and provide more relevant/reliable information to stakeholders’, revenues for this product have been presented gross. Growth has been driven by consumption and new member sales.
Environmental RegulationThe Company’s operations are not subject to any significant environmental regulations under either Commonwealth or State legislation. However, the Board believes that the Company has adequate systems in place for the management of its environmental requirements and is not aware of any breach of those environmental requirements as they apply to the Company.
Events Subsequent to Reporting DateThere has not arisen in the interval between the end of the financial year and the date of this report any item, transaction or event of a material and unusual nature likely, in the opinion of the Directors of the Company, to affect significantly the operations of the Company, the results of those operations, or the state of affairs of the Company, in future financial years.
Auditor’s Declaration under Section 307C of the Corporations Act 2001 The lead Auditor’s Independence Declaration is set out on page 25 and forms part of the Directors’ Report for the year ended 30th September 2014.
Likely DevelopmentsThe Company will seek to resume its policy of increasing profitability through consolidation and steady growth in existing markets and products, while at the same time continuing to develop and introduce other innovative opportunities across its markets.
Conference and Awards DinnerThe 2014 Conference and Awards Dinner was held at the MCG – Melbourne. It was attended by over 250 people from both Member and supplier organisations.
ExpenditureHas decreased to $13,055,694 ($13,571,187 year end 30th September 2013), following a restructuring event and no further amendment to the impairment provision made for the prior reporting year.
DividendsDividends paid or declared by the Company since the end of the previous financial year were:
Declared and paid during the year: A final unfranked ordinary dividend of 21.50 cents per share amounting to $85,325 in respect of the year ended 30th September 2014 was declared. A dividend remittance was not proposed for the previous year, given the degree of investment undertaken by the Company and the result reported.
State of AffairsDuring the course of the year the Company made no issues of ordinary shares.
In the opinion of the Directors there were no significant changes in the state of affairs of the Company during the financial year under review.
Directors’ Interests and BenefitsDuring the year ended 30th September 2014 no Director of the Company had received or become entitled to receive any benefit (other than a benefit included in the aggregate amount of remuneration received or due and receivable by Directors shown in the financial statements) because of a contract made by the Company or a related body corporate with the Director or with a firm of which the Director is a member, or with an entity in which the Director has a substantial interest.
During the year ended 30th September 2014, no Director of the Company had any personal interest in the Company. Some Directors held shares in trust for their respective employer organisations.
Indemnification and Insurance of Directors and Officers
IndemnificationSince the end of the previous financial year, the Company has not indemnified or made a relevant agreement for indemnifying against a liability, any person who is or has been an officer or auditor of the Company.
InsuranceThe Company has paid premiums for Directors’and Officers Liability and Corporate Reimbursement Insurance for current Directors and Officers of the Company.
As disclosure is prohibited under the terms of the contract, The Directors have not included details of the nature of the liabilities covered or premiums paid in respect of Directors’ and Officers’ liability insurance.
Signed in accordance with a resolution of the Directors:
Ken McNamara (Chair of Board of Directors and Finance & Governance Committee)
Dated at Melbourne this 15th Day of December 2014.
12

13

14

Notes 2014 $
2013 $
REVENUE FROM ORDINARY ACTIVITIES
Revenue from Ordinary Activities 2 13 ,966,230 12,642,405
EXPENSES FROM ORDINARY ACTIVITIES
Expenses from Ordinary Activities 3/9 13,055 ,694 13,571,187
PROFIT/(LOSS) FOR THE YEAR 910,536 (928,782)
Other Comprehensive Income – –
Total Comprehensive Income 910,536 (928,782)
STATEMENT OF COMPREHENSIVE INCOME
For the year ended September 2014 .
Notes 2014 $
2013 $
ASSETS
Current Assets
Cash and Cash Equivalents 5 3,305 ,084 2,232,571
Receivables 6 1,746,667 1,568,815
Other Assets 7 55 ,507 52,854
Total Current Assets 5,107,258 3,854,240
Non-Current Assets
Property, Plant & Equipment 8 47,772 174 ,386
Intangibles 9 173,999 256,414
Total Non-Current Assets 221,771 430,800
Total Assets 5,329,029 4,285,040
LIABILITIES
Current Liabilities
Payables 10 1,890,279 1,661,362
Short-term provisions 11 212,799 217,604
Total Current Liabilities 2,103,078 1,878,966
Non-Current Liabilities
Long-term provisions 11 30,251 35 ,585
Total Non-Current Liabilities 30,251 35,585
Total Liabilities 2,133,329 1,914,551
NET ASSETS 3,195,700 2,370,489
Equity
Contributed Equity 12a 403,862 403,862
Retained Earnings 12b 2,791,838 1,966,627
TOTAL EQUITY 3,195,700 2,370,489
STATEMENT OF FINANCIAL POSITION
For the year ended September 2014 .
15

For the year ended September 2014 .
STATEMENT OF CHANGES IN EQUITY
Notes Capital Contributed
$
Retained Earnings
$
Total $
Balance at 01 October 2012 403,862 2,962,875 3,366,737
Reduction in Capital – – –
Profit/(Loss) for the year – (928,782) (928,782)
Dividends paid/payable 12c – (67,466) (67,466)
Balance at 30th September 2013 403,862 1,966,627 2,370,489
Profit/(Loss) for the year – 910,536 910,536
Dividends paid/payable 12c – (85 ,325) (85 ,325)
Balance at 30th September 2014 403,862 2,791,838 3,195,700
For the year ended September 2014 .
STATEMENT OF CASH FLOWS
Notes 2014 $
2013 $
CASH FLOWS FROM OPERATING ACTIVITIES
Receipts
Sales Revenue – rendering of services from operating activities, Inc GST 15 ,022,590 13,908,100
Interest 73 ,668 67,248
Payments
Employee Salaries and Benefits (2,213 ,953) (2,647,665)
Other, Inc GST (2,823,498) (2,748,606)
OneCard Fuel (9,059,160) (8,326,268)
Net Cash flows from Operating Activities 13a 999,647 252,809
CASH FLOWS FROM INVESTING ACTIVITIES
Purchase of Property, Plant & Equipment and Intangibles (32,505) (450,950)
Proceeds from Sale of Property, Plant & Equipment 94 ,371 –
Net Cash Flows from Investing Activities 61,866 (450,950)
CASH FLOWS FROM FINANCING ACTIVITIES
OneCard Fuel Card Deposits 11,000 6,969
Dividends Paid – (67,466)
Net Cash Flows from Financing Activities 11,000 (60,497)
Net Increase/(Decrease) in Cash Held 1,072,513 (258,638)
Cash and Cash Equivalents at 1st October 2013 2,232,571 2,491,209
Cash and Cash Equivalents at 30th September 2014
5,13b 3,305,084 2,232,571
16

NOTES TO AND FORMING PART OF THE ACCOUNTS
For the year ended September 2014 .
NOTE 1. STATEMENT OF ACCOUNTING POLICIES
The financial report is a general purpose financial report that consists of Statement of Comprehensive Income, Statement of Financial Position, Statement of Changes in Equity, Statement of Cash Flows, and Notes accompanying these statements. The financial report is prepared on an accrual basis and is based on historical costs and does not take into account changing money values or, except where stated, current valuations of non current assets. The accounting policies have been consistently applied, unless otherwise stated.
The following is a summary of the material accounting policies adopted by the company in the preparation of the financial report.
(a) Basis of PreparationThe financial statements are general purpose financial statements that have been prepared in accordance with Australian Accounting Standards and Australian Accounting Interpretations. Australian Accounting Standards set out accounting policies that the AASB has concluded would result in financial statements containing relevant and reliable information about transactions, events and conditions. Compliance with Australian Accounting Standards ensures that the financial statements and notes also comply with International Financial Reporting Standards. The financial statement have been prepared on an accruals basis and are based on historical costs, modified, where applicable, by the measurement at fair value of selected non-current assets, financial assets and financial liabilities.
(b) ReceivablesTrade debtors are carried at nominal amounts due and are due for settlement within 30 days from the date of recognition. Collectability of debts is reviewed on an ongoing basis. A provision for doubtful debts is raised where doubt as to collection exists.
of an asset or part of an item of expense or revenue. GST receivable from and payable to the Australian Taxation Office (ATO) is included in the statement of financial position. The GST component of a receipt or payment is recognised on a gross basis in the statement of cash flows in accordance with Accounting Standard AASB 107.
(f ) Income TaxThe Australian Taxation Office provided the Company with Income Tax exemption on 29 December 1995 stating that “the company is exempt from Income Tax under paragraph 23(d) of the Income Tax Assessment Act (1936) on the grounds that it is a ‘public authority”. This exemption is effective for the years ending on or after 30th September 1996. Under this exemption, the Company will not be required to lodge a return for Income Tax purposes.
(g) Cash and Cash EquivalentsFor the purposes of the statement of cash flows, cash and cash equivalents includes cash on hand, deposits held at call with financial institutions, other short-term, highly liquid investments that are readily convertible to known amounts of cash and which are subject to an insignificant risk of changes in value, and bank overdrafts.
(h) LeasesLeases of fixed assets where substantially all the risks and benefits incidental to the ownership of the asset (but not the legalownership) are classified as finance leases. Finance leases are capitalised, recording as asset value of the minimum lease payments, including any guaranteed residual values. Leased assets are amortised over their estimated useful lives where it is likely that the entity will obtain ownership of the asset or over the term of the lease. Lease payments are allocated between the reduction of the lease liability and the interest expense for the period. Lease payments for operating leases, where substantially all the risks and benefits remain with the lessor, are charged as expenses in the periods in which they are incurred. Lease incentives under operating leases are recognised as a liability. Lease payments received reduce the liability.
(c) Property, Plant and EquipmentAll non-financial physical assets are measured initially at cost and subsequently revalued at fair value less accumulated depreciation and impairment.
Where an asset is acquired for no or nominal cost, the cost is its fair value at the date of acquisition. More details about the valuation techniques and inputs used in determining the fair value of non-financial physical assets are discussed in Note 8 Property, plant and equipment.
The fair value of plant, equipment and vehicles, is normally determined by reference to the asset‘s depreciated replacement cost.
For the accounting policy on impairment of non-financial physical assets, refer to impairment of assets under Note 1(m) Impairment of assets.
The depreciable amount of all fixed assets including building and capitalised lease assets, but excluding freehold land, is depreciated on a straight line basis over their useful lives commencing from the time the asset is held ready for use. A summary of the depreciation method and depreciation rates for each class of attached is as follows:
Class of Asset Depreciation Rate MethodPlant & Equipment 20-33% S/LMotor Vehicles 30% S/LIntangible Assets 20-33% S/L
Rates used are consistent with prior year except amortisation of e-Procurement software which has increased from 20% to 33%. The financial effect of the change is an increase in amortisation of intangible asset expense of $22,500.
(d) PayablesThese amounts represent liabilities for goods and services provided prior to the end of the financial year and which are unpaid. The normal credit terms are Net 30 days.
(e) Goods and Services TaxRevenues, expenses and assets are recognised net of GST except for receivables and payables which are stated with the amount of GST included and except where the amount of GST incurred is not recoverable, in which case GST is recognised as part of the cost of acquisition
(i) Employee BenefitsProvision is made for the company’s liability for employee benefits arising from services rendered by employees to balance date. Employee benefits that are expected to be settled within one year have been measured at the amounts expected to be paid when the liability is settled, plus related on-costs, including super and payroll tax. Employee benefits payable later than one year have been measured at the present value of the estimated future cash outflows to be made for those benefits.
Those cash flows are discounted using market yields on National Government Bonds with terms to maturity that match the expected timing of cash flows. Contributions are made by the company to employee superannuation funds and are charged as expenses when incurred.
( j) Revenue RecognitionRevenue is recognised in accordance with AASB 118. Income is recognised as revenue to the extent it is earned. Sales to MAPS Group Members not reported by suppliers at balance date are used as a base for the accrual of rebate revenue. In preparation of accrued revenue in conformity with Australian Accounting Standards requires management to make estimates and assumptions. The estimatesand associated assumptions are based on historical experience and various other factors that are believed to be reasonable under the circumstances. Actual results may differ from these estimates. Unearned income at reporting date is reported as income received in advance.
Revenues received for OneCard fuel product member purchases, are shown at their gross values reflecting the associated credit risk the company would be liable for if values were not collected. The inclusion of the gross sale figure has increased reported total revenue by $9,156,321 for the period ending 30th September 2014 ($8,448,450 year end 30th September 2013).
(k) Comparative InformationWhere necessary the previous year’s figures have been reclassified to facilitate comparisons.
(l) Financial Instruments
RecognitionFinancial instruments are initially measured at cost on trade date, which includes transaction costs, when the related contractual rights or obligations exist. Subsequent to initial recognition these instruments are measured as set out below.
Financial assets at fair value through profit and loss A financial asset is classified in this category if acquired principally for the purpose of selling in the short term or if so designated by management and within the requirements of AASB 139: Recognition and Measurement of Financial Instruments.
Loans and receivables Loans and receivables are non-derivative financial assets with fixed or determinable payments that are not quoted in an active market and are stated at amortised cost using the effective interest rate method.
Held-to-maturity investments These investments have fixed maturities, and it is the company’s intention to hold these investments to maturity. Any held-to-maturity investments held by the company are stated at amortised cost using the effective interest rate method.
Available-for-sale financial assets Available-for-sale financial assets include any financial assets not included in the above categories. Available-for-sale financial assets are reflected at fair value. Unrealised gains and losses arising from changes in fair value are taken directly to equities.
Financial liabilitiesNon-derivative financial liabilities are recognised at amortised cost, comprising original debt less principal payments and amortisation.
Fair valueFair value is determined based on current bid prices for all quoted investments. Valuation techniques are applied to determine the fair value for all unlisted securities, including recent arm’s length transactions, reference to similar instruments.
Impairment At each reporting date, the company assess whether there is objective evidence that a financial instrument has been impaired.
(m) Impairment of AssetsAt the end of each reporting period, the company assesses whether there is any indication that an asset may be impaired. The assessment will include considering external sources of information and internal sources of information. If such an indication exists, an impairment test is carried out on the asset by comparing the recoverable amount of the asset, being the higher of the asset’s fair value less costs to sell and value in use, to the asset’s carrying amount. Any excess of the asset’s carrying amount over its recoverable amount is recognised immediately in profit or loss, unless the asset is carried at a revalued amount in accordance with another Standard (e.g. in accordance with the revaluation model in AASB 116). Any impairment loss of a revalued asset is treated as a revaluation decrease in accordance with that other Standard.
Where it is not possible to estimate the recoverable amount of an individual asset, the company estimates the recoverable amount of the cash-generating unit to which the asset belongs.
Impairment testing is performed annually for intangible assets with indefinite lives.
17
NOTES TO AND FORMING PART OF THE ACCOUNTS
For the year ended September 2014 .

NOTES TO AND FORMING PART OF THE ACCOUNTS
For the year ended September 2014 .
For the purpose of fair value disclosures, MAPS Group has determined classes of assets and liabilities on the basis of the nature, characteristics and risks of the asset or liability and the level of the fair value hierarchy as explained above.
AASB 119 – Employee BenefitsThe revised standard changed the definition of short-term employee benefits. These were previously benefits that were expected to be settled within twelve months after the end of the reporting period in which the employees render the related service, however, short-term employee benefits are now defined as benefits expected to be settled wholly within twelve months after the end of the reporting period in which the employees render the related service. The change in classification has not materially altered the measurement of the annual leave provision.
(r) CommitmentsCommitments for future expenditure include operating and capital commitments arising from contracts. These commitments are disclosed by way of a note, refer to Note 14 Capital & Leasing Commitments at their nominal value and inclusive of the GST payable. These future expenditures cease to be disclosed as commitments once the related liabilities are recognised in the balance sheet.
(s) Events After the Reporting PeriodThere were no events which occurred after the reporting date that require disclosure as a subsequent event.
(t) Contingent Assets and Contingent LiabilitiesContingent assets and contingent liabilities are not recognised in the balance sheet, but are disclosed by way of a note (refer to Note 17 Contingent Assets and Contingent Liabilities) and, if quantifiable, are measured at nominal value. Contingent assets and liabilities are presented inclusive of GST receivable or payable respectively.
(q ) New Accounting Standards and InterpretationsCertain new accounting standards and interpretations have been published that are not mandatory for the 30th September 2014 reporting period. MAPS Group assesses the impact of these new standards and their applicability and early adoption where applicable.
As at 30th September 2014, there are a number of standards and interpretations that had been issued but were not mandatory for the financial year ending 30th September 2014. MAPS Group has not, and does not intend to adopt these standards early. MAPS Group expects that the application of the said standards in the following year will have an insignificant impact on the financial statements.
AASB 13 – Fair Value MeasurementConsistent with AASB 13 Fair ValueMeasurement, MAPS Group determines the policies and procedures for both recurring fair value measurements such as plant and equipment and motor vehicles and for non-recurring fair value measurements such as non-financial physical assets held, in accordance with the requirements of AASB 13 and the relevant Financial Reporting Directions.
All assets and liabilities for which fair value is measured or disclosed in the financial statements are categorised within the fair value hierarchy, described as follows, based on the lowest level input that is significant to the fair value measurement as a whole:
• Level 1 — Quoted (unadjusted) market prices in active markets for identical assets or liabilities.
• Level 2 — Valuation techniques for which the lowest level input that is significant to the fair value measurement is directly or indirectly observable.
• Level 3 — Valuation techniques for which the lowest level input that is significant to the fair value measurement is unobservable.
(n) Other Intangibles
Research & DevelopmentExpenditure during the research phase of a project is recognised as an expense when incurred. Development costs are capitalised only when technical feasibility studies identify that the project will deliver future economic benefits and these benefits can be measured reliably.
Development costs have a finite life and are amortised on a systematic basis matched to the future economic benefits over the useful life of the project.
(0) Critical Accounting Estimates and JudgementsThe preparation of a Financial Report in conformity with Australian Accounting Standards requires management to make judgements, estimates and assumptions that effect the application of policies and reported amounts of assets and liabilities, income and expenses. The estimates and associated assumptions are based on historical experience and various other factors that are believed to be reasonable under the circumstances, the results of which form the basis of making the judgements about carrying values of assets and liabilities that are not readily apparent from other sources. Actual results may differ from these estimates.
(p) ProvisionsProvisions are recognised when the company has a legal or constructive obligation, as a result of past events, for which it is probable that an outflow of economic benefits will result and that outflow can be reliably measured. Provisions recognised represent the best estimate of the amounts required to settle the obligation at the end of the reporting period.
NOTES TO AND FORMING PART OF THE ACCOUNTS
For the year ended September 2014 .
NOTE 2. REVENUE 2014 $
2013 $
Revenue from Operating Activities
Sales Rebate Revenue 4 ,521,803 3,906,940
Tenders Online 14 ,407 21,690
Awards Dinner and Conference 126,209 176,992
Forums & Seminars Revenue 2,000 7,436
OneCard Fuel & Management Fee Revenues 9,156,321 8,448,450
Interest 73 ,668 67,248
Net Gain on Asset Disposal (refer Note 4) 41,261 –
Sundry Revenue 30,561 13 ,649
Total Revenue from Ordinary Activities 13,966,230 12,642,405
NOTES 3. EXPENDITURE 2014 $
2013 $
Employee Expenses 2,203,814 2,477,172
Depreciation Plant & Equipment & Motor Vehicles 103,931 149,349
Amortisation of Intangible Assets 82,415 30,600
Leasing Rent and Outgoings 215 ,793 206,584
Promotional Activities 51,773 17,878
Doubtful Debt Provision 2,474 (15 ,196)
Auditors Remuneration – Audit Services (Refer Note 15) 12,478 16,315
Prior Year Rebate Revenue Written Off – 325 ,922
Awards Dinner and Conference 161,547 168,793
Business Development 45 ,954 33,144
Printing Postage Stationery 39,646 54 ,459
Travel Accommodation and Entertainment 106,795 65 ,271
Computer 362,905 312,562
Vehicle Running 40,281 57,957
Insurance 19,721 30,772
Utilities and Maintenance 34 ,015 52,892
Incidentals 301,533 292,415
Organisational Restructuring – 176,510
Financial Legal Secretarial 61,852 130,342
Online Catalogue 25 ,335 22,333
Directors' Fees 122,194 83,138
Loss on Sale of Fixed Assets 2,078 –
Impairment Provision (Refer Note 9) – 482,437
OneCard Cost of Sales 9,059,160 8,399,538
Total Expenses from Ordinary Activities 13,055,694 13,571,187
18

NOTES TO AND FORMING PART OF THE ACCOUNTS
For the year ended September 2014 .
NOTE 4. SALE OF NON-CURRENT ASSETS 2014 $
2013 $
Proceeds from Disposals of Assets 82,003 –
Less: Written-Down Value of Assets Sold (40,742) –
Profit returned on sale of Non-Current Assets 41,261 –
Non-Current Assets – Sales with a Loss
Proceeds from Disposals of Assets 12,368 –
Less: Written-Down Value of Assets Sold (14 ,446) –
Loss returned on sale of Non-Current Assets (2,078) –
Net Gain/(Loss) on Disposal 39,183 –
NOTES 5. CASH AND CASH EQUIVALENTS 2014 $
2013 $
Cash on Hand and at Bank 1,022,513 760,375
Term Deposit – 2014: Earning interest at 3 .60% (2013: 4 .10%) 2,282,571 1,472,196
3,305,084 2,232,571
NOTES 6. TRADE AND OTHER RECEIVABLES 2014 $
2013 $
Trade Debtors 1,414 ,026 1,115 ,510
Accrued Revenue 335 ,142 445 ,621
Other Receivables – 7,684
Less Provision for Impairment of Receivables (2,501) –
Total Receivables 1,746,667 1,568,815
NOTES TO AND FORMING PART OF THE ACCOUNTS
For the year ended September 2014 .
NOTE 6. PROVISION FOR IMPAIRMENT OF RECEIVABLES (CONTINUED)
Current trade and term receivables are non-interest bearing loans and generally on 30 day terms. Non-current trade and term receivables are assessed for recoverability based on the underlying terms of the contract. A provision for impairment is recognised. Movement in the provision for impairment of receivables is as follows:
OpeningBalance
1/10/2013 $
Change forthe year2013-14
$
Amountswritten off
2013-14 $
Closing balance
30/09/2014 $
Current trade receivables – 2,701 (200) 2,501
– 2,701 (200) 2,501
OpeningBalance
1/10/2012 $
Change forthe year2012-13
$
Amountswritten off
2012-13 $
Closing balance
30/09/2013 $
Current trade receivables 17,349 (15 ,196) (2,153) –
There are no balances within trade or other receivables that contain assets that are not impaired and are past due. It is expected these balances will be received when due. Impaired assets are provided for in full.
NOTES 7. OTHER ASSETS 2014 $
2013 $
Prepayments 55 ,507 52,854
NOTES 8. PROPERTY, PLANT AND EQUIPMENT 2014 $
2013 $
Fair Value
Property, Plant and Equipment 223,959 1,350,889
Less Accumulated Depreciation 176,187 1,176,503
47,772 174 ,386
Total of Property, Plant and Equipment at Fair Value 47,772 174,386
Fair Value Measurement Hierarchy for Assets as at 30th September 2014 Carrying Amount
as at 30th Sep 14
Fair Value measurement at end of reporting period using:
Level 1 Level 2 Level 3
Plant, Equipment and Vehicles at Fair Value:
Vehicles 7,400 7,400
Plant and Equipment 40,372 40,372
Total of Plant, Equipment and Vehicles at Fair Value 47,772 – – 47,772
19

NOTES 8. PROPERTY, PLANT & EQUIPMENT (CONTINUED)
VehiclesVehicles are valued using the depreciated replacement cost method. MAPS Group acquires new vehicles and at times disposes of them before the end of their economic life.
Plant and EquipmentPlant and equipment is held at fair value. When plant and equipment is specialised in use, such that it is rarely sold other than as part of a going concern, fair value is determined using the depreciated replacement cost method.
There were no changes in valuation techniques throughout the period to 30th September 2014 .
For all assets measured at fair value, the current use is considered the highest and best use.
Reconciliations of the carrying amounts of each class of plant & equipment and motor vehicles at the beginning and end of the current financial year is set out below.
Level 3 Tangible Assets – identified as: Assets whose valuation techniques for which the lowest level input that is significant to the fair value measurement are unobservable.
Plant & Equipment Motor Vehicles Total
2014 $
2013 $
2014 $
2013 $
2014 $
2013 $
Opening Balance 76,743 155 ,933 97,643 165 ,602 174 ,386 321,535
Additions 32,505 2,200 – – 32,505 2,200
Disposals – – (55 ,188) – (55 ,188) –
Transfers – – – – – –
Depreciation (see note 3) (68,877) (81,390) (35 ,054) (67,959) (103,931) (149,349)
Closing Balance 40,371 76,743 7,401 97,643 47,772 174,386
Note: Fair value assessments have been performed for all classes of assets in this purpose group and the decision was made that changes were not material ( less than or equal to 10 per cent) for a full revaluation. The next scheduled full revaluation for this purpose group will be conducted in 2015 .
Description of significant unobservable inputs to Level 3 Tangible Asset valuations:
Valuation Technique
Significant Unobservable
Inputs
Range / Cost (Weighted Average)
Sensitivity of Fair Value measurement to changes in Significant Observable Inputs
Plant and EquipmentDepreciated Replacement
Cost
Cost per unit $240 to 20,000 (average 4,330
per unit)
A significant increase or decrease in cost per unit would result in a significantly higher or
lower fair value.
Useful life of plant &
equipment3 to 5 years
A significant increase or decrease in the estimated useful life of the asset would result
in a significantly higher or lower valuation.
Motor VehiclesDepreciated Replacement
Cost
Cost per unit $ 33,145A significant increase or decrease in cost per unit would result in a significantly higher or
lower fair value.
Useful life of plant &
equipment3 years
A significant increase or decrease in the estimated useful life of the asset would result
in a significantly higher or lower valuation.
NOTES TO AND FORMING PART OF THE ACCOUNTS
For the year ended September 2014 .
NOTES 9. INTANGIBLES 2014 $
2013 $
At Cost 769,451 769,451
Impairment Provision (482,437) (482,437)
Less Accumulated Amortisation (113 ,015) (30,600)
Total Intangible Assets Carrying Value 173,999 256,414
Reconciliation of Carrying Amounts
E-Procurement Software System
OneCard Fuel Product
Total
2014 $
2013 $
2014 $
2013 $
2014 $
2013 $
Opening Balance 155,455 194,502 100,959 126,199 256,414 320,701
Additions – 448,750 – – – 448,750
Disposals – – – – – –
Transfers – – – – – –
Impairment Provision – (482,437) – – – (482,437)
Amortisation (see note 3) (57,175) (5 ,360) (25 ,240) (25 ,240) (82,415) (30,600)
Closing Balance 98,280 155,455 75,719 100,959 173,999 256,414
NOTES 10. PAYABLES 2014 $
2013 $
Current
Trade Creditors 934 ,097 844 ,136
Accrued Expenses 114 ,851 124 ,581
PAYG and GST Payable 144 ,181 103,645
OneCard Fuel Deposit 595 ,824 584 ,824
Superannuation 16,001 –
Donations to Charity Payable – 4 ,176
Dividends Payable 85 ,325 –
1,890,279 1,661,362
NOTES TO AND FORMING PART OF THE ACCOUNTS
For the year ended September 2014 .
20

NOTES TO AND FORMING PART OF THE ACCOUNTS
For the year ended September 2014 .
NOTES 11. PROVISIONS 2014 $
2013 $
Short Term
Accrued Staff Bonuses 85 ,640 46,148
Annual Leave 87,186 118,809
Long Service Leave – expected to be settled within 12 months 27,683 26,440
Unpaid FBT 12,290 26,207
Total 212,799 217,604
Long Term
Long Service Leave – expected to be settled after 12 months 30,251 35 ,585
Total Provisions 243,050 253,189
NOTES 12. EQUITY AND RESERVES 2014 $
2013 $
(a) Contributed Equity
396,862 (2013: 396,862) ordinary shares fully paid
403,862 403,862
(b) Retained Earnings
Retained Earnings at the beginning of the year 1,966,627 2,962,875
Net Result For The Year 910,536 (928,782)
Dividends Paid (85 ,325) (67,466)
Retained Earnings at the end of the year 2,791,838 1,966,627
(c) Dividends
Dividends recognised in the current year by the Company are:
21.5 cents per share – (2013: final unfranked ordinary dividend – 17 cents). (85 ,325) (67,466)
NOTES TO AND FORMING PART OF THE ACCOUNTS
For the year ended September 2014 .
NOTE 13. RECONCILIATION OF NET RESULT FOR THE YEAR TO NET CASH FLOWS FROM OPERATING ACTIVITIES
2014 $
2013 $
(a) Reconciliation of net cash used in operating result
Profit/(Loss) from ordinary activities after income tax 910,536 (928,782)
Non-Cash Movements
Depreciation 103,931 149,349
Amortisation 82,415 30,600
Doubtful Debts provision/(provision write back) 2,501 (17,349)
Loss/(Gain) on disposal of non-current assets (39,183) –
Increase/(Decrease) in Employee Entitlements (10,139) (170,488)
Increase/(Decrease) in Payables 132,592 48,935
Decrease/(Increase) in Prepayments (2,653) (24 ,767)
Decrease/(Increase) in Receivables (180,353) 682,874
Increase/(Decrease) in Impairment Provision – 482,437
Net Cash From Operating Activities 999,647 252,809
(b) Reconciliation of cash
Cash at the end of the financial year as shown in the cash flow statement is reconciled to the related items in the balance sheet as follows:
Cash on Hand and at Bank 1,022,513 760,375
Term Deposits 2,282,571 1,472,196
Cash and Cash Equivalents 3,305,084 2,232,571
NOTES 14. CAPITAL AND LEASING COMMITMENTS 2014 $
2013 $
(a) Operating Lease Commitments
Non-cancellable operating leases contracted for but not capitalised in the financial statements.
Payable
Not later than 1 year 248,019 238,905
Later than 1 year but not later than 5 years 211,377 470,458
Later than 5 years – –
459,396 709,363
A seven-year lease has been signed on 447 Auburn Rd Hawthorn, the Victorian and National Offices, whose expiry is set for August 2016.
(b) Capital Commitments
At 30th September 2014 , the Company has no capital commitments.
21

NOTES TO AND FORMING PART OF THE ACCOUNTS
For the year ended September 2014 .
NOTE 15. AUDITOR’S REMUNERATION 2014 $
2013 $
Amounts received, or due and receivable for auditing the accounts by:
Victorian Auditor-General (External Audit) 12,478 16,315
12,478 16,315
NOTE 16. RELATED PARTY TRANSACTIONS
(a) The names of Directors whom have held office during the financial year are:
Mr John Ravlic, Mr Ken McNamara, Ms Susan Riley, Ms Lydia Wilson. Ms. Vijaya Vaidyanath, Mr Stephen Griffin (both appointed 23rd May ’14). Ms Marianne Di Giallonardo, Mr Keith Yeo (both resigned 21st Feb ’14).
No Director has entered into a material contract with the Company since the end of the previous financial year and there were no material contracts involving Directors’ interests subsisting at year end.
2014 $
2013 $
(b) Income paid or payable to Directors 110,925 78,718
No. of Directors whose income from the company was within the following bands:
$1,000–$9,999 2 –
$10000–$19,999 4 6
$20,000–$29,999 2 –
(c) Amounts of a prescribed benefit given during the year by the company to a prescribed superannuation fund on behalf of Directors 7,431 4 ,420
(d) Other Transactions of Responsible Persons and their Related Entities
For the year ending 30th September 2014 one Board Member was engaged to provide professional support and mentoring services to the CEO.
Mr. K. McNamara – 41,925
Ms. L . Wilson 4,400 38,478
4,400 80,403
MAPS Group Ltd did not make payments to other contractors charged with significant management responsibilities from 1st October 2013 to 30th September 2014 .
NOTES TO AND FORMING PART OF THE ACCOUNTS
For the year ended September 2014 .
NOTE 16. RELATED PARTY TRANSACTIONS (CONTINUED)
(e) Executive Officers’ Remuneration
The number of executive officers, other than responsible persons, whose total remuneration falls within the bands above $100,000 at 30th September 2014 are as follows:
Income band ($) 2014 2013
$100,000–$109,999 1 1
$110,000–$119,999 – 4
$130,000–$139,999 1 –
$140,000–$149,999 – 1
$150,000–$159,999 1 –
$160,000–$169,999 1 –
$170,000–$179,999 – 1
$200,000–$209,999 1 –
$220,000–$229,999 – 1
Total number of employees for the above bands
5 8
Aggregate remuneration for bandings above 753,550 1,095 ,267
NOTE 17: CONTINGENT ASSETS AND CONTINGENT LIABILITIES
2014 $
2013 $
Contingent Liabilities
Bank Guarantees related to 447 Auburn Road, Hawthorn East, Victoria 3123. 73 ,854 73,854
Total Contingent Liabilities 73,854 73,854
There are no known contingent assets for the company.
NOTE 18: EVENTS OCCURRING AFTER REPORTING DATE
Since 30th September 2014 no matter or circumstance has arisen which has significantly affected, or which may significantly affect, the operations of the organisation or of a related entity.
22

NOTES TO AND FORMING PART OF THE ACCOUNTS
For the year ended September 2014 .
Liquidity RiskLiquidity risk is the risk of being unable to meet financial obligations as they fall due.
The entity manages liquidity risk by monitoring cash flows and ensuring that maximum funds are available for investment and payment of financial liabilities.
There has been no significant change in the entity’s exposure, or its objectives, policies and processes for managing liquidity risk or the methods used to measure this risk from the previous reporting period.
The entity’s financial liability maturities have been disclosed at Note 19 (b).
Other Price RiskThe entity has no significant exposure to other price risk.
Funding RiskFunding risk is the risk of over reliance on a funding source to the extent that a change in that funding source could impact on the operating result for the current year and future years.
There has been no significant change in the entity’s exposure, or its objectives, policies and processes for managing funding risk or the methods used to measure this risk from the previous reporting period.
Credit Risk ExposuresThe entity’s maximum exposures to credit risk at balance date in relation to each class of recognised financial asset is the carrying amount of those assets as indicated in the Statement of Financial Position.
Concentration of Credit RiskThe entity minimises concentrations of credit risk in relation to trade accounts receivable by not undertaking transactions with many customers due to the nature of the entity operations.
Credit risk in trade receivables is managed in the following ways:
• payment terms are 30 days from date of invoice.
• payments are recognised for amounts to be paid in the future for goods and services received, whether or not billed to the entity. Payables are normally settled on 30 day terms.
• debtors with accounts in excess of 30 days are sent a statement of account, indicating terms to make payment.
• debtors with arrears are sent a reminder notice to make payment before reference of their debt to a debt collection agency.
• debtors which represent Government departments or agencies are not referred to a debt collection agency, but managed by the entity directly with agency contacts.
NOTE 19. FINANCIAL INSTRUMENTS
(a) Financial Risk ManagementThe entity’s financial instruments consist mainly of deposits with banks, short term investments, accounts receivables and payables and leases.
The totals for each category of financial instruments, measured in accordance with ASB 139 as detailed in the accounting policies to these financial statements, are as follows:
The main risks the entity is exposed to through its financial instruments are market risk, funding risk, interest rate risk, credit risk and liquidity risk.
Market RiskThe entity in its daily operations is exposed to a number of market risks. Market risks relate to the risk that market rates and prices will change and that this will have an adverse affect on the operating result and/or net worth of the entity.
There has been no significant change in the entity’s exposure, or its objectives, policies and processes for managing market risk or the methods used to measure this risk from the previous reporting period.
Interest Rate RiskThe entity has no long term borrowings, and so is not exposed to any borrowing interest rate risk.
The entity has minimal exposure to interest rate risk through its holding of cash assets and other financial assets. The entity manages its interest rate risk by maintaining a diversified investment portfolio.
Sharemarket RiskThe entity has no share portfolio, and so no sharemarket risk.
Foreign Exchange RiskThe entity has no exposure to changes in the foreign exchange rate
NOTES TO AND FORMING PART OF THE ACCOUNTS
For the year ended September 2014 .
(b) Interest Risk Management The entity’s exposure to interest rate risk, which is the risk that a financial instrument’s value will fluctuate as a result of changes in market interest rates and the effective weighted average interest rates on those financial assets and financial liabilities.
Financial Instruments
Non-Interest-Bearing Floating Interest Rate Fixed Interest Rate Maturing In: Total Carrying Amount Per Balance
Sheet1 year or less 1 to 5 years Over 5 years
2014 $
2013 $
2014 $
2013 $
2014 $
2013 $
2014 $
2013 $
2014 $
2013 $
2014 $
2013 $
Financial Assets
Cash 1,022,513 760,375 2,282,571 1,472,196 3,305,084 2,232,571
Receivables 1,746,667 1,568,815 1,746,667 1,568,815
Other Financial Assets
– –
Total Financial Assets
1,746,667 1,568,815 1,022,513 760,375 2,282,571 1,472,196 – – – – 5,051,751 3,801,386
Financial Liabilities
Payables 1,890,279 1,661,362 1,890,279 1,661,362
Interest Bearing Liabilities
– –
Total Financial Liabilities
1,890,279 1,661,362 – – – – – – – – 1,890,279 1,661,362
Net Financial Asset/Liabilities
(143,612) (92,547) 1,022,513 760,375 2,282,571 1,472,196 – – 3,161,472 2,140,024
Weighted Average Interest Rate
3.6% 5.1% – – – – – –
NOTE 19. FINANCIAL INSTRUMENTS (CONTINUED)
23
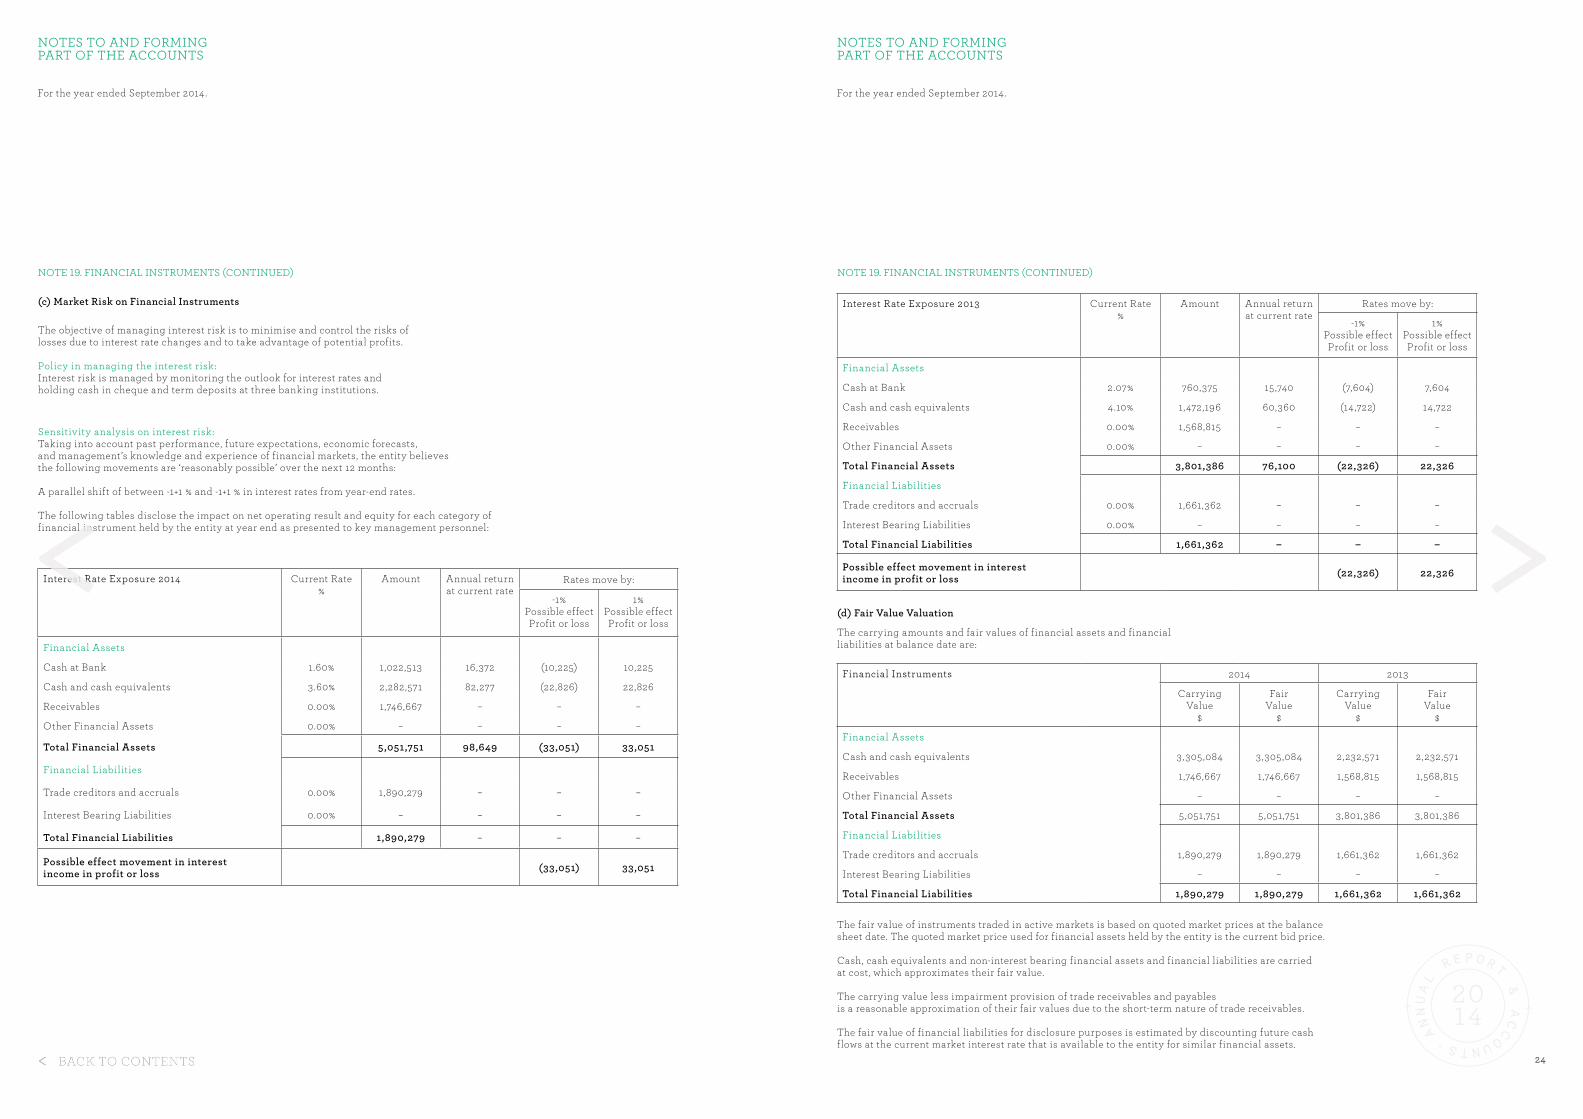
For the year ended September 2014 .
NOTES TO AND FORMING PART OF THE ACCOUNTS
NOTE 19. FINANCIAL INSTRUMENTS (CONTINUED)
(c) Market Risk on Financial Instruments
The objective of managing interest risk is to minimise and control the risks of losses due to interest rate changes and to take advantage of potential profits.
Policy in managing the interest risk: Interest risk is managed by monitoring the outlook for interest rates and holding cash in cheque and term deposits at three banking institutions.
Sensitivity analysis on interest risk: Taking into account past performance, future expectations, economic forecasts, and management’s knowledge and experience of financial markets, the entity believes the following movements are ‘reasonably possible’ over the next 12 months: A parallel shift of between -1+1 % and -1+1 % in interest rates from year-end rates. The following tables disclose the impact on net operating result and equity for each category of financial instrument held by the entity at year end as presented to key management personnel:
Interest Rate Exposure 2014 Current Rate %
Amount Annual return at current rate
Rates move by:
-1%Possible effect Profit or loss
1%Possible effect Profit or loss
Financial Assets
Cash at Bank 1.60% 1,022,513 16,372 (10,225) 10,225
Cash and cash equivalents 3.60% 2,282,571 82,277 (22,826) 22,826
Receivables 0.00% 1,746,667 – – –
Other Financial Assets 0.00% – – – –
Total Financial Assets 5,051,751 98,649 (33,051) 33,051
Financial Liabilities
Trade creditors and accruals 0.00% 1,890,279 – – –
Interest Bearing Liabilities 0.00% – – – –
Total Financial Liabilities 1,890,279 – – –
Possible effect movement in interest income in profit or loss (33,051) 33,051
For the year ended September 2014 .
NOTES TO AND FORMING PART OF THE ACCOUNTS
NOTE 19. FINANCIAL INSTRUMENTS (CONTINUED)
Interest Rate Exposure 2013 Current Rate %
Amount Annual return at current rate
Rates move by:
-1%Possible effect Profit or loss
1%Possible effect Profit or loss
Financial Assets
Cash at Bank 2.07% 760,375 15 ,740 (7,604) 7,604
Cash and cash equivalents 4 .10% 1,472,196 60,360 (14 ,722) 14 ,722
Receivables 0.00% 1,568,815 – – –
Other Financial Assets 0.00% – – – –
Total Financial Assets 3,801,386 76,100 (22,326) 22,326
Financial Liabilities
Trade creditors and accruals 0.00% 1,661,362 – – –
Interest Bearing Liabilities 0.00% – – – –
Total Financial Liabilities 1,661,362 – – –
Possible effect movement in interest income in profit or loss (22,326) 22,326
(d) Fair Value Valuation
The carrying amounts and fair values of financial assets and financial liabilities at balance date are:
Financial Instruments 2014 2013
CarryingValue
$
FairValue
$
CarryingValue
$
FairValue
$
Financial Assets
Cash and cash equivalents 3 ,305 ,084 3,305 ,084 2,232,571 2,232,571
Receivables 1,746,667 1,746,667 1,568,815 1,568,815
Other Financial Assets – – – –
Total Financial Assets 5 ,051,751 5 ,051,751 3 ,801,386 3,801,386
Financial Liabilities
Trade creditors and accruals 1,890,279 1,890,279 1,661,362 1,661,362
Interest Bearing Liabilities – – – –
Total Financial Liabilities 1,890,279 1,890,279 1,661,362 1,661,362
The fair value of instruments traded in active markets is based on quoted market prices at the balance sheet date. The quoted market price used for financial assets held by the entity is the current bid price. Cash, cash equivalents and non-interest bearing financial assets and financial liabilities are carried at cost, which approximates their fair value.
The carrying value less impairment provision of trade receivables and payables is a reasonable approximation of their fair values due to the short-term nature of trade receivables. The fair value of financial liabilities for disclosure purposes is estimated by discounting future cash flows at the current market interest rate that is available to the entity for similar financial assets.
24

The Directors of the company declare that:
1. The financial statements and notes of the company set out on pages 26 to 45:
a) present fairly the company’s financial position as at 30th September 2014 and its performance and cash flows for the year ended on that date in accordance with Australian Accounting Standards; and
b) comply with the Corporations Law.
2. In the Directors’ opinion there are reasonable grounds to believe that the company will be able to pay its debts as and when they become due and payable.
This declaration is made in accordance with a resolution of the Board of Directors and is signed on behalf of the Directors by:
Dated this 26th of November 2014 .
Ken McNamara, Chair of Board of Directors and Finance & Governance Committee.
MAPS GROUP LIMITED DECLARATION BY DIRECTORS Financial Statements Year Ended 30th September 2014
Silke Therhaag, Co-ordinator Procurement and Contracts, Moonee Valley City Council:
Strong relationship continues with SSROC with new tender and contract granted:
‘Procurement Australia selected to deliver Hire of Heavy Plant (Wet Hire) Tender and Contract for Southern Sydney Regional Organisation of Councils (SSROC) following on success with SSROC electricity contract, proving Procurement Australia’s effective tender process delivers benefits.’
‘Procurement Australia has been and continues to be a professional partner to support us with outstanding procurement results. Procurement Australia stands for a reliable source of excellence in tendering and evaluation services, connecting suppliers with Councils, and ultimately supporting us to achieve best value for our ratepayers. Procurement Australia’s business development excels expectations.’
25

PRINCIPLED REGISTERED OFFICE
LOCATION OF SHARE REGISTER
Maps Group Limited – Trading as Procurement Australia.447 Auburn Road, Hawthorn East, Victoria 3123.Call 03 9810 8600 Visit procurementaustralia.com.au
Maps Group Limited – Trading as Procurement Australia. 447 Auburn Road, Hawthorn East, Victoria 3123.
COMPANY VALUES
26