(company’s full name) (company’s address) (telephone · pdf file(company’s...
TRANSCRIPT
Phil SEC 17Q 3Q 2005 1
SEC Number 1177 File Number ____
GLOBE TELECOM, INC. (Company’s Full Name)
5th Floor Globe Telecom Plaza (Pioneer Highlands) Pioneer corner Madison Streets, 1552 Mandaluyong City
(Company’s Address)
(632) 730-2000 (Telephone Numbers)
30 September 2005 (Quarter Ending)
SEC FORM 17-Q (Form Type)
Phil SEC 17Q 3Q 2005 2
SECURITIES AND EXCHANGE COMMISSION
SEC FORM 17-Q
QUARTERLY REPORT PURSUANT TO SECTION 17 OF THE SECURITIES REGULATION CODE AND SRC RULE 17(2)(b) THEREUNDER
1. For the quarterly period ended 30 September 2005 2. Commission identification number: 1177 3. BIR Tax Identification No. 000-768-480-000 4. Exact name of registrant as specified in its charter: GLOBE TELECOM, INC. 5. Province, country or other jurisdiction of incorporation or organization: PHILIPPINES 7. Address of registrant’s principal office: 5th Floor, Globe Telecom Plaza (Pioneer Highlands) Pioneer corner Madison Streets 1552 Mandaluyong City 8. Registrant’s telephone number, including area code: (632) 730-2000 10. Securities registered pursuant to Sections in Securities Regulation Code Number of shares of stock Title of each class outstanding Common Stock, P50.00 par value 131,899,148 Preferred Stock, P5.00 par value 158,515,021 11. Are any or all of the Securities listed on the Philippine Stock Exchange? Yes 12. Indicate whether the registrant:
a) Has filed all reports required to be filed by Section 17 of the Code and SRC Rule 17 thereunder or Sections 11 of the SRC and SRC Rule 11(a)-1 thereunder, and Sections 26 and 141 of the Corporation Code of the Philippines, during the preceding 12 months (or for such shorter period the registrant was required to file such reports). Yes
b) Has been subject to such filing requirements for the past 90 days. Yes PART I -- FINANCIAL INFORMATION Item 1. Financial Statements. Please refer to Annex A.

MANAGEMENT’S DISCUSSION AND ANALYSIS OF FINANCIAL CONDITION AND RESULTS OF OPERATIONS
As of and for the period ended 30 September
Financial and Operational Highlights (In Million Pesos unless otherwise stated) Globe Consolidated As of and for the nine months ended 30 September (Unaudited) 2005 2004 YoY change (%)
(As restated) 1 Profit & Loss Data Net Operating Revenues ………………………………………………… 43,367 41,280 5%
Service Revenues …………………………………………………… 40,268 39,094 3%
Non-Service Revenues 2 ……………………………………………. 3,099 2,186 42% Costs and Expenses ……………………………………………………. 34,669 31,539 10% Cost of Sales………………………………………………………… 5,034 4,964 1% Operating Expenses 3…………………………………………………. 15,177 11,539 32% Depreciation and Amortization……………………………………… 11,586 10,733 8% Financing…………………………………………………………….. 3,146 4,652 -32% Others - net………………………………………………………… (274) (349) 21% EBITDA4 ………………………………………………………………. 23,156 24,777 -7% EBIT5 …………………………………………………………………… 11,570 14,043 -18% Net Income ………………………………………….…………………. 6,440 8,997 -28% Balance Sheet Data Total Assets ……………………………………………………………. 124,749 127,244 -2% Total Debt ……………………………………………………………… 52,909 52,075 2% Total Stockholders’ Equity ……………………………………………. 47,742 52,080 -8% Financial Ratios (x) Total Debt to EBITDA …………………………………………………. 1.71 1.58 Interest Cover (Gross) ………………………………………………. …. 6.40 7.43 Debt to Equity (Gross) …………………………………………………. 1.11 1.00 Debt to Equity (Net) 6…………………………………………………… 0.90 0.76 Total Debt to Total Capitalization (Book) ……………………………… 0.53 0.50 Total Debt to Total Capitalization (Market) ...…………………………. 0.35 0.25 Other Data Net Cash from Operating Activities ……………………………………. 20,388 19,659 4% Capital Expenditures 7…………………………………………………… 12,095 16,025 -25% Net Receivable Days ……………………………………………………. 54 49 10% Peso/Dollar Exchange Rate (In pesos) ………………………………….. 55.977 56.276 -1% No. of Regular Employees ………………………………………………. 5,071 4,746 7%
_____________________________________________________________ 1 Prior period figures have been restated due to the adoption of various Philippine Accounting Standards (PAS) and Philippine Financial Reporting
Standards (PFRS) on 1 January 2005. (See related discussion in the attached financial statements)
2 Non-Service Revenues include proceeds from sale of handsets, phonekits, accessories, upfront fees/activation fees representing the excess of the selling price of SIM packs over the preloaded airtime. The costs related to the sale of handsets, phonekits, and accessories are shown under Cost of Sales. The difference between non-service revenues and cost of sales is referred to as Subsidy.
3 Operating expenses, among others, include provisions (reversals of provisions) for doubtful accounts, Inventory losses, obsolescence and market decline and losses on property and equipment and other probable losses.
4 EBITDA is defined as earnings before interest, taxes, depreciation, Amortization and other income/expense. EBITDA is calculated by deducting Cost of Sales and Operating Expenses from net operating revenues.
5 EBIT is defined as earnings before interest, other expenses and income taxes. EBIT is calculated by deducting depreciation and amortization from EBITDA.
6 Net debt is calculated by subtracting cash, cash equivalents and short term investments from total debt.
7 Consolidated capital expenditures include property and equipment, acquired as of report date regardless of whether payment has been made or not, but excludes capitalized costs during the period. (See related discussion in Liquidity and Capital Resources Section)
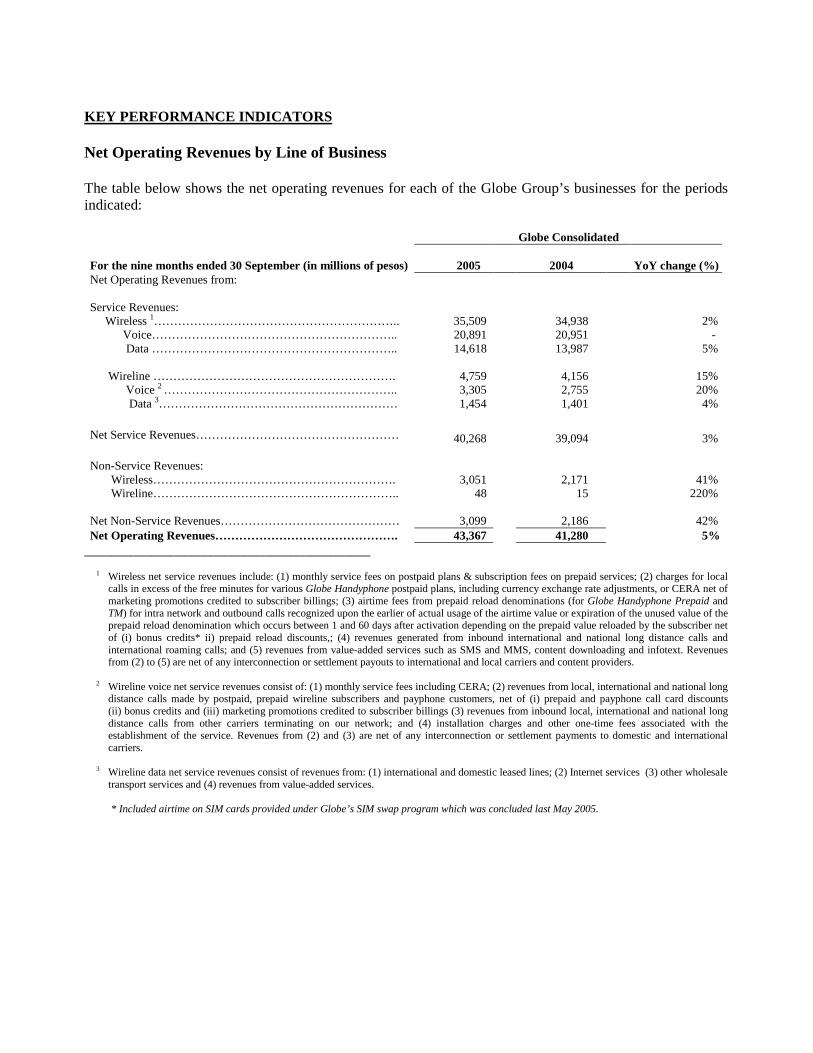
KEY PERFORMANCE INDICATORS Net Operating Revenues by Line of Business The table below shows the net operating revenues for each of the Globe Group’s businesses for the periods indicated: Globe Consolidated For the nine months ended 30 September (in millions of pesos) 2005 2004 YoY change (%) Net Operating Revenues from: Service Revenues: Wireless 1…………………………………………………….. 35,509 34,938 2% Voice…………………………………………………….. 20,891 20,951 - Data …………………………………………………….. 14,618 13,987 5% Wireline ……………………………………………………. 4,759 4,156 15% Voice 2 ………………………………………………….. 3,305 2,755 20% Data 3…………………………………………………… 1,454 1,401 4% Net Service Revenues…………………………………………… 40,268 39,094 3% Non-Service Revenues: Wireless……………………………………………………. 3,051 2,171 41% Wireline…………………………………………………….. 48 15 220% Net Non-Service Revenues……………………………………… 3,099 2,186 42% Net Operating Revenues………………………………………. 43,367 41,280 5%
___________________________________________ 1 Wireless net service revenues include: (1) monthly service fees on postpaid plans & subscription fees on prepaid services; (2) charges for local
calls in excess of the free minutes for various Globe Handyphone postpaid plans, including currency exchange rate adjustments, or CERA net of marketing promotions credited to subscriber billings; (3) airtime fees from prepaid reload denominations (for Globe Handyphone Prepaid and TM) for intra network and outbound calls recognized upon the earlier of actual usage of the airtime value or expiration of the unused value of the prepaid reload denomination which occurs between 1 and 60 days after activation depending on the prepaid value reloaded by the subscriber net of (i) bonus credits* ii) prepaid reload discounts,; (4) revenues generated from inbound international and national long distance calls and international roaming calls; and (5) revenues from value-added services such as SMS and MMS, content downloading and infotext. Revenues from (2) to (5) are net of any interconnection or settlement payouts to international and local carriers and content providers.
2 Wireline voice net service revenues consist of: (1) monthly service fees including CERA; (2) revenues from local, international and national long
distance calls made by postpaid, prepaid wireline subscribers and payphone customers, net of (i) prepaid and payphone call card discounts (ii) bonus credits and (iii) marketing promotions credited to subscriber billings (3) revenues from inbound local, international and national long distance calls from other carriers terminating on our network; and (4) installation charges and other one-time fees associated with the establishment of the service. Revenues from (2) and (3) are net of any interconnection or settlement payments to domestic and international carriers.
3 Wireline data net service revenues consist of revenues from: (1) international and domestic leased lines; (2) Internet services (3) other wholesale
transport services and (4) revenues from value-added services. * Included airtime on SIM cards provided under Globe’s SIM swap program which was concluded last May 2005.

In the first nine months of 2005, the Globe Group’s (Globe Telecom, Inc., Innove Communications, Inc. and G-Xchange, Inc.) total net operating revenues improved by 5% to P43,367 million from P41,280 million for the same period in 2004 while total net service revenues increased by 3% to P40,268 million in 2005 from P39,094 million in 2004. Wireless service revenues in 2005, which accounted for 88% of net service revenues in 2005, grew by 2% year-on-year. Meanwhile, wireline service revenues added the remaining 12% to net service revenues in 2005 (from 11% for the same period in 2004). The wireline business grew its net service revenues by 15% to P4,759 million from the same period in 2004. Domestically, the Globe Group pays interconnection charges to other carriers for calls originating from its network terminating to other carriers’ networks and hauling charges for calls that pass through Globe’s network terminating in another network. Internationally, the Globe Group also incurs payouts for outbound international calls. These charges are based on a negotiated price per minute. The interconnection expenses paid as a percentage of gross service revenues for the nine months of 2004 and 2005 registered at 20%. The Globe Group also collects termination fees from local and foreign carriers whose calls terminate in Globe Group’s network. Effective 01 January 2004, as part of domestic interconnection agreements concluded in 2002, domestic calls terminating to wireless networks are charged a termination rate of P4.00 per minute (from P4.50 per minute in 2003) while calls terminating to wireline voice networks are charged a termination rate of P3.00 per minute (from P2.50 per minute in 2003). We registered non-service revenues of P3,099 million for the nine months of 2005, a 42% increase from the P2,186 million for the same period last year due mostly to higher year-on-year handset sales contributed by postpaid subscriber acquisitions. Non-service revenues are reported net of discounts on phonekits. The cost related to the sale of handsets and SIM (Subscriber Identification Module) packs are shown under cost of sales. The difference between non-service revenues and cost of sales is referred to as subsidy. Subsidy dropped by 30% in the nine months of 2005 to P1,935 million from P2,778 million for the same period in 2004 in line with the decline in gross subscriber additions following the end of the SIM swap activities last May 2005. Proceeds from the sale of prepaid cards airtime value through electronic load services such as ATM and airtime value through over-the-air (OTA) reloading are treated as deferred or unearned revenues are shown under the liabilities section of the balance sheet since the service has not yet been rendered. Revenue is realized upon actual usage of the airtime value (pre-loaded airtime value of SIM cards and subsequent top-ups) for voice, SMS, MMS, content downloading and infotext services net of free SMS, bonus credits* or the expiration of the unused value, whichever comes earlier. * Included airtime on SIM cards provided under Globe’s SIM swap program which was concluded last May 2005.
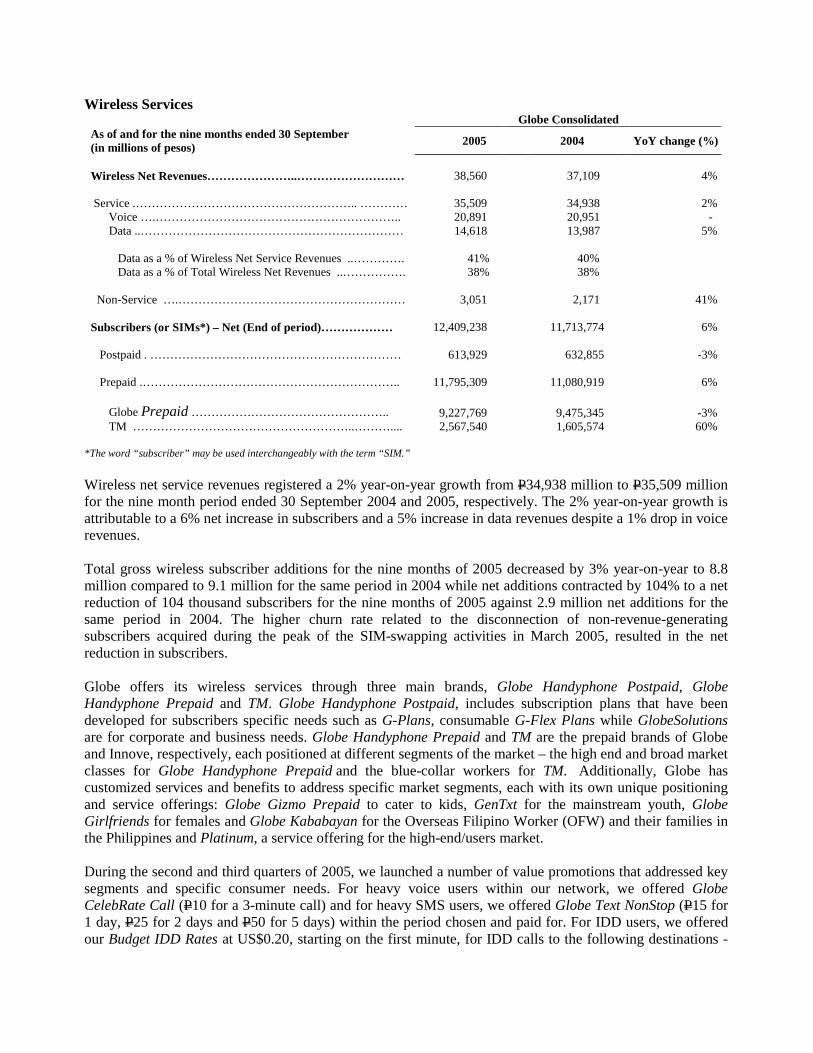
Wireless Services Globe Consolidated As of and for the nine months ended 30 September (in millions of pesos) 2005 2004 YoY change (%)
Wireless Net Revenues…………………..……………………… 38,560 37,109 4% Service .……………………………………………….. ………… 35,509 34,938 2% Voice ….…………………………………………………….. 20,891 20,951 - Data ..………………………………………………………… 14,618 13,987 5% Data as a % of Wireless Net Service Revenues ..…………. 41% 40% Data as a % of Total Wireless Net Revenues ..……………. 38% 38% Non-Service ….………………………………………………… 3,051 2,171 41% Subscribers (or SIMs*) – Net (End of period)……………… 12,409,238 11,713,774 6% Postpaid . ……………………………………………………… 613,929 632,855 -3% Prepaid .……………………………………………………….. 11,795,309 11,080,919 6% Globe Prepaid ………………………………………….. 9,227,769 9,475,345 -3% TM ………………………………………………..……….... 2,567,540 1,605,574 60%
*The word “subscriber” may be used interchangeably with the term “SIM.”
Wireless net service revenues registered a 2% year-on-year growth from P34,938 million to P35,509 million for the nine month period ended 30 September 2004 and 2005, respectively. The 2% year-on-year growth is attributable to a 6% net increase in subscribers and a 5% increase in data revenues despite a 1% drop in voice revenues. Total gross wireless subscriber additions for the nine months of 2005 decreased by 3% year-on-year to 8.8 million compared to 9.1 million for the same period in 2004 while net additions contracted by 104% to a net reduction of 104 thousand subscribers for the nine months of 2005 against 2.9 million net additions for the same period in 2004. The higher churn rate related to the disconnection of non-revenue-generating subscribers acquired during the peak of the SIM-swapping activities in March 2005, resulted in the net reduction in subscribers. Globe offers its wireless services through three main brands, Globe Handyphone Postpaid, Globe Handyphone Prepaid and TM. Globe Handyphone Postpaid, includes subscription plans that have been developed for subscribers specific needs such as G-Plans, consumable G-Flex Plans while GlobeSolutions are for corporate and business needs. Globe Handyphone Prepaid and TM are the prepaid brands of Globe and Innove, respectively, each positioned at different segments of the market – the high end and broad market classes for Globe Handyphone Prepaid and the blue-collar workers for TM. Additionally, Globe has customized services and benefits to address specific market segments, each with its own unique positioning and service offerings: Globe Gizmo Prepaid to cater to kids, GenTxt for the mainstream youth, Globe Girlfriends for females and Globe Kababayan for the Overseas Filipino Worker (OFW) and their families in the Philippines and Platinum, a service offering for the high-end/users market. During the second and third quarters of 2005, we launched a number of value promotions that addressed key segments and specific consumer needs. For heavy voice users within our network, we offered Globe CelebRate Call (P10 for a 3-minute call) and for heavy SMS users, we offered Globe Text NonStop (P15 for 1 day, P25 for 2 days and P50 for 5 days) within the period chosen and paid for. For IDD users, we offered our Budget IDD Rates at US$0.20, starting on the first minute, for IDD calls to the following destinations -
US, Canada, China, Malaysia, Hong Kong, Singapore, Thailand, South Korea, Taiwan and Australia. Additionally, our TM brand continued its Todo Tawag 15/15 promotion (P15 for a 15 minute call) for heavy voice users and the Todo Text promotion (P10 unlimited text usage for 1 day) for SMS-heavy users. The following sections discuss the various key performance indicators of the wireless business on a per-brand basis, such as subscriber figures, gross and net ARPU (Average Revenue Per Unit), SAC (Subscriber Acquisition Costs) and churn, among others. Wireless Services - Postpaid Globe offers postpaid services through its brand Globe Handyphone. Globe’s postpaid subscriber base registered at 613,929 as of 30 September 2005, 3% lower compared to 632,855 posted in the same period last year as more than half of total terminations were company-initiated mostly on credit issues. Gross additions for the first nine months of 2005 registered at 163,795 subscribers, higher by 41% than the 116,234 generated for the same period in 2004 due mainly to subscriber acquisition campaigns and promotions. The average monthly churn rate for Globe’s postpaid subscribers is defined as total disconnections net of reconnections divided by the average postpaid subscribers, divided by the number of months in the period. Globe’s postpaid churn rate averaged 3.2% per month for the nine months of 2005 compared to 2.8% for the same period in 2004 while quarter-on-quarter, it went up to 4.4% in the third quarter from 3.2% in the second quarter of 2005. For postpaid subscribers, permanent disconnections are made after a series of collection steps following non-payment. Such permanent disconnections generally occur within a predetermined number of days from statement date. Net postpaid reductions of 16,566 for the nine months of 2005 improved compared to the 52,171 net disconnections in the same period in 2004. Globe’s postpaid ARPU on a gross basis averaged P=2,187 for the nine months of 2005 from P=2,169 in the same period in 2004. On a quarterly basis, third quarter postpaid gross ARPU improved by 2% to P2,199 from P2,159 in the second quarter on account of fewer subscribers but higher voice traffic. Gross ARPU is computed by dividing recurring wireless postpaid gross service revenues for the period by the average number of postpaid wireless subscribers and then dividing the quotient by the number of months in the period. Net ARPU per Globe postpaid wireless subscriber for the nine months of 2005 registered at P=1,589, a 3% decline from P=1,641 for the same period in 2004 due to both lower voice and data usage for the period. Quarter-on-quarter, Globe postpaid net ARPU reached P1,588 for the third quarter from P1,550 in the second quarter. Net ARPU is computed by dividing recurring wireless postpaid net operating service revenues for the period (net of interconnection charges to external carriers and discounts) by the average number of postpaid wireless subscribers and then dividing the quotient by the number of months in the period. Globe’s postpaid SAC of P=7,490 for the nine months of 2005 is 28% lower than the P=10,462 registered for the same period last year as we lowered both handset subsidies and advertising costs. On a quarterly basis, postpaid SAC for the third quarter only reached P5,462 compared to P9,068 for the second quarter also due to lower handset subsidies and advertising costs. For the first nine months of 2005, handset and SIM subsidies accounted for 87% of acquisition cost while advertising/promotional expenses totaled 13%. These compared to 96% and 13%, respectively, in the comparable period in 2004.

Wireless Services - Prepaid Consolidated prepaid subscribers grew by 6% to 11,795,309 as of 30 September 2005 from 11,080,919 for the same period in 2004. Globe offers prepaid services through its Globe Handyphone Prepaid brand, while Innove offers prepaid services through its TM brand. Globe Handyphone Prepaid and TM subscribers can reload airtime value or credits from Globe Business Centers, accredited dealers/retailers, automated teller machines and via SMS using their mobile phones. Globe AutoloadMAX, an OTA reload channel offers the most affordable and flexible load credits from P10 to P150 in P1 increments for TM subscribers and P25 to P150 in P1 increments for Globe Handyphone Prepaid subscribers. Subscribers can also purchase Globe Prepaid Call and Text cards in P100, P300 and P500 denominations while TM Call and Text cards are available in P50, P100 and P300. A consumer to consumer top up facility, Share A Load, is also available which allows Globe Handyphone Prepaid and TM subscribers to share prepaid load credits among themselves in denominations of P1 to P150 (in P1 increment). Globe Handyphone Postpaid subscribers can also Share A Load to Globe Handyphone Prepaid and TM subscribers in P300 and P500 values in addition to the P1 to P150 denominations. During the first quarter of the year, Globe also launched G-Cash Load where subscribers can use G-Cash to load one’s phone or another Globe Handyphone or TM subscriber’s phone anytime by sending an SMS instruction. G-Cash registered users can likewise convert their G-Cash to prepaid load credits in denominations of P25 to P150 in P25 increments, P300 and P500. In February 2004, Globe launched a nationwide Free SIM-Swap program that allowed subscribers of another mobile network to switch to Globe by exchanging their active SIM cards for Globe Handyphone Prepaid or TM SIMs. Prior to the third quarter of 2004, a prepaid subscriber was recognized upon the activation and use of a new SIM card. The subscriber was provided with 60 days (first expiry) to utilize the preloaded airtime value. If the subscriber did not reload prepaid credits within the first expiry period, the subscriber retained the use of the wireless number, but was entitled only to receive incoming voice calls and text messages for another 120 days (second expiry), except for the first reload of SIM-swappers that was required within only 30 days from the first expiry. However, if the subscriber did not reload prepaid credits within the second expiry period, the account would be permanently disconnected and considered part of churn. The first expiry periods of reloads vary depending on the denominations, ranging from 1 day for P10 to 60 days for P300 to P1,000 reloads. The second expiry is 120 days from the date of the first expiry. The first expiry is reset based on the longest expiry period among current and previous reloads. Under this policy, subscribers are included in the subscriber count until churned. Acknowledging the changing dynamics of the industry, Globe updated its policy in recognizing a subscriber in its total count based on the subscriber intent to use the service. Starting the third quarter of 2004, a SIM-swapper was only considered a subscriber upon making the first reload. Non-SIM swap subscribers or regular subscribers are recognized upon activation and use of a new SIM. Accordingly, subscribers not considered in the subscriber count were not considered as part of churn. The nationwide SIM-swap program was concluded last May 2005.
Globe Handyphone Prepaid Globe Handyphone Prepaid subscriber base for the nine months of 2005 declined by 3% to 9,227,769 from 9,475,345 from the same period in 2004. Gross additions for the nine months of 2005 were lower by 19% at 5,650,810 compared to 6,990,063 in 2004. Churn was also higher at 7.6% vs. 5.8%, which more than offset the gross additions for the period resulting in a net reduction of 957,385 subscribers for the nine months of 2005 compared to 2,802,332 net additions for the same period in 2004. (See related discussion below). Globe’s prepaid gross ARPU averaged P=368 for the nine months of 2005 compared to P=428 for the same period in 2004. On a quarterly basis, prepaid gross ARPU improved to P351 in the third quarter of 2005 from P340 during the second quarter on account of a lower subscriber base and slightly higher voice traffic. Gross ARPU is computed by dividing recurring wireless prepaid gross service revenues for the period by the average number of prepaid wireless subscribers and then dividing the quotient by the number of months in the period.
The net ARPU for Globe Handyphone Prepaid registered a year-on-year decrease of 17% to P=259 for the first nine months of 2005 from P=311 for the same period in 2004. On a quarterly basis, net ARPU was P255 in the third quarter compared to P232 in the second quarter. Net ARPU is computed by dividing recurring wireless prepaid net operating service revenues for the period (net of discounts and interconnection charges to external carriers) by the average number of prepaid wireless subscribers and then dividing the quotient by the number of months in the period. The average monthly churn rate for Globe Handyphone Prepaid subscribers registered at 7.6% for the first nine months of 2005, higher than the 5.8% posted for the nine months of 2004. The higher churn for the year was due to the termination of non-revenue subscribers. Non-revenue subscribers for Globe Handyphone Prepaid relates to subscribers acquired during SIM-swapping activities that were subsequently churned out after their second expiry. In addition, there were also non-revenue subscribers related to “trade scooping,” where large volumes of SIMs are purchased in order to take advantage of SIM-swap activities in the market. During the third quarter, 50% of Globe Handyphone Prepaid churn was contributed by the expiry of these non-revenue SIMs, 32% of which came from disconnections related to previous SIM-swap offers while the remaining 68% came from trade scooping activities. Another 4% was related to the immediate disconnection of ISR SIMs captured in our fraud monitoring system. As such, only 46% of the total churn for the quarter related to “normal churn.” Normal monthly churn rate for Globe Handyphone Prepaid was at 3.8%. The high churn rate is expected to continue until the end of the year as the non-revenue SIMs are disconnected after the lapse of their second expiry period, consistent with the Company’s churn policy. Despite continuous efforts to keep these SIMs in the network and encouraging them to reload, we estimate that another one million non-revenue SIMs may be disconnected from our network through the rest of the year. SAC for Globe Handyphone Prepaid remained at almost the same level of P=260 for the first nine months of 2005 from P=259 for the same period in 2004. Handset and SIM subsidies accounted for 41% (63% in 2004) of SAC while discounts and advertising costs comprised the balance of 59% (37% in 2004). Quarter-on-quarter, SAC increased to P301 in the third quarter from P285 in the second quarter due to higher commissions and subsidies from sales of discounted phonekits.
TM We relaunched TM in the first quarter of 2005 and as of 30 September 2005, TM contributed 21% to the total wireless subscriber base of the Globe group compared to 14% for the same period in 2004. Innove’s TM subscribers increased by 60% to 2,567,540 subscribers as of 30 September 2005 compared to 1,605,574 subscribers for the same period last year. Gross additions, for the first nine months of 2005, increased by 54% to 3,029,345 from 1,972,644 for the same period in 2004. These accounted for 34% of total wireless gross additions for the year versus a 22% contribution the previous year. Net additions were almost eight times higher, from 103,730 for the first nine months of 2004 to 869,216 for the same period this year. The improved subscriber net additions resulted mainly from the relaunch of the TM brand and the success of its acquisition and usage campaigns. The average monthly churn rate for TM registered at 11.3% for the first nine months of 2005 against 13.4% for the same period last year. TM’s churn in 2005 was affected by Globe-initiated terminations of TM SIMs found engaging in International Simple Resale (ISR) activities which are illegal in the Philippines. During the first nine months of 2005, terminations due to ISR activities accounted for 30% of total year-to-date churn. Excluding terminations due to ISR activities, the average monthly churn rate for the nine months of 2005 would be 7.9%. Because of early detection of this illegal usage and the immediate SIM disconnection, the impact to the Company’s financial performance was minimized. (See related discussion on ISR on pages 12 and 13) Year-on-year gross ARPU was likewise higher at P=346 for the nine months of 2005 compared to P=280 for the same period in 2004. On a quarterly basis, gross ARPU registered at P281 in the third quarter from P366 in the second quarter on account of the successful availment of the brand’s Todo Text and Todo Tawag promotions which lowered ARPU because of the lower bulk pricing rate but increased traffic significantly. In addition, the objective of increasing blue-collar worker consumer segment penetration was achieved as evidenced by the strong subscriber take-up. The net ARPU for TM for the nine months of 2005 was P=211 or 17% higher than the P=181 registered for the same period in 2004 driven largely by the increase in usage after the relaunch of the brand early this year. On a quarterly basis, net TM ARPU was P182 in the third quarter compared to P221 in the second quarter due to the temporary removal of P10 to P19 Autoload Max denominations while technical upgrades in the billing system were being undertaken. SAC per TM subscriber decreased by 36% year-on-year to P=101 for the nine months of 2005 compared to P=158 for the same period last year due to a reduction in SIM subsidies. Quarter-on-quarter, SAC per TM subscriber totalled P144 for the third quarter from P86 during the second quarter as a result of higher advertising costs during the period. Of the total acquisition cost for the nine months of 2005, handset and SIM subsidies accounted for 40% (80% in 2004), while discounts and advertising costs made up the balance of 60% (20% in 2004). G-Cash As of 30 September 2005, there were over 1,000,000 registered users of G-Cash generating more than P3 million in total daily transactions. These users can now use G-Cash to buy merchandise from 239 partner establishments with over 4,000 outlets nationwide including more than 200 international partner outlets in 15 countries.
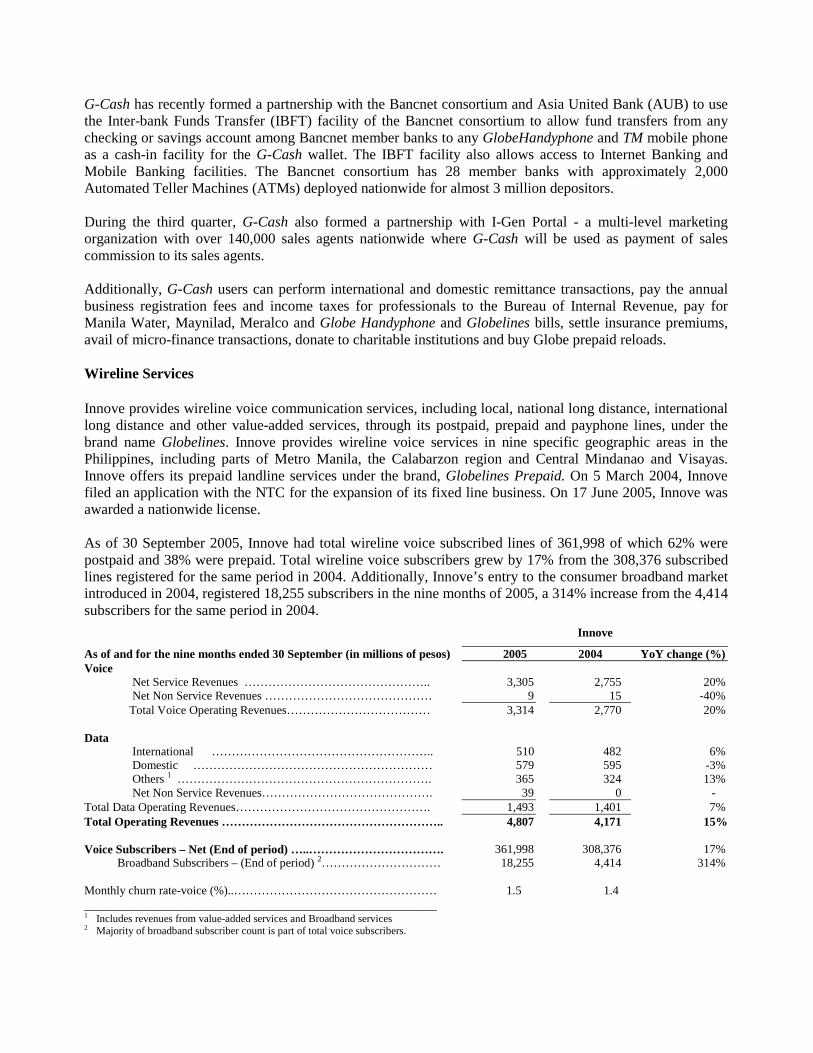
G-Cash has recently formed a partnership with the Bancnet consortium and Asia United Bank (AUB) to use the Inter-bank Funds Transfer (IBFT) facility of the Bancnet consortium to allow fund transfers from any checking or savings account among Bancnet member banks to any GlobeHandyphone and TM mobile phone as a cash-in facility for the G-Cash wallet. The IBFT facility also allows access to Internet Banking and Mobile Banking facilities. The Bancnet consortium has 28 member banks with approximately 2,000 Automated Teller Machines (ATMs) deployed nationwide for almost 3 million depositors. During the third quarter, G-Cash also formed a partnership with I-Gen Portal - a multi-level marketing organization with over 140,000 sales agents nationwide where G-Cash will be used as payment of sales commission to its sales agents. Additionally, G-Cash users can perform international and domestic remittance transactions, pay the annual business registration fees and income taxes for professionals to the Bureau of Internal Revenue, pay for Manila Water, Maynilad, Meralco and Globe Handyphone and Globelines bills, settle insurance premiums, avail of micro-finance transactions, donate to charitable institutions and buy Globe prepaid reloads. Wireline Services Innove provides wireline voice communication services, including local, national long distance, international long distance and other value-added services, through its postpaid, prepaid and payphone lines, under the brand name Globelines. Innove provides wireline voice services in nine specific geographic areas in the Philippines, including parts of Metro Manila, the Calabarzon region and Central Mindanao and Visayas. Innove offers its prepaid landline services under the brand, Globelines Prepaid. On 5 March 2004, Innove filed an application with the NTC for the expansion of its fixed line business. On 17 June 2005, Innove was awarded a nationwide license. As of 30 September 2005, Innove had total wireline voice subscribed lines of 361,998 of which 62% were postpaid and 38% were prepaid. Total wireline voice subscribers grew by 17% from the 308,376 subscribed lines registered for the same period in 2004. Additionally, Innove’s entry to the consumer broadband market introduced in 2004, registered 18,255 subscribers in the nine months of 2005, a 314% increase from the 4,414 subscribers for the same period in 2004. Innove
As of and for the nine months ended 30 September (in millions of pesos) 2005 2004 YoY change (%) Voice Net Service Revenues ……………………………………….. 3,305 2,755 20% Net Non Service Revenues …………………………………… 9 15 -40% Total Voice Operating Revenues……………………………… 3,314 2,770 20% Data International ……………………………………………….. 510 482 6% Domestic …………………………………………………… 579 595 -3% Others 1 ………………………………………………………. 365 324 13% Net Non Service Revenues……………………………………. 39 0 - Total Data Operating Revenues…………………………………………. 1,493 1,401 7% Total Operating Revenues ……………………………………………….. 4,807 4,171 15% Voice Subscribers – Net (End of period) …..……………………………. 361,998 308,376 17% Broadband Subscribers – (End of period) 2………………………… 18,255 4,414 314% Monthly churn rate-voice (%)..…………………………………………… 1.5 1.4 _____________________________________________________ 1 Includes revenues from value-added services and Broadband services 2 Majority of broadband subscriber count is part of total voice subscribers.

Innove’s gross wireline voice ARPU averaged P=1,226 for the nine months of 2005 compared to P=1,269 for the same period in 2004. Gross ARPU is computed by dividing recurring wireline voice gross service revenues for the period by the average number of wireline voice subscribers and then dividing the quotient by the number of months in the period. Innove’s net wireline voice ARPU for the nine months of 2005 declined by 2% to P1,080 from P1,104 for the same period in 2004. Net ARPU is computed by dividing recurring wireline voice net operating service revenues for all service areas for the period (net of discounts and interconnection charges to external carriers) by the average number of wireline voice subscribers and then dividing the quotient by the number of months in the period. The average monthly churn rate for Globelines was 1.5% for the nine months of 2005 compared to 1.4% for the same period in 2004. Innove’s GlobeQuest brand offers wireline data services, including international and domestic lease lines, internet, data center support services and wholesale transport services. Businesses and individuals can subscribe to GlobeQuest’s Private Networks for their international and domestic lease line requirements. Internet users can apply for Broadband Internet or Broadband Access for commercial turnkey internet business solutions to access Innove’s advanced broadband network infrastructure or high-speed fiber optic network. Additionally, GlobeQuest DataCenters provide businesses with advanced infrastructure and technology to support data hosting applications. Wireline data net operating revenues, which principally consist of billings for these services increased by 7% to P=1,493 million for the nine months of 2005 from P=1,401 million for the same period in 2004. The higher growth was mainly due to higher broadband revenues as broadband subscribers increased by 314% from 2004. International Long Distance (ILD) Services Globe and Innove both offer ILD services. ILD services are offered between the Philippines and over 200 countries. This service generates revenues from both inbound and outbound international call traffic with pricing based on agreed international termination rates for inbound traffic revenues and NTC-approved ILD rates for outbound traffic revenues. Globe Consolidated For the nine months ended 30 September 2005 2004 YoY change (%) Total ILD Minutes (in million minutes) 1…………………………. 1,046 952 10% Inbound………………………………………………………… 887 809 10% Outbound.……………………………………………………… 159 143 11% ILD Inbound / Outbound Ratio (x) …………………………… 5.6 5.7 ________________________________________________________________________________________________
1 ILD minutes originating from and terminating to Globe and Innove networks.
On 1 June 2005, Globe started its CelebRate IDD promo for its postpaid subscribers that offered US$0.20 for IDD calls after the first 4 minutes aimed at heavy IDD users. The first 4 minutes were charged at the prevailing rate of US$0.40 per minute for selected destinations. This promotion ended on 27 September 2005. On 28 September 2005, Globe Budget IDD promotion was launched to all wireless subscribers with a flat rate of US$0.20 per minute, starting on the first minute, for IDD calls to the US, Canada, China, Malaysia, Hong Kong, Singapore, Thailand, South Korea, Taiwan and Australia. The promo ended last 27 October 2005 but was extended until 26 November 2005. On 14 September 2005, Globelines launched its Lowest IDD rates promotion for its Globelines subscribers, Globe1 card users and Globelines Broadband subscribers. Globelines postpaid subscribers were charged US$0.20 per minute for IDD calls to selected
countries while Globe1 card users could make IDD calls for US$0.10 per minute from Globelines postpaid and prepaid lines including payphones nationwide. Additionally, Globelines Broadband subscribers could make Voice Over Internet Protocol (VOIP) calls for only US$0.05 per minute to 51 international destinations. Year–on-year, total ILD volumes increased by 10% in 2005. On a consolidated basis, ILD revenues, from the Wireless and Wireline services, increased by 3% to P=9,856 million for the first nine months of 2005, translating to 25% consolidated net service revenues for this period (compared to P=9,537 million and 24% respectively, for the same period in 2004). Inbound ILD volume and correspondingly, ILD revenues have been affected by ISR operations. An ISR operation is a method of terminating inbound international calls without passing through the normal IGF. ISR operations involve routing inbound international calls through private leased lines or IP data lines, and then terminated to the called party through a local cellular or fixed line number. As the ISR operators terminate an inbound IDD call as a local call, they are able to offer lower rates to foreign carriers than current termination rates. As a result, Globe is not able to realize the full inbound international revenue and instead earns only from charges from local or national calls or access charges from other carriers and normal domestic termination charges for local or NDD calls which are lower than international termination rates. To reduce ISR activities, Globe initiated increased detection and blocking procedures including closer coordination of detected ISR lines with other industry players. The Company also implemented arrangements with international carriers to reduce arbitrage opportunities for ISR operators. The Company further tightened its fraud and risk evaluation process for corporate and individual accounts and is implementing legal, commercial and technical solutions to the ISR concern such as the immediate termination of SIMs detected as being used for ISR operations including the suspension of AutoLoad Max retailers identified as having significant loading transactions to ISR SIMs. The Company has also coordinated with the NTC and other government agencies in addressing this concern. Because of these ongoing efforts, ISR losses have significantly decreased compared to last year. Results of Operations Globe Consolidated
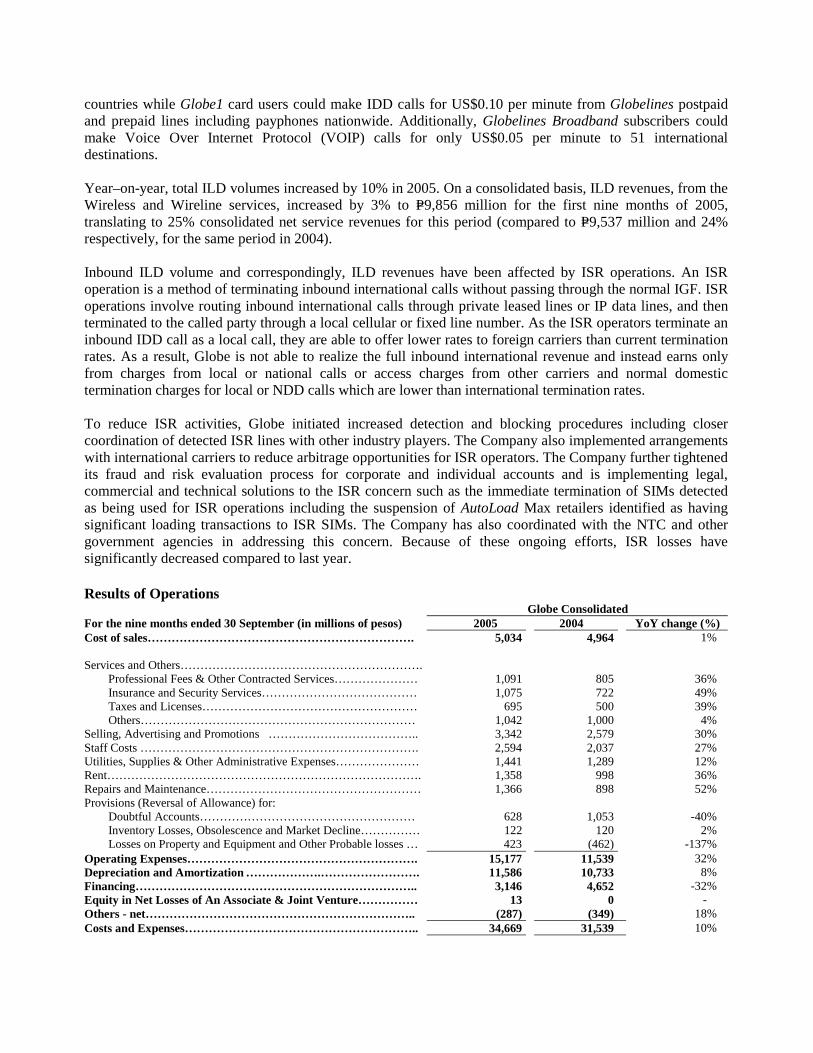
For the nine months ended 30 September (in millions of pesos) 2005 2004 YoY change (%) Cost of sales…………………………………………………………. 5,034 4,964 1% Services and Others……………………………………………………. Professional Fees & Other Contracted Services………………… 1,091 805 36% Insurance and Security Services………………………………… 1,075 722 49% Taxes and Licenses……………………………………………… 695 500 39% Others…………………………………………………………… 1,042 1,000 4% Selling, Advertising and Promotions ……………………………….. 3,342 2,579 30% Staff Costs ……………………………………………………………. 2,594 2,037 27% Utilities, Supplies & Other Administrative Expenses………………… 1,441 1,289 12% Rent……………………………………………………………………. 1,358 998 36% Repairs and Maintenance……………………………………………… 1,366 898 52% Provisions (Reversal of Allowance) for: Doubtful Accounts……………………………………………… 628 1,053 -40% Inventory Losses, Obsolescence and Market Decline…………… 122 120 2% Losses on Property and Equipment and Other Probable losses … 423 (462) -137% Operating Expenses…………………………………………………. 15,177 11,539 32% Depreciation and Amortization ……………….……………………. 11,586 10,733 8% Financing…………………………………………………………….. 3,146 4,652 -32% Equity in Net Losses of An Associate & Joint Venture…………… 13 0 - Others - net………………………………………………………….. (287) (349) 18% Costs and Expenses………………………………………………….. 34,669 31,539 10%
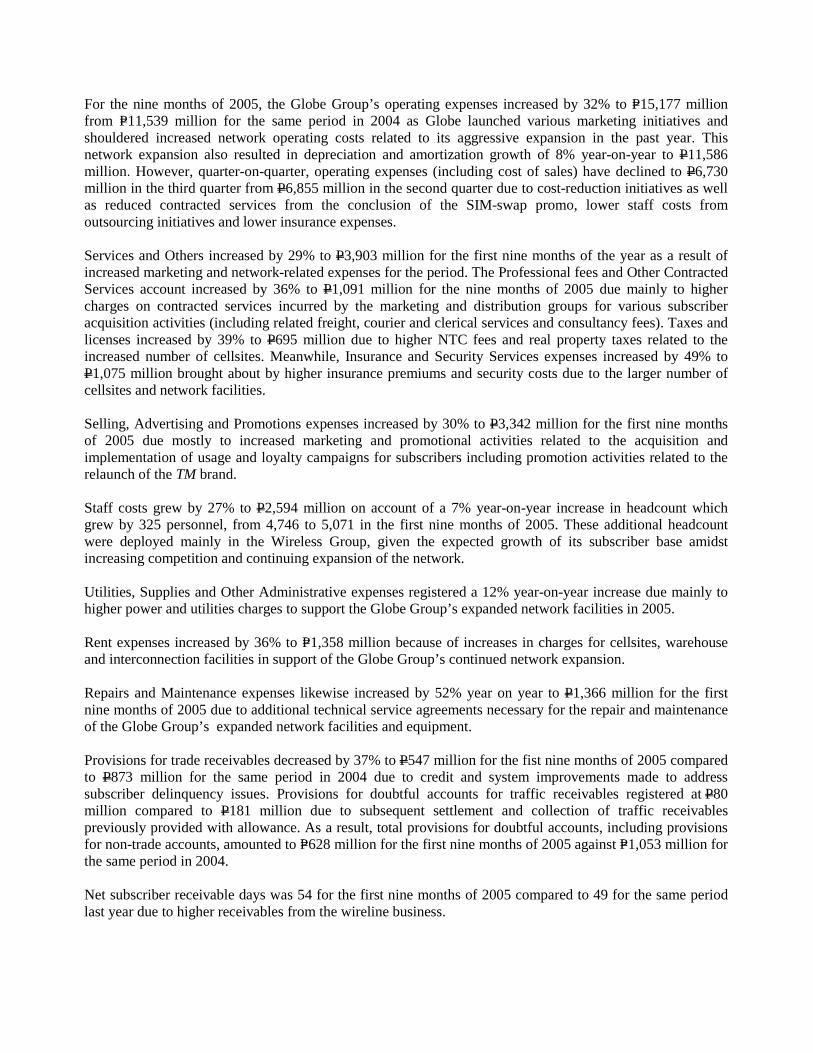
For the nine months of 2005, the Globe Group’s operating expenses increased by 32% to P=15,177 million from P=11,539 million for the same period in 2004 as Globe launched various marketing initiatives and shouldered increased network operating costs related to its aggressive expansion in the past year. This network expansion also resulted in depreciation and amortization growth of 8% year-on-year to P11,586 million. However, quarter-on-quarter, operating expenses (including cost of sales) have declined to P6,730 million in the third quarter from P6,855 million in the second quarter due to cost-reduction initiatives as well as reduced contracted services from the conclusion of the SIM-swap promo, lower staff costs from outsourcing initiatives and lower insurance expenses. Services and Others increased by 29% to P3,903 million for the first nine months of the year as a result of increased marketing and network-related expenses for the period. The Professional fees and Other Contracted Services account increased by 36% to P1,091 million for the nine months of 2005 due mainly to higher charges on contracted services incurred by the marketing and distribution groups for various subscriber acquisition activities (including related freight, courier and clerical services and consultancy fees). Taxes and licenses increased by 39% to P695 million due to higher NTC fees and real property taxes related to the increased number of cellsites. Meanwhile, Insurance and Security Services expenses increased by 49% to P1,075 million brought about by higher insurance premiums and security costs due to the larger number of cellsites and network facilities. Selling, Advertising and Promotions expenses increased by 30% to P3,342 million for the first nine months of 2005 due mostly to increased marketing and promotional activities related to the acquisition and implementation of usage and loyalty campaigns for subscribers including promotion activities related to the relaunch of the TM brand. Staff costs grew by 27% to P2,594 million on account of a 7% year-on-year increase in headcount which grew by 325 personnel, from 4,746 to 5,071 in the first nine months of 2005. These additional headcount were deployed mainly in the Wireless Group, given the expected growth of its subscriber base amidst increasing competition and continuing expansion of the network. Utilities, Supplies and Other Administrative expenses registered a 12% year-on-year increase due mainly to higher power and utilities charges to support the Globe Group’s expanded network facilities in 2005. Rent expenses increased by 36% to P=1,358 million because of increases in charges for cellsites, warehouse and interconnection facilities in support of the Globe Group’s continued network expansion. Repairs and Maintenance expenses likewise increased by 52% year on year to P1,366 million for the first nine months of 2005 due to additional technical service agreements necessary for the repair and maintenance of the Globe Group’s expanded network facilities and equipment. Provisions for trade receivables decreased by 37% to P547 million for the fist nine months of 2005 compared to P873 million for the same period in 2004 due to credit and system improvements made to address subscriber delinquency issues. Provisions for doubtful accounts for traffic receivables registered at P80 million compared to P181 million due to subsequent settlement and collection of traffic receivables previously provided with allowance. As a result, total provisions for doubtful accounts, including provisions for non-trade accounts, amounted to P=628 million for the first nine months of 2005 against P=1,053 million for the same period in 2004. Net subscriber receivable days was 54 for the first nine months of 2005 compared to 49 for the same period last year due to higher receivables from the wireline business.
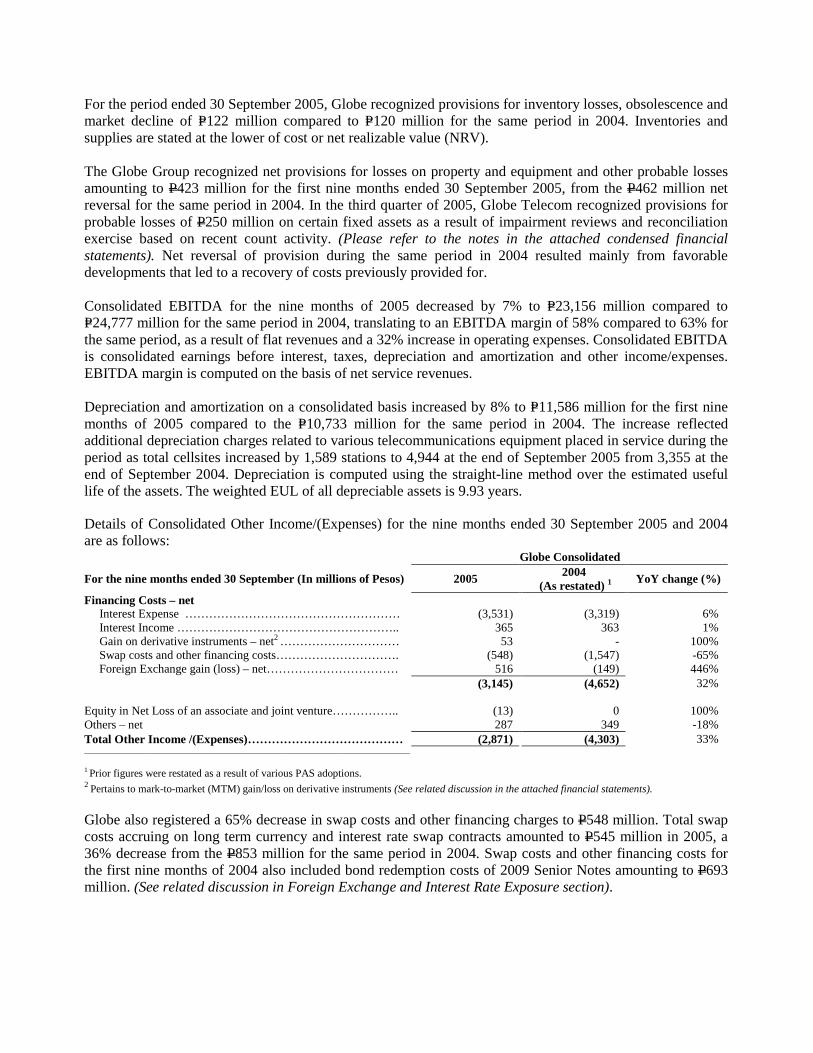
For the period ended 30 September 2005, Globe recognized provisions for inventory losses, obsolescence and market decline of P=122 million compared to P=120 million for the same period in 2004. Inventories and supplies are stated at the lower of cost or net realizable value (NRV). The Globe Group recognized net provisions for losses on property and equipment and other probable losses amounting to P423 million for the first nine months ended 30 September 2005, from the P462 million net reversal for the same period in 2004. In the third quarter of 2005, Globe Telecom recognized provisions for probable losses of P250 million on certain fixed assets as a result of impairment reviews and reconciliation exercise based on recent count activity. (Please refer to the notes in the attached condensed financial statements). Net reversal of provision during the same period in 2004 resulted mainly from favorable developments that led to a recovery of costs previously provided for. Consolidated EBITDA for the nine months of 2005 decreased by 7% to P=23,156 million compared to P=24,777 million for the same period in 2004, translating to an EBITDA margin of 58% compared to 63% for the same period, as a result of flat revenues and a 32% increase in operating expenses. Consolidated EBITDA is consolidated earnings before interest, taxes, depreciation and amortization and other income/expenses. EBITDA margin is computed on the basis of net service revenues. Depreciation and amortization on a consolidated basis increased by 8% to P=11,586 million for the first nine months of 2005 compared to the P=10,733 million for the same period in 2004. The increase reflected additional depreciation charges related to various telecommunications equipment placed in service during the period as total cellsites increased by 1,589 stations to 4,944 at the end of September 2005 from 3,355 at the end of September 2004. Depreciation is computed using the straight-line method over the estimated useful life of the assets. The weighted EUL of all depreciable assets is 9.93 years. Details of Consolidated Other Income/(Expenses) for the nine months ended 30 September 2005 and 2004 are as follows: Globe Consolidated
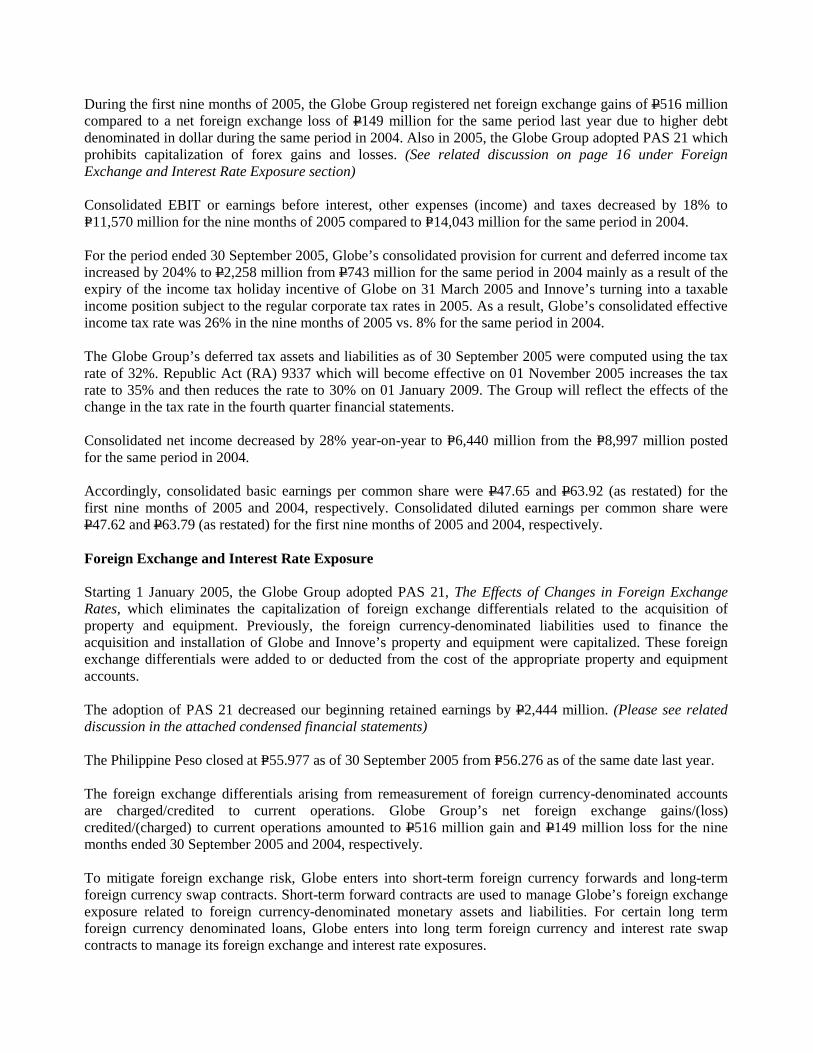
For the nine months ended 30 September (In millions of Pesos) 2005 2004 (As restated) 1 YoY change (%)
Financing Costs – net Interest Expense ……………………………………………… (3,531) (3,319) 6% Interest Income ……………………………………………….. 365 363 1% Gain on derivative instruments – net2 ………………………… 53 - 100% Swap costs and other financing costs…………………………. (548) (1,547) -65% Foreign Exchange gain (loss) – net…………………………… 516 (149) 446% (3,145) (4,652) 32% Equity in Net Loss of an associate and joint venture…………….. (13) 0 100% Others – net 287 349 -18% Total Other Income /(Expenses)………………………………… (2,871) (4,303) 33% ______________________________________________________________________
1 Prior figures were restated as a result of various PAS adoptions. 2 Pertains to mark-to-market (MTM) gain/loss on derivative instruments (See related discussion in the attached financial statements).
Globe also registered a 65% decrease in swap costs and other financing charges to P548 million. Total swap costs accruing on long term currency and interest rate swap contracts amounted to P545 million in 2005, a 36% decrease from the P853 million for the same period in 2004. Swap costs and other financing costs for the first nine months of 2004 also included bond redemption costs of 2009 Senior Notes amounting to P693 million. (See related discussion in Foreign Exchange and Interest Rate Exposure section).
During the first nine months of 2005, the Globe Group registered net foreign exchange gains of P516 million compared to a net foreign exchange loss of P149 million for the same period last year due to higher debt denominated in dollar during the same period in 2004. Also in 2005, the Globe Group adopted PAS 21 which prohibits capitalization of forex gains and losses. (See related discussion on page 16 under Foreign Exchange and Interest Rate Exposure section) Consolidated EBIT or earnings before interest, other expenses (income) and taxes decreased by 18% to P=11,570 million for the nine months of 2005 compared to P=14,043 million for the same period in 2004. For the period ended 30 September 2005, Globe’s consolidated provision for current and deferred income tax increased by 204% to P2,258 million from P743 million for the same period in 2004 mainly as a result of the expiry of the income tax holiday incentive of Globe on 31 March 2005 and Innove’s turning into a taxable income position subject to the regular corporate tax rates in 2005. As a result, Globe’s consolidated effective income tax rate was 26% in the nine months of 2005 vs. 8% for the same period in 2004. The Globe Group’s deferred tax assets and liabilities as of 30 September 2005 were computed using the tax rate of 32%. Republic Act (RA) 9337 which will become effective on 01 November 2005 increases the tax rate to 35% and then reduces the rate to 30% on 01 January 2009. The Group will reflect the effects of the change in the tax rate in the fourth quarter financial statements. Consolidated net income decreased by 28% year-on-year to P=6,440 million from the P=8,997 million posted for the same period in 2004. Accordingly, consolidated basic earnings per common share were P47.65 and P63.92 (as restated) for the first nine months of 2005 and 2004, respectively. Consolidated diluted earnings per common share were P47.62 and P63.79 (as restated) for the first nine months of 2005 and 2004, respectively. Foreign Exchange and Interest Rate Exposure Starting 1 January 2005, the Globe Group adopted PAS 21, The Effects of Changes in Foreign Exchange Rates, which eliminates the capitalization of foreign exchange differentials related to the acquisition of property and equipment. Previously, the foreign currency-denominated liabilities used to finance the acquisition and installation of Globe and Innove’s property and equipment were capitalized. These foreign exchange differentials were added to or deducted from the cost of the appropriate property and equipment accounts. The adoption of PAS 21 decreased our beginning retained earnings by P2,444 million. (Please see related discussion in the attached condensed financial statements) The Philippine Peso closed at P=55.977 as of 30 September 2005 from P=56.276 as of the same date last year. The foreign exchange differentials arising from remeasurement of foreign currency-denominated accounts are charged/credited to current operations. Globe Group’s net foreign exchange gains/(loss) credited/(charged) to current operations amounted to P516 million gain and P149 million loss for the nine months ended 30 September 2005 and 2004, respectively. To mitigate foreign exchange risk, Globe enters into short-term foreign currency forwards and long-term foreign currency swap contracts. Short-term forward contracts are used to manage Globe’s foreign exchange exposure related to foreign currency-denominated monetary assets and liabilities. For certain long term foreign currency denominated loans, Globe enters into long term foreign currency and interest rate swap contracts to manage its foreign exchange and interest rate exposures.
As of 30 September 2005, Globe had US$179 million in outstanding foreign currency swap agreements, some of which have option features. The Company also sold covered currency options with total notional amount of US$28 million with maturities ranging from March 2006 to March 2007. Globe uses interest rate swaps to manage the Company’s interest rate risk in a cost-efficient manner. As of 30 September 2005, Globe had US$56 million in notional amount of US$ swaps under which it effectively swapped some of its floating rate US$ denominated loans into fixed rate, with semi-annual payment intervals up to August 2007. The Company also has US$5 million in notional amount of US$ swaps under which it effectively swapped 9.75% fixed coupon of its 2012 Senior Notes to a floating rate based on LIBOR, subject to a cap. The performance of the swap is linked to the 10-year and 30-year US$ Constant Maturity Swap Rates. Globe also has a fixed to floating interest rate swap contract with a notional amount of P1 billion, in which it effectively swaps a fixed rate Philippine peso denominated bond into floating rate with quarterly payment intervals up to February 2009. Globe Telecom also has outstanding short term non-deliverable currency forward contracts with a total notional amount of US$3 million to fix the peso cash flows from coupon and redemption of dollar-linked peso notes. The Group also has embedded forwards and options in certain financial and non-financial contracts with total notional amount of US$51 million. Globe’s 2012 Senior Notes also contain embedded call options which give Globe the right to prepay the Notes at a certain call price per year. Gains on derivative instruments represent the net mark-to-market (MTM) gains on derivative instruments. Beginning 2005, MTM values have to be booked as required by PAS 39. The estimated unrealized mark-to-market gain on the outstanding derivatives of Globe amounted to US$18 million based on valuation as of 30 September 2005. US$1 million of the increase is reflected in the consolidated statements of income for the nine months ended 30 September 2005. (See related discussion under Results of Operations) Consolidated foreign currency-linked revenues were 28% of total net revenues for the periods ended 30 September 2005 and 2004. Foreign currency linked revenues include those that are: (1) billed in foreign currency and settled in foreign currency, or (2) billed in Pesos at rates linked to a foreign currency tariff and settled in Pesos, or (3) wireline monthly service fees and the corresponding application of the Currency Exchange Rate Adjustment or CERA mechanism, under which Globe has the ability to pass the effects of local currency depreciation to its subscribers. These revenues serve as a natural hedge to our foreign exchange exposure. Liquidity and Capital Resources Consolidated assets as of 30 September 2005 amounted to P=124,749 million compared to P=127,244 million in 30 September 2004. As of 30 September 2005, current ratio on a consolidated basis was 0.73:1 compared to 0.80:1 for the same period in 2004. Consolidated cash, cash equivalents and short term investments was at P=9,807 million at the end of the nine months of 2005, 20% lower than the P12,292 million for the same period in 2004 due to dividend payments and the buyback of shares in March 2005. For the nine months of 2005, gross debt to equity ratio was 1.11:1 on a consolidated basis and remains well within the 2:1 debt to equity limit dictated by certain debt covenants while net debt to equity ratio was 0.90:1.
The financial tests under Globe’s loan agreements include compliance with the following ratios:
• Total debt to equity not exceeding 2:1; • Total debt to EBITDA of 3:1; • Debt service coverage exceeding 1.3 times (except for refinancing of the 2009 bond which the
lenders consented to exclude from the computation); • Secured debt ratio not exceeding 0.2 times.
Consolidated net cash flow from operations amounted to P=20,388 million for the period ended 30 September 2005, a 4% increase from P=19,659 million for the same period in 2004. Globe Consolidated
As of and for the nine months ended 30 September (in millions of pesos) 2005 2004 YoY change Capital Expenditures (Cash) ………………………………. ………… 12,871 14,578 -12% Increase (Decrease) in Liabilities related to Acquisition of PPE ………. (776) 1,447 -154% Total Capital Expenditures ………………………………………….…. 12,095 16,025 -25%
Total Capital Expenditures / Service Revenues (%)………………… 30 41
Consolidated net cash used in investing activities amounted to P=13,490 million for the first nine months of 2005, an 11% increase from the P=12,145 million for the same period in 2004. Consolidated capital expenditures for the nine months of 2005 amounted to P=12,095 million. For 2005, Globe has earmarked around P17 billion for capital expenditures that were spent primarily on expanding its wireless network and enhancing the necessary transmission facilities in areas where traffic is expected to surge. The 2005 capital expenditure program is funded through internally-generated cash and debt financing. Consolidated net cash used in financing activities for the nine months of 2005 amounted to P=12,500 million, a 40% increase compared to P=8,947 million for the same period in 2004. Consolidated total debt as of 30 September 2005 amounted to P=52,909 million, a 2% increase from the P=52,075 million for the same period in 2004. Loan repayments of Globe for the nine months of 2005 amounted to P=9,250 million (US$165 million) compared to the P=17,393 million (US$311 million) paid for the same period in 2004. Globe prepaid US$41 million of its long term loans in addition to US$161 million of maturing loans. As of 30 September 2005, gross debt reached P=53 billion, 71% of which are denominated in US$. Of the 71%, 27% has been swapped to pesos. As a result, the amount of US$ debt swapped into pesos and peso-denominated debt accounts for approximately 48% of consolidated loans as of 30 September 2005. Below is the schedule of debt maturities for Globe for the years stated below based on total outstanding debt as of 30 September 2005: Year Due Principal (US$ millions) 2005 …………………………………………………………………………............................... 20 2006 ……………………………………………………………………………………………… 171 2007 ……………………………………………………………………………………………… 148 2008………………………………………………………………………………………………. 115 2009 through 2012 ………………………………………………………………………………. 490 Total 944 Stockholders’ equity was P=47,742 million as of 30 September 2005 or an 8% decline from the P=52,080 million for the same period in 2004. As a result of the adoption of new accounting standards, the Globe Group took a one-time charge to its beginning of the year retained earnings amounting to P2,670 million
representing the net of tax effect of various accounting standards discussed in the attached notes to the financial statements. A substantial portion of this one-time charge is due to the adoption of PAS 21 which no longer allows the capitalization of foreign exchange losses to assets.
On 1 February 2005, the Board of Directors (BOD) of Globe Telecom approved an offer to purchase one share for every fifteen shares of the outstanding common stock of Globe from all shareholders of record as of 10 February 2005, at a price of P950 per share. The approval allowed Globe to purchase up to 9 million shares representing 6.7% of its outstanding common shares. Each shareholder was entitled to tender a proportionate number of shares owned at the 1:15 ratio, referred to as the Tender Ratio, for purchase by Globe upon and subject to the terms and conditions of the tender offer. On 3 February 2005, Globe commenced the tender offer which expired on 3 March 2005 after a one-day extension. Also, on 1 February 2005, the BOD approved the retirement of the purchased shares and the existing 12 million treasury shares acquired in 2003 from DeTeAsia. On 8 March 2005, Globe announced that it had accepted 8 million common shares that were tendered by the stockholders. The accepted shares represented 86% of shares eligible for tender. The value of the tendered shares totaled P7.66 billion. The accepted shares were eventually crossed at the exchange on 15 March 2005 and payment was made on 16 March 2005. (Please refer to page 23 for the shareholder structure as of 30 September 2005) As of 30 September 2005, Globe’s capital stock consists of:
1. Preferred stock Series “A” at a par value of P5 per share of which 158 million shares are outstanding out of a total authorized of 250 million shares. Preferred stock “Series A” has the following features: (a) Convertible to one common share after 10 years from issue date at a price which shall not be less
than the prevailing market price of the common stock less the par value of the preferred shares; (b) Cumulative and non-participating; (c) Floating rate dividend (set at MART 1 plus 2% average for a 12-month period); (d) Issued at P=5 par; (e) Voting rights; (f) Globe has the right to redeem the preferred shares at par plus accrued dividends at any time after
5 years from date of issuance; and (g) Preferences as to dividend in the event of liquidation.
On 15 December 2004 the Board of Directors (BOD) approved the declaration of cash dividends to preferred shareholders as of record date 31 December 2004 amounting to P75 million and was paid on 15 March 2005.
2. Common shares at par value of P=50 per share of which 152 million shares have been issued and 132
million are outstanding out of a total authorized of 200 million shares. In the last annual stockholders meeting on 4 April 2005, Globe’s stockholders authorized the cancellation of its treasury shares and the reduction in the authorized capital stock of the Company. On October 28, 2005, the Securities and Exchange Commission approved the reduction in capital stock. After the reduction, total authorized common shares are now 179,934,373, of which 131,899,148 are outstanding.
On 1 February 2005, the BOD declared the first semi-annual cash dividend in 2005 of P20 per common share with a record date of 18 February 2005 and payment was made on 15 March 2005. On 2 August 2005, the Board of Directors declared the second semi-annual cash dividend for 2005 amounting to P20 per common share outstanding as of record date 19 August 2005, and payment was
on 14 September 2005. This is consistent with our cash dividend policy of distributing 50% of prior year’s net income and represents an increase of 11% over the previous year.
Consolidated Return on Average Equity (ROE) for the period ended 30 September 2005 stood at 16%. On 1 July 2004, Globe Telecom granted additional stock options to key executives and senior management personnel of the Globe Group under the Executive Stock Option Plan 2. It required the grantees to pay a nonrefundable option purchase price of P1,000. The agreement provides for an exercise price of P840.75 per share. 50% of the options become exercisable from 1 July 2006 to 30 June 2014, while the remaining 50% become exercisable from 1 July 2007 to 30 June 2014. As of 30 September 2005, there were a total net outstanding stock options of 1,286,850 granted to key executives and senior management personnel. In order to avail of the privilege, the grantees must remain with Globe Telecom or its affiliates from grant date up to the beginning of the exercise period of the corresponding shares. RECENT DEVELOPMENTS Globe is an intervenor in and Innove is a party to Civil Case No. Q-00-42221 entitled "Isla Communications Co., Inc. et. al., versus National Telecommunications Commission (‘NTC’) et al.," before the Regional Trial Court (‘RTC’) of Quezon City by virtue of which Globe and Innove, together with other cellular operators, sought and obtained a preliminary injunction against the implementation of NTC Memorandum Circular (‘MC’) No. 13-6-2000 from the RTC of Quezon City. NTC MC 13-6-2000 prescribed new billing requirements for cellular service providers. The NTC appealed the issuance of the injunction to the Court of Appeals. On 25 October 2001, we received a copy of the decision of the Court of Appeals ordering the dismissal of the case before the RTC for lack of jurisdiction, but without prejudice to the wireless companies’ seeking relief before the NTC, which the Court of Appeals claims had jurisdiction over the matter. On 22 February 2002, we filed a Petition for Review with the Supreme Court (‘SC’) to annul and reverse the decision of the Court of Appeals. The Supreme Court (‘SC’), on 2 September 2003, overturned the CA’s earlier dismissal of the petitions filed by SMART and Globe. In its 13-page decision, the SC said that the Quezon City trial court could hear and decide the case, contrary to NTC’s argument. The SC has also since denied the NTC’s motion for reconsideration. We are currently awaiting resumption of the proceedings before the RTC of Quezon City. On 17 July 2005, TM launched its Emergency Text service that allows TM subscribers to send an emergency text message even with zero prepaid credit balance. The recipient of the "Please send me load" message may send prepaid load credits via Share-A-Load (SAL) by simply replying to the Emergency Text received. On 7 August 2005, Globe improved on its Hong Kong Share-A-Load service by offering its G-Cash remittance service to OFW SmarTone subscribers in Hong Kong. Globe Handyphone and TM subscribers in the Philippines can now receive G-Cash in P500, P1,000, P3,000 and P5,000 denominations which will be charged to the OFW’s SmarTone subscriptions. These denominations will be charged in Hong Kong dollars and will have a corresponding transaction fee. On 12 August 2005, Globe announced that it had completed the first video call over its 3G trial network. 3G is third generation technology that allows high speed data transmission enabling users to enjoy features that require speed such as video on-demand and video call conference. Following 2G or GSM and 2.5G network or GPRS, 3G network is the next generation of telecommunications technologies and services. Globe Telecom was the first Philippine operator to be given a 3G trial permit and frequencies from the National Telecommunications Commission (NTC). On 14 September 2005 Globelines announced that its postpaid subscribers can call 10 countries for only US$0.20 per minute until 27 October 2005. Subscribers who have activated their IDD can already avail of the
budget IDD rate when calling Australia, Canada, China, Hong Kong, Malaysia, Singapore, South Korea, Taiwan, Thailand and USA. Additionally, with the Globe1 Card, Innove’s PIN-based prepaid call card, consumers can call these countries at US$0.10 per minute using a Globelines postpaid, prepaid landline or payphone until 13 November 2005. Starting 20 September 2005, Globelines Broadband subscribers can call 51 countries for only US$0.05 per minute using Voice Over Internet Protocol (VoIP) technology. The 51 countries are Argentina, Australia, Austria, Belgium, Brazil, Bulgaria, Canada, Chile, China, Colombia, Czech Republic, Denmark, Estonia, Finland, France, Germany, Gibraltar, Greece, Hong Kong, Hungary, Iceland, Ireland, Israel, Italy, Japan, South Korea, Luxembourg, Malaysia, Mexico, Monaco, Mongolia, Netherlands, New Zealand, Norway, Peru, Poland, Portugal, Puerto Rico, Russia, Saudi Arabia, Singapore, Slovenia, Spain, Sweden, Switzerland, Taiwan, Thailand, Turkey, United Kingdom, USA and Venezuela. On 15 September 2005, Innove launched its G-POS (Point of Sale) Service at the Stores Asia Expo 2005 Retail Suppliers Exhibition held concurrently with the National Retailers Conference at the Edsa Shangri-La Hotel. G-POS will allow stores to use their existing POS system instead of using a cellular phone to handle G-Cash transactions such as merchant payments, bills payments, cash and m-currency conversions and AutoLoadMax reloads through GlobeQuest Store Express. GlobeQuest Store Express is a solution specifically designed to address the various connectivity requirements of the retail industry and to meet both the network and information technology requirements of retail companies, regardless of size and retail format. On 20 September 2005, Globe introduced its 3G Roaming service for subscribers traveling abroad in Asia-Pacific countries with 3G networks. With the 3G Roaming service, subscribers traveling abroad have the benefits of faster data access and soon, advanced connectivity with video calling. The 3G technology will allow subscribers to access and download heavy data files such as music tracks and videos from the Internet. It also enables video sharing, through which users can send and save video clips with overall faster access of GPRS. These services are on top of regular voice, SMS and MMS roaming services. Globe international roaming subscribers can now roam in 3G networks of three countries using the following operator networks and 3G-enabled phones - NTT DoCoMo and Vodafone in Japan, Sunday in Hong Kong, and SingTel in Singapore. On 28 September 2005, Globe Handyphone and TM offered its postpaid and prepaid subscribers the CelebRate Budget IDD promotion. Subscribers can make IDD calls to United States, Canada, China, Malaysia, Hong Kong, Singapore, South Korea, Thailand, Taiwan, and Australia for US$0.20 per minute starting on the first minute. The promo will end on 26 November 2005. The following Globe Prepaid CelebRate offerings have also been extended to 26 November 2005.
1. The TXTNONSTOP promotion for Globe-to-Globe unlimited text for only P15 for 24 hours, P25 for two days, or P50 for 5 days.
2. The P10-per-3 minute call promotion for Globe-to-Globe calls. Subscribers can dial 235 + the 10-digit Globe number to avail of the service.
The TXTNONSTOP and P10-per-3-minute call promos are open to all Globe prepaid subscribers, including those with Globe Gizmo, Kapamilya, Globe Kababayan and Traveler's SIMs. The TM Todo Tawag 15/15 promotion (launched on 19 August 2005) was likewise extended to 18 November 2005 and allows TM subscribers to make 15 minute TM-to-TM voice calls for only P15. Subscribers can dial
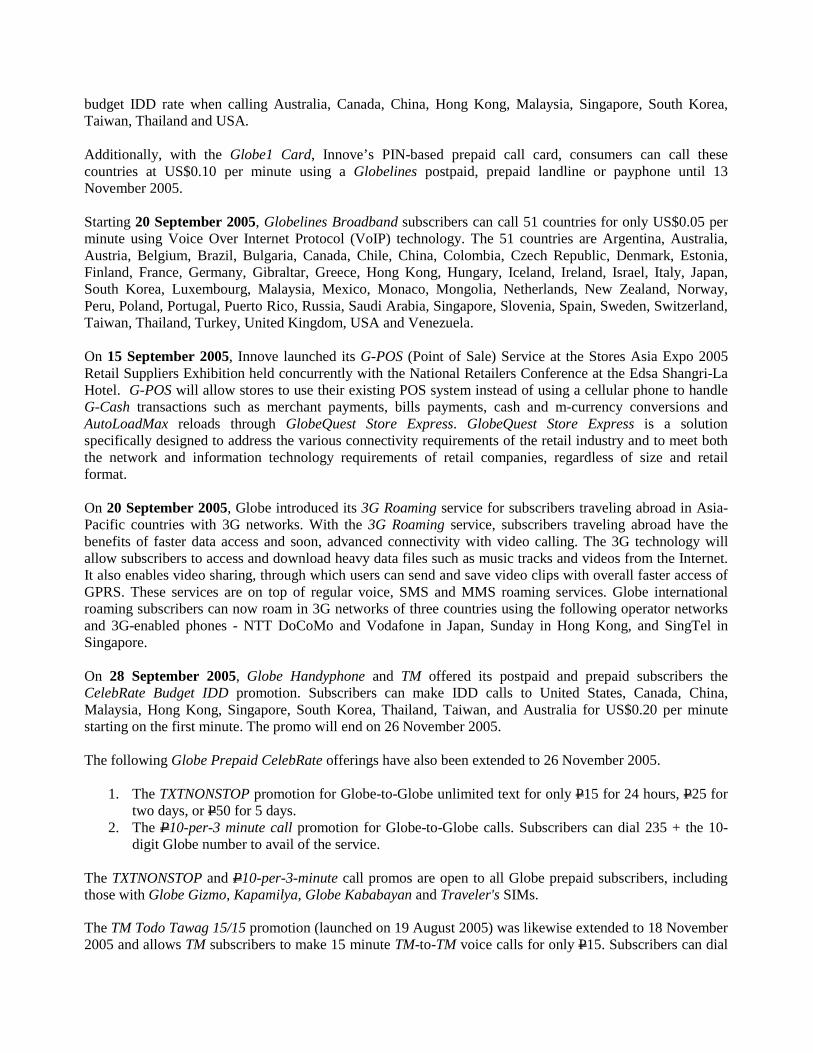
80 + the 10-digit TM number to avail of the service. On 8 September 2005, TM launched the Todo Text:P10 for 1 Day promo. This allowed TM subscribers to send unlimited text messages for one day. This promo has been extended to 6 November 2005. On 28 September 2005, Globe launched its Visibility service that provides data access via GPRS, EDGE, WiFi and dial-up transport channels. Visibility services are available via pay-per-use or through four universal access plans. Mobile Office, Remote Office and free email are also available for universal access plan subscribers. The 4 universal access plans are as follows:
UNIVERSAL ACCESS PLAN
(in Pesos)
UNLIMITED GPRS/EDGE/WiFi/
DIAL UP
UNLIMITED GPRS/EDGE WITH PER MINUTE WiFi/DIAL UP
PLAN 1500 (Consumable)
PLAN 0 (Pay-Per-Use)
Universal Access Value (MSF)
2,500 1,700 1,500 -
One Time Charge (OTC) 2,000 2,000 - 1,500 GPRS Rate / kb Unlimited Unlimited 0.105 0.15 WiFi Rate / minute Unlimited 2.00 1.40 2.00 Dial-Up Rate / minute Unlimited 0.50 0.35 0.50
Initially, Visibility will only be available to all Innove and GlobeSolutions corporate subscribers.
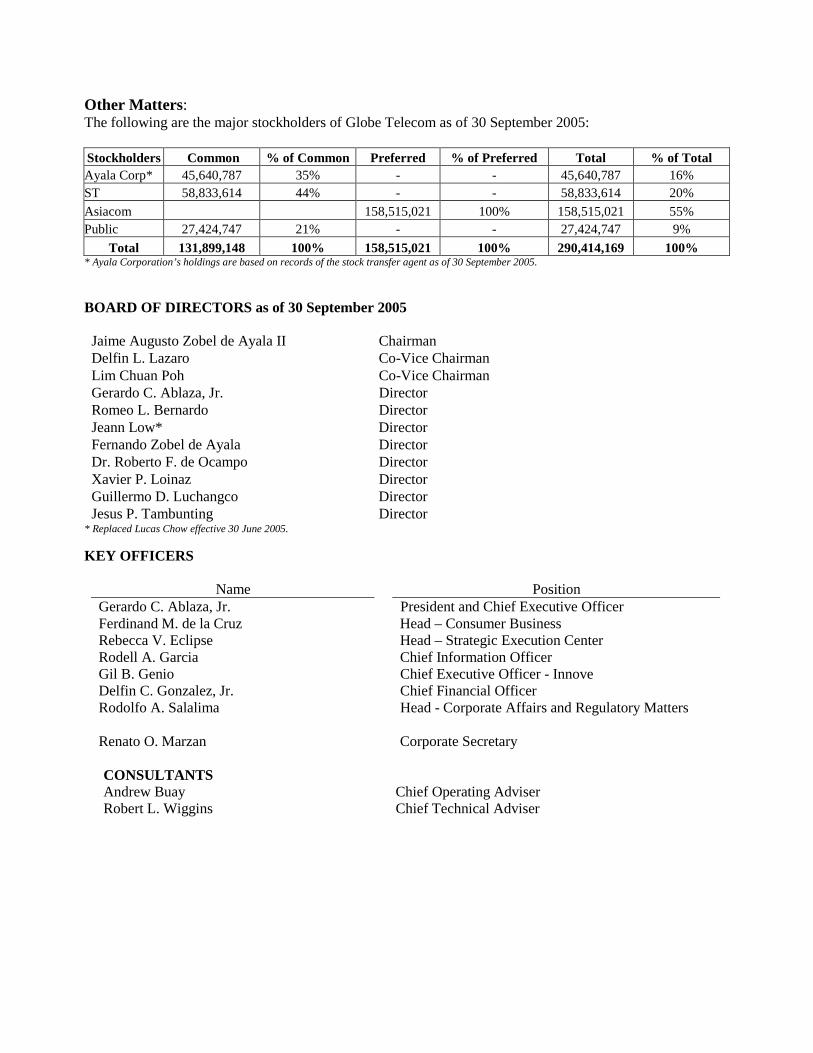
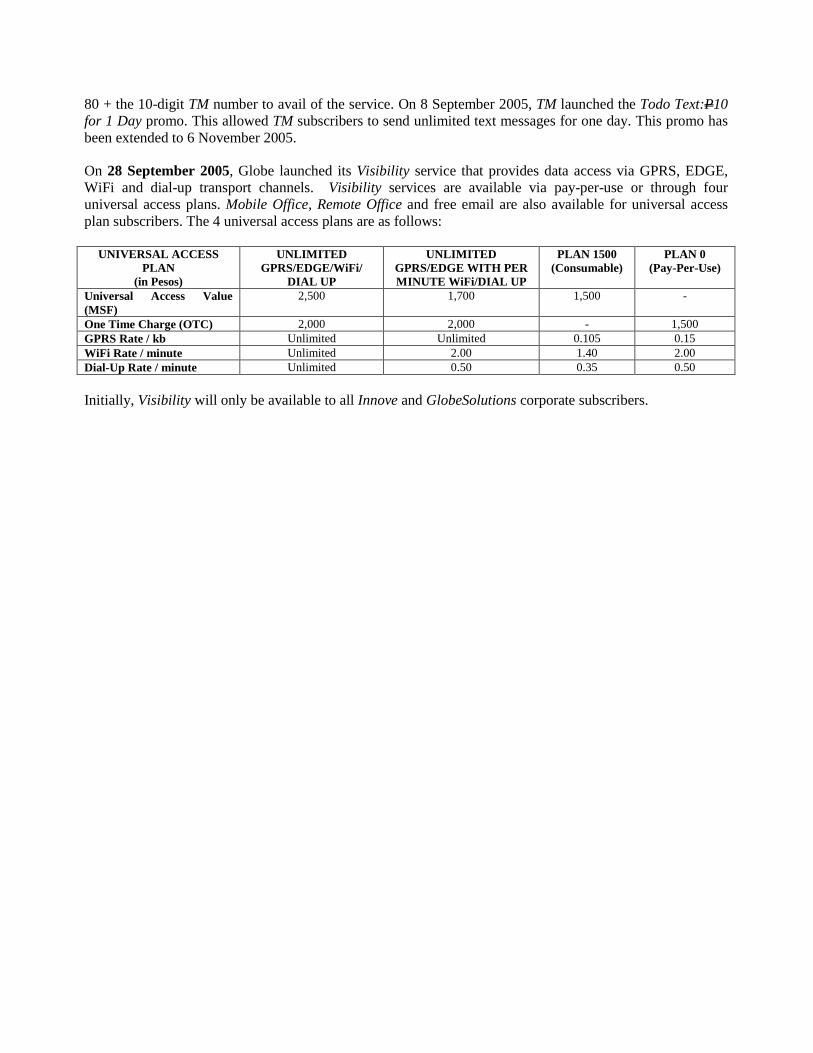
Other Matters: The following are the major stockholders of Globe Telecom as of 30 September 2005: Stockholders Common % of Common Preferred % of Preferred Total % of Total Ayala Corp* 45,640,787 35% - - 45,640,787 16% ST 58,833,614 44% - - 58,833,614 20%
Asiacom 158,515,021 100% 158,515,021 55% Public 27,424,747 21% - - 27,424,747 9%
Total 131,899,148 100% 158,515,021 100% 290,414,169 100% * Ayala Corporation’s holdings are based on records of the stock transfer agent as of 30 September 2005.
BOARD OF DIRECTORS as of 30 September 2005 Jaime Augusto Zobel de Ayala II Chairman Delfin L. Lazaro Co-Vice Chairman Lim Chuan Poh Co-Vice Chairman Gerardo C. Ablaza, Jr. Director Romeo L. Bernardo Director Jeann Low* Director Fernando Zobel de Ayala Director Dr. Roberto F. de Ocampo Director Xavier P. Loinaz Director Guillermo D. Luchangco Director Jesus P. Tambunting Director
* Replaced Lucas Chow effective 30 June 2005.
KEY OFFICERS
Name Position Gerardo C. Ablaza, Jr. President and Chief Executive Officer Ferdinand M. de la Cruz Head – Consumer Business Rebecca V. Eclipse Head – Strategic Execution Center Rodell A. Garcia Chief Information Officer Gil B. Genio Chief Executive Officer - Innove Delfin C. Gonzalez, Jr. Chief Financial Officer Rodolfo A. Salalima Head - Corporate Affairs and Regulatory Matters Renato O. Marzan Corporate Secretary
CONSULTANTS Andrew Buay Chief Operating Adviser Robert L. Wiggins Chief Technical Adviser
SIGNATURES
Pursuant to the requirement of the Securities Regulation Code, the registrant has duly caused this report to be signed on its behalf by the undersigned thereunto duly authorized. Registrant GLOBE TELECOM, INC.
EDITH C. SANTIAGO 9 November 2005
Vice President – Financial Control
DELFIN C. GONZALEZ, JR. 9 November 2005 Chief Financial Officer & Authorized Representative
Annex I
GLOBE TELECOM, INC. AND SUBSIDIARIES Condensed Consolidated Financial Statements September 30, 2005 and 2004 (Unaudited)
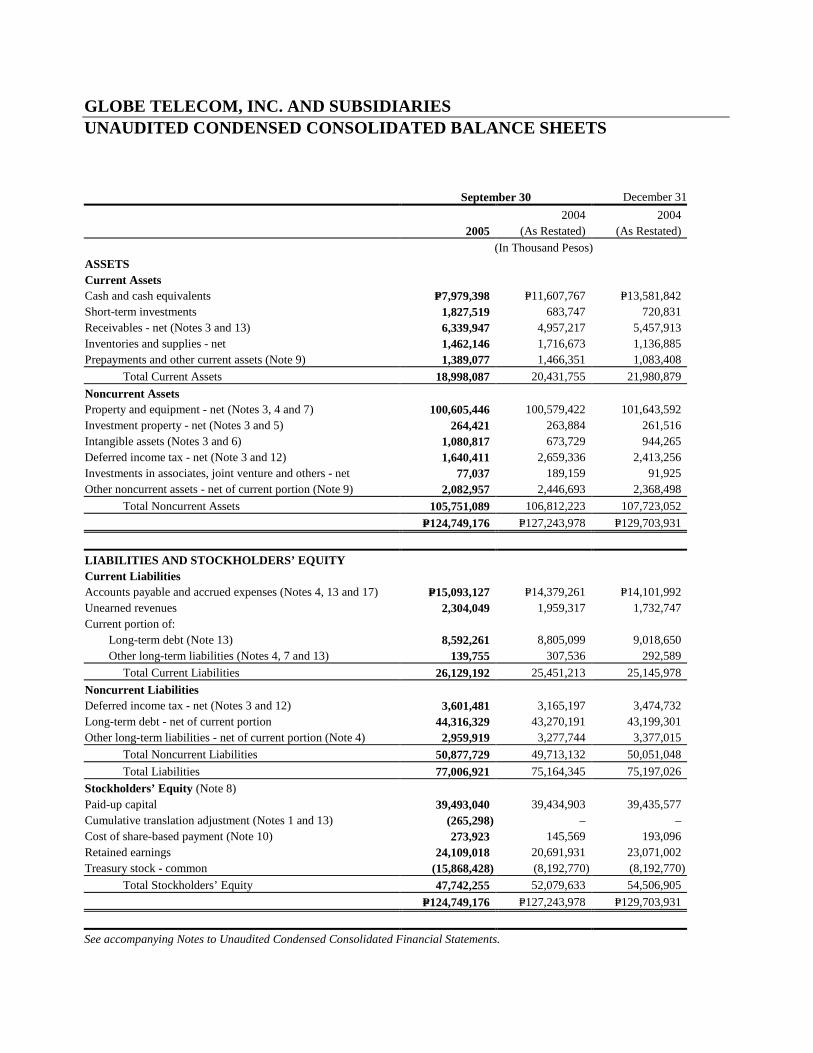
GLOBE TELECOM, INC. AND SUBSIDIARIES UNAUDITED CONDENSED CONSOLIDATED BALANCE SHEETS September 30 December 31
2005 2004
(As Restated) 2004
(As Restated)
(In Thousand Pesos) ASSETS Current Assets Cash and cash equivalents P=7,979,398 P=11,607,767 P=13,581,842 Short-term investments 1,827,519 683,747 720,831 Receivables - net (Notes 3 and 13) 6,339,947 4,957,217 5,457,913 Inventories and supplies - net 1,462,146 1,716,673 1,136,885 Prepayments and other current assets (Note 9) 1,389,077 1,466,351 1,083,408
Total Current Assets 18,998,087 20,431,755 21,980,879
Noncurrent Assets Property and equipment - net (Notes 3, 4 and 7) 100,605,446 100,579,422 101,643,592 Investment property - net (Notes 3 and 5) 264,421 263,884 261,516 Intangible assets (Notes 3 and 6) 1,080,817 673,729 944,265 Deferred income tax - net (Note 3 and 12) 1,640,411 2,659,336 2,413,256 Investments in associates, joint venture and others - net 77,037 189,159 91,925 Other noncurrent assets - net of current portion (Note 9) 2,082,957 2,446,693 2,368,498
Total Noncurrent Assets 105,751,089 106,812,223 107,723,052
P=124,749,176 P=127,243,978 P=129,703,931
LIABILITIES AND STOCKHOLDERS’ EQUITY Current Liabilities Accounts payable and accrued expenses (Notes 4, 13 and 17) P=15,093,127 P=14,379,261 P=14,101,992 Unearned revenues 2,304,049 1,959,317 1,732,747 Current portion of: Long-term debt (Note 13) 8,592,261 8,805,099 9,018,650 Other long-term liabilities (Notes 4, 7 and 13) 139,755 307,536 292,589
Total Current Liabilities 26,129,192 25,451,213 25,145,978
Noncurrent Liabilities Deferred income tax - net (Notes 3 and 12) 3,601,481 3,165,197 3,474,732 Long-term debt - net of current portion 44,316,329 43,270,191 43,199,301 Other long-term liabilities - net of current portion (Note 4) 2,959,919 3,277,744 3,377,015
Total Noncurrent Liabilities 50,877,729 49,713,132 50,051,048
Total Liabilities 77,006,921 75,164,345 75,197,026
Stockholders’ Equity (Note 8) Paid-up capital 39,493,040 39,434,903 39,435,577 Cumulative translation adjustment (Notes 1 and 13) (265,298) – – Cost of share-based payment (Note 10) 273,923 145,569 193,096 Retained earnings 24,109,018 20,691,931 23,071,002 Treasury stock - common (15,868,428) (8,192,770) (8,192,770)
Total Stockholders’ Equity 47,742,255 52,079,633 54,506,905
P=124,749,176 P=127,243,978 P=129,703,931
See accompanying Notes to Unaudited Condensed Consolidated Financial Statements.
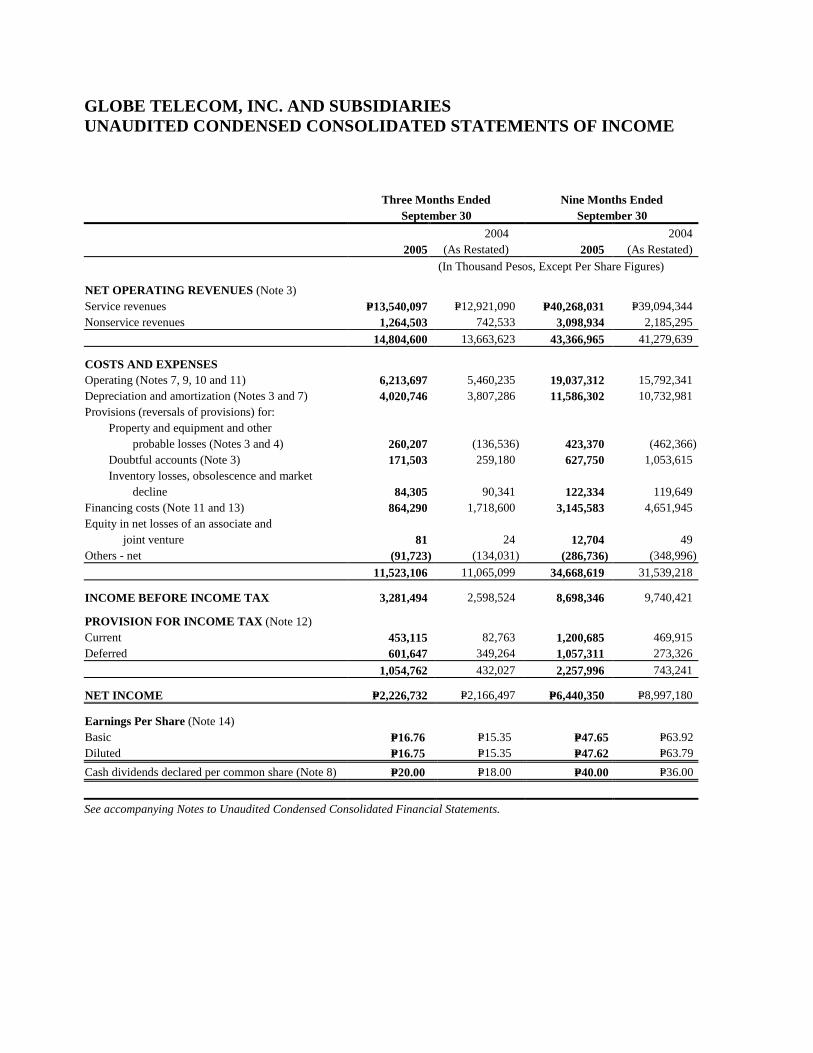
GLOBE TELECOM, INC. AND SUBSIDIARIES UNAUDITED CONDENSED CONSOLIDATED STATEMENTS OF INCOME
Three Months Ended
September 30 Nine Months Ended
September 30
2005 2004
(As Restated) 2005 2004
(As Restated)
(In Thousand Pesos, Except Per Share Figures)
NET OPERATING REVENUES (Note 3) Service revenues P=13,540,097 P=12,921,090 P=40,268,031 P=39,094,344 Nonservice revenues 1,264,503 742,533 3,098,934 2,185,295
14,804,600 13,663,623 43,366,965 41,279,639
COSTS AND EXPENSES Operating (Notes 7, 9, 10 and 11) 6,213,697 5,460,235 19,037,312 15,792,341 Depreciation and amortization (Notes 3 and 7) 4,020,746 3,807,286 11,586,302 10,732,981 Provisions (reversals of provisions) for: Property and equipment and other
probable losses (Notes 3 and 4)
260,207 (136,536) 423,370 (462,366) Doubtful accounts (Note 3) 171,503 259,180 627,750 1,053,615 Inventory losses, obsolescence and market
decline
84,305 90,341 122,334 119,649 Financing costs (Note 11 and 13) 864,290 1,718,600 3,145,583 4,651,945 Equity in net losses of an associate and joint venture
81 24 12,704 49
Others - net (91,723) (134,031) (286,736) (348,996)
11,523,106 11,065,099 34,668,619 31,539,218
INCOME BEFORE INCOME TAX 3,281,494 2,598,524 8,698,346 9,740,421
PROVISION FOR INCOME TAX (Note 12) Current 453,115 82,763 1,200,685 469,915 Deferred 601,647 349,264 1,057,311 273,326
1,054,762 432,027 2,257,996 743,241
NET INCOME P=2,226,732 P=2,166,497 P=6,440,350 P=8,997,180
Earnings Per Share (Note 14) Basic P=16.76 P=15.35 P=47.65 P=63.92 Diluted P=16.75 P=15.35 P=47.62 P=63.79
Cash dividends declared per common share (Note 8) P=20.00 P=18.00 P=40.00 P=36.00
See accompanying Notes to Unaudited Condensed Consolidated Financial Statements.

GLOBE TELECOM, INC. AND SUBSIDIARIES UNAUDITED CONDENSED CONSOLIDATED STATEMENTS OF CHANGES IN STOCKHOLDERS’ EQUITY
Capital
Stock*
Additional
Paid-in Capital - Common
Treasury
Stock - Common
Cost of
Share-Based Payment
Cumulative
Translation Adjustment
Retained
Earnings Total
For The Nine Months Ended September 30, 2005 (In Thousand Pesos) As of January 1, 2005,
as previously reported P=8,323,023 P=31,111,790 (P=8,192,770) P=– P=– P=25,774,446 P=57,016,489
Effect of changes in accounting
policies (Notes 2 and 10) – 764 – 193,096 – (2,703,447) (2,509,587)
Cumulative effect of change in
accounting policy for financial
instruments as of January 1, 2005
(Notes 2 and 13) – – – – (151,008) 33,686 (117,322)
As of January 1, 2005, as restated 8,323,023 31,112,554 (8,192,770) 193,096 (151,008) 23,104,685 54,389,580
Changes in fair value of cash flow
hedges (164,712) – (164,712)
Transferred to income and expense
for the period 27,740 – 27,740
Tax effect of items taken directly to
or transferred from equity 43,830 – 43,830
Changes in fair value of available-for-
sale equity investments (21,148) – (21,148)
Net income recognized directly in
equity (114,290) – (114,290)
Net income for the period 6,440,350 6,440,350
Total recognized income for the period (114,290) 6,440,350 6,326,060
Acquisition of treasury shares for the
period (Note 8) – – (7,675,658) – – – (7,675,658)
Dividends on common stock (Note 8) – – – – – (5,436,017) (5,436,017)
Cost of share-based payment – – – 121,566 – – 121,566
Collections of subscriptions
receivable - net of refunds 9,481 – – – – – 9,481
Exercise of stock options - net of
related expenses 2,967 45,015 – (40,739) – – 7,243
As of September 30, 2005 P=8,335,471 P=31,157,569 (P=15,868,428) P=273,923 (P=265,298) P=24,109,018 P=47,742,255
For The Nine Months Ended September 30, 2004 (In Thousand Pesos) As of January 1, 2004,
as previously reported P=8,307,828 P=31,110,194 (P=8,192,770) P=– P=– P=19,628,747 P=50,853,999
Effect of changes in accounting
policies (Note 2) – – – 59,090 – (2,842,323) (2,783,233)
As of January 1, 2004, as restated 8,307,828 31,110,194 (8,192,770) 59,090 – 16,786,424 48,070,766
Net income for the period – – – – – 8,997,180 8,997,180
Dividends on:
Common stock – – – – – (5,036,539) (5,036,539)
Preferred stock – – – – – (55,134) (55,134)
Cost of share-based payment – – – 87,243 – – 87,243
Exercise of stock options – 2,148 – (764) – – 1,384
Collections of subscription
receivable - net of refunds 14,733 – – – – – 14,733
As of September 30, 2004, as restated P=8,322,561 P=31,112,342 (P=8,192,770) P=145,569 P=– P=20,691,931 P=52,079,633 *Net of subscriptions receivable of P=55.34 million as of September 30, 2005 and P=65.29 million as of September 30, 2004.
See accompanying Notes to Unaudited Condensed Consolidated Financial Statements.
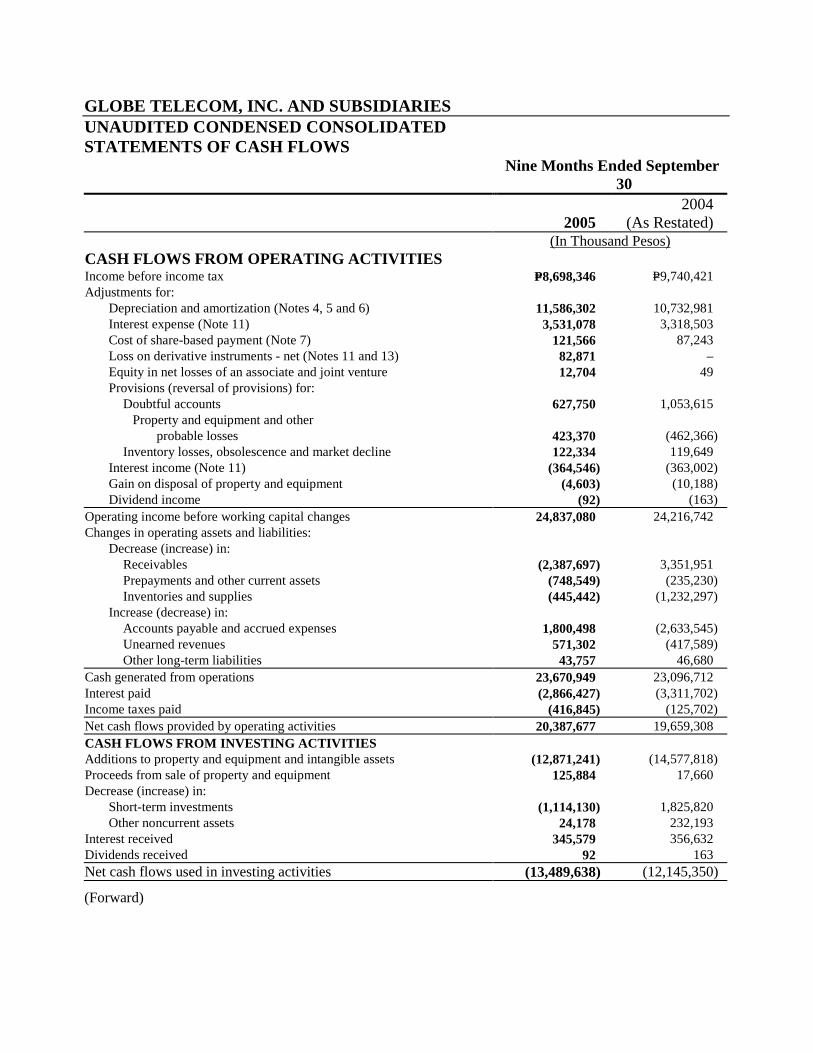
GLOBE TELECOM, INC. AND SUBSIDIARIES UNAUDITED CONDENSED CONSOLIDATED STATEMENTS OF CASH FLOWS
Nine Months Ended September
30
2005 2004
(As Restated) (In Thousand Pesos) CASH FLOWS FROM OPERATING ACTIVITIES Income before income tax P=8,698,346 P=9,740,421 Adjustments for: Depreciation and amortization (Notes 4, 5 and 6) 11,586,302 10,732,981 Interest expense (Note 11) 3,531,078 3,318,503 Cost of share-based payment (Note 7) 121,566 87,243 Loss on derivative instruments - net (Notes 11 and 13) 82,871 – Equity in net losses of an associate and joint venture 12,704 49 Provisions (reversal of provisions) for: Doubtful accounts 627,750 1,053,615 Property and equipment and other
probable losses 423,370 (462,366) Inventory losses, obsolescence and market decline 122,334 119,649 Interest income (Note 11) (364,546) (363,002) Gain on disposal of property and equipment (4,603) (10,188) Dividend income (92) (163) Operating income before working capital changes 24,837,080 24,216,742 Changes in operating assets and liabilities: Decrease (increase) in: Receivables (2,387,697) 3,351,951 Prepayments and other current assets (748,549) (235,230) Inventories and supplies (445,442) (1,232,297) Increase (decrease) in: Accounts payable and accrued expenses 1,800,498 (2,633,545) Unearned revenues 571,302 (417,589) Other long-term liabilities 43,757 46,680 Cash generated from operations 23,670,949 23,096,712 Interest paid (2,866,427) (3,311,702) Income taxes paid (416,845) (125,702) Net cash flows provided by operating activities 20,387,677 19,659,308 CASH FLOWS FROM INVESTING ACTIVITIES Additions to property and equipment and intangible assets (12,871,241) (14,577,818) Proceeds from sale of property and equipment 125,884 17,660 Decrease (increase) in: Short-term investments (1,114,130) 1,825,820 Other noncurrent assets 24,178 232,193 Interest received 345,579 356,632 Dividends received 92 163 Net cash flows used in investing activities (13,489,638) (12,145,350)
(Forward)

- 2 - Nine Months Ended September 30
2005 2004 (As Restated)
(In Thousand Pesos) CASH FLOWS FROM FINANCING ACTIVITIES Proceeds from: Long-term borrowings P=9,898,956 P=13,474,484 Short-term borrowings 21,000 60,000 Repayments of: Long-term borrowings (9,229,359) (17,333,343) Short-term borrowings (21,000) (60,000) Purchase of treasury stock - common (Note 8) (7,675,658) – Payments of dividends to (Note 8): Common shareholders (5,436,017) (5,036,539) Preferred shareholders (75,128) (67,957) Subscription of capital stock, net of stock option-related
expenses 16,723 16,116 Net cash flows used in financing activities (12,500,483) (8,947,239) NET DECREASE IN CASH AND CASH
EQUIVALENTS (5,602,444) (1,433,281) CASH AND CASH EQUIVALENTS AT
BEGINNING OF PERIOD 13,581,842 13,041,048 CASH AND CASH EQUIVALENTS AT
END OF PERIOD P=7,979,398 P=11,607,767 See accompanying Notes to Unaudited Condensed Consolidated Financial Statements.
GLOBE TELECOM, INC. AND SUBSIDIARIES NOTES TO UNAUDITED CONDENSED CONSOLIDATED FINANCIAL STATEMENTS 1. Basis of Financial Statement Preparation
The condensed consolidated financial statements include the accounts of Globe Telecom, Inc. (herein referred to as “Globe Telecom” or “Globe”) and its wholly owned subsidiaries Innove Communications, Inc. (herein referred to as “Innove”) and G-Xchange, Inc. (herein referred to as “GXI”), collectively referred to as “Globe Group.” These condensed financial statements have been prepared under the historical cost convention method, except for derivative financial instruments and available-for-sale financial assets that are measured at fair value. The carrying value of recognized assets and liabilities that are hedged are adjusted to record changes in fair values attributable to the risks that are being hedged.
The accompanying condensed consolidated financial statements have been prepared in accordance with Statement of Financial Accounting Standard (SFAS) 30/International Accounting Standard (IAS) 34, Interim Financial Reporting. Accordingly, they do not include all of the information and footnotes required by generally accepted accounting principles in the Philippines (Philippine GAAP) for complete financial statements. These interim financial statements are also covered by Philippine Financial Reporting Standard (PFRS) 1, First-time Adoption of PFRS, because they are part of the period covered by the first PFRS financial statements of the Globe Group for the year ended December 31, 2005. These interim financial statements have been prepared in accordance with PFRS and related interpretations issued and effective for periods beginning on or after January 1, 2005.
The accounting policies have been consistently applied to all the periods presented, except
for those relating to the classification and measurement of financial instruments. The comparative figures in respect for 2004 were restated to reflect the adjustments resulting from adoption of new and revised accounting standards, except Philippine Accounting Standard (PAS) 32, Financial Instruments: Disclosure and Presentation and PAS 39, Financial Instruments: Recognition and Measurement. The Globe Group has made use of the exemption available under PFRS 1 and as allowed by the Philippine Securities and Exchange Commission (SEC) to only apply PAS 32 and PAS 39 from January 1, 2005.
2. Adoption of New and Revised Accounting Standards
The Globe Group adopted the following new and revised accounting standards, which are based on revised IAS and International Financial Reporting Standards (IFRS) issued by the International Accounting Standards Board (IASB). The new and revised accounting standards became effective for annual periods beginning on or after January 1, 2005. The Accounting Standards Council (ASC) has renamed the standards that it issues to
- -
2
correspond better to the issuances of IASB. PAS correspond to adopted IAS, while PFRS correspond to adopted IFRS. Previously, standards issued by the ASC were designated as SFAS.
New Accounting Standards
• PFRS 1, First Time Adoption of PFRS, requires an entity to comply with each PFRS effective at the reporting date for its first PFRS financial statements. The Globe Group has adopted PFRS for these financial statements as of and for the three months and nine months ended September 30, 2005 and has also restated the comparative amounts for the three months and nine months ended September 30, 2004 and the year ended December 31, 2004, except for the following courses of action that have been taken as allowed under PFRS 1:
Share-based payment transactions
The Globe Group has applied PFRS 2, Share-based Payment, only to equity-settled awards granted after November 7, 2002 similar to the transitional provisions under PFRS 2 for equity-settled transactions. Business combinations, goodwill and impairment
The Globe Group has elected not to restate any business combinations that occurred before the date of transition to PFRS.
Post retirement benefits - Defined benefit schemes The Globe Group has chosen not to recognize using the “corridor approach” cumulative actuarial gains or losses that resulted from the measurement of such schemes in accordance with PAS 19, Employee benefits, at the date of transition. Instead, the Group has elected to recognize all cumulative actuarial gains and losses at the date of transition to PFRS.
Classification and measurement of financial instruments The Globe Group has applied PAS 32 and PAS 39 to financial instruments outstanding as of January 1, 2005 only and the cumulative effect of adopting these standards on prior years and charged to the January 1, 2005 retained earnings, as allowed by SEC.
• PFRS 2, Share-based Payment, sets out the measurement principles and accounting requirements for share-based payment transactions, including transactions with employees or other parties to be settled in cash, other assets, or equity instruments of the entity. Under this standard, the Globe Group is required to recognize the cost of stock options granted after November 7, 2002 in the statements of income. Prior to January 1, 2005, the Globe Group did not recognize an expense for share options granted but disclosed required information for such options. Certain employees (including directors) of the Globe Group receive remuneration in the form of share-based payment transactions (‘equity-settled transactions’).
- -
3
The cost of equity-settled transactions with employees is measured by reference to the fair value at the date at which they are granted. In valuing equity-settled transactions, no account is taken of any performance conditions, other than conditions linked to the price of the shares of Globe Telecom (‘market conditions’). The cost of equity-settled transactions is recognized in the condensed consolidated statements of income, together with a corresponding increase in equity, over the period in which the performance conditions are fulfilled, ending on the date on which the relevant employees become fully entitled to the award (‘vesting date’). The cumulative expense recognized for equity-settled transactions at each reporting date until the vesting date reflects the extent to which the vesting period has expired and the number of awards that, in the opinion of the management of the Globe Group at that date and based on the best available estimate, will ultimately vest. No expense is recognized for awards that do not ultimately vest. Where the terms of an equity-settled award are modified, as a minimum, an expense is recognized as if the terms had not been modified. In addition, an expense is recognized for any increase in the value of the transaction as a result of the modification, as measured at the date of modification. Where an equity-settled award is cancelled, it is treated as if it had vested on the date of cancellation, any expense not yet recognized for the award is recognized immediately. However, if a new award is substituted for the cancelled award, and designated as a replacement award on the date that it is granted, the cancelled and new awards are treated as if they were a modification of the original award, as described in the previous paragraph. The dilutive effect if Globe Group has taken advantage of outstanding options is reflected as additional share dilution in the computation of earnings per share (see Note 14). The adoption of PFRS 2 decreased net income by P=69.17 million and P=27.47 million for the three months ended September 30, 2005 and 2004, respectively, and P=198.42 million and P=36.09 million for the nine months ended September 30, 2005 and 2004, respectively. Retained earnings decreased by P=94.31 million and P=30.75 million as of January 1, 2005 and 2004, respectively. Additional paid-in capital increased by P=0.76 million as of January 1, 2005. Stock options presented in the stockholders’ equity section of the consolidated balance sheets increased by P=193.10 million and P=59.09 million as of January 1, 2005 and 2004, respectively.
• PFRS 5, Noncurrent Assets Held for Sale and Discontinued Operations, specifies the
accounting for assets held for sale and the presentation and disclosure requirements for discontinued operations. Under this standard, qualifying noncurrent assets or disposal groups held for sale shall be carried at fair value less cost to sell if this amount is
- -
4
lower than its carrying amount less accumulated impairment losses. The entity shall not depreciate (or amortize) noncurrent assets (or disposal groups) while classified as held for sale. Any gain or loss on the remeasurement of a noncurrent asset (or disposal group) classified as held for sale shall be included in the profit or loss from continuing operations.
As of September 30, 2005 and 2004 and December 31, 2004, the Globe Group has no qualifying noncurrent asset held for sale.
• PAS 19, Employee Benefits, prescribes the accounting and disclosures by employers for employee benefits (including short-term employee benefits, post-employment benefits, other long-term employee benefits and termination benefits). For post-employment benefits classified as defined benefit plans, the standard requires (a) the use of the projected unit credit method to measure an entity’s obligations and costs; (b) an entity to determine the present value of defined benefit obligation and the fair value of any plan assets with sufficient regularity and (c) the recognition of a specific portion of net cumulative actuarial gains and losses when the net cumulative amount exceeds 10% of the greater of the present value of the defined benefit obligation or the fair value of the plan assets, but also permits the immediate recognition of these actuarial gains and losses.
Under PAS 19, pension cost includes current service cost, interest cost, expected return on any plan assets, actuarial gains and losses, past service cost and the effect of any curtailment or settlement.
The net pension asset recognized by the Globe Group in respect of the defined benefit pension plan is the lower of: (a) the present value of the defined benefit obligation at the balance sheet date less the fair value of the plan assets, together with adjustments for unrecognized actuarial gains or losses and past service costs that shall be recognized in later periods or (b) the total of any cumulative unrecognized net actuarial losses and past service cost and the present value of any economic benefits available in the form of refunds from the plan or reductions in future contributions to the plan. The defined benefit obligation is calculated annually by independent actuary using the projected unit credit method. The present value of the defined benefit obligation is determined by discounting the estimated future cash outflows using risk-free interest rates of government bonds that have terms to maturity approximating to the terms of the related pension liabilities.
In accordance with PFRS 1, as of the transition date, the effect of change in accounting policy includes all actuarial gains and losses that arose in earlier periods even if they fall inside the 10% corridor. In subsequent periods, portion of actuarial gains and losses is recognized as income or expense if the cumulative unrecognized actuarial gains and losses at the end of the previous reporting period exceeded the greater of the 10% of the present value of the defined benefit obligation or 10% of the fair value of the plan assets. These gains or losses are recognized over the expected average remaining working life of the employees participating in the plans.
- -
5
The adoption of PAS 19 decreased net income by P=20.18 million and P=2.00 million for the three months and nine months ended September 30, 2004, respectively, and increased retained earnings by P=92.89 million and P=114.67 million as of January 1, 2005 and 2004, respectively. Pension cost and accrual of short-term benefits amounted to P=61.57 million and P=139.90 million for the three months and nine months ended September 30, 2005, respectively.
• PAS 21, The Effects of Changes in Foreign Exchange Rates, eliminates the capitalization of foreign exchange differentials related to the acquisition of property and equipment.
The adoption of PAS 21 decreased retained earnings by P=2,443.53 million and P=2,739.20 million as of January 1, 2005 and 2004, respectively.
PAS 32, Financial Instruments: Disclosure and Presentation, covers the disclosure and
presentation of all financial instruments. The standard requires more comprehensive disclosures about an entity’s financial instruments, whether recognized or unrecognized in the financial statements. New disclosure requirements include terms and conditions of financial instruments used by the entity, types of risks associated with both recognized and unrecognized financial instruments (market risk, foreign exchange risk, price risk, credit risk, liquidity risk and cash flow risk), fair value information of both recognized and unrecognized financial assets and financial liabilities, and the entity’s financial risk management policies and objectives. The standard also requires financial instruments to be classified as debt or equity in accordance with their substance and not their legal form.
• PAS 39, Financial Instruments: Recognition and Measurement, establishes the
accounting and reporting standards for the recognition and measurement of the company’s financial assets and financial liabilities. PAS 39 requires a financial asset or a financial liability to be recognized initially at cost including related transaction costs. Subsequent to initial recognition, an entity should measure financial assets at their fair values, except for loans and receivables and held-to-maturity investments, which are measured at amortized cost using the effective interest rate method. Financial liabilities are subsequently measured at amortized cost, except for liabilities designated as fair value through profit and loss and derivatives, which are subsequently measured at fair value.
PAS 39 also establishes the accounting and reporting standards requiring that every derivative instrument (including certain derivatives embedded in other contracts) be recorded in the balance sheets as either an asset or liability measured at its fair value. PAS 39 requires that changes in the derivative’s fair value be recognized currently in the statements of income unless specific hedges allow a derivative’s gains and losses to offset related results on the hedged item in the statements of income, or deferred in the stockholders’ equity as “Cumulative translation adjustment.” PAS 39 requires that
- -
6
an entity must formally document, designate and assess the effectiveness of transactions that receive hedge accounting treatment. Derivatives that are not designated and do not qualify as hedges are adjusted to fair value through income.
Globe Group has adopted the hedge accounting treatment of PAS 39 for certain derivative instruments.
As allowed by the SEC, the effect of adopting PAS 39 did not result in the restatement of prior period financial statements. The cumulative effect of adopting this standard was charged to the January 1, 2005 retained earnings. The adoption of PAS 39 increased net income by P=52.86 million and decreased net income by P=26.74 million for the three months and nine months ended September 30, 2005, respectively, and increased cumulative translation losses presented as a reduction in the stockholders’ equity by P=114.29 million for the nine months ended September 30, 2005. Retained earnings and cumulative translation adjustment (presented as a reduction in the stockholders’ equity), increased by P=33.68 million and P=151.01 million, respectively, as of January 1, 2005.
• PAS 40, Investment Property, establishes the accounting and reporting standards for
investment property. Investment property is property (land or a building or both) held (by the owner or by the lessee under a finance lease) to earn rentals or for capital appreciation or both, rather than for: (a) use in the production or supply of goods or services or for administrative purposes; or (b) sale in the ordinary course of business. Under this standard, an entity is permitted to choose either the fair value model or cost model in the subsequent measurement of a qualifying investment property. Fair value model requires an investment property to be measured at fair value with fair value changes recognized directly in the statements of income. Cost model requires an investment property to be measured at cost less any accumulated depreciation and impairment losses. The adoption of PAS 40 resulted in the reclassification of the carrying value of the portion of a building being leased to third parties amounting to P=261.52 million and P=270.99 million as of January 1, 2005 and 2004, respectively, from property and equipment to investment property. The Globe Group continues to carry the investment property at cost, less accumulated depreciation and any accumulated impairment losses. Investment property is initially measured at cost including transaction costs. Investment property is derecognized when it has either been disposed of or when the investment property is permanently withdrawn from use and no future benefit is expected from its disposal. Any gains or
- -
7
losses on the derecognition of an investment property are recognized in the statements of income in the year of derecognition. Transfers are made to investment property when, and only when, there is a change in use, evidenced by the end of owner-occupation, commencement of an operating lease to another party or by the end of construction or development. Transfers are made from investment property when, and only when, there is a change in use, evidenced by commencement of owner-occupation or commencement of development with a view to sell.
Depreciation of investment property is computed using the straight-line method over its useful life, regardless of utilization. The estimated useful life of the investment property is 15 years.
Revised Accounting Standards
PAS 16, Property, Plant and Equipment, (a) provides additional guidance and clarification on recognition and measurement of items of property, plant and equipment; (b) requires the capitalization of the costs of asset dismantling, removal or restoration as a result of either acquiring or having used the asset for purposes other than to produce inventories during the period; and (c) requires measurement of an item of property, plant and equipment acquired in exchange for a nonmonetary asset, or a combination of monetary and nonmonetary assets, at fair value unless the exchange transaction lacks commercial substance. Under the previous version of this standard, an entity measured such an acquired asset at fair value unless the exchanged assets were similar.
The Globe Group is legally required under various lease agreements to dismantle the installations and restore the leased sites at the end of the lease contract term. The Globe Group recognizes the fair value of the liability for these obligations and capitalizes the present value of these costs as part of the balance of the related property and equipment accounts, which are being depreciated on a straight-line basis over the lower of the useful life of the related asset or the lease term. The adoption of PAS 16 decreased net income by P=19.22 million and P=21.45 million for the three months ended September 30, 2005 and 2004, respectively, and P=72.20 million and P=57.88 million for the nine months ended September 30, 2005 and 2004, respectively. Retained earnings decreased by P=258.50 million and P=187.05 million as of January 1, 2005 and 2004, respectively.
The adoption of the following revised accounting standards did not have a material effect on the Globe Group’s financial statements. Additional disclosures required by the revised accounting standards were included in the Globe Group’s financial statements.
- -
8
• PAS 1, Presentation of Financial Statements, (a) provides a framework within which an entity assesses how to present fairly the effects of transactions and other events; (b) provides the base criteria for classifying liabilities as current or noncurrent; (c) prohibits the presentation of income from operating activities and extraordinary items as separate line items in the statements of income; and (d) specifies the disclosures about key sources of estimation, uncertainty and judgments management has made in the process of applying an entity’s accounting policies (see Note 3). It also requires changes in the presentation of minority interest in the consolidated balance sheets and statements of income.
• PAS 2, Inventories, reduces the alternatives for measurement of inventories by
disallowing the use of the last in, first out formula. Moreover, the revised accounting standard does not permit foreign exchange differences arising directly on the recent acquisition of inventories invoiced in a foreign currency to be included in the cost of purchase of inventories.
• PAS 8, Accounting Policies, Changes in Accounting Estimates and Errors, (a) removes
the concept of fundamental errors and the allowed alternative to retrospective application of voluntary changes in accounting policies and retrospective restatement to correct prior period errors; (b) updates the previous hierarchy of guidance to which management refers and whose applicability it considers when selecting accounting policies in the absence of standards and interpretations that specifically apply; (c) defines material omissions or misstatements; and (d) describes how to apply the concept of materiality when applying accounting policies and correcting errors.
• PAS 10, Events After the Balance Sheet Date, provides a limited clarification of the
accounting for dividends declared after the balance sheet date.
• PAS 17, Leases, provides a limited revision to clarify the classification of a lease of land and buildings and prohibits expensing of initial direct costs in the financial statements of the lessors.
• PAS 24, Related Party Disclosures, provides additional guidance and clarity in the
scope of the standard, the definitions and disclosures for related parties. It also requires disclosure of the compensation of key management personnel by benefit type (see Note 7).
• PAS 27, Consolidated and Separate Financial Statements, reduces alternatives in
accounting for investments in subsidiaries in the separate financial statements of a parent, venturer or investor. Investments in subsidiaries will be accounted for either at cost or in accordance with PAS 39 in the separate financial statements. Equity method of accounting will no longer be allowed in the separate financial statements.
• PAS 28, Investments in Associates, reduces alternatives in accounting for investments in
associates in the separate financial statements of an investor. Investments in associates
- -
9
will be accounted for either at cost or in accordance with PAS 39 in the separate financial statements. Equity method of accounting will no longer be allowed in the separate financial statements.
PAS 27 and 28 require strict compliance with adoption of uniform accounting policies and require the parent company/investor to make appropriate adjustments to the subsidiary’s/associate’s financial statements to conform them to the parent company’s/investor’s accounting policies for reporting like transactions and other events in similar circumstances.
• PAS 31, Interests in Joint Ventures, reduces the alternatives in accounting for interests
in joint ventures in the separate financial statements of a venturer. Interests in joint ventures are accounted for either at cost or in accordance with PAS 39 in the separate financial statements. Equity method of accounting will no longer be allowed in the separate financial statements. However, the equity method is still an allowed alternative in the consolidated financial statements.
• PAS 33, Earnings Per Share, prescribes principles for the determination and
presentation of earnings per share for entities with publicly traded shares, entities in the process of issuing ordinary shares to the public, and any entities that calculate and disclose earnings per share. The standard also provides additional guidance in computing earnings per share including the effects of mandatorily convertible instruments and contingently issuable shares, among others.
• PAS 36, Impairment of Assets, establishes frequency of impairment testing for certain
intangibles and provides additional guidance on the measurement of an asset’s value in use.
• PAS 38, Intangible Assets, provides additional clarification on the definition and
recognition of certain intangibles. Moreover, this revised standard requires that an intangible asset with an indefinite useful life should not be amortized but will be tested for impairment by comparing its recoverable amount with its carrying amount annually and whenever there is an indication that the intangible asset may be impaired.
Adoption of the above new and revised accounting standards involved changes in accounting policies and the Globe Group has accordingly restated the comparative condensed consolidated interim financial statements retroactively in accordance with the transitional provisions in theses new and revised accounting standards PFRS 1. The increasing (decreasing) effects of adopting the new and revised accounting standards follow: September 30, 2004
Noncurrent
AssetsCurrent
LiabilitiesNoncurrent
Liabilities Equity
January 1, 2004
Retained Earnings
Net Income(Three Months
Ended)
Net Income(Nine Months
Ended)
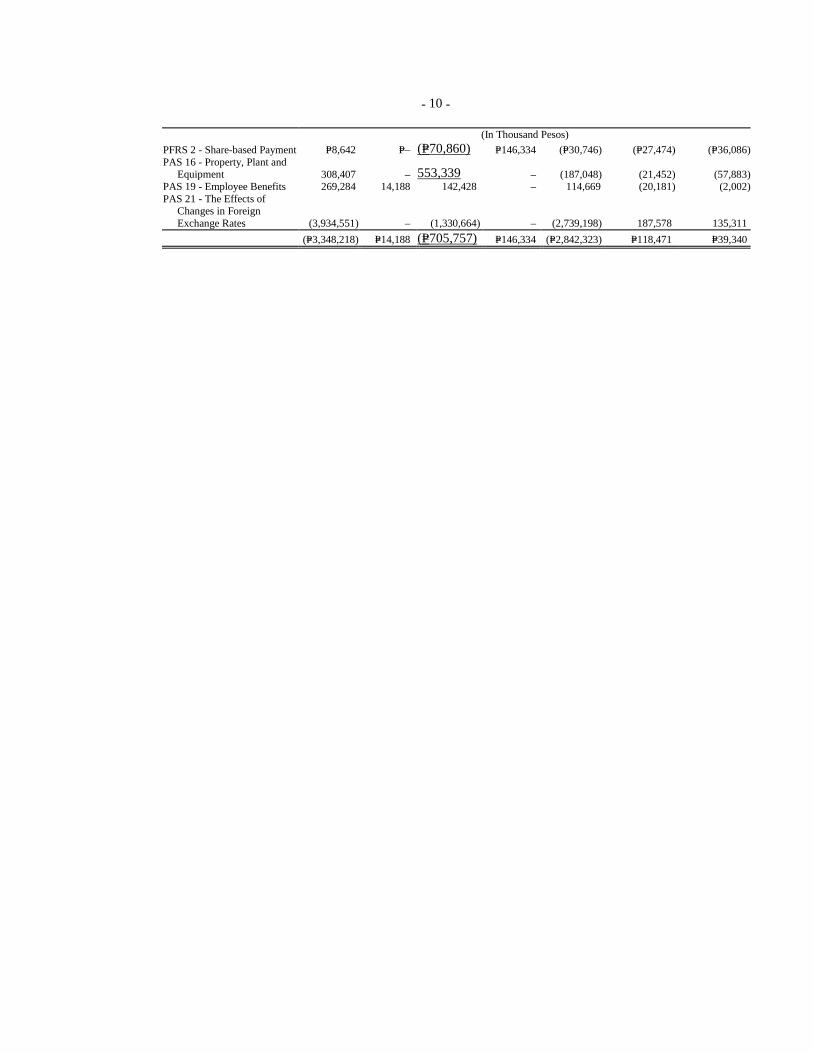
- -
10
(In Thousand Pesos)
PFRS 2 - Share-based Payment P=8,642 P=– (P=70,860) P=146,334 (P=30,746) (P=27,474) (P=36,086)PAS 16 - Property, Plant and
Equipment 308,407 – 553,339 – (187,048) (21,452) (57,883)PAS 19 - Employee Benefits 269,284 14,188 142,428 – 114,669 (20,181) (2,002)PAS 21 - The Effects of
Changes in Foreign Exchange Rates (3,934,551) – (1,330,664) – (2,739,198) 187,578 135,311
(P=3,348,218) P=14,188 (P=705,757) P=146,334 (P=2,842,323) P=118,471 P=39,340
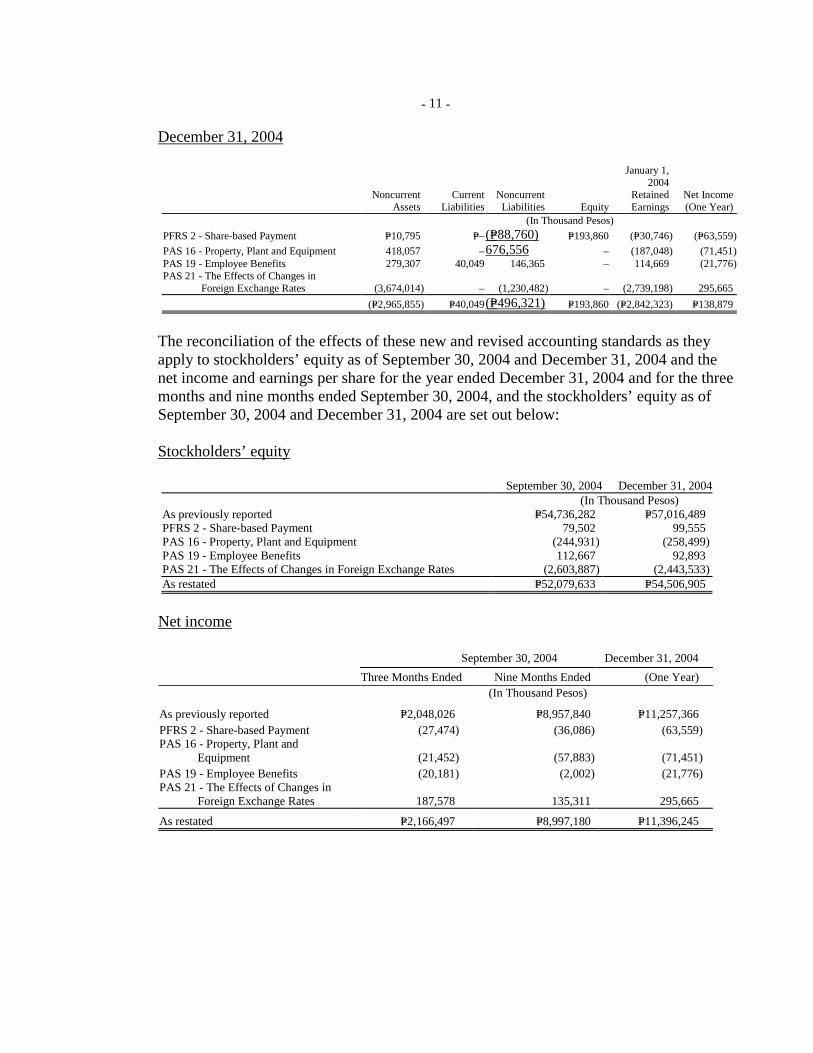
- -
11
December 31, 2004
Noncurrent
Assets Current
LiabilitiesNoncurrent
Liabilities Equity
January 1, 2004
Retained Earnings
Net Income (One Year)
(In Thousand Pesos)
PFRS 2 - Share-based Payment P=10,795 P=–(P=88,760) P=193,860 (P=30,746) (P=63,559)
PAS 16 - Property, Plant and Equipment 418,057 –676,556 – (187,048) (71,451) PAS 19 - Employee Benefits 279,307 40,049 146,365 – 114,669 (21,776) PAS 21 - The Effects of Changes in Foreign Exchange Rates (3,674,014) – (1,230,482) – (2,739,198) 295,665
(P=2,965,855) P=40,049(P=496,321) P=193,860 (P=2,842,323) P=138,879
The reconciliation of the effects of these new and revised accounting standards as they apply to stockholders’ equity as of September 30, 2004 and December 31, 2004 and the net income and earnings per share for the year ended December 31, 2004 and for the three months and nine months ended September 30, 2004, and the stockholders’ equity as of September 30, 2004 and December 31, 2004 are set out below: Stockholders’ equity September 30, 2004 December 31, 2004 (In Thousand Pesos) As previously reported P=54,736,282 P=57,016,489 PFRS 2 - Share-based Payment 79,502 99,555 PAS 16 - Property, Plant and Equipment (244,931) (258,499) PAS 19 - Employee Benefits 112,667 92,893 PAS 21 - The Effects of Changes in Foreign Exchange Rates (2,603,887) (2,443,533) As restated P=52,079,633 P=54,506,905
Net income
September 30, 2004 December 31, 2004
Three Months Ended Nine Months Ended (One Year) (In Thousand Pesos)
As previously reported P=2,048,026 P=8,957,840 P=11,257,366 PFRS 2 - Share-based Payment (27,474) (36,086) (63,559) PAS 16 - Property, Plant and Equipment (21,452) (57,883) (71,451) PAS 19 - Employee Benefits (20,181) (2,002) (21,776) PAS 21 - The Effects of Changes in Foreign Exchange Rates 187,578 135,311 295,665
As restated P=2,166,497 P=8,997,180 P=11,396,245

- -
12
Earnings per share
September 30, 2004 December 31, 2004
Three Months Ended Nine Months Ended (One Year) (In Thousand Pesos)
As previously reported P=14.50 P=63.63 P=79.93 PFRS 2 - Share-based Payment (0.20) (0.26) (0.45) PAS 16 - Property, Plant and Equipment (0.15)
(0.41) (0.51)
PAS 19 - Employee Benefits (0.14) (0.01) (0.16) PAS 21 - The Effects of Changes in Foreign Exchange Rates 1.34 0.97 2.11
As restated P=15.35 P=63.92 P=80.92
3. Management’s Use of Estimates
The preparation of the interim financial statements in conformity with Philippine GAAP requires management to make estimates and assumptions that affect the amounts reported in the condensed consolidated financial statements and accompanying notes. The estimates and assumptions used in the accompanying interim financial statements are based upon management’s evaluation of relevant facts and circumstances as of the date of the condensed consolidated financial statements. Actual results could differ from such estimates. PAS 1, Presentation of Financial Statements, which was adopted by the Globe Group effective January 1, 2005, requires disclosures about key sources of estimation, uncertainty and judgments management has made in the process of applying accounting policies. Management believes the following represent a summary of these significant estimates and judgments:
Estimated allowance for doubtful accounts The Globe Group maintains allowances for doubtful accounts at a level considered adequate to provide for potential uncollectible receivables. The level of this allowance is evaluated by management on the basis of factors that affect the collectibility of the accounts. These factors include, but are not limited to, the length of the Group’s relationship with the customer, the customer’s payment behavior and known market factors. The Globe Group reviews the age and status of receivables, and identifies accounts that are to be provided with allowances on a continuous basis. The Globe Group provides full allowance for receivables from permanently disconnected subscribers. Permanent disconnections are made after a series of collection steps following non-payment by wireless and wireline subscribers. The Globe Group also provides full allowance for individual business wireless subscribers with outstanding receivables that are past due by 90 and 120 days, respectively, and those with temporary disconnected status that are subject for termination within the succeeding months. Full allowance is also provided for residential and business wireline subscribers with outstanding receivables that are past due for 90 days and 150 days, respectively. Full allowance is likewise

- -
13
provided for receivables from wireline data corporate accounts that are past due by 150 days. Full allowance is generally provided for the net receivable from international and national traffic carriers and roaming partners which are not settled within 10 months and 6 months, respectively, from transaction date and after a review of the status of settlement of other carriers. The amount and timing of recorded expenses for any period would differ if the Globe Group made different judgments or utilized different estimates. An increase in the Globe Group allowance for doubtful accounts would increase our recorded operating expenses and decrease our current assets. Provision for doubtful accounts amounted to P=171.50 million and P=259.18 million for the three months ended September 30, 2005 and 2004, respectively, and P=627.75 million and P=1,053.62 million for the nine months ended September 30, 2005 and 2004, respectively. Receivables, net of allowance for doubtful accounts, amounted to P=6,339.95 million, P=4,957.22 million, P=5,457.91 million as of September 30, 2005 and 2004, and December 31, 2004, respectively Estimated useful lives of property and equipment, intangible assets and investment property The Globe Group estimated the useful lives of property and equipment, intangible assets and investment property based on the period over which the assets are expected to be available for use. Globe Group reviews annually the estimated useful lives of property and equipment, intangible assets and investment property based on factors that include assets utilization, internal technical evaluation, technological changes, environmental and anticipated use of the assets tempered by related industry benchmark information. It is possible that future results of operations could be materially affected by changes in estimates brought about by changes in factors mentioned. A reduction in the estimated useful lives of property and equipment, intangible assets and investment property would increase recorded depreciation and amortization expense and decrease noncurrent assets. As of September 30, 2005, property and equipment, intangible assets and investment property amounted to P=101,950.68 million. Assets Impairment Globe Group assesses the impairment of assets whenever events or changes in circumstances indicate that the carrying amount of an asset may not be recoverable. The factors that the Globe Group considers important which could trigger an impairment review include the following: • significant underperformance relative to expected historical or projected future operating results; • significant changes in the manner of use of the acquired assets or the strategy for our overall business; and • significant negative industry or economic trends.
- -
14
An impairment loss is recognized whenever the carrying amount of an asset exceeds its recoverable amount. The recoverable amount is the higher of an asset’s net selling price and value in use. The net selling price is the amount obtainable from the sale of an asset in an arm’s length transaction while value in use is the present value of estimated future cash flows expected to arise from the continuing use of an asset and from its disposal at the end of its useful life. We estimate recoverable amounts for individual assets or, if it is not possible, for the cash-generating unit to which the asset belongs. The Globe Group’s cash-generating unit is the combined wireless and wireline asset group of Globe Telecom and Innove. This asset grouping is predicated upon the requirement contained in the Executive Order (EO) 109 and Republic Act (RA) 7925 requiring licensees of cellular and International Gateway Facility (IGF) services to provide 400,000 and 300,000 Local Exchange Carriers (LEC) lines, respectively, as condition for the grant of such licenses. For the Globe Group, the recoverable amount represents the value in use. In determining the present value of estimated future cashflows expected to be generated from the continued use of the assets, Globe Group is required to make estimates and assumptions that can materially affect the consolidated financial statements. Deferred income tax assets The Globe Group reviews the carrying amounts of deferred income taxes at each balance sheet date and reduces deferred income tax assets to the extent that it is no longer probable that sufficient taxable profit will be available to allow all or part of the deferred income tax assets to be utilized. However, there is no assurance that the Globe Group will generate sufficient taxable profit to allow all or part of deferred income tax assets to be utilized. As of September 30, 2005, Innove and GXI has net deferred tax assets of P=1,640.41 million while Globe Telecom has net deferred tax liabilities of P=3,601.48 million and no unrecognized deferred income tax assets. Financial Assets and Liabilities The Globe Group carries certain financial assets and liabilities at fair value, which requires extensive use of accounting estimates and judgment. While significant components of fair value measurement were determined using verifiable objective evidence (i.e., foreign exchange rates, interest rates, volatility rates), the amount of changes in fair value would differ if the Globe Group utilized different valuation methodology. Any changes in fair value of these financial assets and liability would affect profit and loss and equity. Financial assets and liabilities carried at fair value as of September 30, 2005 amounted to P=1,253.14 million and P=254.94 million, respectively. Revenue Recognition

- -
15
The Globe Group’s revenue recognition policies require management to make use of estimates and assumptions that may affect the reported amounts of revenues and receivables. The Globe Group’s postpaid service arrangements include fixed monthly charges which are recognized over the subscription period on a pro-rata basis. Globe Group bills its postpaid subscribers throughout the month according to the bill cycles of subscribers. As a result of the bill-cycle cut-off, service revenue earned but not yet billed at end of the month are estimated and accrued. These estimates are based on actual usage less estimated free usage using historical ratio of free over billable usage. The amount of accrued but unbilled services to subscribers amounted to P=388.69 million and P=392.00 million for the nine months ended September 30, 2005 and 2004, respectively. There is no assurance that the use of estimates may not result to material adjustments in future periods.
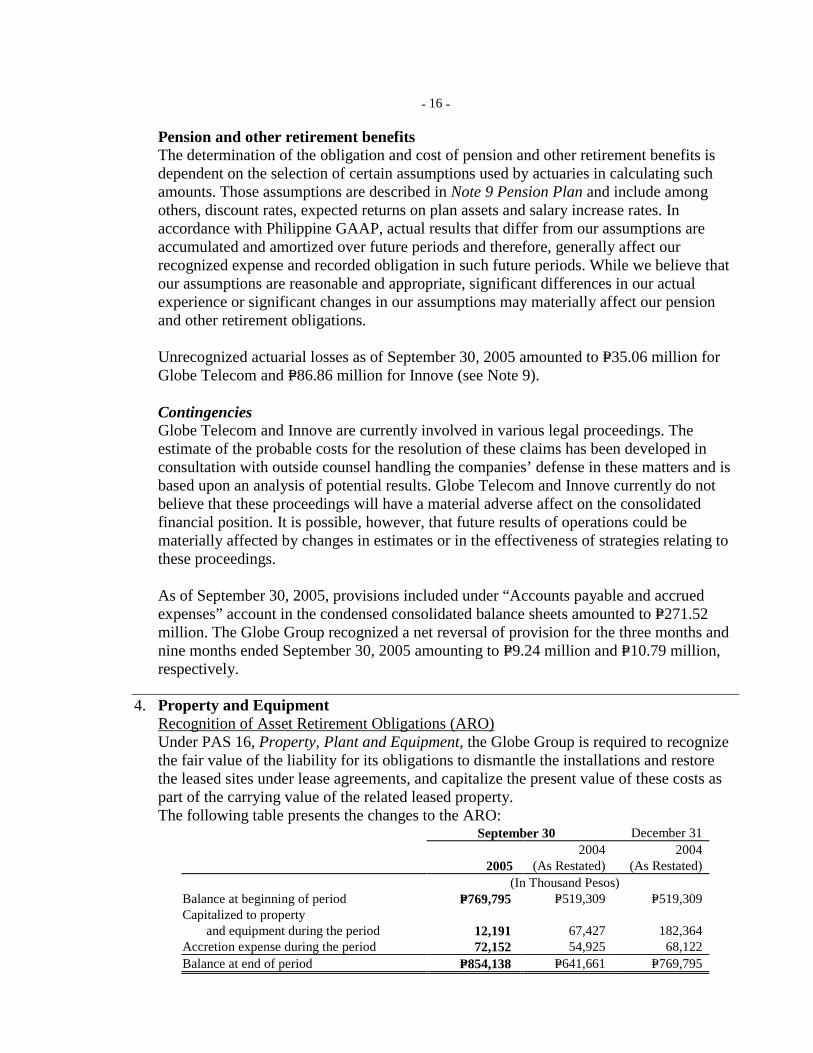
- -
16
Pension and other retirement benefits The determination of the obligation and cost of pension and other retirement benefits is dependent on the selection of certain assumptions used by actuaries in calculating such amounts. Those assumptions are described in Note 9 Pension Plan and include among others, discount rates, expected returns on plan assets and salary increase rates. In accordance with Philippine GAAP, actual results that differ from our assumptions are accumulated and amortized over future periods and therefore, generally affect our recognized expense and recorded obligation in such future periods. While we believe that our assumptions are reasonable and appropriate, significant differences in our actual experience or significant changes in our assumptions may materially affect our pension and other retirement obligations. Unrecognized actuarial losses as of September 30, 2005 amounted to P=35.06 million for Globe Telecom and P=86.86 million for Innove (see Note 9). Contingencies Globe Telecom and Innove are currently involved in various legal proceedings. The estimate of the probable costs for the resolution of these claims has been developed in consultation with outside counsel handling the companies’ defense in these matters and is based upon an analysis of potential results. Globe Telecom and Innove currently do not believe that these proceedings will have a material adverse affect on the consolidated financial position. It is possible, however, that future results of operations could be materially affected by changes in estimates or in the effectiveness of strategies relating to these proceedings. As of September 30, 2005, provisions included under “Accounts payable and accrued expenses” account in the condensed consolidated balance sheets amounted to P=271.52 million. The Globe Group recognized a net reversal of provision for the three months and nine months ended September 30, 2005 amounting to P=9.24 million and P=10.79 million, respectively.
4. Property and Equipment Recognition of Asset Retirement Obligations (ARO) Under PAS 16, Property, Plant and Equipment, the Globe Group is required to recognize the fair value of the liability for its obligations to dismantle the installations and restore the leased sites under lease agreements, and capitalize the present value of these costs as part of the carrying value of the related leased property. The following table presents the changes to the ARO:
September 30 December 31
2005 2004
(As Restated) 2004
(As Restated) (In Thousand Pesos) Balance at beginning of period P=769,795 P=519,309 P=519,309 Capitalized to property
and equipment during the period 12,191 67,427
182,364 Accretion expense during the period 72,152 54,925 68,122 Balance at end of period P=854,138 P=641,661 P=769,795
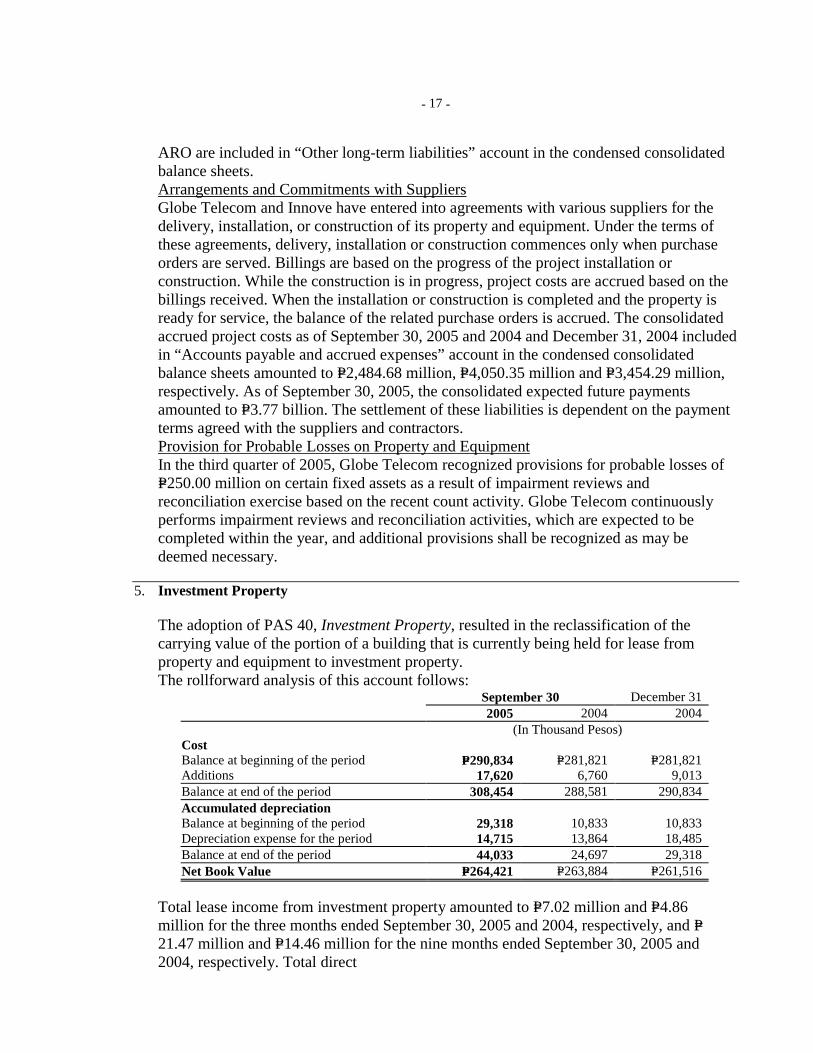
- -
17
ARO are included in “Other long-term liabilities” account in the condensed consolidated balance sheets. Arrangements and Commitments with Suppliers Globe Telecom and Innove have entered into agreements with various suppliers for the delivery, installation, or construction of its property and equipment. Under the terms of these agreements, delivery, installation or construction commences only when purchase orders are served. Billings are based on the progress of the project installation or construction. While the construction is in progress, project costs are accrued based on the billings received. When the installation or construction is completed and the property is ready for service, the balance of the related purchase orders is accrued. The consolidated accrued project costs as of September 30, 2005 and 2004 and December 31, 2004 included in “Accounts payable and accrued expenses” account in the condensed consolidated balance sheets amounted to P=2,484.68 million, P=4,050.35 million and P=3,454.29 million, respectively. As of September 30, 2005, the consolidated expected future payments amounted to P=3.77 billion. The settlement of these liabilities is dependent on the payment terms agreed with the suppliers and contractors. Provision for Probable Losses on Property and Equipment In the third quarter of 2005, Globe Telecom recognized provisions for probable losses of P=250.00 million on certain fixed assets as a result of impairment reviews and reconciliation exercise based on the recent count activity. Globe Telecom continuously performs impairment reviews and reconciliation activities, which are expected to be completed within the year, and additional provisions shall be recognized as may be deemed necessary.
5. Investment Property
The adoption of PAS 40, Investment Property, resulted in the reclassification of the carrying value of the portion of a building that is currently being held for lease from property and equipment to investment property. The rollforward analysis of this account follows:
September 30 December 31 2005 2004 2004 (In Thousand Pesos) Cost Balance at beginning of the period P=290,834 P=281,821 P=281,821 Additions 17,620 6,760 9,013 Balance at end of the period 308,454 288,581 290,834 Accumulated depreciation Balance at beginning of the period 29,318 10,833 10,833 Depreciation expense for the period 14,715 13,864 18,485 Balance at end of the period 44,033 24,697 29,318 Net Book Value P=264,421 P=263,884 P=261,516
Total lease income from investment property amounted to P=7.02 million and P=4.86 million for the three months ended September 30, 2005 and 2004, respectively, and P=21.47 million and P=14.46 million for the nine months ended September 30, 2005 and 2004, respectively. Total direct

- -
18
operating expenses related to investment property that generated rental income amounted to about P=4.88 million and P=4.62 million for the three months ended September 30, 2005 and 2004, respectively, and P=15.21 million and P=14.38 million for the nine months ended September 30, 2005 and 2004, respectively. The fair value of the investment property computed using the market data approach as of January 1, 2005 is P=317.00 million based on the report issued by an independent appraiser dated April 5, 2005.
6. Intangible Assets
The rollforward analysis of this account follows:
September 30 December 31 2005 2004 2004 (In Thousand Pesos) Cost Balance at beginning of the period P=2,265,820 P=1,807,059 P=1,807,059 Additions 422,938 169,918 477,429 Retirements/disposals/adjustments (60,224) (57,608) (18,668) Balance at end of the period P=2,628,534 P=1,919,369 P=2,265,820 Accumulated amortization Balance at beginning of the period P=1,321,555 P=1,202,108 P=1,202,108 Amortization for the period 285,491 189,123 279,424 Retirements/disposals/adjustments (59,329) (145,591) (159,977) Balance at end of the period 1,547,717 1,245,640 1,321,555 Net Book Value P=1,080,817 P=673,729 P=944,265
7. Related Party Transactions
On January 1, 2005, the Globe Group adopted PAS 24, Related Party Disclosures, which requires the following disclosures on compensation of key management personnel by benefit type:
Three Months Ended September 30
Nine Months Ended September 30
2005 2004 2005 2004 (In Thousand Pesos) Short-term employee benefits P=32,715 P=23,682 P=171,591 P=126,291 Share-based payment (see Note 10) 40,218 47,527 121,566 87,243 Post-employment benefits (see Note 9) 5,828 6,760 17,486 20,280 P=78,761 P=77,969 P=310,643 P=233,814
There are no agreements between the Globe Group and any of its directors and key
officers providing for benefits upon termination of employment, except for such benefits to which they may be entitled under the Globe Group’s retirement plan.
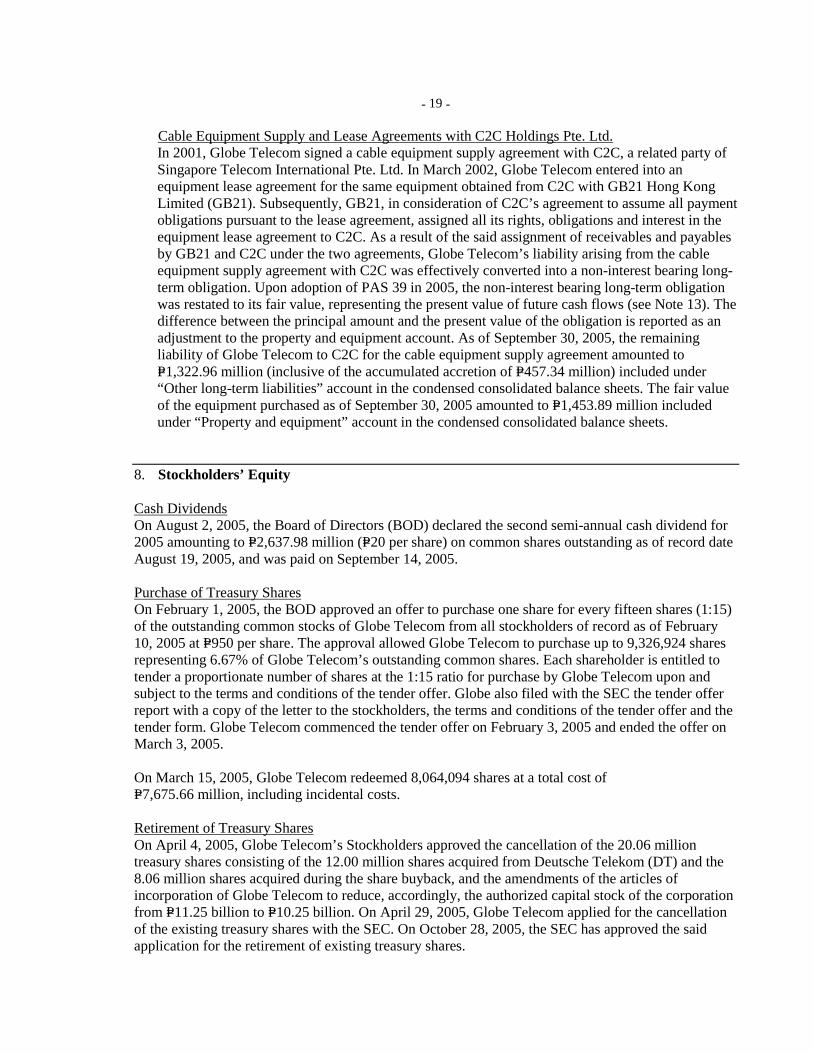
- -
19
Cable Equipment Supply and Lease Agreements with C2C Holdings Pte. Ltd. In 2001, Globe Telecom signed a cable equipment supply agreement with C2C, a related party of Singapore Telecom International Pte. Ltd. In March 2002, Globe Telecom entered into an equipment lease agreement for the same equipment obtained from C2C with GB21 Hong Kong Limited (GB21). Subsequently, GB21, in consideration of C2C’s agreement to assume all payment obligations pursuant to the lease agreement, assigned all its rights, obligations and interest in the equipment lease agreement to C2C. As a result of the said assignment of receivables and payables by GB21 and C2C under the two agreements, Globe Telecom’s liability arising from the cable equipment supply agreement with C2C was effectively converted into a non-interest bearing long-term obligation. Upon adoption of PAS 39 in 2005, the non-interest bearing long-term obligation was restated to its fair value, representing the present value of future cash flows (see Note 13). The difference between the principal amount and the present value of the obligation is reported as an adjustment to the property and equipment account. As of September 30, 2005, the remaining liability of Globe Telecom to C2C for the cable equipment supply agreement amounted to P=1,322.96 million (inclusive of the accumulated accretion of P=457.34 million) included under “Other long-term liabilities” account in the condensed consolidated balance sheets. The fair value of the equipment purchased as of September 30, 2005 amounted to P=1,453.89 million included under “Property and equipment” account in the condensed consolidated balance sheets.
8. Stockholders’ Equity Cash Dividends On August 2, 2005, the Board of Directors (BOD) declared the second semi-annual cash dividend for 2005 amounting to P=2,637.98 million (P=20 per share) on common shares outstanding as of record date August 19, 2005, and was paid on September 14, 2005. Purchase of Treasury Shares On February 1, 2005, the BOD approved an offer to purchase one share for every fifteen shares (1:15) of the outstanding common stocks of Globe Telecom from all stockholders of record as of February 10, 2005 at P=950 per share. The approval allowed Globe Telecom to purchase up to 9,326,924 shares representing 6.67% of Globe Telecom’s outstanding common shares. Each shareholder is entitled to tender a proportionate number of shares at the 1:15 ratio for purchase by Globe Telecom upon and subject to the terms and conditions of the tender offer. Globe also filed with the SEC the tender offer report with a copy of the letter to the stockholders, the terms and conditions of the tender offer and the tender form. Globe Telecom commenced the tender offer on February 3, 2005 and ended the offer on March 3, 2005. On March 15, 2005, Globe Telecom redeemed 8,064,094 shares at a total cost of P=7,675.66 million, including incidental costs.
Retirement of Treasury Shares On April 4, 2005, Globe Telecom’s Stockholders approved the cancellation of the 20.06 million treasury shares consisting of the 12.00 million shares acquired from Deutsche Telekom (DT) and the 8.06 million shares acquired during the share buyback, and the amendments of the articles of incorporation of Globe Telecom to reduce, accordingly, the authorized capital stock of the corporation from P=11.25 billion to P=10.25 billion. On April 29, 2005, Globe Telecom applied for the cancellation of the existing treasury shares with the SEC. On October 28, 2005, the SEC has approved the said application for the retirement of existing treasury shares.
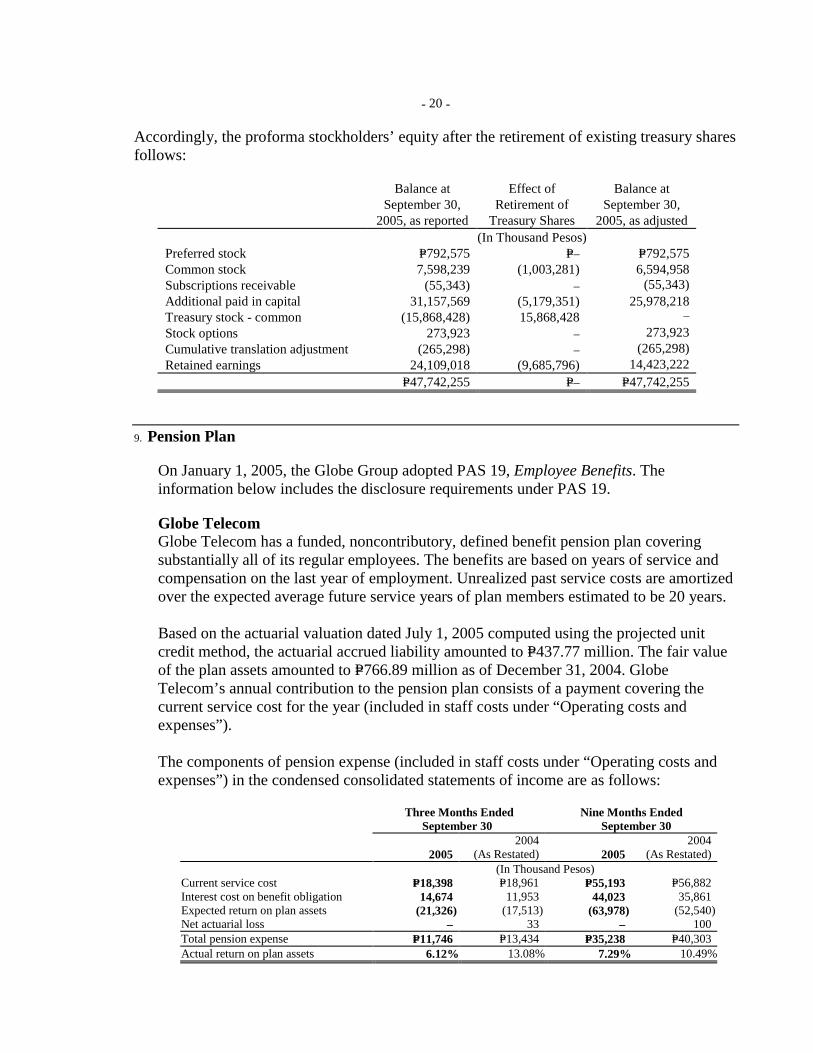
- -
20
Accordingly, the proforma stockholders’ equity after the retirement of existing treasury shares follows:
Balance at September 30,
2005, as reported
Effect of Retirement of
Treasury Shares
Balance at September 30,
2005, as adjusted (In Thousand Pesos) Preferred stock P=792,575 P=– P=792,575 Common stock 7,598,239 (1,003,281) 6,594,958 Subscriptions receivable (55,343) – (55,343) Additional paid in capital 31,157,569 (5,179,351) 25,978,218 Treasury stock - common (15,868,428) 15,868,428 – Stock options 273,923 – 273,923 Cumulative translation adjustment (265,298) – (265,298) Retained earnings 24,109,018 (9,685,796) 14,423,222 P=47,742,255 P=– P=47,742,255
9. Pension Plan
On January 1, 2005, the Globe Group adopted PAS 19, Employee Benefits. The information below includes the disclosure requirements under PAS 19.
Globe Telecom Globe Telecom has a funded, noncontributory, defined benefit pension plan covering substantially all of its regular employees. The benefits are based on years of service and compensation on the last year of employment. Unrealized past service costs are amortized over the expected average future service years of plan members estimated to be 20 years. Based on the actuarial valuation dated July 1, 2005 computed using the projected unit credit method, the actuarial accrued liability amounted to P=437.77 million. The fair value of the plan assets amounted to P=766.89 million as of December 31, 2004. Globe Telecom’s annual contribution to the pension plan consists of a payment covering the current service cost for the year (included in staff costs under “Operating costs and expenses”).
The components of pension expense (included in staff costs under “Operating costs and expenses”) in the condensed consolidated statements of income are as follows:
Three Months Ended
September 30 Nine Months Ended
September 30
2005 2004
(As Restated) 2005 2004
(As Restated) (In Thousand Pesos) Current service cost P=18,398 P=18,961 P=55,193 P=56,882 Interest cost on benefit obligation 14,674 11,953 44,023 35,861 Expected return on plan assets (21,326) (17,513) (63,978) (52,540) Net actuarial loss – 33 – 100 Total pension expense P=11,746 P=13,434 P=35,238 P=40,303 Actual return on plan assets 6.12% 13.08% 7.29% 10.49%
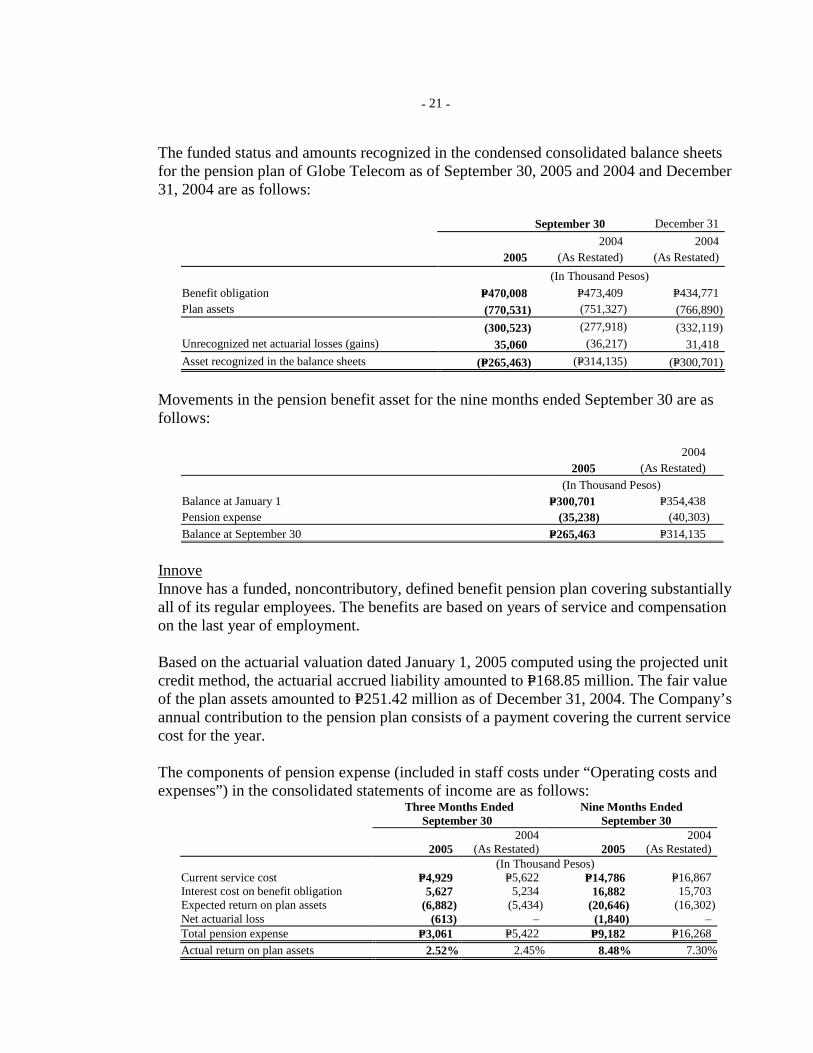
- -
21
The funded status and amounts recognized in the condensed consolidated balance sheets for the pension plan of Globe Telecom as of September 30, 2005 and 2004 and December 31, 2004 are as follows:
September 30 December 31
2005
2004 (As Restated)
2004 (As Restated)
(In Thousand Pesos)
Benefit obligation P=470,008 P=473,409 P=434,771 Plan assets (770,531) (751,327) (766,890)
(300,523) (277,918) (332,119) Unrecognized net actuarial losses (gains) 35,060 (36,217) 31,418
Asset recognized in the balance sheets (P=265,463) (P=314,135) (P=300,701)
Movements in the pension benefit asset for the nine months ended September 30 are as follows:
2005 2004
(As Restated)
(In Thousand Pesos) Balance at January 1 P=300,701 P=354,438 Pension expense (35,238) (40,303)
Balance at September 30 P=265,463 P=314,135
Innove Innove has a funded, noncontributory, defined benefit pension plan covering substantially all of its regular employees. The benefits are based on years of service and compensation on the last year of employment. Based on the actuarial valuation dated January 1, 2005 computed using the projected unit credit method, the actuarial accrued liability amounted to P=168.85 million. The fair value of the plan assets amounted to P=251.42 million as of December 31, 2004. The Company’s annual contribution to the pension plan consists of a payment covering the current service cost for the year. The components of pension expense (included in staff costs under “Operating costs and expenses”) in the consolidated statements of income are as follows:
Three Months Ended
September 30 Nine Months Ended
September 30
2005 2004
(As Restated) 2005 2004
(As Restated) (In Thousand Pesos) Current service cost P=4,929 P=5,622 P=14,786 P=16,867 Interest cost on benefit obligation 5,627 5,234 16,882 15,703 Expected return on plan assets (6,882) (5,434) (20,646) (16,302) Net actuarial loss (613) – (1,840) – Total pension expense P=3,061 P=5,422 P=9,182 P=16,268
Actual return on plan assets 2.52% 2.45% 8.48% 7.30%
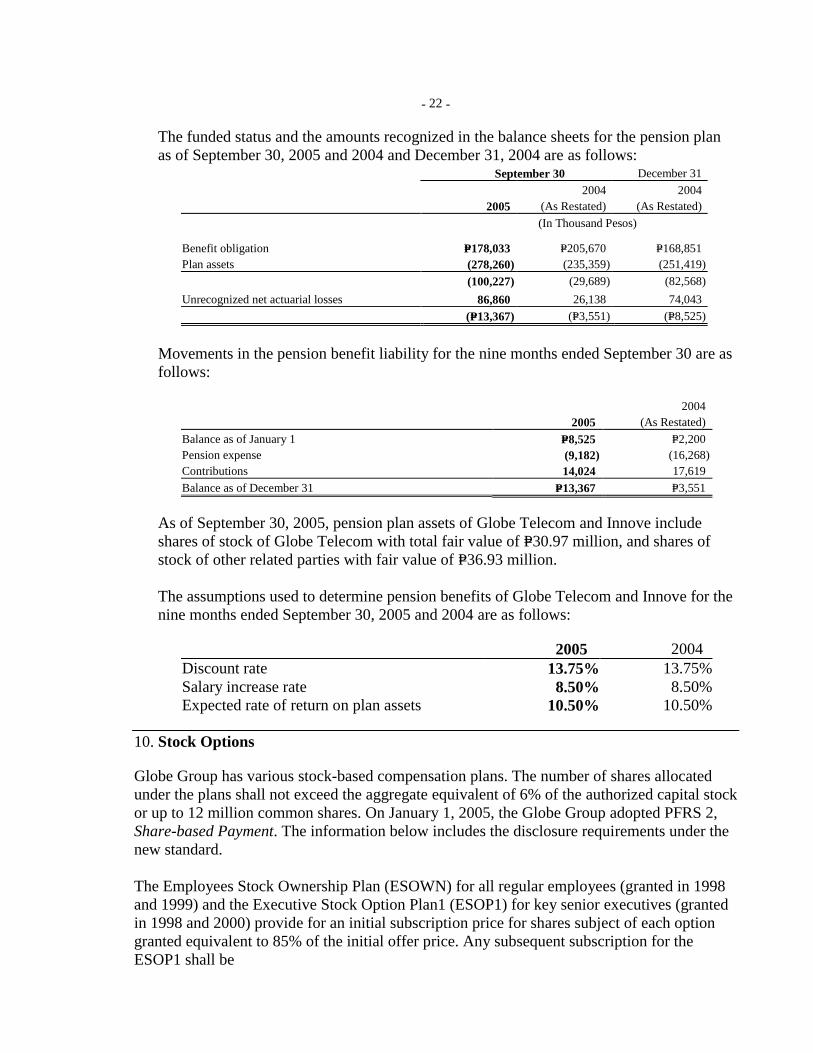
- -
22
The funded status and the amounts recognized in the balance sheets for the pension plan as of September 30, 2005 and 2004 and December 31, 2004 are as follows:
September 30 December 31
2005
2004 (As Restated)
2004 (As Restated)
(In Thousand Pesos)
Benefit obligation P=178,033 P=205,670 P=168,851 Plan assets (278,260) (235,359) (251,419)
(100,227) (29,689) (82,568)
Unrecognized net actuarial losses 86,860 26,138 74,043
(P=13,367) (P=3,551) (P=8,525)
Movements in the pension benefit liability for the nine months ended September 30 are as follows:
2005 2004
(As Restated)
Balance as of January 1 P=8,525 P=2,200 Pension expense (9,182) (16,268) Contributions 14,024 17,619
Balance as of December 31 P=13,367 P=3,551
As of September 30, 2005, pension plan assets of Globe Telecom and Innove include shares of stock of Globe Telecom with total fair value of P=30.97 million, and shares of stock of other related parties with fair value of P=36.93 million. The assumptions used to determine pension benefits of Globe Telecom and Innove for the nine months ended September 30, 2005 and 2004 are as follows:
2005 2004 Discount rate 13.75% 13.75% Salary increase rate 8.50% 8.50% Expected rate of return on plan assets 10.50% 10.50%
10. Stock Options Globe Group has various stock-based compensation plans. The number of shares allocated under the plans shall not exceed the aggregate equivalent of 6% of the authorized capital stock or up to 12 million common shares. On January 1, 2005, the Globe Group adopted PFRS 2, Share-based Payment. The information below includes the disclosure requirements under the new standard. The Employees Stock Ownership Plan (ESOWN) for all regular employees (granted in 1998 and 1999) and the Executive Stock Option Plan1 (ESOP1) for key senior executives (granted in 1998 and 2000) provide for an initial subscription price for shares subject of each option granted equivalent to 85% of the initial offer price. Any subsequent subscription for the ESOP1 shall be
- -
23
for a price equivalent to 85% of the average closing price for the month prior to the month of eligibility. These options are settled in equity once exercised. The qualified officers and employees shall pay for the shares subscribed under the ESOP1 and ESOWN through installments over a maximum period of ten years and five years, respectively. The shares of stock have a holding period of five years and the employees must remain with Globe Telecom or its affiliates over such period. The plans also provide restrictions on sale or assignment of shares for five years from date of subscription. Exercised shares under ESOP1 totaled 1,712,133 shares with a weighted average exercise price of P=196.75 a share. The remaining stock options under ESOWN and ESOP1 have expired in 2004. On April 4, 2003, Globe Telecom granted additional stock options to key executives and senior management personnel of the Globe Group under the Executive Stock Option Plan 2 (ESOP2). It required the grantees to pay a nonrefundable option purchase price of P=1,000.00. As of September 30, 2005, a total of 680,200 stock options were granted to key executives and senior management personnel. ESOP2 provides for an exercise price of P=547.00, which is the average quoted market price of the last 20 trading days preceding April 4, 2003. These options are settled in equity once exercised. Fifty percent of the options become exercisable from April 4, 2005 to April 4, 2013, while the remaining fifty percent becomes exercisable from April 4, 2006 to April 4, 2013. In order to avail of the privilege, the grantees must remain with Globe Telecom or its affiliates from grant date up to the beginning of the exercise period of the corresponding shares. On July 1, 2004, Globe Telecom granted additional stock options to key executives and senior management personnel of the Globe Group under the ESOP2. It required the grantees to pay a nonrefundable option purchase price of P=1,000.00. As of September 30, 2005, a total of 803,800 stock options were granted to key executives and senior management personnel. The agreement provides for an exercise price of P=840.75 per share. These options are settled in equity once exercised. Fifty percent of the options become exercisable from July 1, 2006 to June 30, 2014, while the remaining fifty percent become exercisable from July 1, 2007 to June 30, 2014. In order to avail of the privilege, the grantees must remain with Globe Telecom or its affiliates from grant date up to the beginning of the exercise period of the corresponding shares. The stock options granted under ESOP2 include options granted by Innove to its employees, in accordance with the same terms and conditions under which such options were extended to Globe employees. Under an intercompany agreement between Globe and Innove, Innove shall compensate Globe for the excess of the market price of the shares and the exercise price of the options.
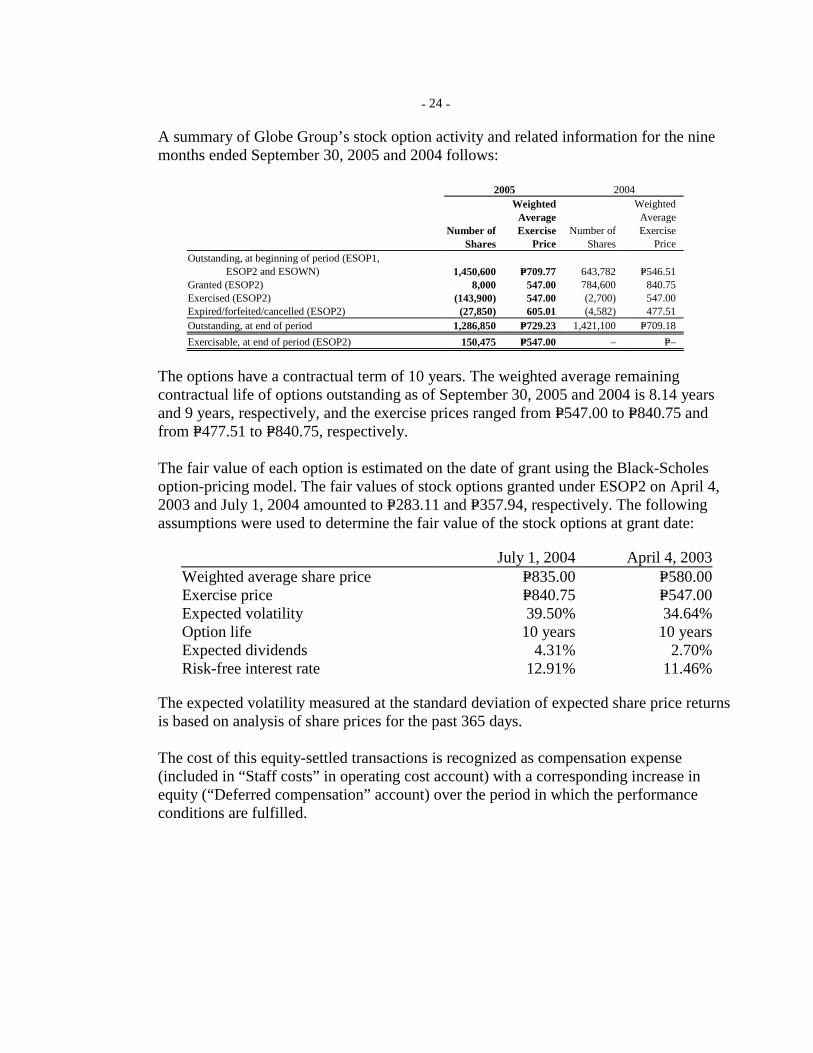
- -
24
A summary of Globe Group’s stock option activity and related information for the nine months ended September 30, 2005 and 2004 follows:
2005 2004
Number of
Shares
Weighted Average Exercise
Price Number of
Shares
Weighted Average Exercise
Price Outstanding, at beginning of period (ESOP1, ESOP2 and ESOWN) 1,450,600 P=709.77 643,782 P=546.51 Granted (ESOP2) 8,000 547.00 784,600 840.75 Exercised (ESOP2) (143,900) 547.00 (2,700) 547.00 Expired/forfeited/cancelled (ESOP2) (27,850) 605.01 (4,582) 477.51 Outstanding, at end of period 1,286,850 P=729.23 1,421,100 P=709.18
Exercisable, at end of period (ESOP2) 150,475 P=547.00 – P=–
The options have a contractual term of 10 years. The weighted average remaining contractual life of options outstanding as of September 30, 2005 and 2004 is 8.14 years and 9 years, respectively, and the exercise prices ranged from P=547.00 to P=840.75 and from P=477.51 to P=840.75, respectively. The fair value of each option is estimated on the date of grant using the Black-Scholes option-pricing model. The fair values of stock options granted under ESOP2 on April 4, 2003 and July 1, 2004 amounted to P=283.11 and P=357.94, respectively. The following assumptions were used to determine the fair value of the stock options at grant date:
July 1, 2004 April 4, 2003 Weighted average share price P=835.00 P=580.00 Exercise price P=840.75 P=547.00 Expected volatility 39.50% 34.64% Option life 10 years 10 years Expected dividends 4.31% 2.70% Risk-free interest rate 12.91% 11.46%
The expected volatility measured at the standard deviation of expected share price returns is based on analysis of share prices for the past 365 days.
The cost of this equity-settled transactions is recognized as compensation expense (included in “Staff costs” in operating cost account) with a corresponding increase in equity (“Deferred compensation” account) over the period in which the performance conditions are fulfilled.
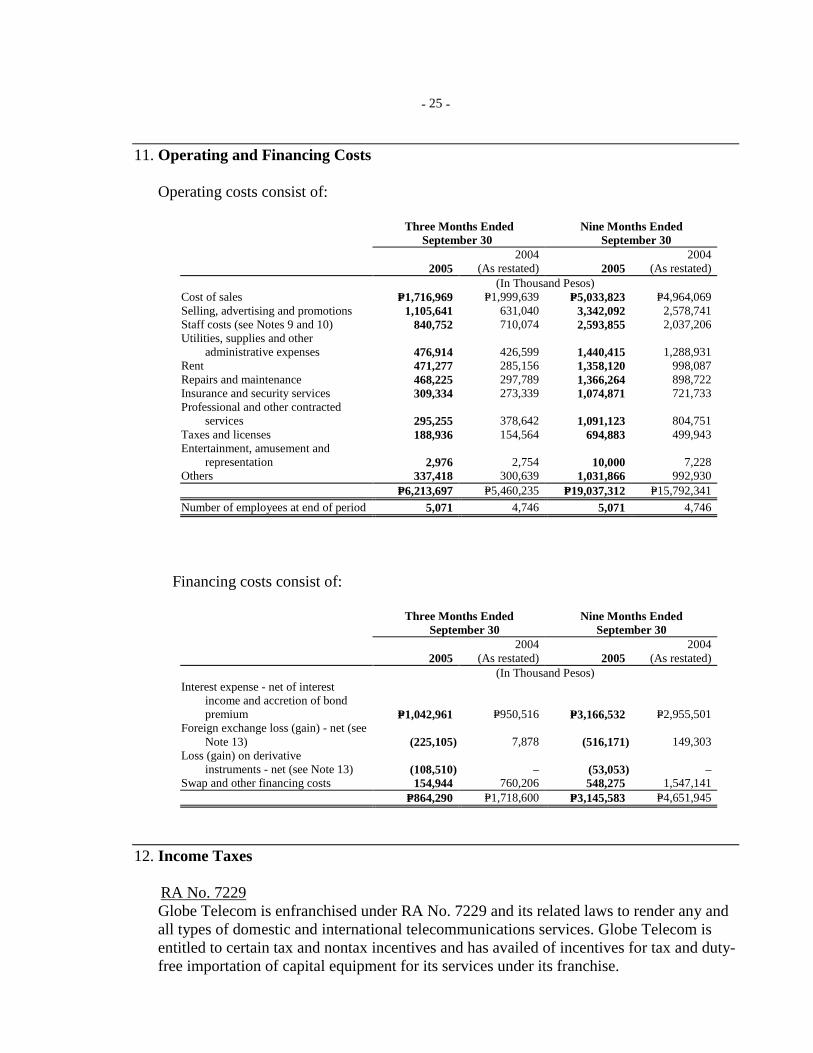
- -
25
11. Operating and Financing Costs Operating costs consist of:
Three Months Ended
September 30 Nine Months Ended
September 30
2005 2004
(As restated) 2005 2004
(As restated) (In Thousand Pesos) Cost of sales P=1,716,969 P=1,999,639 P=5,033,823 P=4,964,069 Selling, advertising and promotions 1,105,641 631,040 3,342,092 2,578,741 Staff costs (see Notes 9 and 10) 840,752 710,074 2,593,855 2,037,206 Utilities, supplies and other
administrative expenses 476,914 426,599 1,440,415 1,288,931 Rent 471,277 285,156 1,358,120 998,087 Repairs and maintenance 468,225 297,789 1,366,264 898,722 Insurance and security services 309,334 273,339 1,074,871 721,733 Professional and other contracted
services 295,255 378,642 1,091,123 804,751 Taxes and licenses 188,936 154,564 694,883 499,943 Entertainment, amusement and
representation 2,976 2,754 10,000 7,228 Others 337,418 300,639 1,031,866 992,930 P=6,213,697 P=5,460,235 P=19,037,312 P=15,792,341
Number of employees at end of period 5,071 4,746 5,071 4,746
Financing costs consist of:
Three Months Ended
September 30 Nine Months Ended
September 30
2005 2004
(As restated) 2005 2004
(As restated) (In Thousand Pesos) Interest expense - net of interest
income and accretion of bond premium P=1,042,961 P=950,516 P=3,166,532 P=2,955,501
Foreign exchange loss (gain) - net (see Note 13) (225,105) 7,878 (516,171) 149,303
Loss (gain) on derivative instruments - net (see Note 13) (108,510) – (53,053) –
Swap and other financing costs 154,944 760,206 548,275 1,547,141 P=864,290 P=1,718,600 P=3,145,583 P=4,651,945
12. Income Taxes RA No. 7229
Globe Telecom is enfranchised under RA No. 7229 and its related laws to render any and all types of domestic and international telecommunications services. Globe Telecom is entitled to certain tax and nontax incentives and has availed of incentives for tax and duty-free importation of capital equipment for its services under its franchise.
- -
26
In July 2001, the Board of Investment (BOI) approved Globe Telecom’s application as an expanding operator of telecommunications systems and granted its Phase 8 expansion project a pioneer status. In March 2002, the BOI issued the certificate of registration, which entitled Globe Telecom to income tax holiday (ITH) for the next three years. The ITH commenced on April 1, 2002, the date when Phase 8 expansion was placed in commercial operations. The ITH expired on March 31, 2005. RA No. 9337 RA No. 9337 was enacted into law amending various provisions in the existing 1997 National Internal Revenue Code. Among the reforms introduced by the said RA, which will become effective on November 1, 2005, are as follows:
• Increase in the corporate income tax rate from 32% to 35% with a reduction thereof to 30% beginning January 1, 2009; • Grant of authority to the Philippine President to increase the 10% value added tax (VAT) rate to 12%, effective January 1, 2006, subject to compliance with certain economic conditions; • Revise invoicing and reporting requirements for VAT; • Expand scope of transactions subject to VAT; and, • Provide thresholds and limitations on the amounts of VAT credits that can be claimed.
On October 18, 2005, the Supreme Court (SC) has rendered its final decision declaring the validity of the RA No. 9337 which includes, among others, provisions for the increase in corporate income tax rate from 32% to 35%, and later on reducing the rate to 30% beginning January 1, 2009. The new EVAT law will become effective November 1, 2005. Paragraph 47 of PAS 12 provides that “Deferred tax assets and liabilities shall be measured at the tax rates that are expected to apply to the period when the asset is realized or the liability is settled, based on tax rates (and tax laws) that have been enacted or substantively enacted by the balance sheet date.” For the September 30, 2005 condensed consolidated financial statements, the Globe Group did not adjust the tax rate used in the computation of its deferred tax assets and liabilities. It used the tax rate of 32% instead of the new tax rates provided under RA No. 9337, which is considered substantively enacted as of September 30, 2005. The Group will reflect the effects of the change in the tax rate in the fourth quarter financial statements.
13. Financial Instruments
Financial Risk Management Objectives and Policies The main purpose of the Globe Group’s financial instruments is to fund its operations and capital expenditures. The main risks arising from the use of financial instruments are liquidity risk, foreign currency risk, interest rate risk, and credit risk. Globe Telecom also enters into derivative transactions, the purpose of which is to manage the currency and interest rate risk arising from its financial instruments.

- -
27
The BOD reviews and agrees with policies for managing each of these risks. The Globe Group monitors market price risk arising from all financial instruments and regularly report financial management activities and the results of these activities to the BOD.
The Globe Group’s risk management policies are summarized below:
Interest Rate Risk The Globe Group’s exposure to market risk for changes in interest rates relates primarily to the Company’s long-term debt obligations.
Globe Telecom’s policy is to manage its interest cost using a mix of fixed and variable rate debt. The Globe Group’s policy is to keep a maximum of 75% of its borrowings at fixed rates of interest. To manage this mix in a cost-efficient manner, the Globe Group enters into interest rate swaps, in which the Company agrees to exchange, at specified intervals, the difference between fixed and variable interest amounts calculated by reference to an agreed-upon notional principal amount.
As of September 30, 2005, after taking into account the effect of interest rate swaps, 65% of the Globe Group’s borrowings are at a fixed rate of interest.
Foreign Exchange Risk The Globe Group’s foreign exchange risk results primarily from movements of the Philippine Peso (PHP) against the United States Dollar (USD). Majority of revenues are generated in PHP, while substantially all of capital expenditures are in USD. In addition, 71% of debt as of September 30, 2005 was denominated in USD.
It is Globe Telecom’s policy to hedge its foreign currency denominated debt such that the sum of PHP debt and USD debt that has been swapped to PHP shall comprise at least 50% of total outstanding debt. Globe Telecom enters into short-term foreign currency forwards and long-term foreign currency swap contracts in order to achieve this target. As of September 30, 2005, the amount of USD debt that has been swapped to PHP and PHP-denominated loans amounted to approximately 48% of the total debt.
Credit Risk All regular applicants for postpaid service are subject to standard credit verification procedures. The Credit Management unit of Globe Group continuously provides credit notification and implements differentiated credit actions, depending on assessed risks, to minimize credit exposure. Receivable balances of postpaid subscribers are being monitored on a regular basis and appropriate actions are executed. Likewise, net receivable balances from carriers of traffic are also being monitored and subjected to appropriate actions to manage credit risk.
With respect to credit risk arising from the other financial assets of the Globe Group, which comprise cash and cash equivalents, available-for-sale financial assets and certain derivative instruments, the Globe Group’s exposure to credit risk arises from default of the counterparty, with a maximum exposure equal to the carrying amount of these instruments. The Globe Group has a counterparty credit risk management policy which allocates investment limits based on counterparty credit ratings and credit risk profile.

- -
28
Liquidity Risk The Globe Group seeks to manage its liquidity profile to be able to finance capital expenditures and service maturing debts. To cover its financing requirements, the Globe Group intends to use internally generated funds and available long-term and short-term credit facilities. As of September 30, 2005, the Globe Group had US$9.00 million in undrawn committed long-term credit facilities and US$133.00 million in undrawn uncommitted short-term credit lines.
As part of its liquidity risk management, Globe Telecom regularly evaluates its projected and actual cash flows. It also continuously assesses conditions in the financial markets for opportunities to pursue fund raising activities, in case any requirements arise. Fund raising activities may include bank loans, export credit agency facilities, and capital market issues.
Hedging Objectives and Policies The Globe Group uses a combination of natural hedges and derivative hedging to manage its foreign exchange exposure. It uses interest rate derivatives to reduce earnings volatility related to interest rate movements.
It is the Globe Group’s policy to ensure that capabilities exist for active but conservative management of its foreign exchange and interest rate risks. The Globe Group does not engage in any speculative derivative transactions. Authorized derivative instruments include currency forward contracts (freestanding and embedded), currency swap contracts, interest rate swap contracts and currency option contracts (freestanding and embedded). Certain currency swaps are entered into in combination with options or contain a structured provision.
Carrying Value Fair Value (In Thousand Pesos) Financial assets: Cash and cash equivalents P=7,979,398 P=7,979,398 Receivables - net 6,339,947 6,339,947 Derivative assets (included in prepayments
and other current assets and other noncurrent assets accounts) 1,253,138 1,253,138
Investments in available-for-sale securities (included in short-term investments and investments in associates, joint venture and others accounts) 1,016,321 1,016,321
Investments in held-to-maturity securities (included in short-term investments) 844,342 849,427
Financial liabilities: Accounts payable and accrued expenses 15,075,614 15,075,614 Long-term debt (including current portion) 52,908,590 56,040,511 Derivative liabilities (included in accounts payable and accrued
expenses and other long-term liabilities accounts) 254,938 254,938 Other long-term debt (including current portion) 2,862,248 2,901,135

- -
29
Traffic settlement receivable and payable accounts, included as part of the Receivables - net and Accounts payable and accrued expenses accounts, respectively, in the above table, are presented net of any related payable or receivable balances with the same telecommunication carriers only when there is a right of offset under the traffic settlement agreements and that the accounts are settled on a net basis.
- -
30
Fair Value of Financial Instruments The following methods and assumptions were used to estimate the fair value of each class of financial instrument for which it is practicable to estimate such value:
Financial Liabilities The fair value of Globe Telecom’s outstanding Senior Notes due 2012 is based on the quoted market price of the Notes. The fair value of other fixed rate interest bearing loans is based on the discounted value of future cash flows using the applicable rates for similar types of loans. For variable rate loans, the carrying value approximates the fair value because of recent and regular repricing based on current market rates. For non-interest bearing obligations, the fair value is estimated as the present value of all future cash flows discounted using the prevailing market rate of interest for a similar instrument. The difference between the principal amount and the present value is reported as income or as an adjustment to a related non-financial asset. Interest expense is subsequently recognized for the accretion of the obligation to its face value.
Derivative Instruments The fair value of forward exchange contracts is calculated by reference to current forward exchange rates for contracts with similar maturity profiles.
The fair value of embedded foreign exchange derivatives in notes that have been purchased by Globe Telecom is calculated by reference to the current price of the note and the change in the foreign exchange rate that is linked to the note.
The fair values of interest rate swaps, currency and cross currency swap transactions are determined using valuation techniques with assumptions that are based on market conditions existing at balance sheet date. The fair value of interest rate swap transactions is the net present value of the estimated future cash flows. Currency and cross currency swaps transactions are marked to market based on changes in the term structure of interest rates of each currency and the spot rate. The fair values of structured swaps transactions are determined based on quotes obtained from counterparty banks.
Embedded currency option and forward contracts are valued using the simple option pricing model of Bloomberg. The embedded call option on the 2012 Senior Notes is also valued using Bloomberg models.

- -
31
Derivative Financial Instruments Globe Group’s freestanding and embedded derivative financial instruments are accounted for as hedges or transactions not designated as hedges. The table below sets out the information about Globe Group’s derivative financial instruments and the related mark-to-market gain or loss as of September 30, 2005:
2005 Notional
Amount (in USD)
Notional Amount
(in PHP)
Mark-to-market
Gain (Loss) (In Thousands) Derivative instruments designated as hedges: Cash flow hedges: Currency and cross currency swap $93,755 P=– (P=145,205) Interest rate swap 56,163 – 52,657 Derivative instruments not designated as hedges:
Freestanding: Currency swaps and cross currency swaps 84,977 – (92,220) Interest rate swaps 5,000 1,000,000 581 Sold currency call options 27,700 – (11,219) Non-deliverable forwards 2,879 – 16,778 Embedded: Call option on 2012 Senior Notes 300,000 – 1,103,307 Embedded currency forwards 47,064 – 68,911 DLPN – 150,000 2,781 Embedded currency options 1,467 – 1,829 Net $619,005 P=1,150,000 P=998,200
The subsequent sections will discuss Globe Group’s derivative financial instruments according to the type of financial risk being managed and the details of derivative financial instruments that are categorized into those accounted for as hedges and those that are not designated as hedges.
Foreign exchange and interest rate risks Information on Globe Group’s foreign currency-denominated monetary assets and liabilities and their Philippine peso equivalents are as follows:
September 30 December 31
2005 2004 2004
U.S.
Dollar Peso
Equivalent U.S.
Dollar Peso
Equivalent U.S.
Dollar Peso
Equivalent
(In Thousands) Assets Cash and cash equivalents $67,898 P=3,800,711 $192,334P=10,823,768 $111,064P=6,257,457 Short-term investments – – – – 9,574 539,409 Traffic settlements receivable 47,207 2,642,494 60,213 3,388,557 48,541 2,734,848 Other current assets 6,043 338,281 12,768 718,547 587 33,072 121,148 6,781,486 265,315 14,930,872 169,766 9,564,786
(Forward)
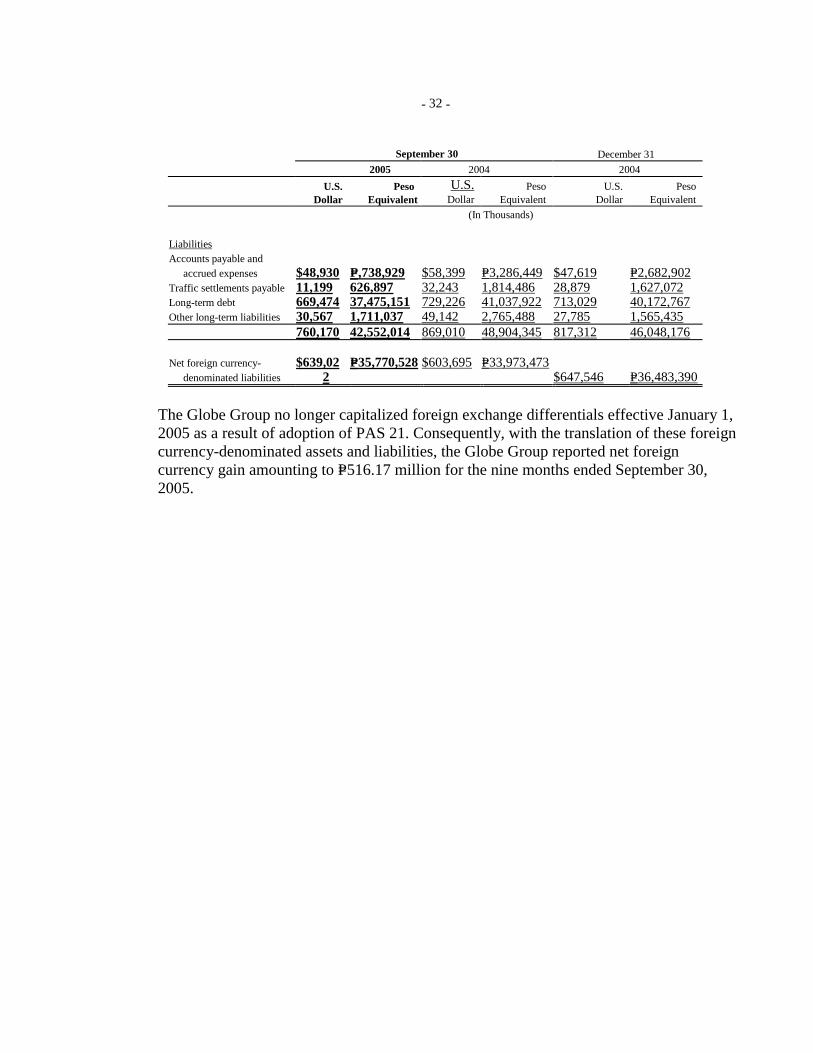
- -
32
September 30 December 31
2005 2004 2004
U.S.
Dollar Peso
Equivalent U.S.
Dollar Peso
Equivalent U.S.
Dollar Peso
Equivalent
(In Thousands) Liabilities Accounts payable and
accrued expenses $48,930
P=,738,929
$58,399
P=3,286,449 $47,619 P=2,682,902
Traffic settlements payable 11,199 626,897 32,243 1,814,486 28,879 1,627,072 Long-term debt 669,474 37,475,151 729,226 41,037,922 713,029 40,172,767 Other long-term liabilities 30,567 1,711,037 49,142 2,765,488 27,785 1,565,435 760,170 42,552,014 869,010 48,904,345 817,312 46,048,176
Net foreign currency-denominated liabilities
$639,02
2
P=35,770,528
$603,695
P=33,973,473
$647,546 P=36,483,390
The Globe Group no longer capitalized foreign exchange differentials effective January 1, 2005 as a result of adoption of PAS 21. Consequently, with the translation of these foreign currency-denominated assets and liabilities, the Globe Group reported net foreign currency gain amounting to P=516.17 million for the nine months ended September 30, 2005.
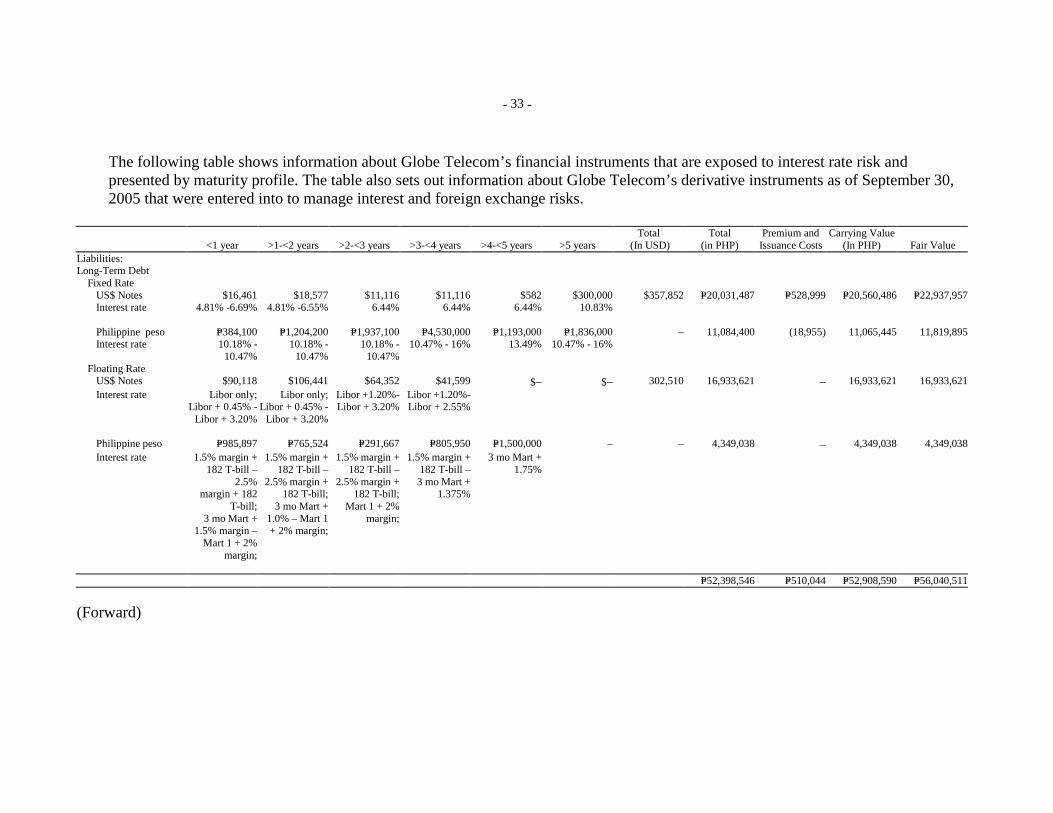
- -
33
The following table shows information about Globe Telecom’s financial instruments that are exposed to interest rate risk and presented by maturity profile. The table also sets out information about Globe Telecom’s derivative instruments as of September 30, 2005 that were entered into to manage interest and foreign exchange risks.
<1 year >1-<2 years >2-<3 years >3-<4 years >4-<5 years >5 years Total
(In USD) Total
(in PHP) Premium and
Issuance Costs Carrying Value
(In PHP) Fair Value Liabilities: Long-Term Debt Fixed Rate US$ Notes $16,461 $18,577 $11,116 $11,116 $582 $300,000 $357,852 P=20,031,487 P=528,999 P=20,560,486 P=22,937,957 Interest rate 4.81% -6.69% 4.81% -6.55% 6.44% 6.44% 6.44% 10.83% Philippine peso P=384,100 P=1,204,200 P=1,937,100 P=4,530,000 P=1,193,000 P=1,836,000 – 11,084,400 (18,955) 11,065,445 11,819,895 Interest rate 10.18% -
10.47%10.18% -
10.47% 10.18% -
10.47%10.47% - 16% 13.49% 10.47% - 16%
Floating Rate US$ Notes $90,118 $106,441 $64,352 $41,599 $– $– 302,510 16,933,621 – 16,933,621 16,933,621 Interest rate Libor only;
Libor + 0.45% -Libor + 3.20%
Libor only; Libor + 0.45% -
Libor + 3.20%
Libor +1.20%-Libor + 3.20%
Libor +1.20%- Libor + 2.55%
Philippine peso P=985,897 P=765,524 P=291,667 P=805,950 P=1,500,000 – – 4,349,038 – 4,349,038 4,349,038 Interest rate 1.5% margin +
182 T-bill –2.5%
margin + 182 T-bill;
3 mo Mart + 1.5% margin –
Mart 1 + 2% margin;
1.5% margin + 182 T-bill –
2.5% margin + 182 T-bill;
3 mo Mart + 1.0% – Mart 1 + 2% margin;
1.5% margin + 182 T-bill –
2.5% margin + 182 T-bill;
Mart 1 + 2% margin;
1.5% margin + 182 T-bill –
3 mo Mart + 1.375%
3 mo Mart + 1.75%
P=52,398,546 P=510,044 P=52,908,590 P=56,040,511
(Forward)
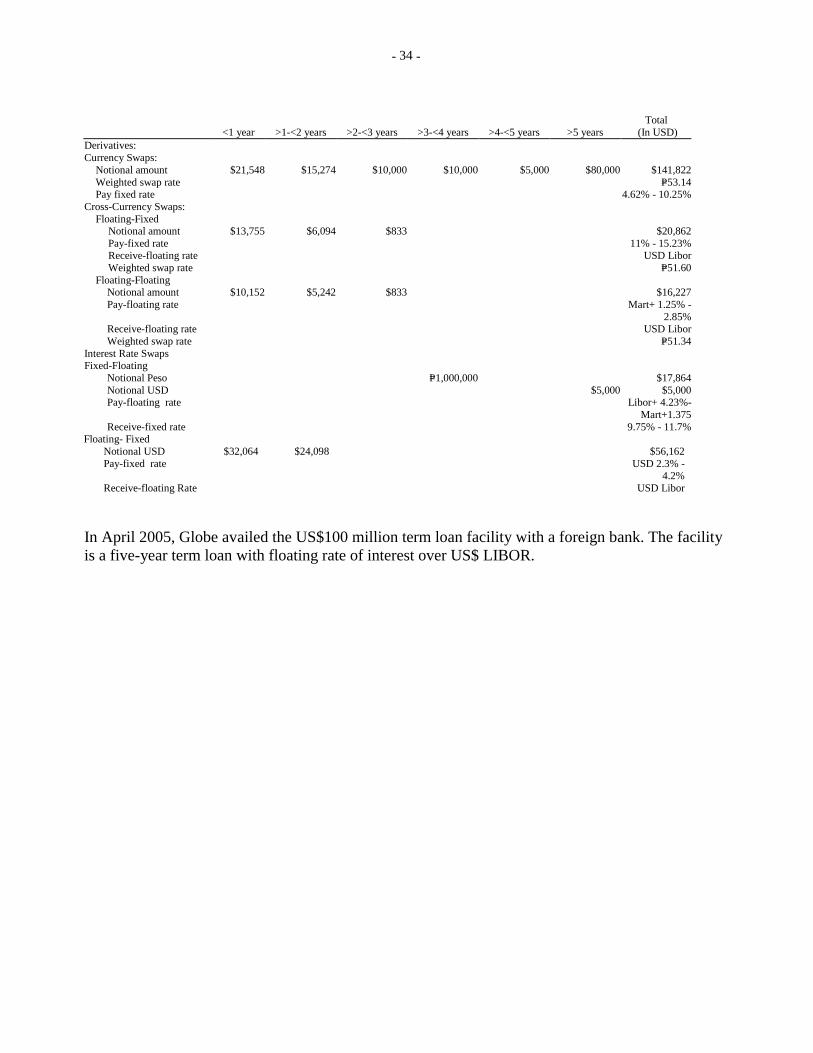
- -
34
<1 year >1-<2 years >2-<3 years >3-<4 years >4-<5 years >5 years Total
(In USD) Derivatives: Currency Swaps: Notional amount $21,548 $15,274 $10,000 $10,000 $5,000 $80,000 $141,822 Weighted swap rate P=53.14 Pay fixed rate 4.62% - 10.25%Cross-Currency Swaps: Floating-Fixed Notional amount $13,755 $6,094 $833 $20,862 Pay-fixed rate 11% - 15.23% Receive-floating rate USD Libor Weighted swap rate P=51.60 Floating-Floating Notional amount $10,152 $5,242 $833 $16,227 Pay-floating rate Mart+ 1.25% -
2.85% Receive-floating rate USD Libor Weighted swap rate P=51.34Interest Rate Swaps Fixed-Floating Notional Peso P=1,000,000 $17,864 Notional USD $5,000 $5,000 Pay-floating rate Libor+ 4.23%-
Mart+1.375 Receive-fixed rate 9.75% - 11.7%Floating- Fixed
Notional USD $32,064 $24,098 $56,162 Pay-fixed rate USD 2.3% -
4.2% Receive-floating Rate USD Libor
In April 2005, Globe availed the US$100 million term loan facility with a foreign bank. The facility is a five-year term loan with floating rate of interest over US$ LIBOR.
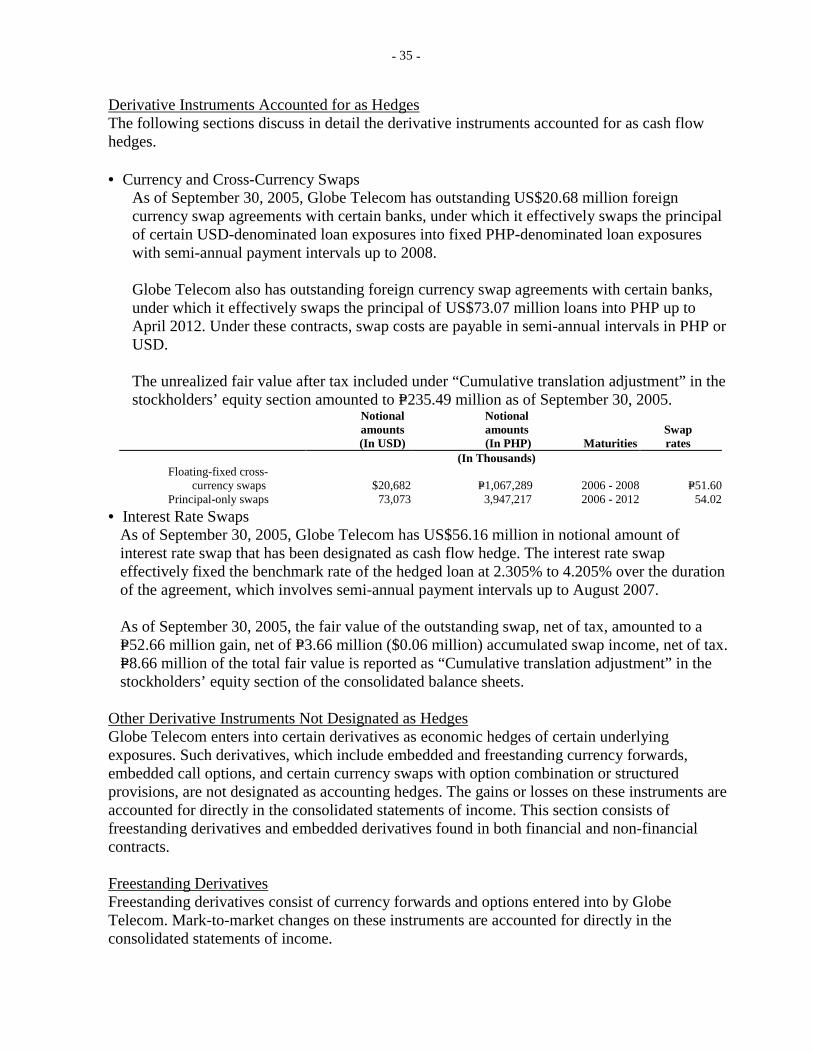
- -
35
Derivative Instruments Accounted for as Hedges The following sections discuss in detail the derivative instruments accounted for as cash flow hedges.
• Currency and Cross-Currency Swaps
As of September 30, 2005, Globe Telecom has outstanding US$20.68 million foreign currency swap agreements with certain banks, under which it effectively swaps the principal of certain USD-denominated loan exposures into fixed PHP-denominated loan exposures with semi-annual payment intervals up to 2008.
Globe Telecom also has outstanding foreign currency swap agreements with certain banks,
under which it effectively swaps the principal of US$73.07 million loans into PHP up to April 2012. Under these contracts, swap costs are payable in semi-annual intervals in PHP or USD.
The unrealized fair value after tax included under “Cumulative translation adjustment” in the stockholders’ equity section amounted to P=235.49 million as of September 30, 2005.
Notional amounts (In USD)
Notional amounts
(In PHP) Maturities Swap rates
(In Thousands) Floating-fixed cross-
currency swaps $20,682 P=1,067,289 2006 - 2008 P=51.60Principal-only swaps 73,073 3,947,217 2006 - 2012 54.02
• Interest Rate Swaps As of September 30, 2005, Globe Telecom has US$56.16 million in notional amount of interest rate swap that has been designated as cash flow hedge. The interest rate swap effectively fixed the benchmark rate of the hedged loan at 2.305% to 4.205% over the duration of the agreement, which involves semi-annual payment intervals up to August 2007. As of September 30, 2005, the fair value of the outstanding swap, net of tax, amounted to a P=52.66 million gain, net of P=3.66 million ($0.06 million) accumulated swap income, net of tax. P=8.66 million of the total fair value is reported as “Cumulative translation adjustment” in the stockholders’ equity section of the consolidated balance sheets.
Other Derivative Instruments Not Designated as Hedges Globe Telecom enters into certain derivatives as economic hedges of certain underlying exposures. Such derivatives, which include embedded and freestanding currency forwards, embedded call options, and certain currency swaps with option combination or structured provisions, are not designated as accounting hedges. The gains or losses on these instruments are accounted for directly in the consolidated statements of income. This section consists of freestanding derivatives and embedded derivatives found in both financial and non-financial contracts.
Freestanding Derivatives Freestanding derivatives consist of currency forwards and options entered into by Globe Telecom. Mark-to-market changes on these instruments are accounted for directly in the consolidated statements of income.
- -
36
• Non-deliverable Forwards As of September 30, 2005, Globe Telecom has outstanding short-term non-deliverable currency forward contracts with a total outstanding notional amount of $2.88 million to fix the peso cash flows from coupon and redemption of certain DLPN issued by the Republic of the Philippines (ROP). These currency forward contracts, which mature in December 2005, have a mark-to-market gain of P=16.78 million as of September 30, 2005.
• Sold Currency Options
As of September 30, 2005, Globe Telecom has sold currency options with total outstanding notional amount of $27.70 million at an average strike price of P=58.97/$ maturing up to March 2007. These were entered into to subsidize the cost of outstanding currency swap contracts. The mark-to-market value on these currency options as of September 30, 2005 amounted to a loss of P=11.22 million.
• Currency Swaps and Cross-Currency Swaps
Globe Telecom also has outstanding foreign currency swap agreements with certain banks, under which it swaps the principal of $68.75 million USD-denominated loans into PHP up to April 2012. Under these contracts, swap costs are payable in semi-annual intervals in PHP or USD. Of the $68.75 million, $6.25 million is in combination with sold out-of-the-money USD call options with a strike price of P=62.50, while another $20.00 million provides Globe Telecom the option to reset lower to a certain minimum the foreign exchange rate used to determine PHP equivalent amounts to be net settled by Globe Telecom upon maturity or termination. The reset option has been exercised.
Globe Telecom also entered into cross-currency swap agreements with certain banks, under which it swaps the principal and interest of certain USD-denominated loans into Philippine peso with quarterly or semi-annual payment intervals up to June 2008. As of September 30, 2005, the total outstanding notional amounts of the cross-currency swaps amounted to US$16.23 million.
The net mark-to-market loss of the outstanding currency and cross-currency swaps as of September 30, 2005 amounted to P=92.22 million.
• Interest rate swaps
Globe Telecom also has an outstanding interest rate swap with a notional amount of US$5.00 million under which it effectively swapped the 9.75% coupon on its outstanding 2012 Senior Notes into a floating rate of interest based on LIBOR. The swap has a constant maturity swap (CMS) component that is intended to reduce swap costs. The interest rate on one leg of the CMS is being reset periodically subject to a cap, while the interest rate on the other leg is fixed subject to a daily range accrual that is linked to the difference between the 30-year and 10-year USD swap rates. Globe Telecom also has an outstanding interest rate swap contract with a notional amount of P=1.00 billion, which effectively swaps a fixed rate PHP-denominated bond into floating rate, with quarterly payment intervals up to February 2009.
The mark-to-market values on the interest rate swaps as of September 30, 2005 amounted to a net mark-to-market gain of P=0.58 million.
- -
37
Embedded Derivatives and Other Financial Instruments Globe Telecom’s embedded derivatives include embedded currency derivatives noted in both financial and non-financial contracts and embedded call options in debt instruments.
• Embedded Currency Forwards
As of September 30, 2005, the total outstanding notional amount of currency forwards embedded in non-financial contracts amounted to US$47.06 million. The non-financial contracts consist mainly of foreign-currency denominated purchase orders with various expected delivery dates. The mark-to-market gain as of September 30, 2005 on the embedded currency forwards amounted to P=68.91 million.
• Embedded Currency Options
As of September 30, 2005, the total outstanding notional amount of currency options embedded in non-financial contracts amounted to US$1.47 million. The mark-to-market gain as of September 30, 2005 on the embedded currency options amounted to P=1.83 million.
• Embedded Call Option
Globe Telecom’s 2012 Senior Notes contain embedded call options which give Globe Telecom the right to prepay the notes at a certain call price per year. As of September 30, 2005, the embedded call options have a notional amount of US$300.00 million and mark-to-market gain of P=1,103.31 million.
• Dollar-Linked Peso Notes
Globe Telecom has investments in DLPN issued by the ROP, maturing in December 2005. These investments have a total face value of P=150.00 million and were purchased at a premium with weighted average price of P=104.38.
The redemption amounts and interest rates of these DLPN investments are based on a pre-agreed formula, which includes a foreign exchange factor applied to the base interest rate payable semi-annually in arrears and to the redemption amounts.
The DLPN investments contain embedded currency forwards that were bifurcated and marked-to-market through profit and loss. As of September 30, 2005, the mark-to-market gain on the embedded currency forwards amounted to P=2.78 million.
The host peso debt instruments on the DLPN investments are accounted for at amortized cost and reported in the “Short-term investments” account in the consolidated balance sheets.
- -
38
Fair Value Changes on Derivatives The net movements in fair value changes of all derivative instruments for the period ended September 30, 2005 are as follows (amounts in thousand pesos):
Balance at beginning of period P=1,269,936 Net changes in fair value: Hedge accounting derivatives (164,712) Non-hedge accounting derivatives (95,311) 1,009,913 Less fair value of settled instruments 11,713 Balance at end of period P=998,200
Hedge Effectiveness Results As of September 30, 2005, the effective mark-to-market value changes on Globe Telecom’s cashflow hedges that were deferred in equity amounted to P=244.15 million, net of tax. Total ineffectiveness recognized immediately in the consolidated statements of income for the period then ended is immaterial.
The distinction of the results of hedge accounting into “Effective” or “Ineffective” represent designations based on PAS 39 and are not necessarily reflective of the economic effectiveness of the instruments.
14. Earnings Per Share Globe Group’s earnings per share amounts were computed as follows:
Three Months Ended
September 30 Nine Months Ended
September 30
2005 2004
(As Restated) 2005 2004
(As Restated) (In Thousand Pesos and Number of Shares, Except Per Share Figures) Net income attributable to common
shareholders for basic earnings per share P=2,210,163 P=2,147,509 P=6,388,476 P=8,942,046
Add dividends on preferred shares 16,569 18,988 51,874 55,134 Net income attributable to common
shareholders for diluted earnings per share 2,226,732 2,166,497 6,440,350 8,997,180
Weighted average number of shares for basic earnings per share 131,840 139,904 134,080 139,904
Dilutive shares arising from: Convertible preferred shares 1,032 843 954 898 Stock options 68 268 185 244 Adjusted weighted average number of
common stock for diluted earnings per share 132,940 141,015 135,219 141,046
Basic earnings per share P=16.76 P=15.35 P=47.65 P=63.92
Diluted earnings per share P=16.75 P=15.35 P=47.63 P=63.79
- -
39
The convertible preferred stock series A was anti-dilutive for the three months ended September 30, 2004.
15. Contingencies
Globe Telecom and Innove are contingently liable for various claims arising in the ordinary conduct of business and certain tax assessments which are either pending decision by the courts or are being contested, the outcome of which are not presently determinable. In the opinion of management and legal counsel, the eventual liability under these claims, if any, will not have a material or adverse effect on Globe Telecom and Innove’s financial position and results of operations.
Development with U.S. Carriers On February 7, 2003, AT&T and Worldcom (MCI) filed a petition before the US Federal Communications Commission (US FCC) seeking a stop payment order on settlement to the Philippine carriers on the ground that Philippine carriers were “whipsawing” AT&T and MCI into agreeing to an increase in termination rates to the Philippines. On March 10, 2003, the Chief International Bureau of the US FCC issued an order suspending all settlement payments of US facilities-based carriers to a number of Philippine carriers, including Globe Telecom, until such time as the US FCC issues a Public Notice stating otherwise. This order had the effect of preventing US facilities-based carriers such as AT&T from paying the affected Philippine carriers for switched voice services, whether rendered before or after the date of the Order. In response, the NTC issued an Order on March 12, 2003 ordering Philippine carriers not to accept traffic from US carriers who do not pay for services rendered and to take all steps necessary to collect payment for services rendered.
On January 26, 2004, the US FCC lifted its stop-payment order against Globe following confirmation by US carriers that service with Globe had been normalized. US carriers were required to resume payments for termination services In June 2004, the US FCC issued an order denying the petitions for review filed by the different Philippine carriers and upholding the finding of whipsawing. In the same order, the FCC stated that the matter of lifting the International Settlement Policy (ISP) over the Philippine route will be decided in FCC proceedings relative to its ISP reform order. Pursuant to the ISP Reform Order, countries whose rates are at or below benchmark will be dropped from the coverage of the ISP unless serious concerns are raised on the route. In August 2004, the FCC, in the proceedings on the ISP Reform Order, required US Carriers to certify that the rates charged by the Philippine Carriers are benchmark compliant. As of October 11, 2004, all three major US Carriers (AT&T, MCI and Sprint) have certified to the benchmark compliance of the Philippine route. On August 15, 2005, the US FCC released its order upholding the findings of whipsawing. Despite this, however, it ordered the lifting of the ISP on the Philippine route on the ground that the rates on the route were still benchmark-compliant and there was no further evidence of continuing anti-competitive conduct on the route.
- -
40
On January 10 and 11, 2004, the United States Department of Justice (US DOJ) served subpoenas on several Philippine telecom executives, including two Globe managers and the Innove CEO, requiring them to appear before a grand jury investigation in Hawaii. The investigation is for the purpose of determining if the conduct of the Philippine carriers in relation to the termination rate disputes with US carriers may have violated US laws. On March 24, 2005, the District Court of Hawaii granted Globe’s notion to quash the subpoena duces tecum against it on the ground that US courts have no jurisdiction. On April 28, 2005, the US DOJ filed a notice of appeal stating its intention to appeal the ruling of the district court of Hawaii. On July 5, 2005, Globe Telecom received an advice from US DOJ that its investigation has been closed. 16. Reporting Segments
In 2005, the Globe Group started monitoring its wireline voice and data businesses as one converged service with similar risks and returns. Management now evaluates the Globe Group’s operations based on two segments: wireless and wireline communication services.
The Globe Group evaluates performance based on earnings before income taxes and depreciation and amortization (EBITDA). The Globe Group’s segment information for the three months ended September 30 follows (in millions):
2005
Wireless Wireline Communication Communication
Services Services Corporate [1] Total
Revenues P=13,173 P=1,632 P=– P=14,805
Operating expenses (5,665) (884) (180) (6,729)
EBITDA [2] 7,508 748 (180) 8,076
Depreciation and amortization (3,083) (677) (261) (4,021)
EBIT 4,425 71 (441) 4,055
Other income (expenses) - net (863) 32 58 (773)
Income (loss) before income tax P=3,562 P=103 (P=383) P=3,282
Results of GXI’s operations are reported under wireless communication services.
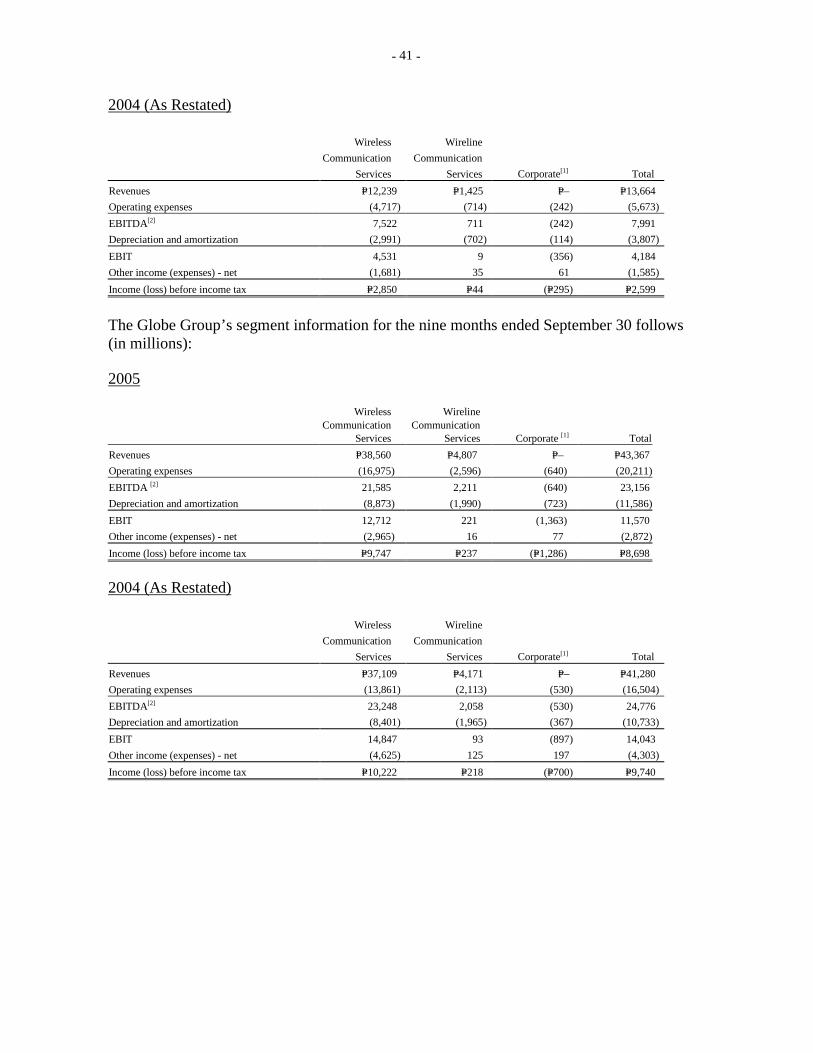
- -
41
2004 (As Restated)
Wireless Wireline
Communication Communication
Services Services Corporate[1] Total
Revenues P=12,239 P=1,425 P=– P=13,664
Operating expenses (4,717) (714) (242) (5,673)
EBITDA[2] 7,522 711 (242) 7,991
Depreciation and amortization (2,991) (702) (114) (3,807)
EBIT 4,531 9 (356) 4,184
Other income (expenses) - net (1,681) 35 61 (1,585)
Income (loss) before income tax P=2,850 P=44 (P=295) P=2,599
The Globe Group’s segment information for the nine months ended September 30 follows (in millions):
2005
Wireless Wireline
Communication Communication Services Services Corporate [1] Total
Revenues P=38,560 P=4,807 P=– P=43,367
Operating expenses (16,975) (2,596) (640) (20,211)
EBITDA [2] 21,585 2,211 (640) 23,156
Depreciation and amortization (8,873) (1,990) (723) (11,586)
EBIT 12,712 221 (1,363) 11,570
Other income (expenses) - net (2,965) 16 77 (2,872)
Income (loss) before income tax P=9,747 P=237 (P=1,286) P=8,698
2004 (As Restated)
Wireless Wireline
Communication Communication
Services Services Corporate[1] Total
Revenues P=37,109 P=4,171 P=– P=41,280
Operating expenses (13,861) (2,113) (530) (16,504)
EBITDA[2] 23,248 2,058 (530) 24,776
Depreciation and amortization (8,401) (1,965) (367) (10,733)
EBIT 14,847 93 (897) 14,043
Other income (expenses) - net (4,625) 125 197 (4,303)
Income (loss) before income tax P=10,222 P=218 (P=700) P=9,740
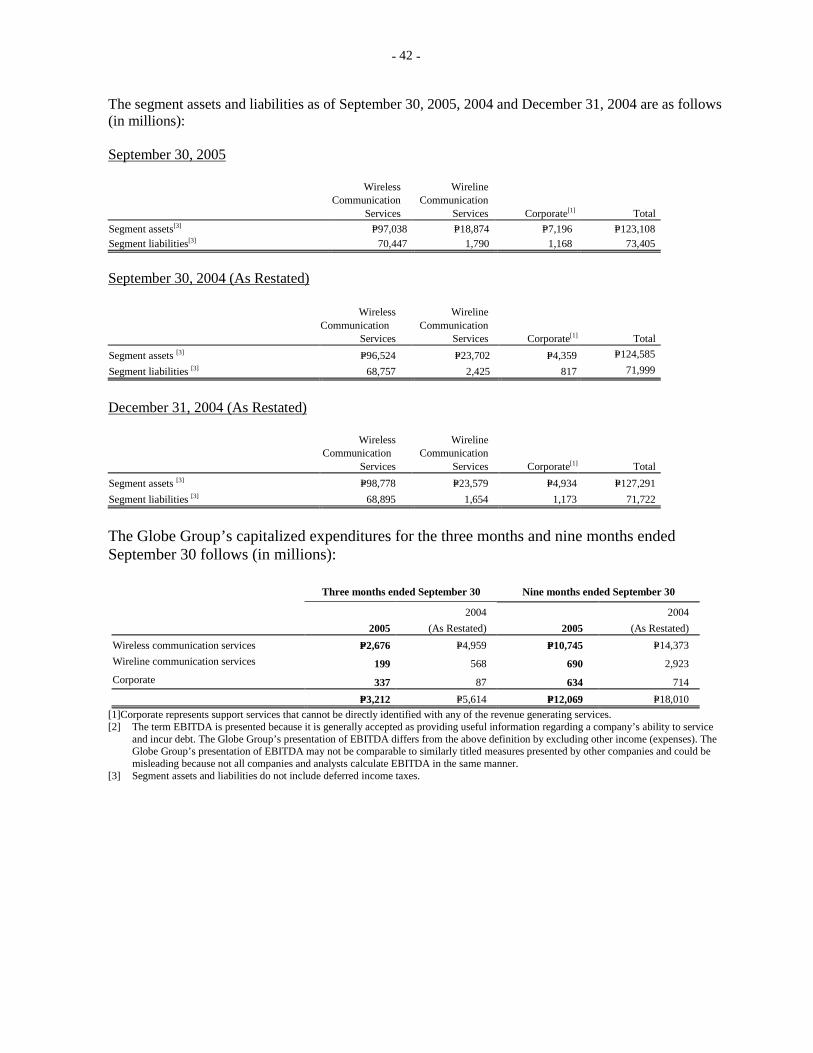
- -
42
The segment assets and liabilities as of September 30, 2005, 2004 and December 31, 2004 are as follows (in millions): September 30, 2005
Wireless Wireline Communication Communication
Services Services Corporate[1] Total
Segment assets[3] P=97,038 P=18,874 P=7,196 P=123,108 Segment liabilities[3] 70,447 1,790 1,168 73,405
September 30, 2004 (As Restated)
Wireless Wireline Communication Communication Services Services Corporate[1] Total
Segment assets [3] P=96,524 P=23,702 P=4,359 P=124,585
Segment liabilities [3] 68,757 2,425 817 71,999
December 31, 2004 (As Restated)
Wireless Wireline Communication Communication Services Services Corporate[1] Total
Segment assets [3] P=98,778 P=23,579 P=4,934 P=127,291
Segment liabilities [3] 68,895 1,654 1,173 71,722
The Globe Group’s capitalized expenditures for the three months and nine months ended September 30 follows (in millions): Three months ended September 30 Nine months ended September 30
2005
2004
(As Restated)
2005
2004
(As Restated)
Wireless communication services P=2,676 P=4,959 P=10,745 P=14,373
Wireline communication services 199 568 690 2,923
Corporate 337 87 634 714
P=3,212 P=5,614 P=12,069 P=18,010
[1]Corporate represents support services that cannot be directly identified with any of the revenue generating services. [2] The term EBITDA is presented because it is generally accepted as providing useful information regarding a company’s ability to service
and incur debt. The Globe Group’s presentation of EBITDA differs from the above definition by excluding other income (expenses). The Globe Group’s presentation of EBITDA may not be comparable to similarly titled measures presented by other companies and could be misleading because not all companies and analysts calculate EBITDA in the same manner.
[3] Segment assets and liabilities do not include deferred income taxes.

- -
43
17. Note to Condensed Consolidated Statements of Cash Flows
• The principal noncash transactions for the nine months ended September 30 follow: •
September 30
2005 2004
(As Restated) (In Thousand Pesos) Increase (decrease) in liabilities related to the acquisition of property
and equipment (P=776,294) P=1,446,418 Capitalized asset retirement obligations 12,129 67,426 Dividends on preferred shares – 55,134
18. Approval of the Condensed Consolidated Financial Statements
On November 8, 2005, the BOD approved and authorized the release of the accompanying condensed consolidated financial statements of Globe Telecom, Inc. and Subsidiaries as of and for the nine months ended September 30, 2005 and 2004.
Certified True and Correct:
EDITH C. SANTIAGO DELFIN C. GONZALEZ, JR. Vice President – Financial Control Chief Financial Officer and Authorized
Representative

- -
44
ANNEX II Globe Telecom, Inc. and Subsidiaries Balance Sheet Accounts Variance Analysis (September 30, 2005 vs. September 30, 2004)
a) Cash and Cash Equivalents – Decreased by 31% or P3.6 billion mainly due to repurchase of common shares in March 2005 and investment of excess funds in treasury bills .
b) Short-term Investments – Increased by P1.1 billion due to purchase of treasury bills in September 2005 c) Receivables – net – Up by 28% as compared to last year of the same period due to higher receivable from
various carriers resulting from the reduced ISR activities (please see related discussion on International Long Distance Services) and higher wireline postpaid (voice and data) subscribers.
d) Inventories and Supplies – Net – Lower inventory level due to higher sales of simpacks (mostly to TM prepaid subscribers) and phonekits and lower supplies of inventory of call cards as subscribers are more inclined to use the over the air reload facilities (Autoload MAX and ATMs)
e) Intangible Assets – Increased by 60% or P407 million due to acquisition of various capitalizable software licenses supporting the expanded network and subscriber base.
f) Deferred tax assets – Decreased due to realization of deferred tax asset related to prepaid capacity provisioning and impact of various PAS adoptions.
g) Investments in Associates, Joint Venture and Others – Declined by P112.1 million due to reclassification of DLPN investments as current assets with a notional amount of P150M maturing in December 2005. This was offset, however, by additional investment in Bridge Mobile Alliance (a joint venture) amounting to P51 million made in November 2004.
h) Other Noncurrent Assets – Decreased by P363.7 million due to the reversal of foreign currency swaps revaluation account and unamortized premium on forward contracts offset by set up of derivative assets as a result of PAS 39 adoption (see Note 2- Adoption of New and Revised Accounting Standards of the attached condensed financial statements).
i) Unearned Revenues – Increased by 18% or P344.7 million due to higher top ups of airtime load during the month of September and also due to higher number of subscribers.
j) Other Long-term Liabilities – Decrease is due to impact of transition adjustment on certain non-interest bearing liability as a result of PAS 39 adoption.
k) Deferred tax liabilities – Increased by 14% primarily due to higher deferred tax liabilities related to the excess of accumulated depreciation and amortization of equipment for tax purposes over financial reporting purposes and impact of various PAS adoptions (mainly PAS 21 and PAS 39) (see Note 2- Adoption of New and Revised Accounting Standards of the attached condensed financial statements).
l) Stock Options – Increase represents additional compensation expense during the year net of the amount transferred to additional paid-in capital for the exercised portion of stock options
m) Treasury Stock – Common – Increase of P7.7 billion is due to treasury stock acquisition in March 2005. n) Cumulative Translation Adjustment – represents fair value changes on derivatives that qualify as cash flow
hedges and available-for-sale investments due to adoption of PAS 39 (see Note 2- Adoption of New and Revised Accounting Standards of the attached condensed financial statements).
AGING OF ACCOUNTS RECEIVABLE AS OF SEPTEMBER 30, 2005
Trade Receivables (In Thousand Pesos) Current P=2,667,303 More than 90 days past due 273,694 More than 120 days past due 242,706 More than 150 days past due 169,891 More than 180 days past due 4,589,659 7,943,253
Traffic Settlement Receivables 3,074,895 Other Receivables 291,694 Total Receivables 11,309,842 Less: Allowance for doubtful accounts (4,969,895) Receivables – net P=6,339,947
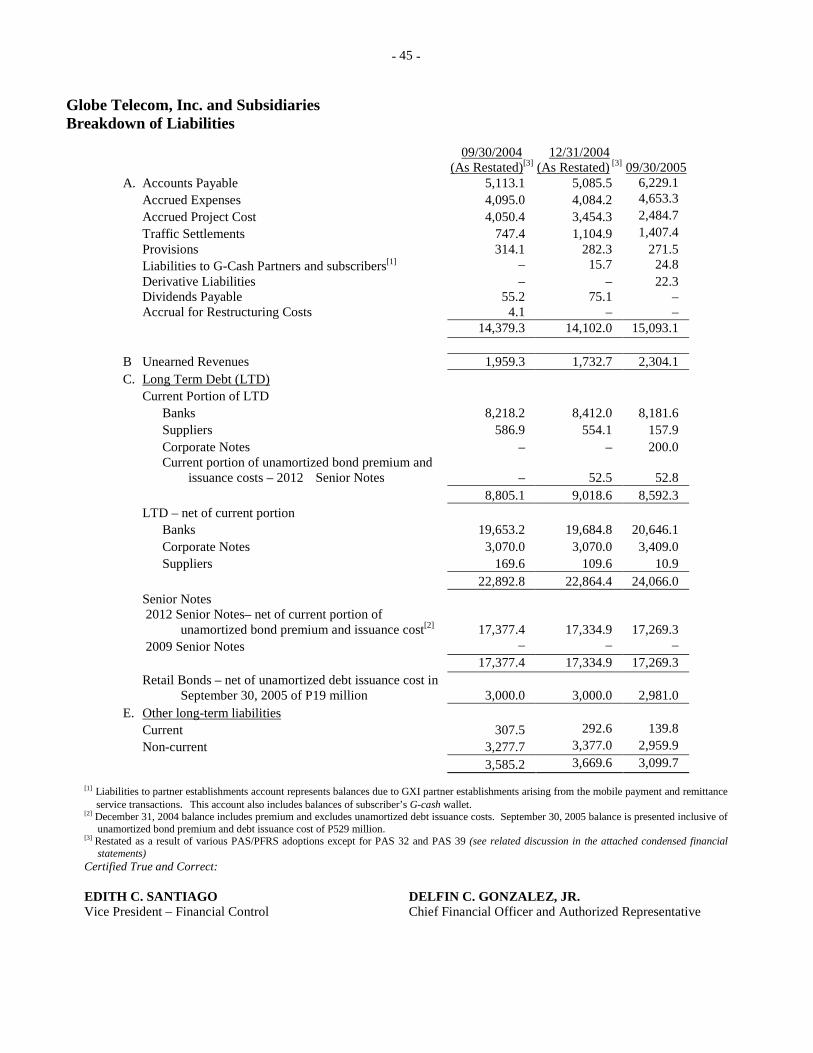
- -
45
Globe Telecom, Inc. and Subsidiaries Breakdown of Liabilities
09/30/2004
(As Restated)[3] 12/31/2004
(As Restated) [3]
09/30/2005 A. Accounts Payable 5,113.1 5,085.5 6,229.1 Accrued Expenses 4,095.0 4,084.2 4,653.3
Accrued Project Cost 4,050.4 3,454.3 2,484.7
Traffic Settlements 747.4 1,104.9 1,407.4 Provisions 314.1 282.3 271.5 Liabilities to G-Cash Partners and subscribers[1] – 15.7 24.8 Derivative Liabilities – – 22.3 Dividends Payable 55.2 75.1 – Accrual for Restructuring Costs 4.1 – – 14,379.3 14,102.0 15,093.1 B Unearned Revenues 1,959.3 1,732.7 2,304.1 C. Long Term Debt (LTD)
Current Portion of LTD
Banks 8,218.2 8,412.0 8,181.6 Suppliers 586.9 554.1 157.9 Corporate Notes – – 200.0
Current portion of unamortized bond premium and issuance costs – 2012 Senior Notes – 52.5 52.8
8,805.1 9,018.6 8,592.3 LTD – net of current portion
Banks 19,653.2 19,684.8 20,646.1 Corporate Notes 3,070.0 3,070.0 3,409.0 Suppliers 169.6 109.6 10.9 22,892.8 22,864.4 24,066.0 Senior Notes
2012 Senior Notes– net of current portion of unamortized bond premium and issuance cost[2]
17,377.4
17,334.9
17,269.3
2009 Senior Notes – – –
17,377.4 17,334.9 17,269.3
Retail Bonds – net of unamortized debt issuance cost in September 30, 2005 of P19 million
3,000.0
3,000.0
2,981.0
E. Other long-term liabilities
Current 307.5 292.6 139.8
Non-current 3,277.7 3,377.0 2,959.9
3,585.2 3,669.6 3,099.7
[1] Liabilities to partner establishments account represents balances due to GXI partner establishments arising from the mobile payment and remittance service transactions. This account also includes balances of subscriber’s G-cash wallet.
[2] December 31, 2004 balance includes premium and excludes unamortized debt issuance costs. September 30, 2005 balance is presented inclusive of unamortized bond premium and debt issuance cost of P529 million.
[3] Restated as a result of various PAS/PFRS adoptions except for PAS 32 and PAS 39 (see related discussion in the attached condensed financial statements)
Certified True and Correct:
EDITH C. SANTIAGO DELFIN C. GONZALEZ, JR. Vice President – Financial Control Chief Financial Officer and Authorized Representative

- -
46