comparative analyses based on simulations to improve
TRANSCRIPT
MANSOURA ENGINEERING JOURNAL, (MEJ), VOL. 46, ISSUE 3, SEPTEMBER 2021 A: 33
Mansoura University
Faculty of Engineering
Mansoura Engineering Journal
(Ser. NO. BFEMU-2107-1143)
LIST OF SYMBOLS
FM/s Finishing Material/s
WWR Window-to-Wall-Ratio
eQuest The QUick Energy Simulation Tool (a software tool)
Case
(Xxi*)
In one of the proposed applications, case (Xxi*) denotes to a studied case with specific dimensions and
orientation, where: (X) is an uppercase/capital letter from
(A) to (E) referring to the length that ranges from 20m to
100m with 20m intervals, (x) is a lowercase/small letter
from (a) to (e) denotes the width with the same range and
intervals, (i) represent a number from 1 to 3 referring to
the height that ranges from 20m (5 stories) to 60 (15 stories) with 20m (5 stories) intervals, and (*) denotes to
the cases oriented 45 degrees from azimuth, if any. For
example, case (Ce3) refers to the building with
dimensions: 60m (length), 100m (width) and 60m
(height), while case (Ce3*) refers to the previous
dimensions with orienting the whole building 45 degrees
from the azimuth.
Received: (29 July, 2021) - Revised: (11 August, 2021) - Accepted:
(18 August, 2021) Corresponding Author: Amr Mamdoh Ali Youssef, Assistant
Professor in Department of Architectural Engineering, Assiut
University, Assiut 71518, Egypt. (email: [email protected])
I. INTRODUCTION
uilding envelope is one of the main domains
that can be utilized towards developing net
zero energy buildings, especially in hot
climate zones. A lot of envelope features can
be tracked to reduce energy consumption such as building
geometry ratios and others. For instance, changing the
geometry ratios of a cubic building (as a feature) from
1:1:1.5 (width: length: height) to 1.75: 1.75: 0.5 with a
same volume (e.g., 96000 m3) can reduce the energy
consumption from 158.5 to 149.6 kWh/(m2.year) in a hot
climate zone (2A) [1]
, predicted using eQuest simulation
tool [1], and more energy savings per m2 can be reached
if the building volume are varied via comparisons. This
study aims at determining the sensitivity of envelope
[1] Based on ASHRAE 90.1 standard, the international climate zones are
defined and classified using letters and numbers; letters (A), (B) and (C) denote to moist, dry and marine climate zones, respectively, while
numbers (from 1 to 8) denote to the temperature (from the hottest to the
coldest climate zones), respectively (ASHRAE 2007).
Comparative Analyses Based on Simulations to
Improve Energy Consumption in Office
Buildings in Egypt
Amr Mamdoh Ali Youssef *
KEYWORDS:
Simulation;
Comparative Analyses;
Building Envelope;
Energy Consumption;
Finishing Materials
Abstract—A growing attention has been paid to building envelope features for
achieving lower energy consumption especially in large office buildings and hot climate
zones, since these features and their variables are affecting energy consumption widely
and with different sensitivity. Therefore, this paper conducts simulation-based
comparative analyses between main envelope features with their internal variables; the
selected features for this study are building geometry ratios, orientations and common
envelope finishing materials (FMs). Two applications have been conducted (comparing
cases with either a same or different building volumes), and more than 500
cases/simulations have been conducted and studied in total. Accordingly, sensitive features
and variables have been determined to enrich design decisions for different cases, along
with best variables' integrations that achieve best energy consumption through the
proposed applications and cases. Cubic office buildings in Egypt have been used to
demonstrate the study, and energy simulations have been achieved using eQuest (DOE-2).
Results show that lower height with wider roof achieves best energy consumption if
building volume is fixed via comparisons, and vice versa. Gravel and galvanized steel
represent best studied roof and walls' FMs, while roofing shingles is the worst one. If
building volume is varied via comparisons, horizontal dimensions are the most sensitive
feature that affects energy consumption per m2, while FMs and height represent lowest
sensitivity among studied features. Ranking of cases, features, variables along with
sensitive features in details have been analyzed and discussed through the paper.
B
A: 34 AMR MAMDOH ALI YOUSSEF
features and their variables along with determining
sensitive features and variables that achieves best energy
consumption; building geometry ratios, orientations and
Finishing materials (FMs) (either covering the roof and/or
walls) are the main features to be studied in this paper.
However, office buildings have been selected to be
studied due to their flexible geometric features, wide
façade areas and high energy consumption, and different
volumes have been analyzed. Cairo in Egypt, as a hot
climate zone, has been used to demonstrate the study
outcomes.
Numerous studies conducted analyses on building
envelope parameters and design methods towards better
energy performance in different climate zones. Ihm and
Krarti [2] determined optimal values for the design
features of single-family residential buildings in Tunisia
to increase their energy efficiency; orientation, window
location, Window-to-Wall Ratio (WWR), glazing type,
insulation and others systems have been tested. Qian and
Lee [3] tested materials and insulations applied on
building envelope components (walls, windows, doors
and others) in small commercial building using Minitab
17 and TRACETM 700. Ferrara et al [4] developed a
framework to find the cost-optimal building configuration
for the French single-family building using TRNSYS
simulation and GenOpt program. Harmati and Magyar [5]
compared glazing influence, preferable WWR and
window geometry for better indoor daylight quality and
annual energy demand in offices using Radiance
simulations. Aksamija [6] discussed design methods for
developing sustainable high-performance facades; this
include different building treatments, orientations, WWR,
shading elements and materials to improve daylighting,
energy efficiency and thermal comfort. Hu and Wu [7]
analyzed the influence of exterior walls, roof, exterior
windows and other features for a public building in
Beijing to determine sensitive properties.
Moreover, Raji et al [8] studied energy-saving
solutions for the envelope design of high-rise office
buildings; glazing type, WWR and other strategies
through an existing office building in the Netherlands
have been studied using DesignBuilder. Barozzi et al [9]
reviewed contemporary envelopes via different design
approaches for reducing energy consumptions in several
examples of spaces, materials and others. Balter et al
[10] conducted thermal and energy assessment of
different envelope materiality on different residential
buildings with massive and light envelopes. Liu et al [11]
studied the effect of different orientations, WWR and
floor geometric features on artificial lighting in office
buildings in Tianjin, China; single and multi-parameter
evaluations have been conducted using DesignBuilder.
Liu et al [12] conducted energy consumption simulation
analyses for a large amount of office buildings; each
parameter influence on the energy consumption and
optimal combinations have been analyzed. D'Agostino et
al [13] demonstrated a decision support framework of
building designs that includes different building types,
materials and technologies through both environmental
and economic criteria. As detailed before, majority of
features are relevant to the specific cases or climate zones
and should be tested to suit different design cases.
Other studies were focusing on other features such as
building geometry (such as shape, ratios and dimensions)
reach better energy performance. Tuhus-Dubrow and
Krarti [14] developed an approach to minimize energy
consumption by optimally selecting shapes, dimensions
and other envelope parameters of residential buildings.
Zerefos et al [15] examined energy consumption of
buildings that have polygonal, orthogonal and prismatic
building envelopes located in Mediterranean climates.
Finishing and construction materials have been also
widely focused for optimization purposes. Al-Nuaimi and
Khamis [16] simulated different interior FMs in a single
room for reducing its energy consumption in Bahrain;
around 7% energy saving could be achieved. Pukhkal
[17] studied protective FMs of exterior walls, structure
and others with their effect on heat insulating. Huang et al
[18] proposed two most popular retrofitting methods for
cooling building wall surfaces in different orientations
and climates. Alonso et al [19] studied outer façade FMs'
effect on the buildings' energy balance in different
thermal conditions; color, solar reflectance and emissivity
have been focused on three different construction systems
in Madrid, Spain. Echarri-Iribarren et al [20] compared
cast recycled aluminium panels with large-format ceramic
panels based on their energy savings using EnergyPlus.
Khoukhi et al [21] studied retrofitting an office buildings
in UAE towards lower energy consumption via building
orientation, ventilation, walls and roof construction; wall
construction can achieve 4.4% energy saving in the best
case.
In Egypt climate zone in specific, many studies
focused on optimizing building envelope features for
better energy performance. For example, Albadry [22]
proposed a method that combines both retrofitting
building envelope with renewable energy strategies that
suit the Egyptian context, not new designs. Khalil et al
[23] analyzed some design variables and skin
configurations of buildings' envelopes in residential
buildings' cases in Alexandria, Egypt using Energy Plus
simulation, not office buildings, also William et al [24]
evaluated the energy efficiency using DesignBuilder
simulation in Egyptian existing hospitals. Mahmoud et al
[25] conducted a comparative simulation analyses to an
administration building in Cairo to assess its performance
after applying passive design features such as courtyards,
double walled envelope, shading devices and other
different features than proposed in this study. Abd El-
Rahman et al [26] optimized thermal performance of
office buildings through building shape, orientation and
WWR on a fully glazed office building, not energy
consumption. Previous studies did not outline the
proposed features on different office buildings in the
Egyptian context or highlight relevant guidelines to
generic design cases. On the other hand, ASHRAE 90.1 -
2007 standard is applicable for Cairo climate zone [27],
such standards can be utilized to classify features to
which can be set to the standards and others to be tested
and scoped as detailed in the following section 2.
MANSOURA ENGINEERING JOURNAL, (MEJ), VOL. 46, ISSUE 3, SEPTEMBER 2021 A: 35
Based on the conducted literature, no studies were
found providing detailed performance of envelope
features and variables in generic cases; some features of
building envelope are needed to be studied in their
context, such as building geometry that suits different
design cases specifically. FMs in different orientations
have been also focused to reach better energy
performance, while WWR and story height are excluded
from the studied variations to be set to the relevant
standards as detailed before. To suit different design cases
and supports designers' decision, analyses have been
conducted via two different applications: application (A)
compares energy consumption in cases with a same
volume, and application (B) compares energy
consumption per m2 in cases with different volumes. The
paper has been structured to include details of the
proposed features, their variables and relevant
classifications in section 2. Section 3 presents two
applications ((A) and (B)) to demonstrate the comparison
analyses of cases with either the same and different
volumes, respectively. Section 4 presents the ranking of
best variables' integrations in both applications and most
sensitive features/variables. Finally, the discussion and
conclusion are detailed in section 5 and 6, respectively,
along with the whole simulation results in the appendices.
II. MAIN FEATURES AND VARIABLES OF
BUILDING ENVELOPE AFFECTING ENERGY
CONSUMPTION
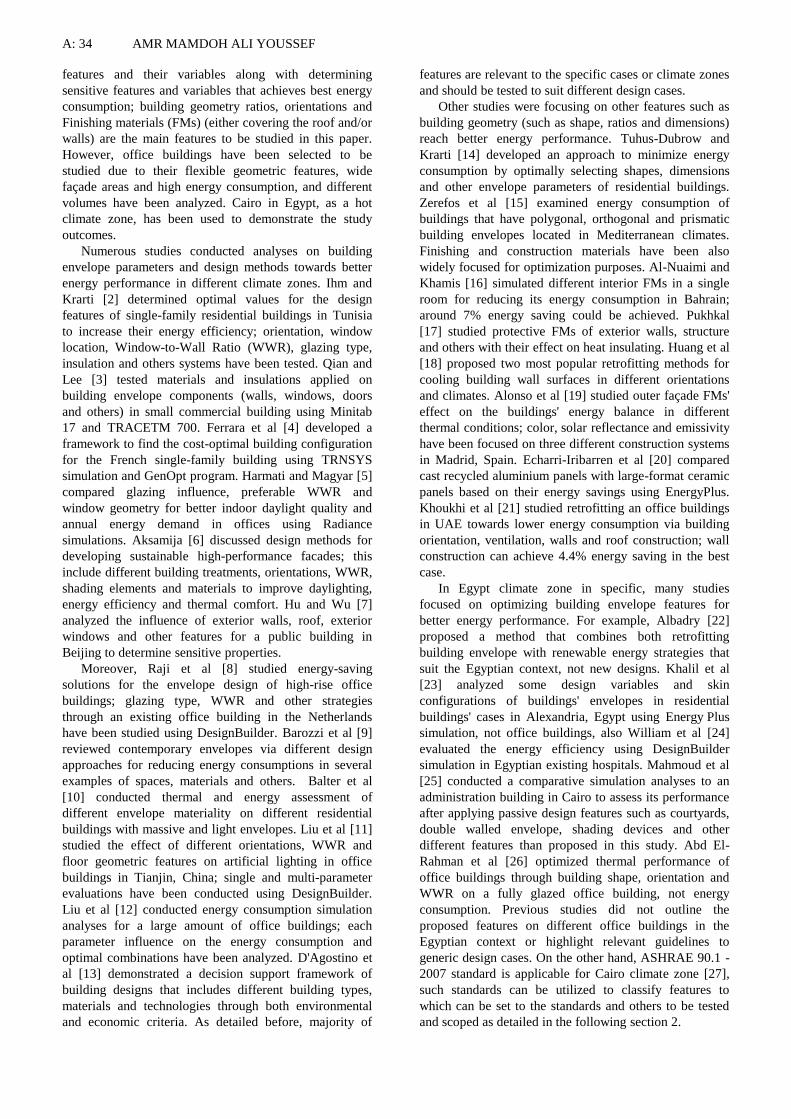
Main features of building envelope and their internal
variables, that may affect energy consumption, have been
selected as shown in Figure 1. Some of these features'
variables have been fixed based on ASHRAE 90.1 - 2007
standard; it recommends 10% to 40% WWR for office
buildings in Cairo climate zone to achieve less energy
consumption [27], while high WWR is also
recommended from the architectural perspective for
providing view visibility and facades attractiveness.
Therefore, 40% WWR has been selected in this study as
an medium value that fits ASHREA standards and
architectural recommendations. The study focuses on: a)
building geometry ratios; b) orientations (every 45
degrees); and c) nine FMs (either covering the roof and/or
walls) that have been selected from the common practice
and available materials in local markets (detailed in Table
1). All alternatives obtained from different integrations of
these features and their variables have been simulated via
DOE-2 (eQuest) as detailed below.
Fig. 1: Main features and variables of building envelope affecting energy consumption

A: 36 AMR MAMDOH ALI YOUSSEF
TABLE 1
FINISHING MATERIALS' SPECIFICATIONS AND CHARACTERISTICS [1]
Finishing
Materials Name (Code) In DOE-2
Th
ick
ness
(Cm
)
Den
sity
(Kg
/M3)
Sp
ecif
ic H
ea
t
(Kj/
Kg
-K)
Resi
sta
nce
(K-M
2/W
)
Ro
ofs
Wa
lls
1 Gravel Gravel (RG02) 2.5 881 1674 0.018 √
2 Roofing shingles Wood Shingle (WS01) 1.7 513 1255 0.153 √ √
3 Wood Plywd (PW04) 1.9 545 1213 0.22 √ √
4 Galvanized Steel Steel Siding (ASo1) 0.15 7690 480 3.3x10⁻⁵ √ √
5 Stucoo / Gunite Stucco (SC01) 2.5 2659 837 0.035
√
6 Clay Tiles Clay Tile Paver (CT11) 1 1922 837 0.005 √
7 Bricks Face Brick 4in (BK05) 10.1 2083 921 0.078
√
8 Marbel Terrazzo (TZ01) 2.5 2243 837 0.014 √ √
9 Spandrel Glass 1/4 in Spandrel Glass 0.625 2752 840 - √ √
III. ENERGY CONSUMPTION SIMULATION OF
THE ENVELOPE FEATURES IN CUBIC OFFICE
BUILDINGS IN EGYPT
Simulation processes have been conducted on cubic
office building in Egypt via two applications as detailed
below; the outcome in each application is determining the
sensitive features and variables in achieving best energy
consumption via a comparative analyses, along with
ranking these alternatives.
1.1. Application (A): Buildings with a same volume
In this application, previous illustrated features have
been simulated using different geometric ratios with the
same volume, this is to support designers in comparing
different cases that have a fixed architectural program,
number of spaces and accordingly a specific context to be
formed; a medium volume (96000 m3) have been
proposed and outlined in 3 different ratios as shown in
Figure 2, and accordingly 8 cases have been conducted
after applying possible orientations. The total number of
alternatives/simulations conducted using DOE-2 equals
392 alternatives as presented in Figure 3.
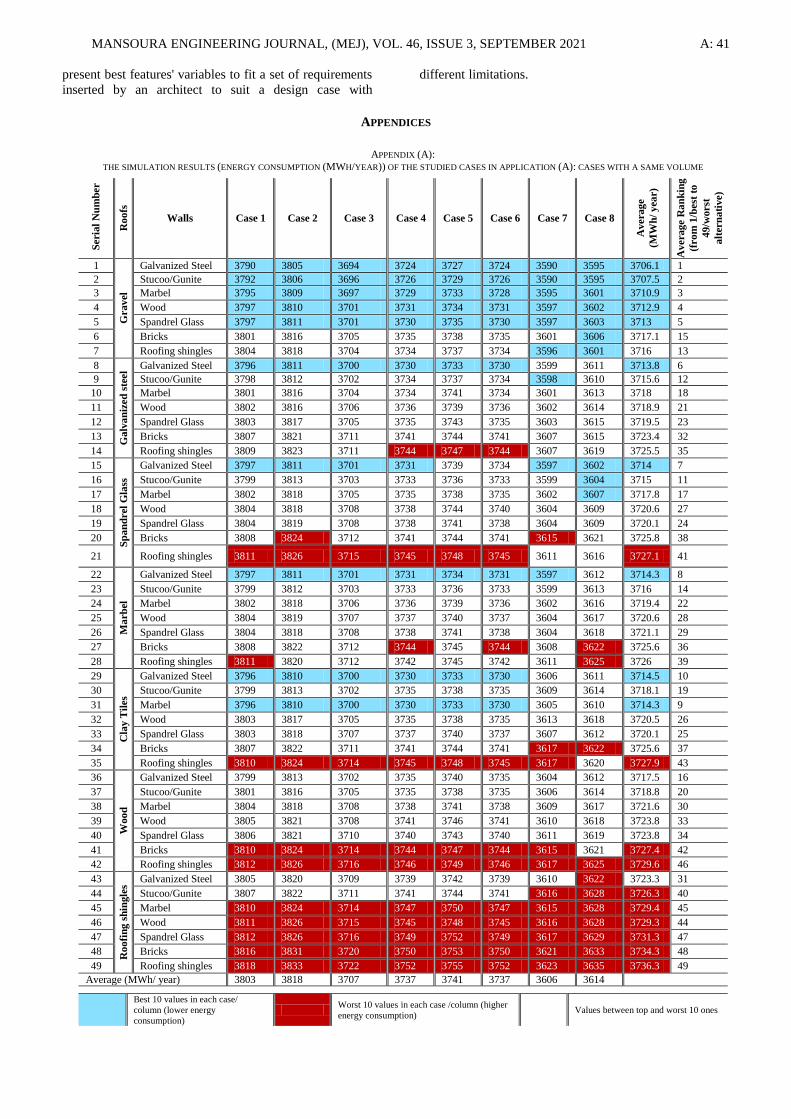
By analyzing and ordering the simulation results, it is
obvious that cases can be ordered based on energy
consumption ascending to case 7, case 8, case 3, case 6 or
4, case 5, case 1 and then case 2. Roof FMs can be also
ordered based on energy consumption in the majority of
cases ascending to gravel, galvanized steel, glass
(spandrel) or marble, clay tiles, wood then roofing
shingles, while walls' FMs can be ordered using their
energy consumption ascending to galvanized steel,
stucoo/gunite, marble, wood, spandrel glass, bricks then
roofing shingles. The best alternative through the whole
features and variables studied is case 7 with gravel roof
and galvanized steel or stucoo walls, while worst
alternative is case 2 with roofing shingles in its roof and
walls. Appendix (A) shows all the simulation results
along with best and worst 10 roof and walls' FMs to be
used for each case. As a result, cases 1-2, 3, 4-6 and 7-8
achieve around 3810, 3707, 3722 and 3610 MWh/year in
average (+/- 0.6%), respectively.
Fig. 2: Cases with a same volume and their specifications to be studied in application (A)

MANSOURA ENGINEERING JOURNAL, (MEJ), VOL. 46, ISSUE 3, SEPTEMBER 2021 A: 37
Fig
. 3: T
he en
ergy co
nsu
mptio
n o
f the cases, featu
res and
variab
les stud
ied in
app
lication
(A) (sim
ulated
by
eQuest 3
.65
)
A: 38 AMR MAMDOH ALI YOUSSEF
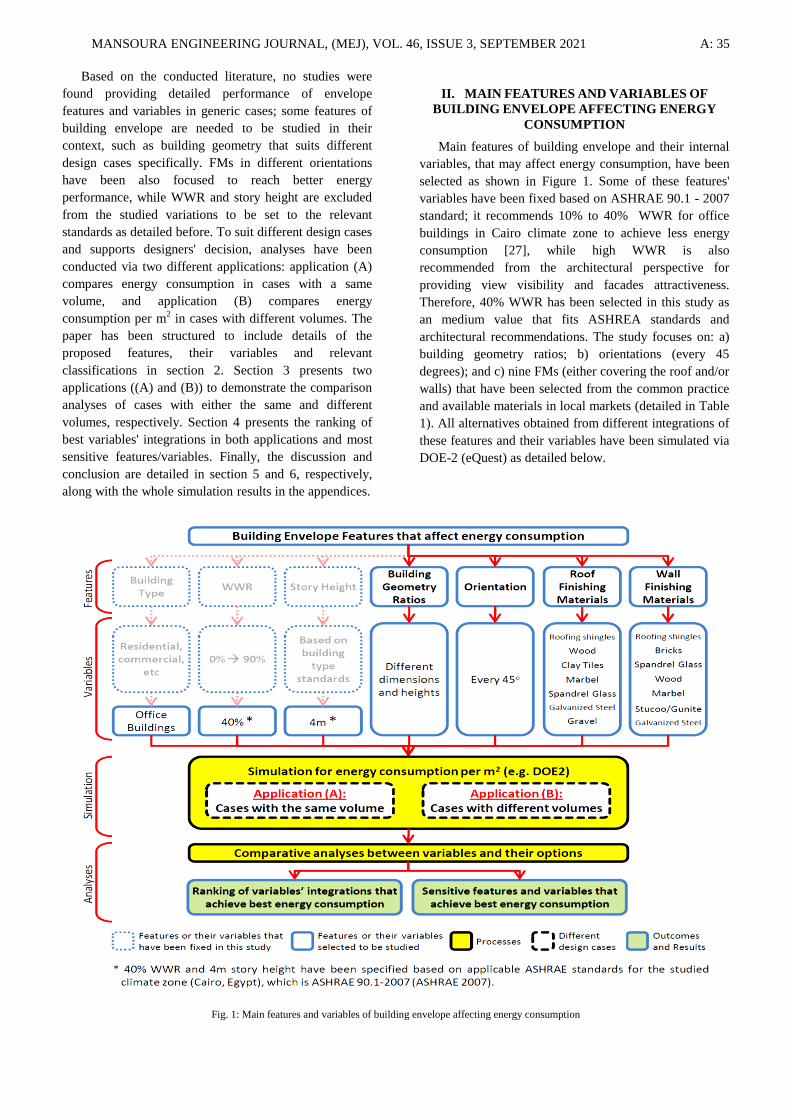
1.2. Application (B): Buildings with different volumes
In this application, buildings with different volumes
have been tested in different orientations, while FMs'
effect on both roof and walls have been ignored due to
their weak effect regardless building ratios and
orientations as presented in previous application (A). The
tested cases in this application are buildings with cubic
dimensions starting from 20m (length, width or height)
with 20m intervals in each direction till reaching 100m
(length or width) and 60m (height), also both 0 and 45
orientations from the azimuth have been included (150
total cases). As shown in Figure 4, cases in this
application have been denoted to reflect their dimensions
and orientation, for example, case (Ce3) refers to the case
with dimensions: 60m (length C), 100m (width e) and
60m (height 3), while case Ce3* refers to the same
previous case with orienting the building 45 degrees from
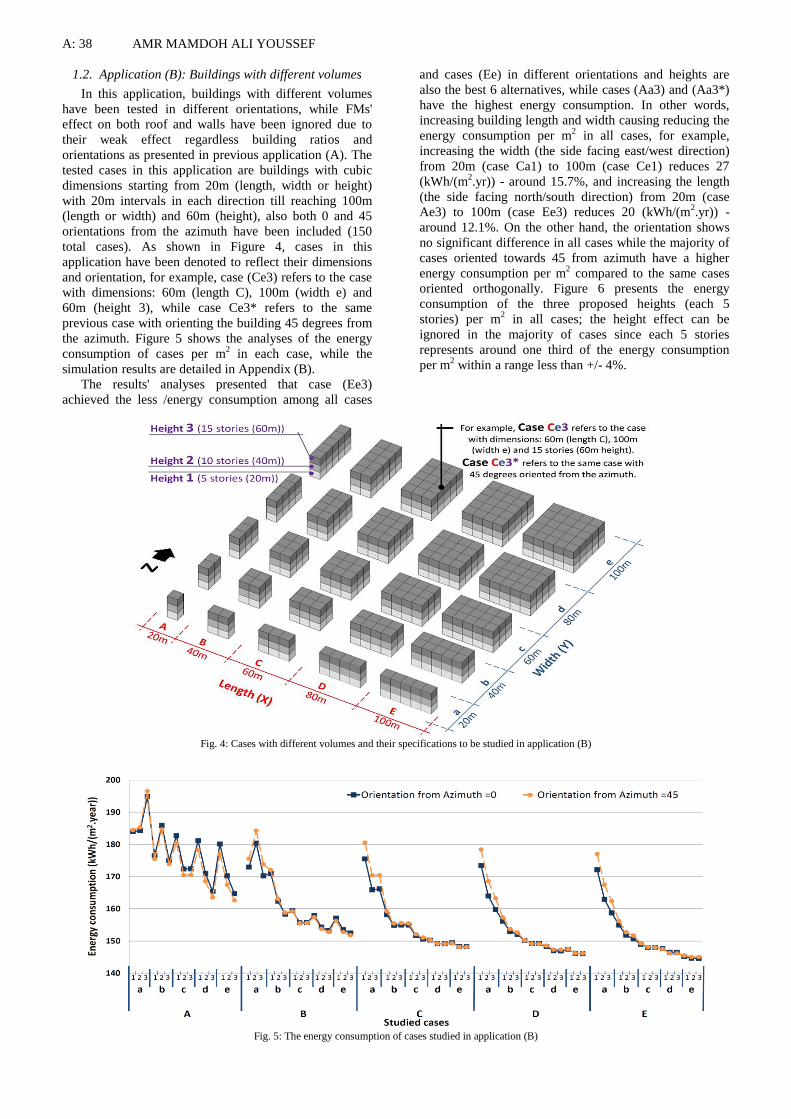
the azimuth. Figure 5 shows the analyses of the energy
consumption of cases per m2 in each case, while the
simulation results are detailed in Appendix (B).
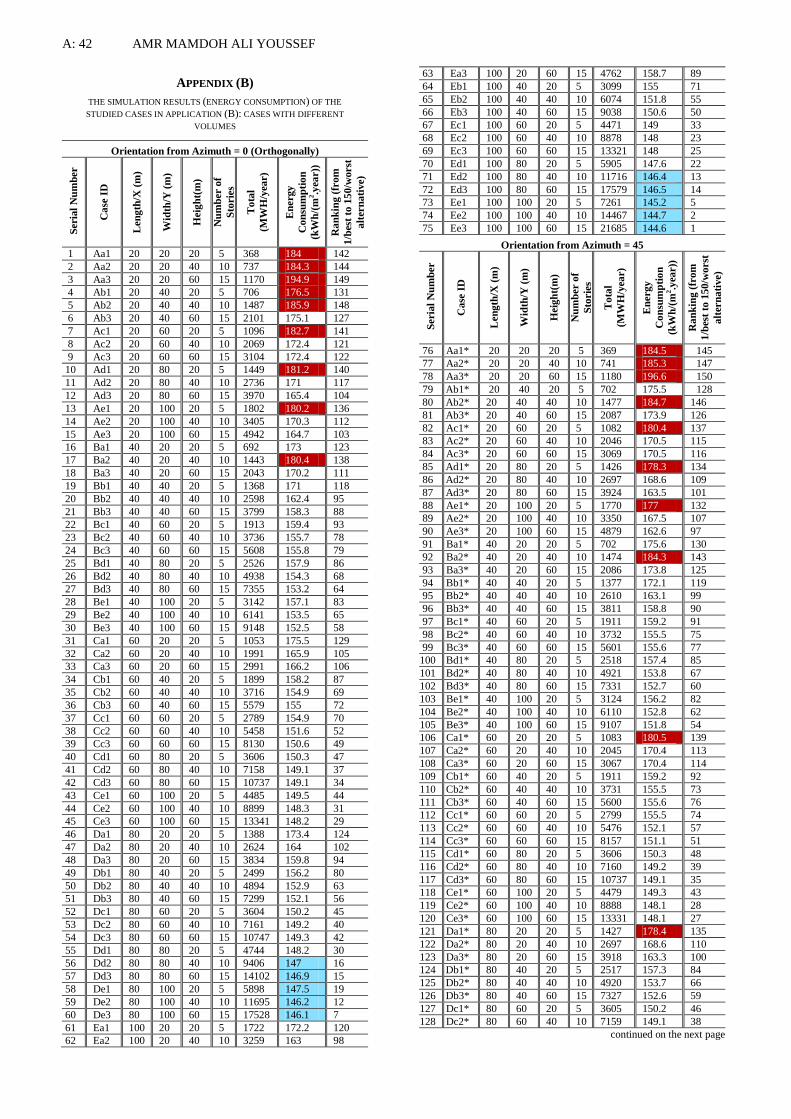
The results' analyses presented that case (Ee3)
achieved the less /energy consumption among all cases
and cases (Ee) in different orientations and heights are
also the best 6 alternatives, while cases (Aa3) and (Aa3*)
have the highest energy consumption. In other words,
increasing building length and width causing reducing the
energy consumption per m2 in all cases, for example,
increasing the width (the side facing east/west direction)
from 20m (case Ca1) to 100m (case Ce1) reduces 27
(kWh/(m2.yr)) - around 15.7%, and increasing the length
(the side facing north/south direction) from 20m (case
Ae3) to 100m (case Ee3) reduces 20 (kWh/(m2.yr)) -
around 12.1%. On the other hand, the orientation shows
no significant difference in all cases while the majority of
cases oriented towards 45 from azimuth have a higher
energy consumption per m2 compared to the same cases
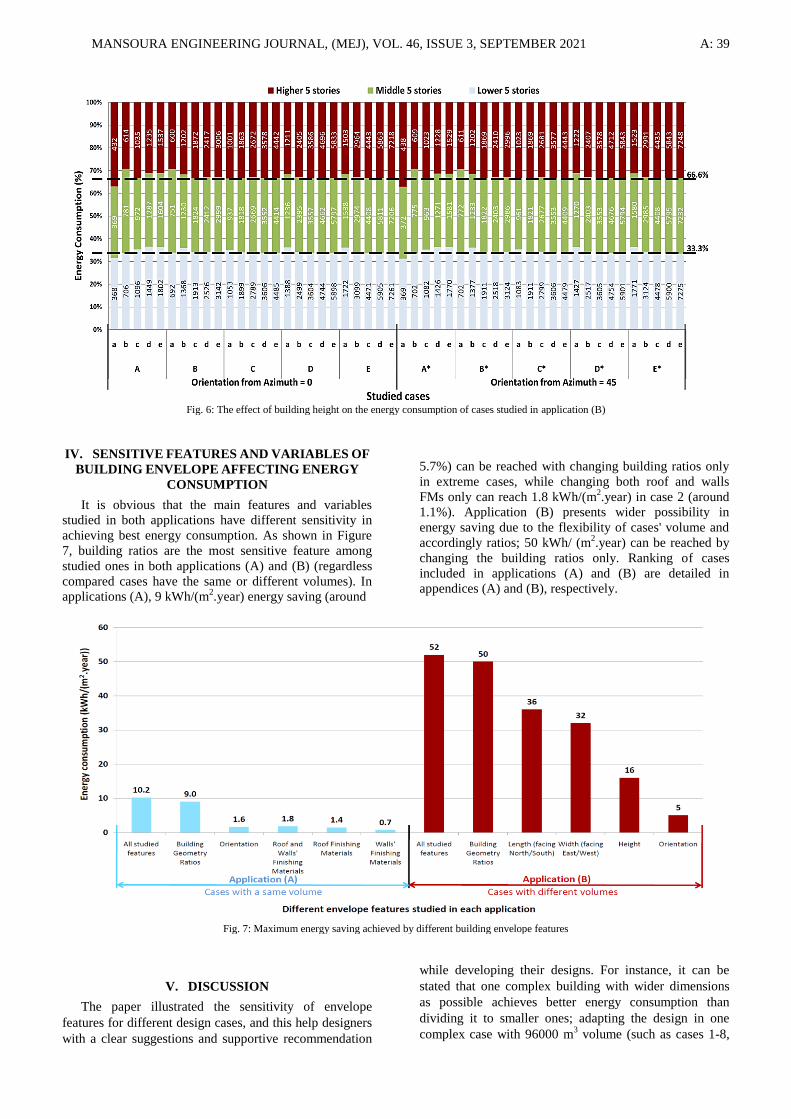
oriented orthogonally. Figure 6 presents the energy
consumption of the three proposed heights (each 5
stories) per m2 in all cases; the height effect can be
ignored in the majority of cases since each 5 stories
represents around one third of the energy consumption
per m2 within a range less than +/- 4%.
Fig. 4: Cases with different volumes and their specifications to be studied in application (B)
Fig. 5: The energy consumption of cases studied in application (B)
MANSOURA ENGINEERING JOURNAL, (MEJ), VOL. 46, ISSUE 3, SEPTEMBER 2021 A: 39
Fig. 6: The effect of building height on the energy consumption of cases studied in application (B)
IV. SENSITIVE FEATURES AND VARIABLES OF
BUILDING ENVELOPE AFFECTING ENERGY
CONSUMPTION
It is obvious that the main features and variables
studied in both applications have different sensitivity in
achieving best energy consumption. As shown in Figure
7, building ratios are the most sensitive feature among
studied ones in both applications (A) and (B) (regardless
compared cases have the same or different volumes). In
applications (A), 9 kWh/(m2.year) energy saving (around
5.7%) can be reached with changing building ratios only
in extreme cases, while changing both roof and walls
FMs only can reach 1.8 kWh/(m2.year) in case 2 (around
1.1%). Application (B) presents wider possibility in
energy saving due to the flexibility of cases' volume and
accordingly ratios; 50 kWh/ (m2.year) can be reached by
changing the building ratios only. Ranking of cases
included in applications (A) and (B) are detailed in
appendices (A) and (B), respectively.
Fig. 7: Maximum energy saving achieved by different building envelope features
V. DISCUSSION
The paper illustrated the sensitivity of envelope
features for different design cases, and this help designers
with a clear suggestions and supportive recommendation
while developing their designs. For instance, it can be
stated that one complex building with wider dimensions
as possible achieves better energy consumption than
dividing it to smaller ones; adapting the design in one
complex case with 96000 m3 volume (such as cases 1-8,

A: 40 AMR MAMDOH ALI YOUSSEF
case Ad3, case Bc2 separately) achieves within 3600 -
3900 MWh/year, while using 5 small cases with the same
total volume (such as Aa1-3 together with Ab1-2)
achieves more than 4400 MWh/year in total. In flexible
design problems such as new buildings in wider layouts,
it is recommended to focus building geometry,
dimensions and ratios to achieve better energy
consumption, while orientation and FMs comes later.
More specifically regarding building dimensions, the side
that faces north/south direction is more sensitive than the
other side, while the height and orientation have very less
sensitivity in affecting energy consumption as detailed in
application (B). FMs can be used in designs with lower
flexibility such as existing buildings, and in such cases,
using FMs in roofs have around the double sensitivity
compared to FMs in walls especially in cases with wider
roofs, for example, altering roof FM in case 7 and 8 in
application (A) may reach 29 MWh/year (around 1%),
while altering wall FMs in the same cases can reach only
13 MWh/year. However, best FM achieving energy
consumption in roofs and walls are gravel and galvanized
steel, respectively, while worst one is roofing shingles
among both roof and walls' FMs; it is recommended to
use other systems besides FMs for more energy savings
then. Changing FMs can achieve only 1.1% energy
saving in case 8 due its large volume compared to the
envelope area; reducing that ratio increases the probable
energy saving since the effect of the envelope features in
general and FMs in specific will be increased. In other
words, the sensitivity of FMs effect is inversely
proportional with the building volume; this is why FMs
effect is low although it reaches in a single room (as
shown in the literature) to around 4%. Also, the effect of
the other features such as building ratios have higher
effects in small cases (such as cases Aa, Ab, Ba and
others) as shown in previous Figure 5.
However, the study limitations can be outlined in: a)
cubic building shapes: sensitive features should be
studied within other shapes in future works, such as
courtyard dimensions in U shapes, wings length in L
shapes and others, although some features were found in
the literature as stated before; b) Hot climate zones: the
study can be extended easily towards other climates such
as humid and dry zones with less climate temperature;
sensitive features and variables may be altered then; c)
Applying single FMs in facades: although different
integrations of FMs in single facades have not been
focused in the study, the performance of applying two or
three FMs can be predicted easily from the analyses,
since FMs' ranking is clear but not sensitive in the
majority of cases, however, aesthetic, thermal and other
parameters may be needed then to apply FMs in facades
for having better architectural appearance.
VI. CONCLUSION
This paper presents a simulation-based comparative
analyses on building envelope features and their variables
from energy consumption perspective. Three main
envelope features in cubic office buildings in Egypt have
been focused, they are: a) building geometry ratios; b)
orientations (every 45 degrees); and c) common envelope
finishing materials (FMs): roofing shingles, galvanized
steel, wood, marbel and spandrel glass for both roof and
walls, also gravel and clay tiles for roofs in addition to
stucoo/gunite and bricks for walls. WWR has been set as
detailed in ASHRAE 90.1 - 2007 standard for office
buildings for Cairo climate zone. However, different
cases either with the same or different volumes have been
simulated and compared as application (A) and (B),
respectively. In application (A), 8 different building cases
with the same volume (96000 m3), different ratios and
orientations have been prepared along with applying nine
FMs on them, hence, 392 simulations have been
performed using DOE-2 via eQuest as a simulation tool.
In application (B), cubic office buildings have been
simulated starting from 20m as a unit and repeated
intervals. The study outcomes are ranking of features'
variables to be used in different cases along with
determining sensitive features and best variables;
comparative analyses have been conducted accordingly.
By analyzing and ranking the simulation results of
cases, best energy consumption can be achieved in
application (A) is case 7 (lower height with wider roof
oriented by 45 degrees from azimuth), and worst case is
case 2 (higher height with narrower roof oriented by 45
degrees from azimuth). Roof FMs can be ordered using
their energy consumption ascending to gravel, galvanized
steel, spandrel glass or marble, clay tiles, wood then
roofing shingles, while walls' FMs can be ordered using
their energy consumption ascending to galvanized steel,
stucoo/gunite, marble, wood, spandrel glass, bricks,
roofing shingles. However, best alternative in application
(A) through the whole features studied is case 7 with
gravel roof and galvanized steel or stucco walls, while
worst alternative is case 2 with roofing shingles in its roof
and walls. In application (B), dimensions are also the
most sensitive feature as in application (A), while the side
that faces north/south direction is more sensitive than the
other side. In general, the longer building dimensions the
better energy consumption; cases (Ee) in different
orientations and heights are the best 6 alternatives, while
cases (Aa3) and (Aa3*) have the highest energy
consumption. The majority of cases orientated towards 45
from azimuth have a higher energy consumption per m2
compared to the same cases oriented orthogonally, and
height effect can be ignored in the majority of cases since
each 5 stories represents around approximately one third
of the energy consumption per m2.
This comparative and sensitivity analyses are useful in
selecting main features to be focused from architects
during designing their envelope cases, since not all
building envelope features have the same energy effect.
More building envelope features and options can be
added through to extend the study, beyond what are
presented in this paper, such as different building shapes,
facade tilting, positions of windows, shades and others.
The effect of the economic parameter of such features'
integration (e.g. FMs' cost) should be also studied in
future works; this parameter may alter the sensitivity and
recommendations accordingly. In addition, other
evaluation criteria, design preference or priority could
extend the study widely, such as cooling, daylighting,
energy generation and architectural creativity. A complete
computational tool can been developed based on that to
MANSOURA ENGINEERING JOURNAL, (MEJ), VOL. 46, ISSUE 3, SEPTEMBER 2021 A: 41
present best features' variables to fit a set of requirements
inserted by an architect to suit a design case with
different limitations.
APPENDICES
APPENDIX (A):
THE SIMULATION RESULTS (ENERGY CONSUMPTION (MWH/YEAR)) OF THE STUDIED CASES IN APPLICATION (A): CASES WITH A SAME VOLUME
Seri
al
Nu
mb
er
Ro
ofs
Walls Case 1 Case 2 Case 3 Case 4 Case 5 Case 6 Case 7 Case 8
Av
era
ge
(MW
h/
yea
r)
Av
era
ge R
an
kin
g
(fro
m 1
/best
to
49/w
orst
alt
ern
ati
ve)
1
Grav
el
Galvanized Steel 3790 3805 3694 3724 3727 3724 3590 3595 3706.1 1
2 Stucoo/Gunite 3792 3806 3696 3726 3729 3726 3590 3595 3707.5 2
3 Marbel 3795 3809 3697 3729 3733 3728 3595 3601 3710.9 3
4 Wood 3797 3810 3701 3731 3734 3731 3597 3602 3712.9 4
5 Spandrel Glass 3797 3811 3701 3730 3735 3730 3597 3603 3713 5
6 Bricks 3801 3816 3705 3735 3738 3735 3601 3606 3717.1 15
7 Roofing shingles 3804 3818 3704 3734 3737 3734 3596 3601 3716 13
8
Ga
lva
niz
ed
ste
el
Galvanized Steel 3796 3811 3700 3730 3733 3730 3599 3611 3713.8 6
9 Stucoo/Gunite 3798 3812 3702 3734 3737 3734 3598 3610 3715.6 12
10 Marbel 3801 3816 3704 3734 3741 3734 3601 3613 3718 18
11 Wood 3802 3816 3706 3736 3739 3736 3602 3614 3718.9 21
12 Spandrel Glass 3803 3817 3705 3735 3743 3735 3603 3615 3719.5 23
13 Bricks 3807 3821 3711 3741 3744 3741 3607 3615 3723.4 32
14 Roofing shingles 3809 3823 3711 3744 3747 3744 3607 3619 3725.5 35
15
Sp
an
drel
Gla
ss
Galvanized Steel 3797 3811 3701 3731 3739 3734 3597 3602 3714 7
16 Stucoo/Gunite 3799 3813 3703 3733 3736 3733 3599 3604 3715 11
17 Marbel 3802 3818 3705 3735 3738 3735 3602 3607 3717.8 17
18 Wood 3804 3818 3708 3738 3744 3740 3604 3609 3720.6 27
19 Spandrel Glass 3804 3819 3708 3738 3741 3738 3604 3609 3720.1 24
20 Bricks 3808 3824 3712 3741 3744 3741 3615 3621 3725.8 38
21 Roofing shingles 3811 3826 3715 3745 3748 3745 3611 3616 3727.1 41
22
Ma
rb
el
Galvanized Steel 3797 3811 3701 3731 3734 3731 3597 3612 3714.3 8
23 Stucoo/Gunite 3799 3812 3703 3733 3736 3733 3599 3613 3716 14
24 Marbel 3802 3818 3706 3736 3739 3736 3602 3616 3719.4 22
25 Wood 3804 3819 3707 3737 3740 3737 3604 3617 3720.6 28
26 Spandrel Glass 3804 3818 3708 3738 3741 3738 3604 3618 3721.1 29
27 Bricks 3808 3822 3712 3744 3745 3744 3608 3622 3725.6 36
28 Roofing shingles 3811 3820 3712 3742 3745 3742 3611 3625 3726 39
29
Cla
y T
iles
Galvanized Steel 3796 3810 3700 3730 3733 3730 3606 3611 3714.5 10
30 Stucoo/Gunite 3799 3813 3702 3735 3738 3735 3609 3614 3718.1 19
31 Marbel 3796 3810 3700 3730 3733 3730 3605 3610 3714.3 9
32 Wood 3803 3817 3705 3735 3738 3735 3613 3618 3720.5 26
33 Spandrel Glass 3803 3818 3707 3737 3740 3737 3607 3612 3720.1 25
34 Bricks 3807 3822 3711 3741 3744 3741 3617 3622 3725.6 37
35 Roofing shingles 3810 3824 3714 3745 3748 3745 3617 3620 3727.9 43
36
Woo
d
Galvanized Steel 3799 3813 3702 3735 3740 3735 3604 3612 3717.5 16
37 Stucoo/Gunite 3801 3816 3705 3735 3738 3735 3606 3614 3718.8 20
38 Marbel 3804 3818 3708 3738 3741 3738 3609 3617 3721.6 30
39 Wood 3805 3821 3708 3741 3746 3741 3610 3618 3723.8 33
40 Spandrel Glass 3806 3821 3710 3740 3743 3740 3611 3619 3723.8 34
41 Bricks 3810 3824 3714 3744 3747 3744 3615 3621 3727.4 42
42 Roofing shingles 3812 3826 3716 3746 3749 3746 3617 3625 3729.6 46
43
Ro
ofi
ng
sh
ingle
s
Galvanized Steel 3805 3820 3709 3739 3742 3739 3610 3622 3723.3 31
44 Stucoo/Gunite 3807 3822 3711 3741 3744 3741 3616 3628 3726.3 40
45 Marbel 3810 3824 3714 3747 3750 3747 3615 3628 3729.4 45
46 Wood 3811 3826 3715 3745 3748 3745 3616 3628 3729.3 44
47 Spandrel Glass 3812 3826 3716 3749 3752 3749 3617 3629 3731.3 47
48 Bricks 3816 3831 3720 3750 3753 3750 3621 3633 3734.3 48
49 Roofing shingles 3818 3833 3722 3752 3755 3752 3623 3635 3736.3 49
Average (MWh/ year) 3803 3818 3707 3737 3741 3737 3606 3614
Best 10 values in each case/
column (lower energy
consumption)
Worst 10 values in each case /column (higher
energy consumption) Values between top and worst 10 ones
A: 42 AMR MAMDOH ALI YOUSSEF
APPENDIX (B)
THE SIMULATION RESULTS (ENERGY CONSUMPTION) OF THE
STUDIED CASES IN APPLICATION (B): CASES WITH DIFFERENT
VOLUMES
Orientation from Azimuth = 0 (Orthogonally)
Seri
al
Nu
mb
er
Ca
se I
D
Len
gth
/X (
m)
Wid
th/Y
(m
)
Hei
gh
t(m
)
Nu
mb
er o
f
Sto
rie
s
To
tal
(MW
H/y
ear)
En
erg
y
Co
nsu
mp
tio
n
(kW
h/(
m2.y
ear))
Ra
nk
ing (
from
1/b
est
to 1
50/w
orst
alt
ern
ati
ve)
1 Aa1 20 20 20 5 368 184 142
2 Aa2 20 20 40 10 737 184.3 144
3 Aa3 20 20 60 15 1170 194.9 149
4 Ab1 20 40 20 5 706 176.5 131
5 Ab2 20 40 40 10 1487 185.9 148
6 Ab3 20 40 60 15 2101 175.1 127
7 Ac1 20 60 20 5 1096 182.7 141
8 Ac2 20 60 40 10 2069 172.4 121
9 Ac3 20 60 60 15 3104 172.4 122
10 Ad1 20 80 20 5 1449 181.2 140
11 Ad2 20 80 40 10 2736 171 117
12 Ad3 20 80 60 15 3970 165.4 104
13 Ae1 20 100 20 5 1802 180.2 136
14 Ae2 20 100 40 10 3405 170.3 112
15 Ae3 20 100 60 15 4942 164.7 103
16 Ba1 40 20 20 5 692 173 123
17 Ba2 40 20 40 10 1443 180.4 138
18 Ba3 40 20 60 15 2043 170.2 111
19 Bb1 40 40 20 5 1368 171 118
20 Bb2 40 40 40 10 2598 162.4 95
21 Bb3 40 40 60 15 3799 158.3 88
22 Bc1 40 60 20 5 1913 159.4 93
23 Bc2 40 60 40 10 3736 155.7 78
24 Bc3 40 60 60 15 5608 155.8 79
25 Bd1 40 80 20 5 2526 157.9 86
26 Bd2 40 80 40 10 4938 154.3 68
27 Bd3 40 80 60 15 7355 153.2 64
28 Be1 40 100 20 5 3142 157.1 83
29 Be2 40 100 40 10 6141 153.5 65
30 Be3 40 100 60 15 9148 152.5 58
31 Ca1 60 20 20 5 1053 175.5 129
32 Ca2 60 20 40 10 1991 165.9 105
33 Ca3 60 20 60 15 2991 166.2 106
34 Cb1 60 40 20 5 1899 158.2 87
35 Cb2 60 40 40 10 3716 154.9 69
36 Cb3 60 40 60 15 5579 155 72
37 Cc1 60 60 20 5 2789 154.9 70
38 Cc2 60 60 40 10 5458 151.6 52
39 Cc3 60 60 60 15 8130 150.6 49
40 Cd1 60 80 20 5 3606 150.3 47
41 Cd2 60 80 40 10 7158 149.1 37
42 Cd3 60 80 60 15 10737 149.1 34
43 Ce1 60 100 20 5 4485 149.5 44
44 Ce2 60 100 40 10 8899 148.3 31
45 Ce3 60 100 60 15 13341 148.2 29
46 Da1 80 20 20 5 1388 173.4 124
47 Da2 80 20 40 10 2624 164 102
48 Da3 80 20 60 15 3834 159.8 94
49 Db1 80 40 20 5 2499 156.2 80
50 Db2 80 40 40 10 4894 152.9 63
51 Db3 80 40 60 15 7299 152.1 56
52 Dc1 80 60 20 5 3604 150.2 45
53 Dc2 80 60 40 10 7161 149.2 40
54 Dc3 80 60 60 15 10747 149.3 42
55 Dd1 80 80 20 5 4744 148.2 30
56 Dd2 80 80 40 10 9406 147 16
57 Dd3 80 80 60 15 14102 146.9 15
58 De1 80 100 20 5 5898 147.5 19
59 De2 80 100 40 10 11695 146.2 12
60 De3 80 100 60 15 17528 146.1 7
61 Ea1 100 20 20 5 1722 172.2 120
62 Ea2 100 20 40 10 3259 163 98
63 Ea3 100 20 60 15 4762 158.7 89
64 Eb1 100 40 20 5 3099 155 71
65 Eb2 100 40 40 10 6074 151.8 55
66 Eb3 100 40 60 15 9038 150.6 50
67 Ec1 100 60 20 5 4471 149 33
68 Ec2 100 60 40 10 8878 148 23
69 Ec3 100 60 60 15 13321 148 25
70 Ed1 100 80 20 5 5905 147.6 22
71 Ed2 100 80 40 10 11716 146.4 13
72 Ed3 100 80 60 15 17579 146.5 14
73 Ee1 100 100 20 5 7261 145.2 5
74 Ee2 100 100 40 10 14467 144.7 2
75 Ee3 100 100 60 15 21685 144.6 1
Orientation from Azimuth = 45
Seri
al
Nu
mb
er
Ca
se I
D
Len
gth
/X (
m)
Wid
th/Y
(m
)
Hei
gh
t(m
)
Nu
mb
er o
f
Sto
rie
s
To
tal
(MW
H/y
ear)
En
erg
y
Co
nsu
mp
tio
n
(kW
h/(
m2.y
ear))
Ra
nk
ing (
from
1/b
est
to 1
50/w
orst
alt
ern
ati
ve)
76 Aa1* 20 20 20 5 369 184.5 145
77 Aa2* 20 20 40 10 741 185.3 147
78 Aa3* 20 20 60 15 1180 196.6 150
79 Ab1* 20 40 20 5 702 175.5 128
80 Ab2* 20 40 40 10 1477 184.7 146
81 Ab3* 20 40 60 15 2087 173.9 126
82 Ac1* 20 60 20 5 1082 180.4 137
83 Ac2* 20 60 40 10 2046 170.5 115
84 Ac3* 20 60 60 15 3069 170.5 116
85 Ad1* 20 80 20 5 1426 178.3 134
86 Ad2* 20 80 40 10 2697 168.6 109
87 Ad3* 20 80 60 15 3924 163.5 101
88 Ae1* 20 100 20 5 1770 177 132
89 Ae2* 20 100 40 10 3350 167.5 107
90 Ae3* 20 100 60 15 4879 162.6 97
91 Ba1* 40 20 20 5 702 175.6 130
92 Ba2* 40 20 40 10 1474 184.3 143
93 Ba3* 40 20 60 15 2086 173.8 125
94 Bb1* 40 40 20 5 1377 172.1 119
95 Bb2* 40 40 40 10 2610 163.1 99
96 Bb3* 40 40 60 15 3811 158.8 90
97 Bc1* 40 60 20 5 1911 159.2 91
98 Bc2* 40 60 40 10 3732 155.5 75
99 Bc3* 40 60 60 15 5601 155.6 77
100 Bd1* 40 80 20 5 2518 157.4 85
101 Bd2* 40 80 40 10 4921 153.8 67
102 Bd3* 40 80 60 15 7331 152.7 60
103 Be1* 40 100 20 5 3124 156.2 82
104 Be2* 40 100 40 10 6110 152.8 62
105 Be3* 40 100 60 15 9107 151.8 54
106 Ca1* 60 20 20 5 1083 180.5 139
107 Ca2* 60 20 40 10 2045 170.4 113
108 Ca3* 60 20 60 15 3067 170.4 114
109 Cb1* 60 40 20 5 1911 159.2 92
110 Cb2* 60 40 40 10 3731 155.5 73
111 Cb3* 60 40 60 15 5600 155.6 76
112 Cc1* 60 60 20 5 2799 155.5 74
113 Cc2* 60 60 40 10 5476 152.1 57
114 Cc3* 60 60 60 15 8157 151.1 51
115 Cd1* 60 80 20 5 3606 150.3 48
116 Cd2* 60 80 40 10 7160 149.2 39
117 Cd3* 60 80 60 15 10737 149.1 35
118 Ce1* 60 100 20 5 4479 149.3 43
119 Ce2* 60 100 40 10 8888 148.1 28
120 Ce3* 60 100 60 15 13331 148.1 27
121 Da1* 80 20 20 5 1427 178.4 135
122 Da2* 80 20 40 10 2697 168.6 110
123 Da3* 80 20 60 15 3918 163.3 100
124 Db1* 80 40 20 5 2517 157.3 84
125 Db2* 80 40 40 10 4920 153.7 66
126 Db3* 80 40 60 15 7327 152.6 59
127 Dc1* 80 60 20 5 3605 150.2 46
128 Dc2* 80 60 40 10 7159 149.1 38
continued on the next page

MANSOURA ENGINEERING JOURNAL, (MEJ), VOL. 46, ISSUE 3, SEPTEMBER 2021 A: 43
APPENDIX (B):: continued
Orientation from Azimuth = 45
Seria
l N
um
ber
Ca
se I
D
Len
gth
/X (
m)
Wid
th/Y
(m
)
Hei
gh
t(m
)
Nu
mb
er o
f
Sto
rie
s
To
tal
(MW
H/y
ear)
En
erg
y
Co
nsu
mp
tio
n
(kW
h/(
m2.y
ear))
Ra
nk
ing (
from
1/b
est
to 1
50/w
orst
alt
ern
ati
ve)
129 Dc3* 80 60 60 15 10737 149.1 36
130 Dd1* 80 80 20 5 4754 148.6 32
131 Dd2* 80 80 40 10 9430 147.3 18
132 Dd3* 80 80 60 15 14142 147.3 17
133 De1* 80 100 20 5 5901 147.5 21
134 De2* 80 100 40 10 11695 146.2 10
135 De3* 80 100 60 15 17538 146.1 8
136 Ea1* 100 20 20 5 1771 177.1 133
137 Ea2* 100 20 40 10 3350 167.5 108
138 Ea3* 100 20 60 15 4873 162.4 96
139 Eb1* 100 40 20 5 3124 156.2 81
140 Eb2* 100 40 40 10 6109 152.7 61
141 Eb3* 100 40 60 15 9101 151.7 53
142 Ec1* 100 60 20 5 4478 149.3 41
143 Ec2* 100 60 40 10 8886 148.1 26
144 Ec3* 100 60 60 15 13321 148 24
145 Ed1* 100 80 20 5 5900 147.5 20
146 Ed2* 100 80 40 10 11695 146.2 11
147 Ed3* 100 80 60 15 17538 146.1 9
148 Ee1* 100 100 20 5 7275 145.5 6
149 Ee2* 100 100 40 10 14507 145.1 4
150 Ee3* 100 100 60 15 21755 145 3
Best 20 values (lower energy consumption)
Worst 20 values (higher energy consumption)
REFERENCES
[1] DOE-2 (2020) DOE-2 based software homepage, eQuest.
Available via http://www.doe2.com/equest.Accessed at 20 June
2020.
[2] P. Ihm, M. Krarti (2013) Design Optimization of Energy Efficient
Office Buildings in Tunisia. Building and Environment 58(4):81–
90. https://doi.org/10.1016/j.buildenv.2012.06.012. [3] X. Qian, S.W. Lee (2014) The Design and Analysis of Energy
Efficient Building Envelopes for the Commercial Buildings by
Mixed-Level Factorial Design and Statistical Methods. Proceeding of Fall 2014 Middle Atlantic American Society of Engineering,
Swarthmsore College in Swartz Creek, US. Available via:
https://www.semanticscholar.org/paper/. Accessed at 1 Apr 2021. [4] M. Ferrara, E. Fabrizio, J. Virgone, M. Filippi (2014) A
Simulation-Based Optimization Method for Cost-Optimal Analysis
of Nearly Zero Energy Buildings. Energy and Buildings 84:442–457. https://doi.org/10.1016/j.enbuild.2014.08.031.
[5] N. Harmati, Z. Magyar (2015) Influence of WWR, WG and
Glazing Properties on The Annual Heating and Cooling Energy Demand in Buildings. Energy Procedia78: 2458-2463.
https://doi.org/10.1016/j.egypro.2015.11.229.
[6] A. Aksamija (2015) High-performance building envelopes: design methods for energy efficient facades. Proceedings of: BEST4
Conference, USA.
[7] J. Hu, J. Wu (2015) Analysis on the Influence of Building Envelope to public buildings energy consumption based on DeST
simulation. Procedia Engineering 121: 1620-1627
https://doi.org/10.1016/j.proeng.2015.09.192. [8] B. Raji, M.J. Tenpierik, A. Van den Dobbelsteen (2016) An
assessment of energy-saving solutions for the envelope design of high-rise buildings in temperate climates: A case study in the
Netherlands. Energy and Buildings124: 210-221.
https://doi.org/10.1016/j.enbuild.2015.10.049. [9] M. Barozzi, J. Lienhard, A. Zanelli, C. Monticelli (2016) The
Sustainability of Adaptive Envelopes: Developments of Kinetic
Architecture. Procedia Engineering 155: 275-284. https://doi.org/10.1016/j.proeng.2016.08.029.
[10] J. Balter, C. Ganem, C. Discoli (2016) On High-rise Residential
Buildings in an Oasis-City: Thermal and Energy Assessment of
Different Envelope Materiality Above and Below Tree Canopy.
Energy and Buildings 113: 61-73. https://doi.org/10.1016/j.enbuild.2015.11.011.
[11] L. Liu, D. Wu1, X. Li, Sh. Hou, C. Liu, Ph. Jones (2017). Effect of
Geometric Factors on The Energy Performance of High-rise Office Towers in Tianjin, China. Building Simulation, 10: 625–641.
https://doi.org/10.1007/s12273-017-0359-y
[12] Y. Liu, S. Zou, H. Chen, X. Wu, W. Chen (2019) Simulation Analysis and Scheme Optimization of Energy Consumption in
Public Buildings. Advances in Civil Engineering 2019: 6326138.
https://doi.org/10.1155/2019/6326138. [13] D. D'Agostino, D. Parker, P. Melià (2019) Environmental and
Economic Implications of Energy Efficiency in New Residential Buildings: A Multi-Criteria Selection Approach. Energy Strategy
Reviews26: 100412 https://doi.org/10.1016/j.esr.2019.100412.
[14] D. Tuhus-Dubrow, M. Krarti (2010). Genetic-Algorithm Based Approach to Optimize Building Envelope Design for Residential
Buildings. Energy and Buildings 45: 1574–1581.
https://doi.org/10.1016/j.buildenv.2010.01.005. [15] S.C. Zerefos, C.A. Tessas, A.M. Kotsiopoulos, D. Founda, A.
Kokkini (2012) The Role of Building Form in Energy
Consumption: The Case of A Prismatic Building in Athens. Energy and Buildings 48: 97-102.
https://doi.org/10.1016/j.enbuild.2012.01.014.
[16] S.F. Al-Nuaimi, Kh.A. Khamis (2014) Thermal Impact Of
Different Interior Finishing Materials On Energy Consumption in
Bahrain. Journal of Energy Technologies and Policy 4:3: 30-49.
Available via: https://www.iiste.org/Journals/index.php/JETP/article/view/1166
3. Accessed at July 2021.
[17] V. Pukhkal (2015) Humidity Conditions for Exterior Walls Insulation (Case Study of Residential Housing Development in
Saint-Petersburg). Procedia Engineering 117: 616-623.
https://doi.org/10.1016/j.proeng.2015.08.222. [18] Y. Huang, R. Qi, L. Mi (2017) Investigation on Energy-Efficient
Retrofitting Measures on Commercial Building External Walls in
Cooling-Dominate Cities. Energy and Buildings 205: 2973-2979. https://doi.org/10.1016/j.proeng.2017.10.115.
[19] C. Alonso, F. Martín-Consuegra , I. Oteiza, E. Asensio, G. Pérez,
I. Martínez, B. Frutos (2017) Effect of Façade Surface Finish on Building Energy Rehabilitation. Solar Energy 146: 470-483.
https://doi.org/10.1016/j.solener.2017.03.009.
[20] V. Echarri-Iribarren, F. Echarri-Iribarren, C. Rizo-Maestre (2019) Ceramic Panels Versus Aluminium in Buildings: Energy
Consumption and Environmental Impact Assessment with a New
Methodology. Applied Energy233–234: 959-974. https://doi.org/10.1016/j.apenergy.2018.08.091.
[21] M. Khoukhi, A.F.Darsaleh, S. Ali (2020) Retrofitting an Existing
Office Building in the UAE Towards Achieving Low-Energy Building. Sustainability 12: 2573.
https://doi.org/10.3390/su12062573.
[22] S. Albadry (2016) Feasibility of Converting Existing Residential Buildings to Net Zero-Energy Buildings in Egypt. M.Sc, Center
for Sustainable Development, The American University of Cairo,
Egypt. Available via: http://dar.aucegypt.edu/handle/10526/4771. Accessed at: 1 Jan 2021.
[23] A. Khalil, M. Fikry, W. Abdeaal (2018) High Technology or Low
Technology for Buildings Envelopes in Residential Buildings in Egypt. Alexandria Engineering Journal57(4): 3779-3792.
https://doi.org/10.1016/j.aej.2018.11.001.
[24] M.A. William, A.M. El-Haridi, A.A. Hanafy, A.A. El-Sayed (2019). Assessing The Energy Efficiency Improvement for
Hospitals in Egypt Using Building Simulation Modeling. Engineering Research Journal 42 (1): 21-34.
https://doi.org/10.21608/erjm.2019.66266.
[25] S. Mahmoud, M. Fahmy, M. Mahdy, I. Elwy, M. Abdelalim
(2019). Comparative Energy Performance Simulation for Passive
and conventional Design: A Case Study in Cairo, Egypt. Energy
Reports6 (1): 699-704. https://doi.org/10.1016/j.egyr.2019.09.052 [26] S.M. Abd El-Rahman, S.I. Esmail, H.B. Khalil, Z. El-Razaz
(2020). Sustainable Optimization for Thermal Comfort and
Building Energy Efficiency in Cairo. Engineering Research Journal 166: A18-A34. https://doi.org/10.21608/erj.2020.135278
[27] ANSI/ASHRAE/IESNA Standard 90.1-2007.Final Qualitative
Determination, ASHRAE (2007).
Title Arabic:

A: 44 AMR MAMDOH ALI YOUSSEF
لاك الطاقت في المباوي تحليل مقارن معتمد علي المحاكاة لتحسيه استه
الإداريت في مصر
Arabic Abstract:
صاد الاخب بسبث أغفت اببي خسميك أل اسخلان طبلت خبصت في
اببي الإداسيت اىبش ابيئبث ابخيت اسبسة، زيث أ ز اسبث
خغيشاحب حؤثش في اسخلان اطبلت ػي طبق اسغ سخيبث خخفت.
سبث اشئيسيت حمذ اسلت ابسثيت حسي مبس ؼخذ ػي اسبوبة لأ ا
لأغفت اببي خغيشاحب، اسبث اخي سيخ دساسخب ي سب ابي
حخي ببلإضبفت اد اخشطيب اخبسخيت اشبئؼت. حج اذساست خلاي
حطبيمي )مبست برج راث زد ثببج أخش خغيشة(، ػي ح دساست
ي ب سبك، ح حسذيذ اسبث رج )ػيت سبوبة(. ببء ػ 055أوثش
اخغيشاث اؤثشة ذػ احخبر امشاس في اسبلاث اخصييت اخخفت،
وزه أفض دح خغيشاث صلا لأفض اسخلان طبلت في اسبلاث
ابرج امخشزت. ح حطبيك اذساست ػ اببي الإداسيت في صش، ح
أ خبئح اذساست ؼ اسبوبة. eQuest (DOE-2)اخخيبس بشبح
أ حمي الاسحفبع غ صيبدة سطر ابي يسمك أفض اسخلان طبلت في
زبت مبست برج ببي راث زد ثببج اؼىس صسير، الأسضيبث
اىت اسص اسذيذ ادف في اسائظ يثلا أفض ااد اخي
سخلان ابي طبلت، بيب أاذ حىسيت ح دساسخب ظس حمي ا
الأسطر ي ألب. في زبت مبست ببي راث زد خغيش، فئ الأبؼبد
الأفميت بي حث أوثش اسبث حأثيشا ػي اسخلان اطبلت خش اشبغ
ح حسي بلشت اازذ، بيب اد اخشطيب الاسحفبع حث ألب حأثيشا.
سبث اخغيشاث اخخفت ببلإضبفت إي حسذيذ فؼبيت اابرج حشحيب
اسبث اخخفت أفض خغيشاحب ببيت اذساست.