comparative analysis of amplicon and metagenomic ... · methodologies to study host-microbe...
TRANSCRIPT

General rights Copyright and moral rights for the publications made accessible in the public portal are retained by the authors and/or other copyright owners and it is a condition of accessing publications that users recognise and abide by the legal requirements associated with these rights.
Users may download and print one copy of any publication from the public portal for the purpose of private study or research.
You may not further distribute the material or use it for any profit-making activity or commercial gain
You may freely distribute the URL identifying the publication in the public portal If you believe that this document breaches copyright please contact us providing details, and we will remove access to the work immediately and investigate your claim.
Downloaded from orbit.dtu.dk on: Jul 22, 2020
Comparative analysis of amplicon and metagenomic sequencing methods reveals keyfeatures in the evolution of animal metaorganisms
Rausch, Philipp; Rühlemann, Malte; Hermes, Britt M.; Doms, Shauni; Dagan, Tal; Dierking, Katja; Domin,Hanna; Fraune, Sebastian; Von Frieling, Jakob; Hentschel, UteTotal number of authors:29
Published in:Microbiome
Link to article, DOI:10.1101/60431410.1186/s40168-019-0743-1
Publication date:2019
Document VersionEarly version, also known as pre-print
Link back to DTU Orbit
Citation (APA):Rausch, P., Rühlemann, M., Hermes, B. M., Doms, S., Dagan, T., Dierking, K., Domin, H., Fraune, S., VonFrieling, J., Hentschel, U., Heinsen, F. A., Höppner, M., Jahn, M. T., Jaspers, C., Kissoyan, K. A. B., Langfeldt,D., Rehman, A., Reusch, T. B. H., Roeder, T., ... Baines, J. F. (2019). Comparative analysis of amplicon andmetagenomic sequencing methods reveals key features in the evolution of animal metaorganisms. Microbiome,7, [133]. https://doi.org/10.1101/604314, https://doi.org/10.1186/s40168-019-0743-1

Comparative analysis of amplicon and metagenomic sequencing methods reveals key features 1
in the evolution of animal metaorganisms 2
Philipp Rausch1,2,3,&,*, Malte Rühlemann4,&, Britt Hermes1,2,5, Shauni Doms1,2, Tal Dagan6, Katja 3
Dierking7, Hanna Domin8, Sebastian Fraune8, Jakob von Frieling9, Ute Henschel Humeida10,11, 4
Femke-Anouska Heinsen4, Marc Höppner4, Martin Jahn10,11, Cornelia Jaspers11,12, Kohar Annie 5
B. Kissoyan7, Daniela Langfeldt6, Ateeqr Rehman4, Thorsten B. H. Reusch11,12, Thomas Röder9, 6
Ruth A. Schmitz6, Hinrich Schulenburg7, Ryszard Soluch6, Felix Sommer4, Eva Stukenbrock13,14, 7
Nancy Weiland-Bräuer6, Philip Rosenstiel4, Andre Franke4, Thomas Bosch8, John F. Baines1,2,* 8
Affiliations: 9
1 Evolutionary Genomics, Max Planck Institute for Evolutionary Biology, Plön, Germany 10
2 Institute for Experimental Medicine, Kiel University, Kiel, Germany 11
3 Laboratory of Genomics and Molecular Biomedicine, Department of Biology University of 12
Copenhagen, Copenhagen Ø, Denmark 13
4 Institute of Clinical Molecular Biology, Kiel University, Kiel, Germany 14
5 Lübeck Institute of Experimental Dermatology, University of Lübeck, Germany 15
6 Institute of General Microbiology, Kiel University, Kiel, Germany 16
7 Department of Evolutionary Ecology and Genetics, Zoological Institute, Kiel University, Kiel, 17
Germany 18
8 Zoological Institute, Kiel University, Kiel, Germany 19
9 Molecular Physiology, Zoological Institute, Kiel University, Kiel, Germany 20
10 Marine Ecology, Research Unit Marine Microbiology, GEOMAR Helmholtz Centre for Ocean 21
Research, Kiel, Germany 22
11 Kiel University, Kiel, Germany 23
12 Marine Ecology, GEOMAR Helmholtz Centre for Ocean Research, Kiel, Germany 24
13 Environmental Genomics, Max Planck Institute for Evolutionary Biology, Plön, Germany 25
14 Environmental Genomics, Botanical Institute, Kiel University, Kiel, Germany 26
.CC-BY-ND 4.0 International licenseis made available under aThe copyright holder for this preprint (which was not peer-reviewed) is the author/funder. It. https://doi.org/10.1101/604314doi: bioRxiv preprint

& Authors contributed equally 27
* Corresponding authors: Philipp Rausch ([email protected]), John F. Baines 28
([email protected]) 29
Email addresses: John F. Baines- [email protected], Thomas Bosch- 30
[email protected], Tal Dagan- [email protected], Katja Dierking- 31
[email protected], Hanna Domin- [email protected], Shauni Doms- 32
[email protected], Andre Franke- [email protected], Sebastian Fraune- 33
[email protected], Jakob von Frieling- [email protected], Femke-34
Anouska Heinsen- [email protected], Ute Henschel Humeida- 35
[email protected], Britt Marie Hermes- [email protected], Marc Höppner- 36
[email protected], Martin Jahn- [email protected], Cornelia Jaspers- 37
[email protected], Kohar Annie B. Kissoyan- [email protected], Daniela 38
Langfeldt- [email protected], Philipp Rausch- [email protected], Ateeqr 39
Rehman- [email protected], Thorsten B. H. Reusch- [email protected], Thomas 40
Röder- [email protected], Philip Rosenstiel- [email protected], Malte 41
Rühlemann- [email protected], Ruth A. Schmitz- [email protected], 42
Hinrich Schulenburg- [email protected], Ryszard Soluch- [email protected]
kiel.de, Felix Sommer- [email protected], Eva Stukenbrock- [email protected]
kiel.de, Nancy Weiland-Bräuer- [email protected] 45
46
.CC-BY-ND 4.0 International licenseis made available under aThe copyright holder for this preprint (which was not peer-reviewed) is the author/funder. It. https://doi.org/10.1101/604314doi: bioRxiv preprint
Abstract 47
Background: The interplay between hosts and their associated microbiome is now recognized 48
as a fundamental basis of the ecology, evolution and development of both players. These 49
interdependencies inspired a new view of multicellular organisms as “metaorganisms”. The goal 50
of the Collaborative Research Center “Origin and Function of Metaorganisms” is to understand 51
why and how microbial communities form long-term associations with hosts from diverse 52
taxonomic groups, ranging from sponges to humans in addition to plants. 53
Methods: In order to optimize the choice of analysis procedures, which may differ according to 54
the host organism and question at hand, we systematically compared the two main technical 55
approaches for profiling microbial communities, 16S rRNA gene amplicon- and metagenomic 56
shotgun sequencing across our panel of ten host taxa. This includes two commonly used 16S 57
rRNA gene regions and two amplification procedures, thus totaling five different microbial 58
profiles per host sample. 59
Conclusion: While 16S rRNA gene-based analyses are subject to much skepticism, we 60
demonstrate that many aspects of bacterial community characterization are consistent across 61
methods and that metagenomic shotgun results are largely dependent on the employed pipeline. 62
The resulting insight facilitates the selection of appropriate methods across a wide range of host 63
taxa. Finally, by contrasting taxonomic and functional profiles and performing phylogenetic 64
analysis, we provide important and novel insight into broad evolutionary patterns among 65
metaorganisms, whereby the transition of animals from an aquatic to a terrestrial habitat marks a 66
major event in the evolution of host-associated microbial composition. 67
68
Keywords: animal microbiome; evolution; phylosymbiosis; holobiont; metaorganism 69
70
Background 71
Dynamic host-microbe interactions have shaped the evolution of life. Virtually all plants and 72
animals are colonized by an interdependent complex of microorganisms, and there is growing 73
recognition that the biological processes of hosts and their associated microbial communities 74
function in tandem, often as biological partners comprising a collective entity known as the 75
metaorganism [1]. For instance, symbiotic bacteria contribute to host health and development in 76
critical ways, ranging from nutrient metabolism to regulating whole life cycles [2] and in turn 77
.CC-BY-ND 4.0 International licenseis made available under aThe copyright holder for this preprint (which was not peer-reviewed) is the author/funder. It. https://doi.org/10.1101/604314doi: bioRxiv preprint
benefit from habitats and resources the host provides. Moreover, it is well established that 78
perturbations of the microbiome likely play an important role in many host disease states [3]. 79
However, researchers have yet to elucidate the mechanisms driving these interactions, as the 80
exact molecular and cellular processes are only poorly understood. 81
An integrated view on the metaorganism encompasses a cross-disciplinary approach 82
that addresses how and why microbial communities form long-term associations with their hosts. 83
Despite widespread agreement that the interdependencies of microbes and their hosts warrant 84
elucidation, there remains considerable incongruity between researchers regarding the best 85
methodologies to study host-microbe interactions. The development of standardized protocols 86
for characterizing and analyzing host-associated microbiomes across the breadth of the tree of 87
life are thus crucial to understand the evolution and function of metaorganisms without the 88
issues of technical inconsistencies or data quality. 89
Rapidly growing interest in microbiome research has been bolstered by the ability to 90
profile diverse microbial communities using next-generation sequencing (NGS). This culture-91
free, high-throughput technology enables identification and comparison of entire microbial 92
communities [4]. Metagenomics typically encompasses two particular sequencing strategies: 93
amplicon sequencing, most often of the 16S rRNA gene as a phylogenetic marker, or shotgun 94
sequencing, which captures the complete breadth of DNA within a sample [4]. 95
The use of the 16S ribosomal RNA gene as a phylogenetic marker has proven to be an 96
efficient and cost-effective strategy for microbiome analysis, and even allows for the imputation 97
of functional content based on taxon abundances [5]. However, PCR-based phylogenetic marker 98
protocols are vulnerable to biases through sample preparation and sequencing errors, in 99
particular the choice of which hypervariable regions of the 16S rRNA gene targeted seem to be 100
among the biggest factors underlying technical differences in microbiome composition [6-8]. 101
Furthermore, 16S rRNA gene amplicon sequencing is typically limited to taxonomic classification 102
at the genus-level depending on the database and classifiers used [9], and provides only limited 103
functional information [5]. These well-recognized limitations of amplicon-based microbial 104
community analyses have raised concerns about the accuracy and reproducibility of 16S rRNA 105
phylogenetic marker studies and have led to an increased interest in developing more reliable 106
methods for amplicon library preparation and sequencing [8, 10]. 107
Shotgun metagenomics, on the other hand, offers the advantage of species- and strain-108
level classification of bacteria. Additionally, it allows researchers to examine the functional 109
relationships between hosts and bacteria by determining the functional content of samples 110
.CC-BY-ND 4.0 International licenseis made available under aThe copyright holder for this preprint (which was not peer-reviewed) is the author/funder. It. https://doi.org/10.1101/604314doi: bioRxiv preprint
directly [9, 11], and enables the exploration of yet unknown microbial life that would otherwise 111
remain unclassifiable [12]. However, the relatively high costs of shotgun metagenomics and 112
more demanding bioinformatic requirements have precluded its use for microbiome analysis on 113
a wide scale [4, 9]. 114
In this study, we set out to systematically compare experimental and analytical aspects of 115
the two main technical approaches for profiling microbial communities, 16S rRNA gene 116
amplicon- and shotgun sequencing, across a diverse array of host species studied in the 117
Collaborative Research Center 1182, “Origin and Function of Metaorganisms”. The ten host 118
species range from basal aquatic metazoans [Aplysina aerophoba (sponge) and Mnemiopsis 119
leidyi (comb jelly)], to marine and limnic cnidarians (Aurelia aurita, Nematostella vectensis, 120
Hydra vulgaris), standard vertebrate (Mus musculus) and invertebrate model organisms 121
(Drosophila melanogaster, Caenorhabditis elegans), to Homo sapiens, in addition to wheat 122
(Triticum aestivum) and a standardized mock community. This setup provides a breadth of 123
samples in terms of taxonomic composition and diversity. Conducting standardized data 124
generation procedures on these diverse samples on the one hand provides a unique and 125
powerful opportunity to systematically compare alternative methods, which display considerable 126
heterogeneity in performance. On the other hand, this information enables researchers working 127
on these or similar host species to choose the experimental (e.g. hypervariable region) or 128
analytical pipelines that best suit their needs, which will be a valuable resource to the greater 129
community of host-microbe researchers. Finally, we identified a number of interesting, broad 130
scale patterns contrasting the aquatic and terrestrial environment of metaorganisms, which also 131
reflect their evolutionary trajectories. 132
133
Results 134
Our panel of hosts includes ten species, for which five biological replicates each were included 135
(see Figure S1). The majority of hosts are metazoans, including the “gold sponge” (Aplysina 136
aerophoba), moon jellyfish (Aurelia aurita), comb jellyfish (Mnemiopsis leidyi), starlet sea 137
anemone (Nematostella vectensis), fresh-water polyp Hydra vulgaris, roundworm 138
(Ceanorhabditis elegans), fruit fly (Drosophila melanogaster), mouse (Mus musculus), human 139
(Homo sapiens), as well as the inclusion of wheat (Triticum aestivum), which can serve as an 140
outgroup to the metazoan taxa. Drosophila melanogaster was additionally sampled using two 141
different methods targeting feces and intestinal tissue. Nucleic acid extraction procedures were 142
conducted according to the needs of the individual host species (see Methods and 143
.CC-BY-ND 4.0 International licenseis made available under aThe copyright holder for this preprint (which was not peer-reviewed) is the author/funder. It. https://doi.org/10.1101/604314doi: bioRxiv preprint
Supplementary Material), after which all DNA templates were subjected to a standard panel of 144
sequencing procedures. For 16S rRNA gene amplicon sequencing we used primers flanking two 145
commonly used variable regions, the V1V2 and V3V4 regions. Further, for each region we 146
compared a single-step fusion-primer PCR to a two-step procedure designed to improve the 147
accuracy of amplicon-based studies [8]. Finally, all samples were also subjected to shotgun 148
sequencing, such that five different sequence profiles were generated for each sample. While a 149
single classification pipeline was employed for all four 16S rRNA gene amplicon sequence 150
profiles, community composition based on shotgun data was initially evaluated using five 151
different classification methods (Kraken [13], MEGAN [14], MetaPhlan [15], MetaPhlan2 [16], 152
and SortmeRNA [17]; see Supplementary Material for comparative descriptions). However, due 153
to the advantage of simultaneously performing taxonomical and functional classification of 154
shotgun reads, as well as overall good performance (see analyses of mock community below), 155
MEGAN was used as a representative pipeline for most subsequent analyses. 156
Performance of data processing and quality control: All data generated from amplicons were 157
subject to the same stringent quality control pipeline including read-trimming, merging of forward 158
and reverse reads, quality filtering based on sequence quality and estimated errors, and chimera 159
removal (see Methods). The one step V1V2 amplicon data showed the highest rate of read-160
survival (62.13 ± 23.90%, mean ± s.d.) followed by the corresponding two step method (mean= 161
49.85 ± 23.90%, mean ± s.d.), in large part due to the greater coverage of this comparatively 162
shorter amplicon (~312 bp). In contrast, 42.02 ± 16.41% and 36.88 ± 23.89% of the total reads 163
were included in downstream analysis for the one step and two step V3V4 data, respectively. 164
The longer V3V4 amplicon (~470 bp) was more affected by drops in quality at the end of the 165
reads, which decreases the overlap of forward and reverse reads and thus increases the 166
chances of sequencing errors (Figure S2, for final sample sizes see Table S1). Overall, aside 167
from chimera removal, each quality control step resulted in a comparatively greater loss of 168
V3V4- compared to V1V2 data. On the other hand, the V3V4 one step method yields the lowest 169
number of chimeras, suggesting a lower rate of chimera formation- and/or detection in this 170
approach (variable region- F1,214=3.8881, P=0.0499, PCR- F1,214=8.1751, P=0.0047, variable 171
region×PCR- F1,214=6.4733, P=0.0117; Linear Mixed Model with organism as random factor). 172
Among all host taxa we observe the highest proportion of retained reads in the V1V2 one step 173
method and the lowest in the V3V4 two step method (Figure S2B; variable region- 174
F1,215=74.9989, P<0.0001, PCR- F1,215=21.0743, P<0.0001; Linear Mixed Model with organism 175
as random factor). After quality filtering and the identification of bacterial reads, an average of 176
0.46 Gb of shotgun reads per sample was achieved (range 0.03 to 2.1 Gb) (Figure S3A, for final 177
.CC-BY-ND 4.0 International licenseis made available under aThe copyright holder for this preprint (which was not peer-reviewed) is the author/funder. It. https://doi.org/10.1101/604314doi: bioRxiv preprint

sample sizes see Table S1). To provide an initial assessment and comparison between the 178
amplicon and shotgun-based techniques, we plotted the discovered classifiable taxa and 179
functions for the entire pooled dataset. Although the methods differ distinctly, each method 180
shows a plateau in the number of discovered entities (see Figure S3C, S3D). 181
Mock community: The analysis of standardized mock communities is an important measure to 182
ensure general quality standards in microbial community analysis. In this study we employed a 183
commercially available mixture of eight bacterial- and two yeast species. Comparison among the 184
amplification procedures (one- and two step PCR), 16S rRNA gene regions (V1V2, V3V4) and 185
shotgun data reveals varying degrees of similarity to the expected microbial community 186
composition (Figure 1). One discrepancy is apparent due to the misclassification of 187
Escherichia/Shigella, whose close relationship make delineation at the genus level difficult 188
based on the V1V2 region are subsequently classified to Enterobacteriaceae (Figure 1A, Figure 189
S4). Classification of this bacterial group also differs according to shotgun pipeline employed, 190
due to different naming and taxonomic standards of the respective databases (Escherichia, 191
Shigella, Enterobacteriaceae refer to the Escherichia/ Shigella cluster) [18]. However, overall the 192
amplicon-based profiles show the closest matches to the expected community. The V1V2 one 193
step method and Kraken show the lowest degree of deviation between observed and expected 194
abundances of the focus taxa (Table 1, Figure S4). However, Kraken falsely detects a large 195
number of taxa not present in the mock communities. In addition, the relative abundances of 196
fungi in the mock community were relatively well predicted by MEGAN and Kraken, while 197
MetaPhlan2 failed to identify Cryptococcus and replaced it with several other taxa (see Figure 198
1). 199
Next, we evaluated alpha and beta diversity across the different technical and analytical 200
methods. Interestingly, most methods overestimate taxon richness but underestimate complexity 201
(as measured by the Shannon index) of the mock community, which could reflect biases arising 202
from grouping taxon abundances together (Figure 1, Figure S4, Figure S5, Table S2). Overall 203
the amplicon methods appear to more accurately reflect alpha diversity, although significant 204
differences are present with regard to the amplified region (species richness: variable region- 205
F1,10=6.3657, P=0.0302; Shannon H: method- F1,9=3.330, P=0.1014, variable region- F1,9=6.110, 206
P=0.0354). With regard to beta diversity, the largest distance to the expected composition is 207
observed in SortmeRNA applied to shotgun sequencing of the mock community, while the 208
amplicon-based techniques, MEGAN, and MetaPhlan2 show the lowest distance (Figure 1D, 209
Figure S5, Table S3). Pairwise tests show almost no differences between the amplicon-based 210
techniques, while all shotgun based methods significantly differ from each other (Table S4). 211
.CC-BY-ND 4.0 International licenseis made available under aThe copyright holder for this preprint (which was not peer-reviewed) is the author/funder. It. https://doi.org/10.1101/604314doi: bioRxiv preprint

Thus, in conclusion shotgun-based analysis pipelines yield a higher degree of variability/error 212
compared to the amplicon-based approaches based on a simple mock community. For 213
subsequent analyses we thus mainly focus on the amplicon-based data and MEGAN as a 214
representative shotgun-based pipeline, for which eukaryotic (e.g. fungal) sequences were not 215
included in the following analyses. 216
Taxonomic diversity within and between hosts: To evaluate the performance of our panel of 217
metagenomic methods over the range of complex host-associated communities in our 218
consortium, we next employed a panel of alpha- and beta diversity analyses to these samples, 219
which also provides an opportunity to infer broad patterns across animal taxa based on a 220
standardized methodology. Measures of alpha diversity display overall consistent values with 221
respect to host species, although many significant differences between technical methods are 222
present, mostly in a host-specific manner (Figure 2A-B). However, several host taxa display high 223
levels of consistency across methods including A. aurita, C. elegans, D. melanogaster and 224
H. sapiens, which show almost no significant differences between methods. Discrepancies and 225
individual recommendations for each host species are discussed in the Supplementary Material 226
(see Figures S6-S16). An intriguing observation is the tendency of aquatic hosts to display 227
higher alpha diversity values than those of terrestrial hosts, which is supported by average 228
differences between aquatic and terrestrial hosts and by relative consistent comparisons among 229
single host species as well (Figure 2C-D, Table S5). Finally, we also compared alpha diversity 230
estimates based on the other shotgun-based classifiers, which in most cases display greater 231
heterogeneity than among the 16S rRNA gene amplicon and MEGAN based estimates alone, 232
but still recover similar trends (Figure S17). 233
In order to investigate broad patterns of bacterial community similarity according to 234
metagenomic procedure and host species, we performed beta diversity analyses including all 235
host samples and each of their five different methodological profiles. This analysis reveals an 236
overall strong signal of host species, irrespective of the method used to generate community 237
profiles (Table 2, Figure 3). Pairwise comparisons between hosts are significant in all cases 238
except for samples derived from the V3V4 two step protocol, which did not consistently reach 239
significance after correction for multiple testing (Table S6). Further, complementary to the 240
observations made for alpha diversity, we also find strong signals of community differentiation 241
between the aquatic and terrestrial hosts (Table 2, Figure 3B and D). The separation between 242
these environments appears to be stronger based on amplicon data, whereas the separation 243
between hosts is stronger based on shotgun derived data (Table 2). Clustering of communities 244
based on host environment is consistent irrespective of the underlying shotgun analysis method, 245
.CC-BY-ND 4.0 International licenseis made available under aThe copyright holder for this preprint (which was not peer-reviewed) is the author/funder. It. https://doi.org/10.1101/604314doi: bioRxiv preprint

although the topologies vary strongly (e.g. MetaPhlan2, see Figure S18). To further evaluate the 246
variability among biological replicates, we evaluated intra-group distances according to host 247
species, which reveals organisms with generally higher community variability (i.e. C. elegans, 248
A. aurita, H. sapiens, H. vulgaris, T. aestivum, and M. leidyi) than other host organisms in our 249
study (N. vectensis, M. musculus, D. melanogaster, and A. aerophoba; Figure S19A, C). 250
Interestingly, intra-group distances also significantly differ between the aquatic and terrestrial 251
environments, whereby aquatic organisms tend to display less variable communities than 252
terrestrial ones (Figure S19B, D). The low performance of T. aestivum in subsequent analyses 253
possibly originates from its commercial origin and low bacterial biomass relative to host material. 254
To identify individual drivers behind patterns of beta diversity, we performed indicator 255
species analysis [19] at the genus level with respect to method, host species, and environment. 256
Based on the amplicon data we identified 56 of 313 indicators to display consistent associations 257
across all four amplicon techniques, such as Bacteroides, Barnesiella, Clostridium IV, and 258
Faecalibacterium in H. sapiens, and Helicobacter and Mucispirillum in M. musculus, whereas 259
other associations were limited to e.g. only one variable region (Table S7, S8). However, the 260
overall pattern of host associations is largely consistent across methods (Figure S20). We also 261
identified numerous indicator genera for aquatic and terrestrial hosts (Table S9, S10). Indicator 262
analyses based on shotgun data reveals a smaller and less diverse set of host-specific 263
indicators, which however show many congruencies with the amplicon-based data. 264
Functional diversity within and between hosts: To examine the diversity (gene richness) of 265
metagenomic functions across host species we evaluated EggNOG [20] annotations (assembly-266
based and MEGAN) to obtain a general functional spectrum (evolutionary genealogy of genes: 267
Non-supervised Orthologous Groups), in addition to annotations derived from a database 268
dedicated to functions interacting with carbohydrates (CAZY- Carbohydrate-Active enZYmes) 269
[21]. Overall the individual host communities differ drastically in gene richness (EggNOG genes 270
(MEGAN): χ2=52.202, P<2.10×10⁻¹⁶; EggNOG genes (assembly): χ2=49.986, P<2.10×10⁻¹⁶; 271
CAZY: χ2=48.815, P<2.10×10⁻¹⁶; approximate Kruskal-Wallis test). Although the values also 272
differ considerably between methods, overall the functional repertoires are most diverse in the 273
vertebrate hosts, while only H. vulgaris and A. aerophoba as aquatic hosts carry a comparably 274
diverse functional repertoire (Figure 4A, Figure S21). Interestingly, in contrast to taxonomic 275
diversity we observe no difference in functional diversity between aquatic and terrestrial hosts. 276
Next we examined community differences (beta diversity) at the functional level, which 277
are overall more pronounced (average adj. R2: 0.5084, Figure 4) than those based on taxonomic 278
.CC-BY-ND 4.0 International licenseis made available under aThe copyright holder for this preprint (which was not peer-reviewed) is the author/funder. It. https://doi.org/10.1101/604314doi: bioRxiv preprint

(genus level) classification (shotgun adj. R2: 0.4756; amplicon average adj. R2: 0.4594, see 279
Table 2 and Table 3, Figure 3 and Figure 4, Figure S22). On the functional level aquatic and 280
terrestrial hosts are considerably less distinct than observed at the taxonomic level (taxonomic 281
shotgun adj. R2=0.0766; taxonomic amplicon average adj. R2=0.0690, functional shotgun 282
average adj. R2=0.0441, see Table 2 and Table 3, Figure 4, S22). Variability of the functional 283
repertoires was lowest in A. aerophoba, D. melanogaster feces and M. musculus gut contents, 284
while H. vulgaris, C. elegans, and D. melanogaster gut samples displayed the highest intra-285
group distances, which translates to a higher amount of functional heterogeneity between 286
replicates (Figure S23). This reflects in large part the patterns we observed in taxonomic 287
variability of those host-associated communities (Figure S19). 288
Indicator functions: To identify specific functions that are characteristic of individual hosts, we 289
applied indicator analysis to functional categories. General functions in EggNOG reveal several 290
interesting patterns, including CRISPR related genes in A. aerophoba, H. sapiens, and 291
H. vulgaris, suggesting a particular importance of viruses in these communities. A. aerophoba 292
possess a large set of characteristic genes involved in energy production and conversion, amino 293
acid transport and metabolism, replication, recombination and repair. M. musculus and others 294
appear to possess a large number of characteristic genes involved in carbohydrate transport 295
and metabolism, energy production and conversion, transcription and cell 296
wall/membrane/envelope biogenesis. H. vulgaris is characterized by a high number of genes 297
involved in transcription, inorganic ion transport, metabolism, signal transduction mechanisms 298
and cell wall/membrane/envelope biogenesis (Table S11-S13). 299
Analysis of carbohydrate-metabolizing functions based on CAZY [21] (Carbohydrate-300
Active enZYmes) reveals the highest number of characteristic glycoside hydrolases (GH) in 301
H. sapiens and M. musculus, whereas polysaccharide lyases (PLs) for non-hydrolytic cleavage 302
of glycosidic bonds are present in A. aerophoba and H. sapiens (Table S14). Parts of the 303
cellulosome are only present in A. aerophoba and not in M. musculus or H. sapiens. 304
Interestingly, only the freshwater H. vulgaris carries characteristic auxiliary CAZYs involved in 305
lignin and chitin digestion, which may reflect dietary adaptations of the host. 306
Performance of metagenome imputation from 16S rRNA gene amplicon data using 307
PICRUSt across metaorganisms: Researchers often desire to obtain the insight gained from 308
functional metagenomic information despite being limited to 16S rRNA gene data, for which 309
imputation methods such as PICRUSt can be employed [5]. However, due to their dependence 310
on variable region and database coverage [5], these imputations must be viewed with caution. 311
.CC-BY-ND 4.0 International licenseis made available under aThe copyright holder for this preprint (which was not peer-reviewed) is the author/funder. It. https://doi.org/10.1101/604314doi: bioRxiv preprint

Given our data set of both 16S amplicon- and shotgun metagenomic sequences, we 312
systematically evaluated the performance of PICRUSt predictions across hosts and amplicon 313
data type (V1V2, V3V4, one step/ two step protocol). Beginning with the mock community, the 314
V1V2 region displays lower performance for imputing functions compared to V3V4, as indicated 315
by a higher weighted Nearest Sequenced Taxon Index (NSTI) (t=17.812, P=1.119×10⁻⁷, Figure 316
S24). High NSTI values imply low availability of genome representatives for the respective 317
sample, due to either large phylogenetic distance for each OTU to its closest sequenced 318
reference genome or a high frequency of poorly represented OTUs [5]. Comparing the 319
distribution of functional categories based on Clusters of Orthologous Groups (COG) [22] 320
between the different imputations (no cutoff applied) and the actual shotgun based repertoires 321
reveals considerable overlap (Figure S24). Exceptions include the functional category R 322
(general function prediction only), which is almost absent in the shotgun data, while the category 323
S (function unknown) is more abundant among the shotgun based functional data (Figure S24). 324
Next we evaluated functional imputations for the different host species and amplification 325
methods. We found no significant difference in average NSTI values or prediction success 326
(NSTI < 0.15) between amplification protocols or variable region. However, approximately a third 327
(31.8%) of the samples are lost due to incomplete imputation (NSTI > 0.15; Figure 5A). Notable 328
problematic host taxa are A. aerophoba and H. vulgaris, for which no sample remained below 329
the NSTI cutoff value. Other host taxa displayed clear differential performance with regard to the 330
variable region used, whereby H. sapiens, N. vectensis and T. aestivum were successfully 331
predicted based on V3V4, but not V1V2. However, when we employ Procrustes tests to 332
compare community functional profiles based on shotgun sequencing (single assembly, 333
MEGAN) and functional imputations at the COG-category level, we find a lower correspondence 334
of the V3V4-based imputations compared to those based on V1V2 (Figure 5B), while the 335
amplification methods displayed no significant difference. A similar pattern is observed when we 336
correlate community differences based on shotgun results and lower level (single functions) 337
COG annotations based on PICRUSt, although the difference is not significant (F1,18=0.6172, 338
P=0.4423). 339
To investigate the similarities among methods in more detail, we merged shotgun and 340
PICRUSt based annotations at the level of COG categories. Principle coordinate analysis 341
reveals only small differences between imputations with regard to amplification method or 342
variable region (Figure 5C). However, large differences exist between the PICRUSt and shotgun 343
based functional repertoires, as well as between the shotgun techniques (MEGAN, single 344
assembly). Differences between the shotgun techniques were significant, but smaller than their 345
.CC-BY-ND 4.0 International licenseis made available under aThe copyright holder for this preprint (which was not peer-reviewed) is the author/funder. It. https://doi.org/10.1101/604314doi: bioRxiv preprint

distance to the imputed functional spectra (Figure 5C, Table S15). Finally, we examined the 346
abundance of functional categories within single host taxa and the mock community, which 347
reveals a higher relative abundance of functions related to energy production and conversion 348
(C), replication, recombination and repair (L), and unknown functions (S) in the assembly-based 349
annotations compared to the other techniques, which might be an important driver of the 350
observed differences (Figure S24, S25). 351
Thus, in summary, the PICRUSt imputed functional repertoires significantly differ from 352
actual shotgun profiles. While variation in imputation success is largely dependent on the identity 353
of the particular host community, V3V4 appears to more often yield successful imputations. 354
However, when successful, V1V2-derived imputations display closer similarity to actual 355
functional profiles. Finally, the amplification method (one step, two step) appears to have no 356
significant effect on the quality of functional imputation. These data therefore support the notion 357
that metagenome imputations should be evaluated with care, as they depend on the underlying 358
variable region and sample source. 359
Phylogenetic patterns in microbial community composition: The term “phylosymbiosis” 360
refers to the phenomenon where the pattern of similarity among host-associated microbial 361
communities parallels the phylogeny of their hosts [23]. Highly divergent hosts with drastic 362
differences in physiology and life history might be expected to overwhelm the likelihood of 363
observing phylosymbiosis, which is typically observed within a given host clade [23]. However, 364
the factors driving differences in composition among our panel of hosts may also be expected to 365
vary in terms of the bacterial phylogenetic scale at which they are most readily observed [24]. 366
Thus, we evaluated the degree to which bacterial community relationships (beta diversity) reflect 367
the underlying phylogeny of our hosts at a range of bacterial taxonomic ranks, spanning from the 368
genus to the phylum level. 369
In order to assess the general overlap between beta diversity and phylogenetic distance 370
of the host species, we performed Procrustes analysis [25]. These analyses reveal that the 371
strongest phylogenetic signal is observed when bacterial taxa are grouped at the order and/or 372
family level, whereby the one step protocols and the V3V4 region display greater correlations to 373
phylogenetic distance (Figure 6A). A similar pattern is observed for shotgun based community 374
profiles (i.e. MEGAN), although its fit increases again at the genus level. Measuring beta 375
diversity based on co-occurrence of bacterial taxa between hosts (Jaccard) displays a weaker 376
correspondence to host phylogeny than the abundance-based measure (Bray-Curtis) (Figure 6). 377
.CC-BY-ND 4.0 International licenseis made available under aThe copyright holder for this preprint (which was not peer-reviewed) is the author/funder. It. https://doi.org/10.1101/604314doi: bioRxiv preprint

To assess the fit of individual host taxa, we examined the residuals of the correlation 378
between community composition and phylogenetic distance. This reveals a large variation in 379
correspondence among host taxa, with M. musculus, M. leidyi, H. sapiens and D. melanogaster 380
(feces) displaying the highest, while H. vulgaris, C. elegans, and A. aerophoba display the 381
lowest correspondence between their microbiome composition and phylogenetic position 382
(largest residuals Figure S26). Furthermore, terrestrial hosts display an overall better 383
correspondence between co-occurrences of bacterial genera and host relatedness (V1V2 one 384
step: Z=2.9578, P=0.0025), as do measurements based on V3V4 (one step: Z=2.7496, 385
P=0.0054; two step: Z=2.8097, P=0.0046; approximate Wilcoxon test). 386
Next, given the peak of correspondence between bacterial community composition and 387
host phylogeny observed at the order and/or family level, we set out to identify individual 388
community members whose abundances best correlate to host phylogenetic distance using 389
Moran’s eigenvector method [26]. This reveals 41 bacterial families and 36 orders with 390
significant phylogenetic signal based on one or more amplicon data set, whereby 16 families 391
and 18 orders display repeated associations across methods (e.g. Clostridia, Ruminococcaceae, 392
Helicobacteraceae, Lachnospiraceae, Coriobacteriaceae, Erysipelotrichaceae, 393
Selenomonadales, Bacteroidales, Desulfovibrionales; Table S16; Figure S27, S28). Analyzing 394
communities based on shotgun data on the other hand identifies 215 bacterial families and 97 395
orders associated with phylogenetic distances, whereby 69 and 27 display repeated 396
associations, respectively (Table S17; Figure S29, S30). The combined results of these 397
analyses identify several families and orders with strong and consistent phylogenetic 398
associations, in particular for the vertebrate hosts (e.g. Bacteroidaceae/ Bacteroidales, 399
Bifidobacteriaceae/ Bifidobacteriales, Coriobacteriaceae/ Coriobacteriales, Desulfovibrionaceae/ 400
Desulfovibrionales, Erysipelotrichaceae/ Erysipelotrichales, Porphyromonadaceae/ 401
Bacteroidales, Ruminococcaceae/ Clostridiales, Selenomonadales; see Table S16). Other 402
individual examples include bacteria related to Helicobacteraceae/ Campylobacterales in 403
A. aurita, which are observed in other marine cnidarians and may be involved in sulfur oxidation 404
[27]. Alcanivoracaceae, an alkane degrading bacterial group, is strongly associated to the 405
coastal cnidarian N. vectensis. This association might originate from adaptation to a polluted 406
coastal environment [28]. Acidobacteria Gp6 and Gp9 specifically occur in A. aerophoba and are 407
commonly associated to the core microbial community of sponges [29]. 408
Phylogenetic patterns in functional community composition: In order to contrast the 409
patterns observed at the taxonomic level to those based on function we used Procrustes 410
correlation to measure the overlap between phylogenetic distance and community distance 411
.CC-BY-ND 4.0 International licenseis made available under aThe copyright holder for this preprint (which was not peer-reviewed) is the author/funder. It. https://doi.org/10.1101/604314doi: bioRxiv preprint

based on the panel of functional categories in our analyses. Interestingly, the two functional 412
categories displaying the greatest correspondence to host phylogeny are the CAZY and single 413
EggNOG based functions (Figure 6). The remainder of patterns between phylogeny and 414
bacterial functional spectra differed among the host species and functional categories (Figure 415
S26), T. aestivum and D. melanogaster (feces) display the lowest correspondence, while 416
C. elegans, M. musculus and H. sapiens display the best correspondence (lowest residuals, 417
Figure S26) between their functional repertoire and phylogenetic position. As observed for the 418
taxonomic analyses, terrestrial hosts again display a slightly better correlation than aquatic hosts 419
(smaller residuals), in particular for the co-abundance of EggNOG categories (Z=2.2116, 420
P=0.0267), CAZY (Z=2.0393, P=0.0414) and the co-occurrence of EggNOG categories 421
(Z=2.7377, P=0.0061) and genes (Z=3.3062, P=0.0007; approximate Wilcoxon test) among 422
hosts. 423
Finally, to reveal individual functions correlating to host phylogeny, we used the 424
aforementioned Moran’s I eigenvector analyses with additional indicator analyses to narrow the 425
potential clade associations. Interestingly, most functions that correlate to a specific host 426
taxon/clade (1-3 taxa) are mainly restricted to vertebrate hosts or in combination with a 427
vertebrate host (Table S18-S21). This pattern is repeated across all functional annotations used 428
in this study. Examples include fucosyltransferases, fucosidases, polysaccharide binding 429
proteins, as well as hyaluronate, xanthan, and chondroitin lyases that stem from CAZY (see 430
Figure S31, Table S18). These functions are all related to glycan- and mucin degradation and 431
interaction, which mediate many intimate host-bacterial interactions and are also observed in 432
subsequent analyses based on general functional databases (EggNOG; Table S19, Table S20). 433
Many other phylogenetically correlated functions appear to be driven by the vertebrate hosts as 434
well, which likely reflects the high functional diversity within this group (see Figure 4 and Figure 435
S23). Only LPXC and LPXK (EggNOG), genes involved in the biosynthesis of the outer 436
membrane, are exclusively associated to the non-vertebrate hosts (LPXC: UDP-3-O-acyl-N-437
acetylglucosamine deacetylase, LPXK: Tetraacyldisaccharide 4'-kinase), as is an oxidative 438
damage repair function (MSRA reductase) associated to H. vulgaris (Table S19, Figure S31). 439
EggNOG category Q (secondary metabolites biosynthesis, transport and catabolism) is also 440
characteristic of invertebrate hosts in addition to a small number of metabolic functions (i.e. 441
dehydrogenases, mono oxygenase, fatty acid hydroxylase; MEGAN based; Table S20, Figure 442
S31). More generally we observe a high number of genes of unknown function (S), carbohydrate 443
transport and metabolism (G), replication, recombination and repair (L), cell 444
wall/membrane/envelope biogenesis (M), and energy production and conversion (C) (Table S21 445
.CC-BY-ND 4.0 International licenseis made available under aThe copyright holder for this preprint (which was not peer-reviewed) is the author/funder. It. https://doi.org/10.1101/604314doi: bioRxiv preprint

Figure S31). Finally, antibiotic resistance genes and virulence factors also show frequent 446
phylogenetic and host specific signals (Table S19, S20; Figure S31). 447
448
Discussion 449
Despite the great number of metagenomic studies published to date, which range in their focus 450
on technical, analytical or biological aspects, our study represents a unique contribution given its 451
breadth of different host samples analyzed with a panel of standardized methods. In particular, 452
the tradeoffs between 16S rRNA gene amplicon- versus shotgun sequencing concerning 453
amplification bias, functional information and both monetary and computational costs, warrant 454
careful consideration when designing research projects. While 16S rRNA gene amplicon-based 455
analyses are subject to considerable skepticism and criticism, we demonstrate that in many 456
aspects similar, if not superior characterization of bacterial communities is achieved by these 457
methods, although discrepancies associated with shotgun based data are largely dependent on 458
the analytic pipeline. We also show, however, that important insight can be gained through the 459
combination of taxonomic- and functional profiling, and that imputation-based functional profiles 460
significantly differ from actual profiles. Our findings thus provide a guide for selecting an 461
appropriate methodology for metagenomic analyses across a variety of metaorganisms. Finally, 462
these data provide novel insight into the broad scale evolution of host-associated bacterial 463
communities, which can be viewed as particularly reliable given the repeatability of observations 464
(e.g. differences between aquatic and terrestrial hosts, indicator taxa) across methods. 465
Given the concerns regarding the accuracy of 16S rRNA gene amplicon sequencing, 466
other studies such as that of Gohl et al. [8] performed systematic comparisons of different library 467
preparation methods, and found superior results for a two step amplification procedure. This 468
method offers the additional advantage that one panel of adapter/barcode sequences can be 469
combined with any number of different primers. Our first analyses were based on a standard 470
mock community including Gram positive and Gram negative bacteria from the Bacilli and 471
Gamma Proteobacteria (eight species), as well as two fungi, which did not support an 472
improvement of performance based on the two step protocol. However, a number of changes 473
were made to the Gohl et al. [8] protocol to adapt it to our lab procedures (e.g. larger reaction 474
volumes, polymerase, variable region, heterogeneity spacers) that may contribute to these 475
discrepancies, in addition to our different and diverse set of samples and other factors with 476
potential influence on the performance of amplicon sequencing [6-8, 30-32]. The complexity of 477
the mock community, i.e. the number of taxa, distribution, and phylogenetic breadth, may also 478
.CC-BY-ND 4.0 International licenseis made available under aThe copyright holder for this preprint (which was not peer-reviewed) is the author/funder. It. https://doi.org/10.1101/604314doi: bioRxiv preprint
have an influence on the discovery of clear trends in amplification biases or detection limits for 479
certain taxonomic groups [33]. Thus, the even and phylogenetically shallow mock community in 480
our study may be less suited than the staggered and diverse mixtures used in other studies [8], 481
but still provides valuable information on repeatability, primer biases, and accuracy [33]. 482
Nonetheless, when applied to our range of complex host-associated communities, we also found 483
that significant differences in most parameters were due to the variable region rather than 484
amplification method, and in many cases biological signals were either improved- or limited to 485
the one step protocol. 486
Additional sources of variation influencing the outcome of our 16S rRNA gene amplicon-487
based community profiling are the bioinformatic pipelines we employed, starting from trimming 488
and merging to clustering and classification, which are stringent and incorporate more reliable 489
de novo clustering algorithms [34] as well as different classification databases [35]. 490
Heterogeneity among the different amplicon approaches is however far smaller than the 491
observed heterogeneity between amplicon and shotgun methods, or within different shotgun 492
analyses, as observed in other benchmarking studies [31]. Differences between shotgun 493
approaches have been investigated in detail and also yield varying performances among 494
classifiers, but in general find a comparatively high performance of MEGAN based approaches 495
[9, 36, 37], which we also confirm in our study. 496
Given the limited number of studies that have compared imputed- and shotgun derived 497
functional repertoires [5, 38], our study also provides important additional insights. As imputation 498
by definition is data-dependent, the differential performance and prediction among hosts in our 499
study may in large part be explained by the amount of bacteria isolated, sequenced, and 500
deposited (16S rRNA or genome) from these hosts or their respective environments. This seems 501
to be most critical for the aquatic hosts. Furthermore, we observe a clear effect of variable region 502
on the prediction performance, which is most obvious based on the mock community. The 503
PICRUSt algorithm was developed and tested using primers targeting V3V4 16S rRNA, thus 504
optimization of the imputation algorithm might be biased towards this target over the V1V2 505
variable region. Although these performance differences, in particular the bias towards model 506
organisms compared to less characterized communities (e.g. hypersaline microbial mats), were 507
previously shown [5], our study provides additional, experimentally validated guidelines for a 508
number of novel host taxa. 509
Interestingly, the strongest correspondence between bacterial community similarity and 510
host genetic distance was detected at the bacterial order level for most of the employed 511
.CC-BY-ND 4.0 International licenseis made available under aThe copyright holder for this preprint (which was not peer-reviewed) is the author/funder. It. https://doi.org/10.1101/604314doi: bioRxiv preprint

methods. This may on the one hand reflect the deep phylogenetic relationships between our 512
host taxa, such that turnover of bacterial taxa erodes phylosymbiosis over time [23, 24]. On the 513
other hand, some of the more striking observations made among our host taxa are the 514
differences between aquatic and terrestrial hosts, both at the level of alpha and beta diversity. 515
Based on a molecular clock for the 16S rRNA gene of roughly 1% divergence per 50 million 516
years [39], bacterial order level divergence corresponds well with the timing of animal 517
terrestrialization (425-500 MYA) [40, 41]. Although evolutionary rates can widely vary among 518
bacteria species [42], other studies of individual gut microbial lineages such as the Enteroccoci 519
indicate that animal terrestrialization was indeed a likely driver of diversification [43]. Specifically 520
the changing availability of carbohydrates in the host gut can be seen as a main driver of this 521
diversification, which is consistent with the association of CAZY-based functional repertoires 522
correlating to phylogenetic distance in our data set [23, 44]. 523
In contrast to the patterns observed based on 16S rRNA gene amplicon-based profiles, 524
the differentiation of bacterial communities according to host habitat was less pronounced based 525
on functional genomic repertoires. This raises the possibility that the colonization of land by 526
ancient animals required the acquisition of new, land-adapted bacterial lineages to perform 527
some of the same ancestral functions. The overall observation of increased beta diversity among 528
terrestrial- compared to aquatic hosts (Figure S19) could in part reflect differential acquisition 529
among host lineages after colonizing land, although dispersal in the aquatic environment may on 530
the other hand act as a greater homogenizing factor among aquatic hosts. The stronger 531
correspondence between bacterial community- and host phylogenetic distance among terrestrial 532
hosts is also generally consistent with this hypothesis. However, the higher alpha diversity and 533
the slightly lower correspondence with the phylogenetic patterns in aquatic hosts may also 534
indicate a higher influence of environmental bacteria or a lack of physiological control over 535
bacterial communities. 536
Bacterial taxa and functions involved in carbohydrate utilization were among the most 537
notable associations to individual hosts, groups of hosts, and/or host phylogenetic relationships. 538
Taxa such as Bacteroidales, Ruminococcaceae/ Ruminococcales, and Clostridia associated to 539
humans and/or mice include members known for a mucosal lifestyle, and these hosts also 540
display the most diverse and abundant repertoire of carbohydrate active enzymes (particularly 541
glycosylhydrolases) in their microbiome. Other examples include sialidases, esterases, and 542
fucosyltransferases, as well as different extracellular structures that appear to be specific to 543
aquatic hosts, indicating differences in mucus and glycan composition according to this host 544
environment. Glycan structures provide a direct link between the microbial community and the 545
.CC-BY-ND 4.0 International licenseis made available under aThe copyright holder for this preprint (which was not peer-reviewed) is the author/funder. It. https://doi.org/10.1101/604314doi: bioRxiv preprint

host via attachment, nutrition, and communication [45, 46], and the composition of mucin and 546
glycan structures themselves show strong evolutionary patterns and are distinct among 547
taxonomic groups [44]. Thus, a high diversity of glycan structures within and between hosts may 548
determine the specific sets carbohydrate facilitating enzymes of the respective microbial 549
communities. 550
In addition to the bacterial carbohydrate hydrolases that digest surrounding host and 551
dietary carbohydrates, we also identified a number of glycosyltransferases associated with 552
capsular polysaccharide synthesis (Table S19, Table S20). This type of glycosylation is an 553
important facilitator for host association and survival [47] and plays a crucial role in infections 554
[48]. The capsule prevents opsonization and phagocytosis through the host immune system and 555
gives the bacterium the ability to modulate its interaction with the host environment [47, 49]. This 556
type of manipulation is performed by mutualists and pathogens alike [47, 50] via molecular 557
mimicry and tolerogenic immune modulation [51, 52]. Bacterial glycan products like 558
polysaccharide A (PSA) may also have direct benefits for the host, as it can interfere with the 559
host immune system by increasing immunologic tolerance, or inhibit the binding of other 560
microbes (e.g. Helicobacter hepaticus [53]). Thus, capsular and excreted glycan structures are 561
important for the successful colonization and persistence in different environments [54, 55] and 562
host organisms [47, 55]. 563
564
Conclusions 565
In summary, the systematic comparison of five different metagenomic sequencing 566
methods applied to ten different holobiont yielded a number of novel technical and biological 567
insights. Although important exceptions will exist, we demonstrate that broad scale biological 568
patterns are largely consistent across these varying methods. While the richer information 569
provided by shotgun sequencing is clearly desirable and is likely to surpass amplicon-based 570
profiling techniques in the foreseeable future, technical variability among analytical pipelines 571
currently surpasses that observed between different amplicon methods. As many aspects of 572
differential performance in our study are host-specific (more detailed description of individual 573
hosts can be found in the Supplementary Material), future development and benchmarking 574
analyses would also benefit from a including a range of different host/environmental samples. 575
576
Methods 577
.CC-BY-ND 4.0 International licenseis made available under aThe copyright holder for this preprint (which was not peer-reviewed) is the author/funder. It. https://doi.org/10.1101/604314doi: bioRxiv preprint

DNA extraction and 16S rRNA gene amplicon sequencing: Protocols for each host type are 578
described in the Supplementary Material (see also Figure S18-S28). Each library (16S rRNA 579
gene amplicon, shotgun) included at least one mock community sample based on the 580
ZymoBIOMICS™ Microbial Community DNA Standard (Lot.: ZRC187324, ZRC187325) 581
consisting of 8 bacterial species (Pseudomonas aeruginosa (10.4%), Escherichia coli (9.0%), 582
Salmonella enterica (11.8%), Lactobacillus fermentum (10.3%), Enterococcus faecalis (14.1%), 583
Staphylococcus aureus (14.6%), Listeria monocytogenes (13.2%), Bacillus subtilis (13.2%)) and 584
two fungi (Saccharomyces cerevisiae (1.6%), Cryptococcus neoformans (1.8%)). 585
The 16S rRNA gene was amplified using uniquely barcoded primers flanking the V1 and 586
V2 hypervariable regions (27F-338R) and V3V4 hypervariable regions (515F-806R) with fused 587
MiSeq adapters and heterogeneity spacers in a 25 µl PCR [32]. For the traditional one step PCR 588
protocol we used 4 µl of each forward and reverse primer (0.28 µM), 0.5 µl dNTPs (200 µM 589
each), 0.25 µl Phusion Hot Start II High-Fidelity DNA Polymerase (0.5 Us), 5 µl of HF buffer 590
(Thermo Fisher Scientific, Inc., Waltham, MA, USA) and 1 µl of undiluted DNA. PCRs were 591
conducted with the following cycling conditions (98°C-30s, 30×[98°C-9s, 55°C-60s, 72°C-90s], 592
72°C-10 min) and checked on a 1.5 % agarose gel. Using a modified version of the recently 593
published two step PCR protocol by Gohl et al. 2016, we employed for the first round of 594
amplification fusion primers consisting of the 16S rRNA gene primers (V1V2, V3V4) and a part 595
of the Illumina Nextera adapter with the following cycling conditions in a 25 µl PCR reaction 596
(98°C-30s, 25×[98°C-10s, 55°C-30s, 72°C-60s], 72°C-10 min) [8]. Following the PCR was 597
diluted 1:10 and 5µl of the solution were used in an additional reaction of 10 µl (98°C-30s, 598
10×[98°C-9s, 55°C-30s, 72°C-60s], 72°C-10 min) utilizing the Nextera adapter overhangs to 599
ligate the Illumina adapter sequence and individual MIDs to the amplicons following the 600
manufacturer’s instructions. The PCR protocol we used 1 µl of each forward and reverse primer 601
(5 µM), 0.3 µl dNTPs (10 µM), 0.2 µl Phusion Hot Start II High-Fidelity DNA Polymerase (2 U/µl), 602
2 µl of 5×HF buffer (Thermo Fisher Scientific, Inc., Waltham, MA, USA) and 5 µl of the diluted 603
PCR product. The concentration of the amplicons was estimated using a Gel Doc™ XR+ 604
System coupled with Image Lab™ Software (BioRad, Hercules, CA USA) with 3 µl of 605
O'GeneRulerTM 100 bp Plus DNA Ladder (Thermo Fisher Scientific, Inc., Waltham, MA, USA) 606
as the internal standard for band intensity measurement. The samples of individual gels were 607
pooled into approximately equimolar subpools as indicated by band intensity and measured with 608
the Qubit dsDNA br Assay Kit (Life Technologies GmbH, Darmstadt, Germany). Sub pools were 609
mixed in an equimolar fashion and stored at -20°C until sequencing. 610
.CC-BY-ND 4.0 International licenseis made available under aThe copyright holder for this preprint (which was not peer-reviewed) is the author/funder. It. https://doi.org/10.1101/604314doi: bioRxiv preprint

Library preparation for shotgun sequencing was performed using the NexteraXT kit 611
(Illumina) for fragmentation and multiplexing of input DNA following the manufacturer’s 612
instructions. Amplicon sequencing was performed on the Illumina MiSeq platform with v3 613
chemistry (2×300 cycle kit), while shotgun sequencing was performed via 2×150bp Mid Output 614
Kit at the IKMB Sequencing Center (CAU Kiel, Germany). 615
Amplicon analysis: The respective V1V2 and V3V4 PCR primer sequences were removed 616
from the sequencing data using cutadapt (v.1.8.3) [56]. Sequence data in FastQ format was 617
quality trimmed using sickle (v.1.33) in paired-end mode with default settings and removing 618
sequences dropping below 100bp after trimming [57]. Forward and reverse read were merged 619
into a single amplicon read using VSEARCH allowing fragments with a length of 280-350 bp for 620
V1V2 and 350-500 bp for V3V4 amplicons [58]. Sequence data was quality controlled using 621
fastq_quality_filter (FastX Toolkit) retaining sequences with no more than 5% of per-base quality 622
values below 30 and subsequently with VSEARCH discarding sequences with more than 1 623
expected errors [58, 59]. Reference guided chimera removal was performed using the gold.fa 624
reference in VSEARCH (v2.4.3). The UTAX algorithm was used for a fast classification of the 625
sequence data in order to remove sequences not assigned to the domains Bacteria or Archaea 626
and exclude amplicon fragments from Chloroplasts [60]. Notably, only a total of 15 sequences 627
were assigned to the domain Archaea, all found in two samples of human feces, accounting for 628
less than 0.1% of the clean reads in theses samples. The entire cleaned sequence data was 629
concatenated into a single file, dereplicated and processed with VSEARCH for OTU picking 630
using the UCLUST algorithm [61] using a 97% similarity threshold. OTUs were again checked 631
for chimeric sequences, now using the de novo implementation of the UCHIME algorithm in 632
VSEARCH [58, 61, 62]. All clean sequence data of the samples were mapped back to the 633
cleaned OTU sequences using VSEARCH. OTU sequences and clean sequences mapping to 634
the OTUs were taxonomically annotated using the RDP classifier algorithm with the RDP training 635
set 14 [63, 64]. Sequence data were normalized by selecting 10,000 random sequences per 636
sample. Taxon-by-sample abundance tables were created for all taxonomic levels from Phylum 637
to Genus, as well as for OTUs. 638
PICRUSt functional imputations: Species level OTUs (97% similarity threshold) were further 639
classified using the GreenGenes (August 2013) database [65] via RDP classifier as 640
implemented in mothur (v1.39.5) and merged with the abundances into a biome file which was 641
uploaded to the Galaxy PICRUSt v1.1.1 pipeline (http://galaxy.morganlangille.com/) to derive 642
functional imputations (COG predicitions) [5]. To achieve accurate functional predictions 643
.CC-BY-ND 4.0 International licenseis made available under aThe copyright holder for this preprint (which was not peer-reviewed) is the author/funder. It. https://doi.org/10.1101/604314doi: bioRxiv preprint

samples with NSTI ≤ 0.15 (weighted Nearest Sequenced Taxon Index) were pruned from the 644
data set, as recommended by the developers. 645
Shotgun sequencing: Raw demultiplexed sequences were trimmed via Trimmomatic (v0.36) 646
for low quality regions with a minimum length of 50 bp as well as for adaptor and remaining MID 647
sequences [66]. After trimming reads were mapped to host specific genome databases and ΦX 648
with additional retention databases containing all fully sequenced bacterial and metagenomic 649
genomes (05-09-2015) via DeconSeq (v0.4.3) [67]. Single and paired sequences were repaired 650
using the BBTools (v37.28) repair function [68]. Combined sequences were searched against 651
the non-redundant NCBI database (28-07-2017) via DIAMOND [69] with (evalue cutoff 0.001, 652
v0.8.28) and MEGAN [14] classifying hits by functions (EGGNOG-Oct2016) and taxa (May2017) 653
(v6.6.1). MetaPhlan [15] (v1.7.7) and MetaPhlan2 [16] (v2.2.0) was used for taxonomic 654
classification. Forward and reverse reads were mapped to the SIVLA non-redundant database 655
(v123) via SortmeRNA [17, 70] (2.1b) and classified via RDP classifier and the RPD 16 database 656
as implemented in mothur [71]. Kraken (v0.10.5-beta) database was constructed on complete 657
and dusted genome sequences of all archaea (+scaffolds), bacteria, fungi (+scaffolds), protozoa 658
(+scaffolds), viruses and full sequences of plasmids and plastids [13] (database 21-08-2017), 659
which was used to classify raw reads as well as assembled contigs, which were used throughout 660
the manuscript. For assemblies of single samples we used metaSPADES [72] (v3.9.1) using 661
paired reads in addition to unpaired reads left from the previous steps. PROKKA (v1.12) was 662
used for gene calling and initial genome annotation [73] using the metagenome option with 663
additional identifying rRNAs and snRNA via barnap, ARAGORN [74], and Infernal [75]. ORFs 664
were further annotated via EggNOG annotation via HMMER models implemented in the eggnog-665
mapper (v0.12.7) [20, 76], CAZY database via dbCAN (v5, 07/24/2016) and HMMER3 [21, 77]. 666
Gene abundances were derived from mapping the all reads back to the predicted ORF via 667
bowtie2 (v2.2.6) [78] and calculated TPM (transcripts per kilobase million) via SamTools (v1.5) 668
[79]. 669
18S rRNA genes were obtained from NCBI GeneBank and aligned via ClustalW (v1.4) 670
[80] for host tree construction, which includes A. aerophoba (gi:51095211, AY5917991), 671
M. leidyi (gi:14517703, AF2937001), H. vulgaris (gi:761889987, JN5940542), A. aurita 672
(gi:14700050, AY0392081), N. vectensis (gi:13897746, AF2543821), T. aestivum (gi:15982656, 673
AY0490401), M. musculus (gi:374088232, NR_0032783), H. sapiens (gi:36162, X032051), 674
D. melanogaster (gi:939630477, NR_1335591), and C.elegans (gi:30525807, AY2681171). 675
Phylogenetic distance was calculated via DNADIST (v3.5c) [81] and a maximum likelihood tree 676
was constructed via FastTree v2.1 CAT+Γ model [82]. Accuracy was improved via increased 677
.CC-BY-ND 4.0 International licenseis made available under aThe copyright holder for this preprint (which was not peer-reviewed) is the author/funder. It. https://doi.org/10.1101/604314doi: bioRxiv preprint

minimum evolution rounds for initial tree search [-spr 4], more exhaustive tree search [-mlacc 2], 678
and a slow initial tree search [-slownni]. 679
Statistical analysis: Statistical analyses were carried via R [83] (v3.4.3). Alpha diversity indices 680
(richness, Shannon-Weaver index) and beta diversity metrics based on the shared presence 681
(Jaccard distance)- or abundance (Bray-Curtis distance) of taxa were calculated in the vegan 682
package [84] and ordinated via Principal Coordinate Analysis (PCoA, avoiding negative 683
eigenvalues), or via non-metric multidimensional scaling (NMDS) using a maximum of 10000 684
random starts to obtain a minimally stressed configuration in three dimensions. Clusters were fit 685
via an iterative process (10’000 permutations) tested for separation by direct gradient analysis 686
via distance based Redundancy analyses and permutative ANOVA (10’000 permutations) [85, 687
86]. Univariate analyses were carried out with approximate Wilcoxon/Kruskal tests as 688
implemented in coin [87] (10’000 permutations). Procrustes tests were used to relate pairwise 689
community distances based on either different data sources such as functional repertoires or 690
taxonomic composition, as well as phylogenetic distances [25, 88]. Moran’s I eigenvector 691
technique was employed to correlate bacterial community members and their functions to 692
phylogenetic divergence, as implemented in ape (10’000 permutations) [26, 89] . Indicator 693
species analysis, employing the generalized indicator value (IndVal.g), was used to assess the 694
predictive value of a taxon for each respective host phenotype/category as implemented in 695
indicspecies [19]. Linear mixed models, as implemented in nlme were used to compare the 696
influence of amplification method or variable region without the influence of the organism of 697
origin [90]. We employed the Hommel- and Benjamini-Yekutieli adjustment of P-values when 698
advised [91, 92]. 699
700
.CC-BY-ND 4.0 International licenseis made available under aThe copyright holder for this preprint (which was not peer-reviewed) is the author/funder. It. https://doi.org/10.1101/604314doi: bioRxiv preprint

Declarations 701
Ethics approval and consent to participate (Human samples): Study participants were 702
randomly recruited from inhabitants of Schleswig-Holstein (Germany) which were recruited for 703
the PopGen cohort. Five individuals from the PopGen biobank (Schleswig-Holstein, Germany) 704
were randomly selected among the healthy and unmedicated individuals and included in the 705
study without corresponding meta-information. Study participants collected fecal samples at 706
home in standard fecal tubes and shipped them immediately at room temperature or brought 707
them to the collection center (within 24 h). Samples were stored at −80°C until processing. 708
Human feces (N=4) were sampled and extracted following the procedures as described in Wang 709
et al. 2016 [93]. A biopsy sample of the sigmoid colon was taken from a healthy control 710
individual without macro- or microscopical inflammation (N=1) and DNA was extracted as 711
described in Rausch et al. 2011 [94]. Investigators were blinded to sample identities and written, 712
informed consent was obtained from all study participants before the study. All protocols were 713
approved by the Ethics Committee of the Medical Faculty of Kiel and by the data protection 714
officer of the University Hospital Schleswig-Holstein in adherence with the Declaration of 715
Helsinki Principles. 716
Ethics approval for animal and plant samples: Wild derived, hybrid mice were sacrificed 717
according to the German animal welfare law and Federation of European Laboratory Animal 718
Science Associations guidelines. Hybrid breeding stocks of wild derived 719
M. m. musculus × M. m. domesticus hybrids captured in 2008 are kept at the Max Planck 720
Institute Plön (11th lab generation). The approval for mouse husbandry and experiment was 721
obtained from the local veterinary office “Veterinäramt Kreis Plön” (Permit: 1401-144/PLÖ-722
004697). All sampling, including invertebrate and plant samples, was performed in concordance 723
with the German animal welfare law and Federation of European Laboratory Animal Science 724
Associations guidelines. Further details for each host type are provided in the Supplementary 725
Material. 726
Consent for publication: Not applicable. 727
Availability of data and material: Sequence- and meta-data are accessible under the study 728
identifier PRJEB30924 (“https://www.ebi.ac.uk/ena”). Remaining DNA from non-human samples 729
can be made available upon request. All human samples and information on their corresponding 730
phenotypes have to be obtained from the PopGen Biobank Kiel (Schleswig-Holstein, Germany) 731
through a Material Data Access Form. Information about the Material Data Access Form and 732
how to apply can be found at: “https://www.uksh.de/p2n/Information+for+Researchers.html”. 733
.CC-BY-ND 4.0 International licenseis made available under aThe copyright holder for this preprint (which was not peer-reviewed) is the author/funder. It. https://doi.org/10.1101/604314doi: bioRxiv preprint

Competing Interests: The authors declare no competing interests. 734
Funding: This work was funded by the DFG Collaborative Research Centre (CRC) 1182 “Origin 735
and Function of Metaorganisms” subproject Z3 and the Max-Planck-Society. 736
Author contributions: PRa, PRo, AF, TB, and JFB conceived and designed research. PRa and 737
MR performed data analyses. PRa, MR, BH, SD, and JFB interpreted results and wrote the 738
manuscript. PRa, MR, TD, KD, HD, SD, SF, JF, UHH, FAH, BH, MH, MJ, CJ, KABK, DL, AR, 739
TBHR, TR, RAS, HS, RS, FS, ES, NWB, PRo, AF, TB, and JFB generated and interpreted host-740
specific data and gave intellectual input. All authors read and approved the final manuscript. 741
Acknowledgements: We thank Katja Cloppenborg-Schmidt, Melanie Vollstedt, and Dr. Sven 742
Künzel for excellent assistance and help during the development of the project and their 743
constant drive to improve its quality. 744
745
.CC-BY-ND 4.0 International licenseis made available under aThe copyright holder for this preprint (which was not peer-reviewed) is the author/funder. It. https://doi.org/10.1101/604314doi: bioRxiv preprint
Figure legends: 746
Figure 1: Average community composition of bacteria (A) and fungi (B) in the mock community 747
samples sequenced via metagenomic shotgun- and 16S rRNA gene amplicon techniques 748
(amplicon: V1V2, V3V4, one step, two step; shotgun: MEGAN based classification (short reads), 749
MetaPhlan (short reads), MetaPhlan2 (short reads), Kraken based classification (contigs), 750
SortmeRNA (short reads)). (C) Bacterial genus-level alpha diversity estimates in comparison to 751
the expected community value. (D) Principle coordinate analysis of the Bray-Curtis distance 752
between methods and the expected community. Ellipses represent standard deviations of points 753
within the respective groups. Sample sizes for the different approaches are Nshotgun=4, NV1V2-754
one step=3, NV1V2-two step=3, NV3V4-one step=3, and NV1V2-two step=3. 755
Figure 2: Comparison of bacterial genus richness (A) and Shannon H (B) based on 16S rRNA 756
gene amplicon and shotgun derived genus profiles based on MEGAN highlighting the 757
differences between variable regions, amplification methods, and metagenomic classifier, as 758
well as between the different host organisms. Colors show significance of amplification methods 759
(A, C) or pairwise comparisons of methods (B, D) based on pairwise t-tests with Hommel P-760
value adjustment (A, B), and approximate Wilcoxon test for the comparison between 761
environmental categories (C, D). Mean values are shown in grey symbols in plots A and B. 762
Sample sizes are indicated below the samples. 763
Figure 3: Non-metric Multidimensional Scaling of Bray-Curtis distances based on genus profiles 764
derived from the different 16S rRNA gene amplicon methods (V1V2/ V3V4, one step/ two step) 765
and shotgun derived genus profiles highlighting (A) host differences and (B) differences between 766
host environments (terrestrial/aquatic; see Table 2). Non-metric Multidimensional Scaling of 767
Jaccard distances based on genus profiles derived from the different 16S rRNA gene amplicon 768
methods and shotgun derived genus profiles highlighting (C) host taxon differences and (D) 769
differences between host environments (terrestrial/aquatic; see Table 2). Both panels show a 770
separation based on host organisms and environments and not by method. Large symbols 771
indicate the centroid of the respective host groups and vertical lines help to determine their 772
position in space. Samples sizes are equal to Figure 2 (see also Table S1). 773
Figure 4: Multivariate correlation (Procrustes analyses) of phylogenetic distance among host 774
organisms and community distances based on 16S rRNA gene amplicon- or shotgun derived 775
community profiles at different taxonomic cutoffs, from Phylum to Genus and species level OTUs 776
in the amplicon based profiles. Similar results are shown for the correspondence between 777
functional composition based distances derived from imputed COGs and COG categories 778
.CC-BY-ND 4.0 International licenseis made available under aThe copyright holder for this preprint (which was not peer-reviewed) is the author/funder. It. https://doi.org/10.1101/604314doi: bioRxiv preprint

imputed from PICRUSt, and EggNOG derived genes and COG categories, as well as CAZY. All 779
correlations are significant at P ≤ 0.05 (10’000 permutations). Large symbols indicate the 780
centroid of the respective host groups and vertical lines help to determine their position in space. 781
Figure 5: (A) Differences in Nearest Sequenced Taxon Index (imputation success) between 782
variable regions (average: Z=0.3869, P=0.7017, approximate Wilcoxon test; probability: odds 783
ratio=1.5941, P=0.1402, Fisher test) and amplification method (Z=0.0667, P=0.9472, 784
approximate Wilcoxon test; probability: odds ratio=1.5511, P=0.1436, Fisher test). (B) 785
Procrustes correlation of imputed and shotgun based COG categories among different 786
techniques, with significantly higher correspondence between imputed and measured functional 787
profiles in the V1V2 compared to the V3V4 region (F1,18=7.8537, P=0.0118, ANOVA). (C) Non-788
metric Multidimensional Scaling displays Bray-Curtis distances based on functional category 789
abundances (COG categories) derived from PICRUSt (V1V2/ V3V4, one step/ two step) and 790
shotgun based approaches (MEGAN, single assembly). Ellipses represent standard deviations 791
of points within the respective groups. 792
Figure 6: Functional diversities were derived from the number and abundances of MEGAN 793
based EggNOG annotations. Functional richness between (A) host organisms and (B) host 794
environmental groups based is displayed, as well as functional differences between hosts (C) 795
and environmental groups (D). Non-metric Multidimensional Scaling is based on Bray-Curtis 796
distances on the differences in functional composition between the host organisms is displayed 797
(C, D; see Table 3). Large symbols indicate the centroid of the respective groups. Functional 798
variation of communities based on pairwise Bray-Curtis distances within host organism groups 799
and environmental groups. Samples sizes for the host taxa is N=5, except for D. melanogaster 800
gut tissue (N=10; see Table S1). 801
.CC-BY-ND 4.0 International licenseis made available under aThe copyright holder for this preprint (which was not peer-reviewed) is the author/funder. It. https://doi.org/10.1101/604314doi: bioRxiv preprint
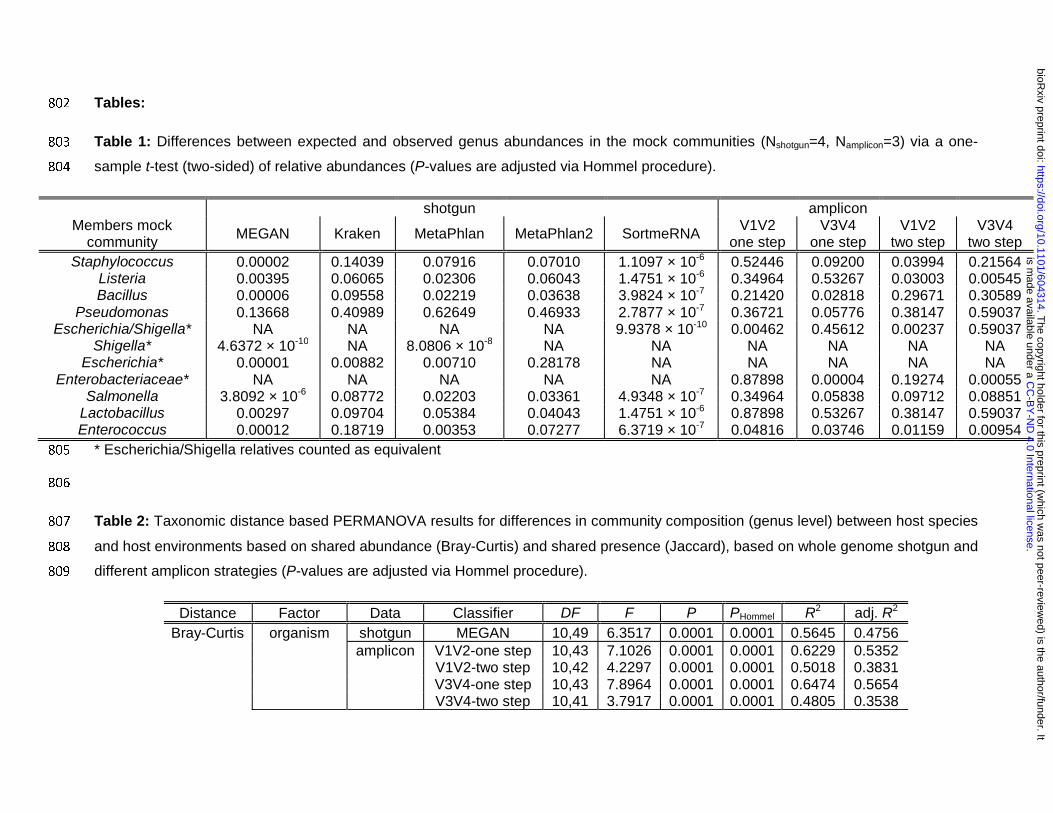
Tables: 802
Table 1: Differences between expected and observed genus abundances in the mock communities (Nshotgun=4, Namplicon=3) via a one-803
sample t-test (two-sided) of relative abundances (P-values are adjusted via Hommel procedure). 804
shotgun amplicon Members mock
community MEGAN Kraken MetaPhlan MetaPhlan2 SortmeRNA V1V2 one step
V3V4 one step
V1V2 two step
V3V4 two step
Staphylococcus 0.00002 0.14039 0.07916 0.07010 1.1097 × 10⁻⁶ 0.52446 0.09200 0.03994 0.21564 Listeria 0.00395 0.06065 0.02306 0.06043 1.4751 × 10⁻⁶ 0.34964 0.53267 0.03003 0.00545 Bacillus 0.00006 0.09558 0.02219 0.03638 3.9824 × 10⁻⁷ 0.21420 0.02818 0.29671 0.30589
Pseudomonas 0.13668 0.40989 0.62649 0.46933 2.7877 × 10⁻⁷ 0.36721 0.05776 0.38147 0.59037 Escherichia/Shigella* NA NA NA NA 9.9378 × 10⁻¹⁰ 0.00462 0.45612 0.00237 0.59037
Shigella* 4.6372 × 10⁻¹⁰ NA 8.0806 × 10⁻⁸ NA NA NA NA NA NA Escherichia* 0.00001 0.00882 0.00710 0.28178 NA NA NA NA NA
Enterobacteriaceae* NA NA NA NA NA 0.87898 0.00004 0.19274 0.00055 Salmonella 3.8092 × 10⁻⁶ 0.08772 0.02203 0.03361 4.9348 × 10⁻⁷ 0.34964 0.05838 0.09712 0.08851
Lactobacillus 0.00297 0.09704 0.05384 0.04043 1.4751 × 10⁻⁶ 0.87898 0.53267 0.38147 0.59037 Enterococcus 0.00012 0.18719 0.00353 0.07277 6.3719 × 10⁻⁷ 0.04816 0.03746 0.01159 0.00954
* Escherichia/Shigella relatives counted as equivalent 805
806
Table 2: Taxonomic distance based PERMANOVA results for differences in community composition (genus level) between host species 807
and host environments based on shared abundance (Bray-Curtis) and shared presence (Jaccard), based on whole genome shotgun and 808
different amplicon strategies (P-values are adjusted via Hommel procedure). 809
Distance Factor Data Classifier DF F P PHommel R2 adj. R2 Bray-Curtis organism shotgun MEGAN 10,49 6.3517 0.0001 0.0001 0.5645 0.4756
amplicon V1V2-one step 10,43 7.1026 0.0001 0.0001 0.6229 0.5352
V1V2-two step 10,42 4.2297 0.0001 0.0001 0.5018 0.3831
V3V4-one step 10,43 7.8964 0.0001 0.0001 0.6474 0.5654
V3V4-two step 10,41 3.7917 0.0001 0.0001 0.4805 0.3538
.C
C-B
Y-N
D 4.0 International license
is made available under a
The copyright holder for this preprint (w
hich was not peer-review
ed) is the author/funder. It.
https://doi.org/10.1101/604314doi:
bioRxiv preprint

environment shotgun MEGAN 1,58 5.8958 0.0001 0.0004 0.0923 0.0766
amplicon V1V2-one step 1,52 6.1588 0.0001 0.0001 0.1059 0.0887
V1V2-two step 1,51 4.6185 0.0001 0.0001 0.0830 0.0651
V3V4-one step 1,52 5.4975 0.0001 0.0001 0.0956 0.0782
V3V4-two step 1,50 3.3349 0.0001 0.0001 0.0625 0.0438 Jaccard organism shotgun MEGAN 10,49 4.7458 0.0001 0.0001 0.4920 0.3883
amplicon V1V2-one step 10,43 3.6867 0.0001 0.0001 0.4616 0.3364
V1V2-two step 10,42 2.9760 0.0001 0.0001 0.4147 0.2754
V3V4-one step 10,43 4.0248 0.0001 0.0001 0.4835 0.3633
V3V4-two step 10,41 2.9343 0.0001 0.0001 0.4171 0.2750
environment shotgun MEGAN 1,58 4.3872 0.0001 0.0004 0.0703 0.0543
amplicon V1V2-one step 1,52 3.8714 0.0001 0.0001 0.0693 0.0514
V1V2-two step 1,51 3.6541 0.0001 0.0001 0.0669 0.0486
V3V4-one step 1,52 4.3213 0.0001 0.0001 0.0767 0.0590
V3V4-two step 1,50 3.6646 0.0001 0.0001 0.0683 0.0497
810
Table 3: Functional distance based PERMANOVA results for differences in general functional community composition (EggNOG) and 811
carbohydrate active enzymes (CAZY) between host species and host environments based on shared abundance (Bray-Curtis) and 812
shared presence (Jaccard) of functions (P-values are adjusted via Hommel procedure). 813
Distance Factor Data DF F P PHommel R2 adj. R2 Bray-Curtis organism CAZY 10,47 7.3323 0.0001 0.0001 0.6094 0.5263
EggNOG categories 10,49 5.6088 0.0001 0.0001 0.5337 0.4386 EggNOG gene+description 10,49 4.4454 0.0001 0.0001 0.4757 0.3687 EggNOG (MEGAN categories) 10,49 12.2594 0.0001 0.0001 0.7144 0.6562 EggNOG (MEGAN gene) 10,49 8.2788 0.0001 0.0001 0.6282 0.5523 environment CAZY 1,56 5.4257 0.0001 0.0007 0.0883 0.0721 EggNOG categories 1,58 2.5429 0.0195 0.0195 0.0420 0.0255 EggNOG gene+description 1,58 3.0662 0.0001 0.0007 0.0502 0.0338 EggNOG (MEGAN categories) 1,58 3.7703 0.0015 0.0030 0.0610 0.0448 EggNOG (MEGAN gene) 1,58 3.7271 0.0002 0.0012 0.0604 0.0442
Jaccard organism CAZY 10,47 3.9098 0.0001 0.0001 0.4541 0.3380 EggNOG categories 10,49 3.7179 0.0001 0.0001 0.4314 0.3154
.C
C-B
Y-N
D 4.0 International license
is made available under a
The copyright holder for this preprint (w
hich was not peer-review
ed) is the author/funder. It.
https://doi.org/10.1101/604314doi:
bioRxiv preprint

EggNOG gene+description 10,49 2.5275 0.0001 0.0001 0.3403 0.2057 EggNOG (MEGAN categories) 10,49 7.7781 0.0001 0.0001 0.6135 0.5346 EggNOG (MEGAN gene) 10,49 5.4989 0.0001 0.0001 0.5288 0.4326 environment CAZY 1,56 2.5866 0.0003 0.0021 0.0442 0.0271 EggNOG categories 1,58 1.4180 0.1442 0.1442 0.0239 0.0070 EggNOG gene+description 1,58 1.9535 0.0004 0.0024 0.0326 0.0159 EggNOG (MEGAN categories) 1,58 3.0425 0.0460 0.0920 0.0498 0.0335 EggNOG (MEGAN gene) 1,58 3.1222 0.0001 0.0009 0.0511 0.0347
814
815
.C
C-B
Y-N
D 4.0 International license
is made available under a
The copyright holder for this preprint (w
hich was not peer-review
ed) is the author/funder. It.
https://doi.org/10.1101/604314doi:
bioRxiv preprint

References: 816
1. Bosch TCG, McFall-Ngai MJ: Metaorganisms as the new frontier. Zoology 2011, 817
114(4):185-190. 818
2. McFall-Ngai M, Hadfield MG, Bosch TCG, Carey HV, Domazet-Lošo T, Douglas AE, 819
Dubilier N, Eberl G, Fukami T, Gilbert SF et al: Animals in a bacterial world, a new 820
imperative for the life sciences. Proceedings of the National Academy of Sciences 821
2013, 110(9):3229-3236. 822
3. Carding S, Verbeke K, Vipond DT, Corfe BM, Owen LJ: Dysbiosis of the gut 823
microbiota in disease. Microbial Ecology in Health and Disease 2015, 26(1):26191. 824
4. Morgan XC, Huttenhower C: Chapter 12: Human Microbiome Analysis. PLoS Comput 825
Biol 2012, 8(12):e1002808. 826
5. Langille MGI, Zaneveld J, Caporaso JG, McDonald D, Knights D, Reyes JA, Clemente 827
JC, Burkepile DE, Vega Thurber RL, Knight R et al: Predictive functional profiling of 828
microbial communities using 16S rRNA marker gene sequences. Nat Biotech 2013, 829
31(9):814-821. 830
6. Hiergeist A, Glasner J, Reischl U, Gessner A: Analyses of Intestinal Microbiota: 831
Culture versus Sequencing. ILAR journal / National Research Council, Institute of 832
Laboratory Animal Resources 2015, 56(2):228-240. 833
7. Tremblay J, Singh K, Fern A, Kirton ES, He S, Woyke T, Lee J, Chen F, Dangl JL, Tringe 834
SG: Primer and platform effects on 16S rRNA tag sequencing. Frontiers in 835
Microbiology 2015, 6:771. 836
8. Gohl DM, Vangay P, Garbe J, MacLean A, Hauge A, Becker A, Gould TJ, Clayton JB, 837
Johnson TJ, Hunter R et al: Systematic improvement of amplicon marker gene 838
methods for increased accuracy in microbiome studies. Nat Biotech 2016, 839
34(9):942-949. 840
9. Walsh AM, Crispie F, O’Sullivan O, Finnegan L, Claesson MJ, Cotter PD: Species 841
classifier choice is a key consideration when analysing low-complexity food 842
microbiome data. Microbiome 2018, 6(1):50. 843
10. Faith JJ, Guruge JL, Charbonneau M, Subramanian S, Seedorf H, Goodman AL, 844
Clemente JC, Knight R, Heath AC, Leibel RL et al: The Long-Term Stability of the 845
Human Gut Microbiota. Science 2013, 341(6141):1237439. 846
11. Jovel J, Patterson J, Wang W, Hotte N, O'Keefe S, Mitchel T, Perry T, Kao D, Mason AL, 847
Madsen KL et al: Characterization of the Gut Microbiome Using 16S or Shotgun 848
Metagenomics. Frontiers in Microbiology 2016, 7(459):459. 849
12. Rinke C, Schwientek P, Sczyrba A, Ivanova NN, Anderson IJ, Cheng J-F, Darling A, 850
Malfatti S, Swan BK, Gies EA et al: Insights into the phylogeny and coding potential 851
of microbial dark matter. Nature 2013, 499(7459):431-437. 852
13. Wood D, Salzberg S: Kraken: ultrafast metagenomic sequence classification using 853
exact alignments. Genome Biology 2014, 15(3):R46. 854
14. Huson D, Auch A, Qi J, Schuster S: MEGAN analysis of metagenomic data. Genome 855
Res 2007, 17(3):377 - 386. 856
15. Segata N, Waldron L, Ballarini A, Narasimhan V, Jousson O, Huttenhower C: 857
Metagenomic microbial community profiling using unique clade-specific marker 858
genes. Nat Meth 2012, 9(8):811-814. 859
16. Truong DT, Franzosa EA, Tickle TL, Scholz M, Weingart G, Pasolli E, Tett A, 860
Huttenhower C, Segata N: MetaPhlAn2 for enhanced metagenomic taxonomic 861
profiling. Nat Meth 2015, 12(10):902-903. 862
17. Kopylova E, Noe L, Touzet H: SortMeRNA: fast and accurate filtering of ribosomal 863
RNAs in metatranscriptomic data. Bioinformatics 2012, 28(24):3211-3217. 864
.CC-BY-ND 4.0 International licenseis made available under aThe copyright holder for this preprint (which was not peer-reviewed) is the author/funder. It. https://doi.org/10.1101/604314doi: bioRxiv preprint

18. Hong Nhung P, Ohkusu K, Mishima N, Noda M, Monir Shah M, Sun X, Hayashi M, Ezaki 865
T: Phylogeny and species identification of the family Enterobacteriaceae based on 866
dnaJ sequences. Diagnostic Microbiology and Infectious Disease 2007, 58(2):153-161. 867
19. De Cáceres M, Legendre P, Moretti M: Improving indicator species analysis by 868
combining groups of sites. Oikos 2010, 119(10):1674-1684. 869
20. Huerta-Cepas J, Szklarczyk D, Forslund K, Cook H, Heller D, Walter MC, Rattei T, 870
Mende DR, Sunagawa S, Kuhn M et al: eggNOG 4.5: a hierarchical orthology 871
framework with improved functional annotations for eukaryotic, prokaryotic and 872
viral sequences. Nucleic Acids Research 2016, 44(1):286-293. 873
21. Cantarel BL: The Carbohydrate-Active EnZymes database (CAZy): an expert 874
resource for glycogenomics. Nucleic Acids Res 2009, 37(Database issue):233-238. 875
22. Tatusov RL, Natale DA, Garkavtsev IV, Tatusova TA, Shankavaram UT, Rao BS, 876
Kiryutin B, Galperin MY, Fedorova ND, Koonin EV: The COG database: new 877
developments in phylogenetic classification of proteins from complete genomes. 878
Nucleic Acids Res 2001, 29(1):22-28. 879
23. Brooks AW, Kohl KD, Brucker RM, van Opstal EJ, Bordenstein SR: Phylosymbiosis: 880
Relationships and Functional Effects of Microbial Communities across Host 881
Evolutionary History. PLOS Biology 2016, 14(11):e2000225. 882
24. Groussin M, Mazel F, Sanders JG, Smillie CS, Lavergne S, Thuiller W, Alm EJ: 883
Unraveling the processes shaping mammalian gut microbiomes over evolutionary 884
time. Nature Communications 2017, 8:14319. 885
25. Peres-Neto P, Jackson D: How well do multivariate data sets match? The 886
advantages of a Procrustean superimposition approach over the Mantel test. 887
Oecologia 2001, 129(2):169-178. 888
26. Gittleman JL, Kot M: Adaptation: Statistics and a Null Model for Estimating 889
Phylogenetic Effects. Systematic Zoology 1990, 39(3):227-241. 890
27. Murray AE, Rack FR, Zook R, Williams MJM, Higham ML, Broe M, Kaufmann RS, Daly 891
M: Microbiome Composition and Diversity of the Ice-Dwelling Sea Anemone, 892
Edwardsiella andrillae. Integrative and Comparative Biology 2016, 56(4):542-555. 893
28. Schneiker S, dos Santos VAPM, Bartels D, Bekel T, Brecht M, Buhrmester J, Chernikova 894
TN, Denaro R, Ferrer M, Gertler C et al: Genome sequence of the ubiquitous 895
hydrocarbon-degrading marine bacterium Alcanivorax borkumensis. Nature 896
Biotechnology 2006, 24(8):997. 897
29. Hentschel U, Piel J, Degnan SM, Taylor MW: Genomic insights into the marine 898
sponge microbiome. Nat Rev Micro 2012, 10(9):641-654. 899
30. Wu JY, Jiang XT, Jiang YX, Lu SY, Zou F, Zhou HW: Effects of polymerase, template 900
dilution and cycle number on PCR based 16 S rRNA diversity analysis using the 901
deep sequencing method. BMC Microbiol 2010, 10:255. 902
31. D’Amore R, Ijaz UZ, Schirmer M, Kenny JG, Gregory R, Darby AC, Shakya M, Podar M, 903
Quince C, Hall N: A comprehensive benchmarking study of protocols and 904
sequencing platforms for 16S rRNA community profiling. BMC Genomics 2016, 905
17(1):55. 906
32. Fadrosh D, Ma B, Gajer P, Sengamalay N, Ott S, Brotman R, Ravel J: An improved 907
dual-indexing approach for multiplexed 16S rRNA gene sequencing on the Illumina 908
MiSeq platform. Microbiome 2014, 2(1):6. 909
33. Highlander S: Mock Community Analysis. In: Encyclopedia of Metagenomics. Edited 910
by Nelson EK. New York, NY: Springer New York; 2013: 1-7. 911
34. Westcott SL, Schloss PD: De novo clustering methods outperform reference-based 912
methods for assigning 16S rRNA gene sequences to operational taxonomic units. 913
PeerJ 2015, 3:e1487. 914
.CC-BY-ND 4.0 International licenseis made available under aThe copyright holder for this preprint (which was not peer-reviewed) is the author/funder. It. https://doi.org/10.1101/604314doi: bioRxiv preprint

35. Werner JJ, Koren O, Hugenholtz P, DeSantis TZ, Walters WA, Caporaso JG, Angenent 915
LT, Knight R, Ley RE: Impact of training sets on classification of high-throughput 916
bacterial 16s rRNA gene surveys. ISME J 2012, 6(1):94-103. 917
36. Sczyrba A, Hofmann P, Belmann P, Koslicki D, Janssen S, Dröge J, Gregor I, Majda S, 918
Fiedler J, Dahms E et al: Critical Assessment of Metagenome Interpretation—a 919
benchmark of metagenomics software. Nature Methods 2017, 14(11):1063–1071. 920
37. Lindgreen S, Adair KL, Gardner PP: An evaluation of the accuracy and speed of 921
metagenome analysis tools. Sci Rep 2016, 6:19233. 922
38. Xu Z, Malmer D, Langille MGI, Way SF, Knight R: Which is more important for 923
classifying microbial communities: who's there or what they can do? ISME J 2014, 924
8(12):2357-2359. 925
39. Ochman H, Elwyn S, Moran NA: Calibrating bacterial evolution. Proceedings of the 926
National Academy of Sciences of the United States of America 1999, 96(22):12638-927
12643. 928
40. Benton MJ: The origins of modern biodiversity on land. Philosophical Transactions of 929
the Royal Society B: Biological Sciences 2010, 365(1558):3667-3679. 930
41. Rota-Stabelli O, Daley Allison C, Pisani D: Molecular Timetrees Reveal a Cambrian 931
Colonization of Land and a New Scenario for Ecdysozoan Evolution. Current 932
Biology 2013, 23(5):392-398. 933
42. Kuo CH, Ochman H: Inferring clocks when lacking rocks: the variable rates of 934
molecular evolution in bacteria. Biol Direct 2009, 4:35. 935
43. Lebreton F, Manson AL, Saavedra JT, Straub TJ, Earl AM, Gilmore MS: Tracing the 936
Enterococci from Paleozoic Origins to the Hospital. Cell 2017, 169(5):849-861.e813. 937
44. Bishop JR, Gagneux P: Evolution of carbohydrate antigens—microbial forces 938
shaping host glycomes? Glycobiology 2007, 17(5):23R-34R. 939
45. Pickard JM, Maurice CF, Kinnebrew MA, Abt MC, Schenten D, Golovkina TV, Bogatyrev 940
SR, Ismagilov RF, Pamer EG, Turnbaugh PJ et al: Rapid fucosylation of intestinal 941
epithelium sustains host-commensal symbiosis in sickness. Nature 2014, 942
514(7524):638-641. 943
46. Schwartzman JA, Koch E, Heath-Heckman EAC, Zhou L, Kremer N, McFall-Ngai MJ, 944
Ruby EG: The chemistry of negotiation: Rhythmic, glycan-driven acidification in a 945
symbiotic conversation. Proceedings of the National Academy of Sciences 2015, 946
112(2):566-571. 947
47. Martens EC, Chiang HC, Gordon JI: Mucosal Glycan Foraging Enhances Fitness and 948
Transmission of a Saccharolytic Human Gut Bacterial Symbiont. Cell Host & 949
Microbe 2008, 4(5):447-457. 950
48. Boulnois GJ, Roberts IS: Genetics of capsular polysaccharide production in 951
bacteria. Current Topics in Microbiology and Immunology 1990, 150:1-18. 952
49. Meng D, Newburg DS, Young C, Baker A, Tonkonogy SL, Sartor RB, Walker WA, 953
Nanthakumar NN: Bacterial symbionts induce a FUT2-dependent fucosylated niche 954
on colonic epithelium via ERK and JNK signaling. American Journal of Physiology - 955
Gastrointestinal and Liver Physiology 2007, 293(4):780-787. 956
50. Mahdavi J, Pirinccioglu N, Oldfield NJ, Carlsohn E, Stoof J, Aslam A, Self T, Cawthraw 957
SA, Petrovska L, Colborne N et al: A novel O-linked glycan modulates 958
Campylobacter jejuni major outer membrane protein-mediated adhesion to human 959
histo-blood group antigens and chicken colonization. Open Biology 2014, 960
4(1):130202. 961
51. Severi E, Hood D, Thomas G: Sialic acid utilization by bacterial pathogens. 962
Microbiology 2007, 153(Pt 9):2817 - 2822. 963
52. Coyne MJ, Chatzidaki-Livanis M, Paoletti LC, Comstock LE: Role of glycan synthesis 964
in colonization of the mammalian gut by the bacterial symbiont Bacteroides 965
fragilis. Proceedings of the National Academy of Sciences 2008, 105(35):13099-13104. 966
.CC-BY-ND 4.0 International licenseis made available under aThe copyright holder for this preprint (which was not peer-reviewed) is the author/funder. It. https://doi.org/10.1101/604314doi: bioRxiv preprint

53. Mazmanian SK, Round JL, Kasper DL: A microbial symbiosis factor prevents 967
intestinal inflammatory disease. Nature 2008, 453(7195):620-625. 968
54. Tounkang S, Premkumar D, Gustavo S, Nathalie B, Yann B, Patricia C, Florence L, 969
Olivier N, Brigitte G, Anne L et al: Capsular glucan and intracellular glycogen of 970
Mycobacterium tuberculosis: biosynthesis and impact on the persistence in mice. 971
Molecular Microbiology 2008, 70(3):762-774. 972
55. Roberts IS: The biochemistry and genetics of capsular polysaccharide production 973
in bacteria. Annu Rev Microbiol 1996, 50(1):285-315. 974
56. Martin M: Cutadapt removes adapter sequences from high-throughput sequencing 975
reads. 2011 2011, 17(1). 976
57. Joshi N, Fass J: Sickle: A sliding-window, adaptive, quality-based trimming tool for 977
FastQ files. In., 1.33 edn. https://github.com/najoshi/sickle; 2011. 978
58. Rognes T, Flouri T, Nichols B, Quince C, Mahé F: VSEARCH: a versatile open source 979
tool for metagenomics. PeerJ 2016, 4:e2584. 980
59. Gordon A, Hannon G: Fastx-toolkit. FASTQ/A short-reads pre-processing tools. In: 981
Unpublished Available online at: http://hannonlab cshl edu/fastx_toolkit. 2010. 982
60. Edgar RC: UTAX algorithm. In.; 2015. 983
61. Edgar RC: Search and clustering orders of magnitude faster than BLAST. 984
Bioinformatics 2010, 26(19):2460-2461. 985
62. Edgar RC, Haas BJ, Clemente JC, Quince C, Knight R: UCHIME improves sensitivity 986
and speed of chimera detection. Bioinformatics 2011, 27(16):2194-2200. 987
63. Wang Q, Garrity GM, Tiedje JM, Cole JR: Naive Bayesian Classifier for Rapid 988
Assignment of rRNA Sequences into the New Bacterial Taxonomy. Applied and 989
environmental microbiology 2007, 73(16):5261-5267. 990
64. Cole JR, Chai B, Marsh TL, Farris RJ, Wang Q, Kulam SA, Chandra S, McGarrell DM, 991
Schmidt TM, Garrity GM et al: The Ribosomal Database Project (RDP-II): previewing 992
a new autoaligner that allows regular updates and the new prokaryotic taxonomy. 993
Nucl Acids Res 2003, 31(1):442-443. 994
65. McDonald D, Price MN, Goodrich J, Nawrocki EP, DeSantis TZ, Probst A, Andersen GL, 995
Knight R, Hugenholtz P: An improved Greengenes taxonomy with explicit ranks for 996
ecological and evolutionary analyses of bacteria and archaea. ISME J 2012, 997
6(3):610-618. 998
66. Bolger AM, Lohse M, Usadel B: Trimmomatic: a flexible trimmer for Illumina 999
sequence data. Bioinformatics 2014, 30(15):2114-2120. 1000
67. Schmieder R, Edwards R: Fast Identification and Removal of Sequence 1001
Contamination from Genomic and Metagenomic Datasets. PLoS One 2011, 1002
6(3):e17288. 1003
68. Bushnell B, Rood J: BBTools bioinformatics tools, including BBMap. In: URL 1004
http://sourceforge net/projects/bbmap. 37.28 edn; 2017. 1005
69. Buchfink B, Xie C, Huson DH: Fast and sensitive protein alignment using DIAMOND. 1006
Nat Meth 2015, 12(1):59-60. 1007
70. Pruesse E, Quast C, Knittel K, Fuchs BM, Ludwig W, Peplies J, Glockner FO: SILVA: a 1008
comprehensive online resource for quality checked and aligned ribosomal RNA 1009
sequence data compatible with ARB. Nucl Acids Res 2007, 35(21):7188-7196. 1010
71. Schloss PD, Westcott SL, Ryabin T, Hall JR, Hartmann M, Hollister EB, Lesniewski RA, 1011
Oakley BB, Parks DH, Robinson CJ et al: Introducing mothur: Open Source, 1012
Platform-independent, Community-supported Software for Describing and 1013
Comparing Microbial Communities. Applied and environmental microbiology 2009, 1014
75(23):7537-7541. 1015
72. Nurk S, Meleshko D, Korobeynikov A, Pevzner P: metaSPAdes: a new versatile de 1016
novo metagenomics assembler. arXiv preprint arXiv:160403071 2016. 1017
.CC-BY-ND 4.0 International licenseis made available under aThe copyright holder for this preprint (which was not peer-reviewed) is the author/funder. It. https://doi.org/10.1101/604314doi: bioRxiv preprint

73. Seemann T: Prokka: rapid prokaryotic genome annotation. Bioinformatics 2014, 1018
30(14):2068-2069. 1019
74. Laslett D, Canback B: ARAGORN, a program to detect tRNA genes and tmRNA 1020
genes in nucleotide sequences. Nucleic Acids Research 2004, 32(1):11-16. 1021
75. Kolbe DL, Eddy SR: Fast filtering for RNA homology search. Bioinformatics 2011, 1022
27(22):3102-3109. 1023
76. Huerta-Cepas J, Forslund K, Coelho LP, Szklarczyk D, Jensen LJ, von Mering C, Bork P: 1024
Fast Genome-Wide Functional Annotation through Orthology Assignment by 1025
eggNOG-Mapper. Molecular Biology and Evolution 2017, 34(8):2115-2122. 1026
77. Yin Y, Mao X, Yang J, Chen X, Mao F, Xu Y: dbCAN: a web resource for automated 1027
carbohydrate-active enzyme annotation. Nucleic Acids Research 2012, 40(1):445-1028
451. 1029
78. Langmead B, Salzberg SL: Fast gapped-read alignment with Bowtie 2. Nature 1030
methods 2012, 9(4):357-359. 1031
79. Li H, Handsaker B, Wysoker A, Fennell T, Ruan J, Homer N, Marth G, Abecasis G, 1032
Durbin R, Genome Project Data Processing S: The Sequence Alignment/Map format 1033
and SAMtools. Bioinformatics 2009, 25(16):2078-2079. 1034
80. Thompson JD, Higgins DG, Gibson TJ: CLUSTAL W: improving the sensitivity of 1035
progressive multiple sequence alignment through sequence weighting, position-1036
specific gap penalties and weight matrix choice. Nucleic Acids Research 1994, 1037
22(22):4673-4680. 1038
81. Felsenstein J: DNADIST -- Program to compute distance matrix from nucleotide 1039
sequences. In., 3.5c edn; 1993. 1040
82. Price MN, Dehal PS, Arkin AP: FastTree 2 – Approximately Maximum-Likelihood 1041
Trees for Large Alignments. PLoS One 2010, 5(3):e9490. 1042
83. Team RC: R: A language and environment for statistical computing. In: R 1043
Foundation for Statistical Computing. 3.3.2 edn; 2016. 1044
84. Oksanen J, Blanchet FG, Kindt R, Legendre P, O'Hara RB, Simpson GL, Solymos P, 1045
Stevens MHH, Wagner H: vegan: Community Ecology Package. In., 1.17-6 edn: 1046
http://CRAN.R-project.org; 2011. 1047
85. Legendre P, Anderson MJ: Distance-based redundancy analysis: Testing 1048
multispecies responses in multifactorial ecological experiments. Ecological 1049
Monographs 1999, 69(1):1-24. 1050
86. Anderson MJ: A new method for non-parametric multivariate analysis of variance. 1051
Austral Ecology 2001, 26(1):32-46. 1052
87. Hothorn T, Hornik K, Van de Wiel MA, Zeileis A: A Lego system for conditional 1053
inference. American Statistician 2006, 60(3):257-263. 1054
88. Kembel SW, Cowan PD, Helmus MR, Cornwell WK, Morlon H, Ackerly DD, Blomberg 1055
SP, Webb CO: Picante: R tools for integrating phylogenies and ecology. 1056
Bioinformatics 2010, 26(11):1463-1464. 1057
89. Paradis E, Claude J, Strimmer K: APE: analyses of phylogenetics and evolution in R 1058
language. Bioinformatics 2004, 20(2):289-290. 1059
90. Pinheiro J, Bates D, DebRoy S, Sarkar D, Team RDC: nlme: Linear and Nonlinear 1060
Mixed Effects Models. In.: http://CRAN.R-project.org; 2011. 1061
91. Hommel G: A stagewise rejective multiple test procedure based on a modified 1062
Bonferroni test. Biometrika 1988, 75(2):383-386. 1063
92. Benjamini Y, Yekutieli D: The control of the false discovery rate in multiple testing 1064
under dependency. Annals of Statistics 2001, 29(4):1165-1188. 1065
93. Wang J, Thingholm LB, Skieceviciene J, Rausch P, Kummen M, Hov JR, Degenhardt F, 1066
Heinsen F-A, Ruhlemann MC, Szymczak S et al: Genome-wide association analysis 1067
identifies variation in vitamin D receptor and other host factors influencing the gut 1068
microbiota. Nat Genet 2016, 48(11):1396-1406. 1069
.CC-BY-ND 4.0 International licenseis made available under aThe copyright holder for this preprint (which was not peer-reviewed) is the author/funder. It. https://doi.org/10.1101/604314doi: bioRxiv preprint

94. Rausch P, Rehman A, Künzel S, Häsler R, Ott SJ, Schreiber S, Rosenstiel P, Franke A, 1070
Baines JF: Colonic mucosa-associated microbiota is influenced by an interaction 1071
of Crohn disease and FUT2 (Secretor) genotype. Proceedings of the National 1072
Academy of Sciences 2011, 108(47):19030-19035. 1073
1074
.CC-BY-ND 4.0 International licenseis made available under aThe copyright holder for this preprint (which was not peer-reviewed) is the author/funder. It. https://doi.org/10.1101/604314doi: bioRxiv preprint

0.0 0.5 1.0 1.5
−1.0
−0.5
0.0
0.5
1.0
PCo1 ( 40.17 %)
PCo2
( 16
.68
%)
MEGANKrakenMetaPhlanMetaphlan2SortmeRNAV1V2−one stepV3V4−one stepV1V2−two stepV3V4−two stepexpected
Community diversity
0
20
40
60
80
100
Ric
hnes
s (G
enus
)
Kra
ken−
Con
tigs
MEG
AN
Met
aPhl
an
Met
aPhl
an2
Sort
meR
NA
V1V2
−one
ste
p
V1V2
−tw
o st
ep
V3V4
−one
ste
p
V3V4
−tw
o st
epKraken−ContigsMEGANMetaPhlanMetaPhlan2SortmeRNAV1V2−one stepV1V2−two stepV3V4−one stepV3V4−two step
Aver
age
rela
tive
abun
danc
e
0.0
0.2
0.4
0.6
0.8
1.0
MEG
AN
Krak
en−c
ontig
s
Met
aPhl
an
Met
aPhl
an2
Sortm
eRN
A−R
DP
V1V2
−one
ste
p
V3V4
−one
ste
p
V1V2
−tw
o st
ep
V3V4
−tw
o st
ep
Expe
cted
BacillusSalmonellaStaphylococcus
LactobacillusListeriaPseudomonas
EnterococcusEscherichiaEscherichia.Shigella
EnterobacteriaceaeShigellaOthers
Aver
age
rela
tive
abun
danc
e
0.0
0.2
0.4
0.6
0.8
1.0
MEG
AN
Krak
en−c
ontig
s
Met
aPhl
an2
Expe
cted
SaccharomycesCryptococcusFilobasidiellaDebaryomycetaceae_unclassified
NaumovozymaEremotheciumKwoniellaEutypa
Gen
us d
istr
ibut
ion
Fungi:Bacteria:
expected diversity
Distance to expected composition
A B
C D
N=4 N=3 N=3 N=3 N=3
.CC-BY-ND 4.0 International licenseis made available under aThe copyright holder for this preprint (which was not peer-reviewed) is the author/funder. It. https://doi.org/10.1101/604314doi: bioRxiv preprint

0
50
100
150
200
Ric
hnes
s (G
enus
)
V1V2
−one
ste
p
V1V2
−one
ste
p
V1V2
−one
ste
p
V1V2
−one
ste
p
V1V2
−one
ste
p
V1V2
−one
ste
p
V1V2
−one
ste
p
V1V2
−one
ste
p
V1V2
−one
ste
p
V1V2
−one
ste
p
V1V2
−one
ste
p
V3V4
−one
ste
p
V3V4
−one
ste
p
V3V4
−one
ste
p
V3V4
−one
ste
p
V3V4
−one
ste
p
V3V4
−one
ste
p
V3V4
−one
ste
p
V3V4
−one
ste
p
V3V4
−one
ste
p
V3V4
−one
ste
p
V3V4
−one
ste
p
V1V2
−tw
o st
ep
V1V2
−tw
o st
ep
V1V2
−tw
o st
ep
V1V2
−tw
o st
ep
V1V2
−tw
o st
ep
V1V2
−tw
o st
ep
V1V2
−tw
o st
ep
V1V2
−tw
o st
ep
V1V2
−tw
o st
ep
V1V2
−tw
o st
ep
V1V2
−tw
o st
ep
V3V4
−tw
o st
ep
V3V4
−tw
o st
ep
V3V4
−tw
o st
ep
V3V4
−tw
o st
ep
V3V4
−tw
o st
ep
V3V4
−tw
o st
ep
V3V4
−tw
o st
ep
V3V4
−tw
o st
ep
V3V4
−tw
o st
ep
V3V4
−tw
o st
ep
V3V4
−tw
o st
ep
MEG
AN
MEG
AN
MEG
AN
MEG
AN
MEG
AN
MEG
AN
MEG
AN
MEG
AN
MEG
AN
MEG
AN
MEG
AN
0
1
2
3
4
5
6
Shan
non
H (G
enus
)
V1V2
−one
ste
p
V1V2
−one
ste
p
V1V2
−one
ste
p
V1V2
−one
ste
p
V1V2
−one
ste
p
V1V2
−one
ste
p
V1V2
−one
ste
p
V1V2
−one
ste
p
V1V2
−one
ste
p
V1V2
−one
ste
p
V1V2
−one
ste
p
V3V4
−one
ste
p
V3V4
−one
ste
p
V3V4
−one
ste
p
V3V4
−one
ste
p
V3V4
−one
ste
p
V3V4
−one
ste
p
V3V4
−one
ste
p
V3V4
−one
ste
p
V3V4
−one
ste
p
V3V4
−one
ste
p
V3V4
−one
ste
p
V1V2
−tw
o st
ep
V1V2
−tw
o st
ep
V1V2
−tw
o st
ep
V1V2
−tw
o st
ep
V1V2
−tw
o st
ep
V1V2
−tw
o st
ep
V1V2
−tw
o st
ep
V1V2
−tw
o st
ep
V1V2
−tw
o st
ep
V1V2
−tw
o st
ep
V1V2
−tw
o st
ep
V3V4
−tw
o st
ep
V3V4
−tw
o st
ep
V3V4
−tw
o st
ep
V3V4
−tw
o st
ep
V3V4
−tw
o st
ep
V3V4
−tw
o st
ep
V3V4
−tw
o st
ep
V3V4
−tw
o st
ep
V3V4
−tw
o st
ep
V3V4
−tw
o st
ep
V3V4
−tw
o st
ep
MEG
AN
MEG
AN
MEG
AN
MEG
AN
MEG
AN
MEG
AN
MEG
AN
MEG
AN
MEG
AN
MEG
AN
MEG
AN
MEGAN●V1V2-one step V3V4-one stepV1V2-two step V3V4-two step
V1V2-one stepV3V4-one stepV1V2-two stepV3V4-two stepMEGAN
<0.0001<0.0010<0.0100<0.0500>0.0500
PHommel
0
50
100
150
200
Ric
hnes
s (G
enus
)
V1V2−one step V3V4−one step V1V2−two step V3V4−two step MEGAN
aquaticterrestrial
0
1
2
3
4
5
Shan
non
(Gen
us)
V1V2−one step V3V4−one step V1V2−two step V3V4−two step MEGAN
aquaticterrestrial
P=0.0402 P=0.0065 P=0.0444 P=0.0073
P=1.107×10⁻⁵
P=0.0036 P=0.0006 P=0.0016 P=0.2087
P=0.0003
V1V2-one stepV3V4-one stepV1V2-two stepV3V4-two stepMEGAN
A B
C DSample sizes: 5 5 5 5 5 5 5 5 5 5 5 5 5 5 5 5 5 5 5 5 4 4 4 410 5 5 4 4 55 5 5 5 5 5 5 5 5 5 5 5 5 5 5 5 5 5 4 5 5 5 5 5 5 Sample sizes: 5 5 5 5 5 5 5 5 5 5 5 5 5 5 5 5 5 5 5 5 4 4 4 410 5 5 4 4 55 5 5 5 5 5 5 5 5 5 5 5 5 5 5 5 5 5 4 5 5 5 5 5 5
Sample sizes: 25 29 25 29 24 29 23 29 25 35 Sample sizes: 25 29 25 29 24 29 23 29 25 35
A.aerophobaA.aurita
C.elegansD.mel. (feces)
D.mel (gut)H.sapiens
H.vulgarisM.leidyi
M.musculusN.vectensis
T.aestivum A.aerophobaA.aurita
C.elegansD.mel. (feces)
D.mel (gut)H.sapiens
H.vulgarisM.leidyi
M.musculusN.vectensis
T.aestivum
.CC-BY-ND 4.0 International licenseis made available under aThe copyright holder for this preprint (which was not peer-reviewed) is the author/funder. It. https://doi.org/10.1101/604314doi: bioRxiv preprint

NMDS1
●
●●
●
●
●
●●
●
●
●
●
●
●
●
●
●
●
●
●
●
●
● ●●
●●
●●
●
●●●
●
●
●
●
●● ●
●
●
●
● ●●
●
●
●●
●● ●
●
●●
●
●
●
●●
●
●
●
●
●
●
●
●
●
●
●
●
●
●
● ●●
●●
●●
●
●●●
●
●
●
●
●● ●
●
●
●
● ●●
●
●
●●
●● ●
●
●●
●
●
●●
●
●
●
●
●
●
●
●
●
●
●
●
●
●
●
●
●
●
●
● ●●
●
●
●
●
●
●
●
●●●
●
●●
●
●
●● ●
●
●
●
●
●
●●
●
●
●
●
●● ●●● ●
Stress: 0.17
●●●●
●●●●
●●●
A.aerophobaA.auritaC.elegansD.melanogaster (feces)
D.melanogaster (gut)H.sapiensH.vulgarisM.leidyi
M.musculusN.vectensisT.aestivum ●
WGS
NMDS1
●●
●●●
●●
●
●●
●●●
●●
●●
●●
● ●
●
●
●
●
●●
●●
●
● ●
●
●
●
●
●
●
●
●
●
●
●
●
●
●● ●●
●
●
●
●
●
●
●●
●
●
●
●
●●
●
●
●
●
●
● ●
●
● ●
●
●
●
●
●
●
●
●
● ●●
●
●●
●
●
●●
●
●●●●●
●●
●
●●● ●●
● ●
●●
●●●
●●
●
●●
●●●
●●
●●
●●
● ●
●
●
●
●
●●
●●
●
● ●
●
●
●
●
●
●
●
●
●
●
●
●
●
●● ●●
●
●
●
●
●
●
●●
●
●
●
●
●●
●
●
●
●
●
● ●
●
● ●
●
●
●
●
●
●
●
●
● ●●
●
●●
●
●
●●
●
●●●●●
●●
●
●●● ●●
● ●
●●
●●●
●●
●
●●
●●●
●●
●●
●●
● ●
●
●
●
●
●●
●●
●
● ●
●
●
●
●
●
●
●
●
●
●
●
●
●●
●
●● ●●
●
●
●
●
●
●
●●
●
●
●
●
●●
●
●
●
●●
●
●
● ●
●
● ●
●
●
●
●
●
●
●
●
● ●●
●
●●
●
●
●●
●
●●●●●
●●
●
●●● ●●
● ●
Stress: 0.17
●●
●●
terestrial: WGS aquatic: WGS
A B
NMDS1
NMDS3
●
●
●
●●
●
●●
●
●
●
●●
●
●●●
●
●
●
●
●
●
●
●
●●
●
●
●
●
●●
●
●
●
●●●●
●
●
●
●
●●
●
● ●
●●
●
●
●
●
●
●●
●
●●
●
●
●
●●
●
●●●
●
●
●
●
●
●
●
●
●●
●
●
●
●
●●
●
●
●
●●●●
●
●
●
●
●●
●
● ●
●●
●
●
●
●
●
●●
●
●●
●
●
●
●
●●
●●
●●●
●
●
●
●
●
●
●
●
●
●
●
●
●
●
●
●
●●
●
●
●
●●●●
●
●
●
●
●
●●
●
● ●
●●
●
●
●
●
●
●●
●
Stress: 0.144
●●●●
●●●●
●●●
AaerophobaAauritaCelegansDmelanogasterfec
DmelanogastergutHsapiensHvulgarisMleidyi
MmusculusNvectensisTriticum ●
WGS
NMDS1
NMDS3
●●
● ●
●
●● ●
●
●
●●
●
●●●
●
●
●
●
●
●●
●
●
●
●
●
●●●
●
●
●
●
●
●
●
●
●
●
●
●●
●●
●
●
●
●●
●
●
●
●
●
●
●
●
●
●
●
●
●
●
●●●●
●
●
●
●●
●
●
●●
●●●●
● ●
●
●
●●
●
●
●
●
●
●
●
● ●
●
●
●
●
●●●
●●
●
●●
● ●
●
●● ●
●
●
●●
●
●●●
●
●
●
●
●
●●
●
●
●
●
●
●●●
●
●
●
●
●
●
●
●
●
●
●
●●
●●
●
●
●
●●
●
●
●
●
●
●
●
●
●
●
●
●
●
●
●●●●
●
●
●
●●
●
●
●●
●●●●
● ●
●
●
●●
●
●
●
●
●
●
●
● ●
●
●
●
●
●●●
●●
●
●●
● ●
●
●● ●
●
●
●●
●
●●●
●
●
●
●
●
●●
●
●
●
●
●
●
●●●
●
●
●
●
●
●
●
●
●
●
●
●
●●
●●
●
●
●●
●●
●
●
●
●
●
●
●
●
●
●
●
●
●
●
●●●
●●
●
●
●
●●
●
●
●●
●●●●
● ●
●
●
●●
●
●
●
●
●
●
●
● ●
●
●
●
●
●●●
●●
●
Stress: 0.144
●●
●●
terestrial: WGS aquatic: WGS
C D
Bra
y-C
urtis
dis
tanc
eJa
ccar
d di
stan
ce
.CC-BY-ND 4.0 International licenseis made available under aThe copyright holder for this preprint (which was not peer-reviewed) is the author/funder. It. https://doi.org/10.1101/604314doi: bioRxiv preprint

0.0
0.2
0.4
0.6
0.8
1.0
Proc
rust
es c
orre
latio
n (
1−
ss)
●
●●●
●
●
●
●●●
●
●
●
P C O F GFunction
WGS
● ● MEGAN
● ●
0.0
0.2
0.4
0.6
0.8
1.0
Proc
rust
es c
orre
latio
n (
1−
ss)
●
●●●
●
● ●
●●
●
●
●
●
P C O F GFunction
WGS
Bray-Curtis Jaccard
.CC-BY-ND 4.0 International licenseis made available under aThe copyright holder for this preprint (which was not peer-reviewed) is the author/funder. It. https://doi.org/10.1101/604314doi: bioRxiv preprint

0.00
0.05
0.10
0.15
0.20
0.25
0.30
0.35
NST
I
V1V2
V3V4
V1V2
V3V4
V1V2
V3V4
V1V2
V3V4
V1V2
V3V4
V1V2
V3V4
V1V2
V3V4
V1V2
V3V4
V1V2
V3V4
V1V2
V3V4
V1V2
V3V4
V1V2
V3V4
V1V2
V3V4
V1V2
V3V4
V1V2
V3V4
V1V2
V3V4
V1V2
V3V4
V1V2
V3V4
V1V2
V3V4
V1V2
V3V4
V1V2
V3V4
V1V2
V3V4
one
step
one
step
one
step
one
step
one
step
one
step
one
step
one
step
one
step
one
step
one
step
two
step
two
step
two
step
two
step
two
step
two
step
two
step
two
step
two
step
two
step
two
step
0.2
0.3
0.4
0.5
0.6
0.7
0.8
Pro
crus
tes
corr
elat
ion
of C
OG
−Cat
egor
ies
(1
−ss
)
V1V2−one step V3V4−one step V1V2−two step V3V4−two step
EggNOG single genesEggNOG single categoriesEggNOG single genes+detail
EggNOG megan 3EggNOG megan 4
NMDS1
●●PICRUSt
MEGAN
single assembly
●●●●●●●●●
●● ●●●●●●●●●●●●●●●●●
●●●●●●●
●● ●●●●●●●●●●●●●●●
● ● MEGANsingle assembly
AauritaCelegans Mleidyi
T Stress: 0.069
A B C
Sample sizes: 5 5 5 5 5 5 5 5 5 5 5 5 5 5 5 5 4 4 4 4 5 5 5 5 5 5 4 4 5 5 5 5 5 5 5 5 5 5 5 4 5 5 5 5
.CC-BY-ND 4.0 International licenseis made available under aThe copyright holder for this preprint (which was not peer-reviewed) is the author/funder. It. https://doi.org/10.1101/604314doi: bioRxiv preprint
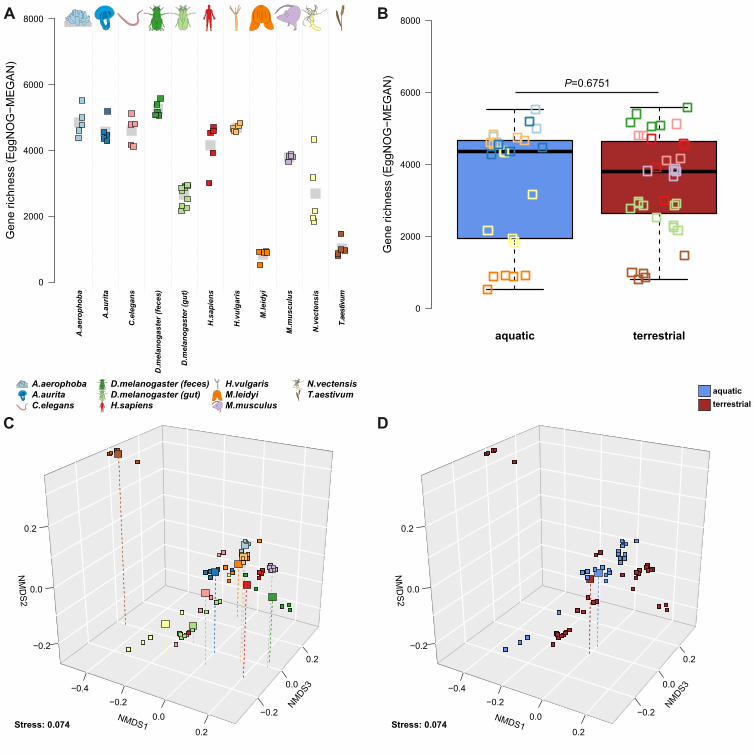
NMDS1
NMDS3
Stress: 0.074
A.aerophobaA.auritaC.elegans
D.melanogaster (feces)D.melanogaster (gut)H.sapiens
H.vulgarisM.leidyiM.musculus
N.vectensisT.aestivum
NMDS1
NMDS3
Stress: 0.074
0
2000
4000
6000
8000
Gen
e ric
hnes
s (E
ggN
OG
−MEG
AN)
aquatic terrestrial
0
2000
4000
6000
8000
A.a
erop
hoba
A.a
urita
C.e
lega
ns
D.m
elan
ogas
ter (
fece
s)
D.m
elan
ogas
ter (
gut)
H.s
apie
ns
H.v
ulga
ris
M.le
idyi
M.m
uscu
lus
N.v
ecte
nsis
T.ae
stiv
um
P=0.6751
A B
DC
aquaticterrestrial
.CC-BY-ND 4.0 International licenseis made available under aThe copyright holder for this preprint (which was not peer-reviewed) is the author/funder. It. https://doi.org/10.1101/604314doi: bioRxiv preprint