comparative analysis of cocomo ii, seer-sem...
TRANSCRIPT

USC-CSSE-2008-816
Comparative Analysis of COCOMO II, SEER-SEM and True-S Software Cost Models
Raymond Madachy, Barry Boehm
USC Center for Systems and Software Engineering {madachy, boehm}@usc.edu
1. Abstract We have been assessing the strengths, limitations, and improvement needs of cost, schedule, quality and risk models for NASA flight projects. The primary cost models used in this domain for critical flight software are COCOMO II, SEER-SEM and True S. A comparative survey and analysis of these models against a common database of NASA projects was undertaken. A major part of this work is defining transformations between the different models by the use of Rosetta Stones that describe the mappings between their cost factors. With these Rosetta Stones, projects can be represented in all models in a fairly consistent manner and differences in their estimates better understood. Top-level Rosetta Stones map the factors between the models, and the detailed ones map the individual ratings between the corresponding factors. Most of the Rosetta Stone mappings between factors are one to one, but some are one to many. The Rosetta Stones we have developed so far allow one to convert COCOMO II estimate inputs into corresponding SEER-SEM or True S inputs, or vice-versa. NASA data came in the COCOMO format and was converted to SEER-SEM and True S factors per the Rosetta Stones. This initial study was largely limited to a COCOMO viewpoint. The current Rosetta Stones need further review and have to deal with incommensurate quantities from model to model. The cost models performed well when assessed against the NASA data despite these drawbacks, the absence of contextual data and potential flaws in the factor transformations. The current set of Rosetta Stones has provided a usable framework for analysis, but more should be done including developing two-way and/or multiple-way Rosetta Stones, and partial factor-to-factor mappings. Factors unique to some models should be addressed and detailed translations between the size inputs should be developed including COTS and reuse sizing. Remaining work also includes elaborating the detailed Rosetta Stone for the new True S model, and rigorous review of all the top-level and detailed Rosetta Stones. Conclusions for existing model usage and new model development are provided. In practice no one model should be preferred over all others, and it is best to use a variety of
1
USC-CSSE-2008-816
methods. Future work involves repeating the analysis with the refined Rosetta Stones, updated calibrations, improved models and new data. 2. Introduction This research is assessing the strengths, limitations, and improvement needs of existing cost, schedule, quality and risk models for critical flight software for the NASA AMES project Software Risk Advisory Tools. This report focuses only on the cost model aspect. A comparative survey and analysis of cost models used by NASA flight projects is described. The models include COCOMO II, SEER-SEM and True S. We look at evidence of accuracy, the need for calibration, and the use of knowledge bases to reflect specific domain factors. The models are assessed against a common database of relevant NASA projects. The overriding primary focus is on flight projects, but part of the work also looks at related sub-domains for critical NASA software. They are assessed as applicable in some of the following analyses. This report also addresses the critical NASA domain factors of high reliability and high complexity, and how the cost models address them. Transformations between the models are also developed, so projects can be represented in all models in a consistent manner and to help understand why estimates may vary. There is a more thorough treatment of the USC public domain COCOMO II related models as they planned for usage in the current research, and the current datasets are in the COCOMO format. Conclusions for existing model usage and new model development are provided. The SEER-SEM and True S model vendors provided minor support and have identified areas of improvement as described later in this report.
2.1 Cost Models Used The most frequently used cost and schedule models for critical flight software being evaluated are the COCOMO II, True S (previously PRICE S) and SEER-SEM parametric models. COCOMO II is a public domain model that USC continually updates and is implemented in several commercial tools. True S and SEER-SEM are both proprietary commercial tools with unique features but also share some aspects with COCOMO. All three have been extensively used and tailored for flight project domains. Other industry cost models such as SLIM, Checkpoint and Estimacs have not been nearly as frequently used for flight software and are more oriented towards business applications. A previous comparative survey of software cost models can be found in [Boehm et al. 2000b]. A previous study at JPL analyzed the same three models, COCOMO II, SEER-SEM and PRICE S with respect to some of their flight and ground projects [Lum et al. 2001]. In that case each model estimate was a separate data point. This current approach varied since the data used only came in the COCOMO model format and required translation to the other models.
2

USC-CSSE-2008-816
2.1.1 COCOMO II The COCOMO (COnstructive COst MOdel) cost and schedule estimation model was originally published in [Boehm 1981]. The COCOMO II research effort was started in 1994, and the model continues to be updated at USC, the home institution of research for the COCOMO model family. COCOMO II defined in [Boehm et al. 2000] has three submodels: Applications Composition, Early Design and Post-Architecture. They can be combined in various ways to deal with different software environments. The Application Composition model is used to estimate effort and schedule on projects typically done as rapid application development. The Early Design model involves the exploration of alternative system architectures and concepts of operation. Typically, not enough is known to make a detailed fine-grained estimate. This model is based on function points (or lines of code when available) and a set of five scale factors and seven effort multipliers. The Post-Architecture model is used when top level design is complete and detailed information about the project is available and the software architecture is well defined. It uses Source Lines of Code and/or Function Points for the sizing parameter, adjusted for reuse and breakage; a set of 17 effort multipliers and a set of five scale factors that determine the economies/diseconomies of scale of the software under development. USC provides a public domain tool for COCOMO II. The primary vendor tools that offer the COCOMO II model family include the following: • Costar offered by Softstar Systems has a complete COCOMO II implementation with
tools for calibration and the Constructive Systems Engineering Model (COSYSMO). See http://www.softstarsystems.com. Softstar Systems provided a COCOMO II calibration spreadsheet used in support of this research (see Acknowledgments).
• The Cost Xpert tool offered by the Cost Xpert Group has a superset of the COCOMO II post-architecture submodel. It has additional linear cost drivers and additional constraint factors on effort and schedule. See http://costxpert.com.
• The True Planner tool from PRICE Systems has a COCOMO II model that can be invoked in lieu of the True S model.
The remainder of this report only considers the COCOMO II post-architecture submodel.
2.1.2 True S (formerly PRICE S) True S is the updated product to the PRICE S model offered by PRICE Systems. PRICE S was originally developed at RCA for use internally on software projects such as the Apollo moon program, and was then released in 1977 as a proprietary model. Many of the model’s central algorithms were published in [Park 1988]. See the PRICE Systems website at http://www.pricesystems.com. The PRICE S model consists of three submodels that enable estimating costs and schedules for the development and support of computer systems. The model covers
3
USC-CSSE-2008-816
business systems, communications, command and control, avionics, and space systems. PRICE S includes features for reengineering, code generation, spiral development, rapid development, rapid prototyping, object-oriented development, and software productivity measurement. Size inputs include SLOC, function points and/or Predictive Object Points (POPs). The switch to True S is taking place during this work. Hence some of the descriptions retain the old PRICE S terminology (such as the Rosetta Stone) while we move towards a complete True S implementation. All numeric estimate results are for the latest True S model.
2.1.3 SEER-SEM SEER-SEM is a product offered by Galorath, Inc. This model is based on the original Jensen model [Jensen 1983], and has been on the market for over 15 years. Its parametric modeling equations are proprietary. Descriptive material about the model can be found in [Galorath-Evans 2006]. The scope of the model covers all phases of the project life-cycle, from early specification through design, development, delivery and maintenance. It handles a variety of environmental and application configurations, and models different development methods and languages. Development modes covered include object oriented, reuse, COTS, spiral, waterfall, prototype and incremental development. Languages covered are 3rd and 4th generation languages (C++, FORTRAN, COBOL, Ada, etc.), as well as application generators. The SEER-SEM cost model allows probability levels of estimates, constraints on staffing, effort or schedule, and it builds estimates upon a knowledge base of existing projects. Estimate outputs include effort, cost, schedule, staffing, and defects. Sensitivity analysis is also provided. Many sizing methods are available including lines of code and function points. See the Galorath Inc. website at http://www.gaseer.com. 3. Model Comparison This section describes the major similarities and differences between the models. Analyses of their performance against project data, calibration and knowledge bases are addressed in Sections 4 and 5.
3.1 Algorithms As described in [Lum et al. 2001], all three models essentially boil down to the common effort formula shown in Figure 1. Size of the software is provided in a number of available units, cost factors describe the overall environment and calibrations may take the form of coefficients adjusted for actual data or other types of factors that account for domain-specific
4
USC-CSSE-2008-816
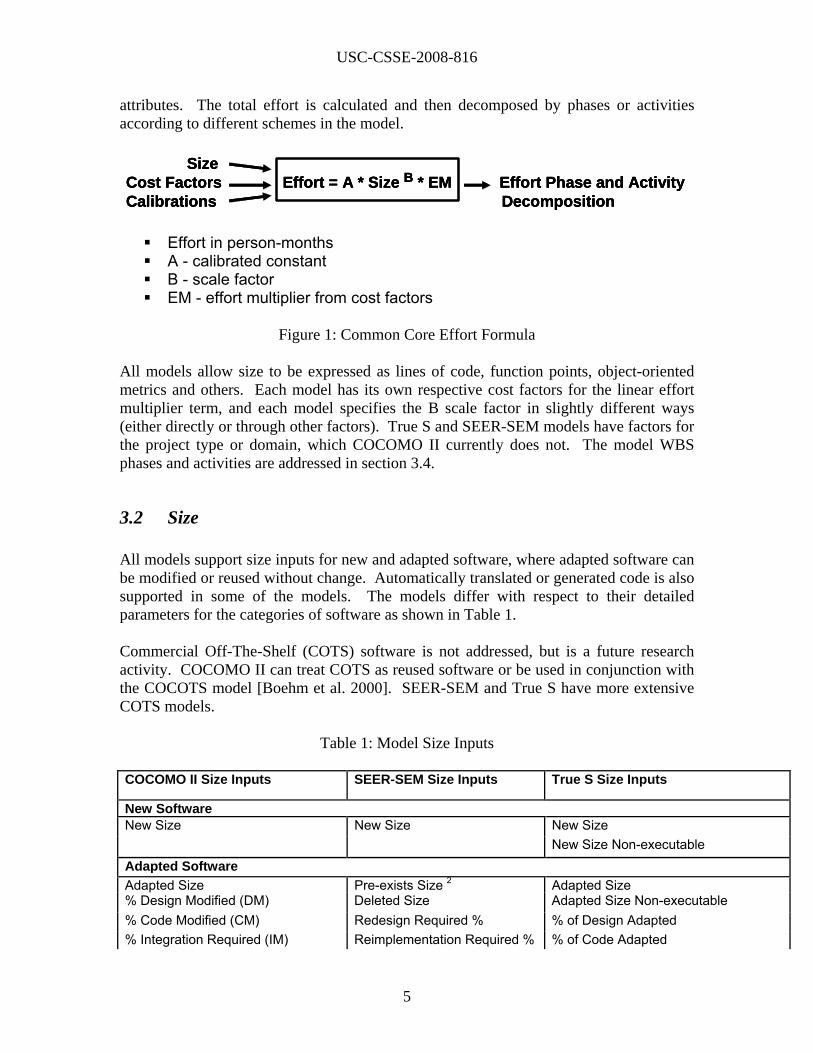
attributes. The total effort is calculated and then decomposed by phases or activities according to different schemes in the model.
SizeCost Factors Effort = A * Size B * EM Effort Phase and Activity Calibrations Decomposition
SizeCost Factors Effort = A * Size B * EM Effort Phase and Activity Calibrations Decomposition
SizeCost Factors Effort = A * Size B * EM Effort Phase and Activity Calibrations Decomposition
Effort in person-months A - calibrated constant B - scale factor EM - effort multiplier from cost factors
Figure 1: Common Core Effort Formula
All models allow size to be expressed as lines of code, function points, object-oriented metrics and others. Each model has its own respective cost factors for the linear effort multiplier term, and each model specifies the B scale factor in slightly different ways (either directly or through other factors). True S and SEER-SEM models have factors for the project type or domain, which COCOMO II currently does not. The model WBS phases and activities are addressed in section 3.4.
3.2 Size All models support size inputs for new and adapted software, where adapted software can be modified or reused without change. Automatically translated or generated code is also supported in some of the models. The models differ with respect to their detailed parameters for the categories of software as shown in Table 1. Commercial Off-The-Shelf (COTS) software is not addressed, but is a future research activity. COCOMO II can treat COTS as reused software or be used in conjunction with the COCOTS model [Boehm et al. 2000]. SEER-SEM and True S have more extensive COTS models.
Table 1: Model Size Inputs COCOMO II Size Inputs SEER-SEM Size Inputs True S Size Inputs
New Software New Size New Size New Size
New Size Non-executable Adapted Software Adapted Size Pre-exists Size 2 Adapted Size % Design Modified (DM) Deleted Size Adapted Size Non-executable % Code Modified (CM) Redesign Required % % of Design Adapted % Integration Required (IM) Reimplementation Required % % of Code Adapted
5

USC-CSSE-2008-816
Assessment and Assimilation (AA) Retest Required % % of Test Adapted Software Understanding (SU) 1 Reused Size Programmer Unfamiliarity (UNFM) 1 Reused Size Non-executable
Deleted Size Code Removal Complexity
Automatically Translated and Generated Code Adapted SLOC Auto Generated Code Size Automatic Translation Productivity Auto Generated Size Non-executable % of Code Reengineered Auto Translated Code Size Auto Translated Size Non-executable
1 - Not applicable for reused software 2 – Specified separately for Designed for Reuse and Not Designed for Reuse
COCOMO II allows for sizing in SLOC or function points. SEER-SEM and True S provide both of those along with additional size units. User-defined proxy sizes can be developed for any of the models and converted back to SLOC or function points. Future work can also be undertaken to develop model translations between the size input parameters. These would consist of rules or guidelines to convert size inputs between models, and can be supplemented with knowledge base settings.
3.3 Cost Factor Rosetta Stones This section describes the mappings, or transformations between cost factors in the different models. With this information COCOMO II estimate inputs can be converted into corresponding SEER-SEM or True S (or PRICE S) inputs, or vice-versa. It also illustrates differences in the models to help understand why estimates may vary. Top-level Rosetta Stones map the factors between the models, and the detailed ones map the individual ratings between the corresponding factors. An integrated top-level Rosetta Stone for all of the COCOMO II factors is shown in Table 2. Most of the mappings between factors are one to one, but some are one to many (e.g. SEER-SEM has platform factor ratings split into target and host). In the case of True S, many of the COCOMO II factors have direct corollaries to sub-factors in aggregate True S factors. For example the COCOMO personnel factors are represented as sub-factors under the aggregate True S factor for Development Team Complexity. Table 3 and Table 4 show the additional factors in SEER-SEM and True S for which there are no analogs in COCOMO II.
Table 2: Integrated Top-Level Rosetta Stone for COCOMO II Factors COCOMO II Factor SEER-SEM Factor(s) True S Factor(s) SCALE DRIVERS Precedentedness none none
6

USC-CSSE-2008-816
Development Flexibility none Operating Specification Architecture/Risk Resolution none none Team Cohesion none Development Team Complexity Process Maturity none 1 Organization Productivity
- CMM Level PRODUCT ATTRIBUTES Required Software Reliability Specification Level -
Reliability Operating Specification
Data Base Size none Code Size non Executable Product Complexity - Complexity (Staffing)
- Application Class Complexity
Functional Complexity
Required Reusability - Reusability Level Required - Software Impacted by Reuse
Design for Reuse
Documentation Match to Lifecycle Needs
none Operating Specification
PLATFORM ATTRIBUTES Execution Time Constraint Time Constraints Project Constraints
- Communications and Timing
Main Storage Constraint Memory Constraints Project Constraints - Memory & Performance
Platform Volatility - Target System Volatility - Host System Volatility
Hardware Platform Availability 3
PERSONNEL ATTRIBUTES Analyst Capability Analyst Capability Development Team Complexity
- Capability of Analysts and Designers
Programmer Capability Programmer Capability Development Team Complexity - Capability of
Programmers Personnel Continuity none Development Team Complexity
- Team Continuity Application Experience Application Experience Development Team Complexity
- Familiarity with Platform Platform Experience - Development System
Experience - Target System Experience
Development Team Complexity - Familiarity with Product
Language and Toolset Experience
Programmer’s Language Experience
Development Team Complexity - Experience with
Language PROJECT ATTRIBUTES Use of Software Tools Software Tool Use Design Code and Test Tools Multi-site Development Multiple Site Development Multi Site Development Required Development Schedule
none 2 Start and End Date
1 - SEER-SEM Process Improvement factor rates the impact of
improvement, not the CMM level 2 - Schedule constraints
handled differently 3 - A software assembly
input factor
7

USC-CSSE-2008-816
Table 3: SEER-SEM Cost Factors with no COCOMO II Mapping
PERSONNEL CAPABILITIES AND EXPERIENCE Practices and Methods Experience DEVELOPMENT SUPPORT ENVIRONMENT Modern Development Practices Logon thru Hardcopy Turnaround Terminal Response Time Resource Dedication Resource and Support Location Process Volatility PRODUCT DEVELOPMENT REQUIREMENTS Requirements Volatility (Change) 1
Test Level 2
Quality Assurance Level 2
Rehost from Development to Target PRODUCT REUSABILITY Software Impacted by Reuse DEVELOPMENT ENVIRONMENT COMPLEXITY Language Type (Complexity) Host Development System Complexity Application Class Complexity 3
Process Improvement TARGET ENVIRONMENT Special Display Requirements Real Time Code Security Requirements 1 – COCOMO II uses the Requirements Evolution and Volatility size adjustment factor 2 – Captured in the COCOMO II Required Software Reliability factor 3 – Captured in the COCOMO II Complexity factor
Table 4: True S Cost Factors with no COCOMO II Mapping
To-be-provided
8
USC-CSSE-2008-816
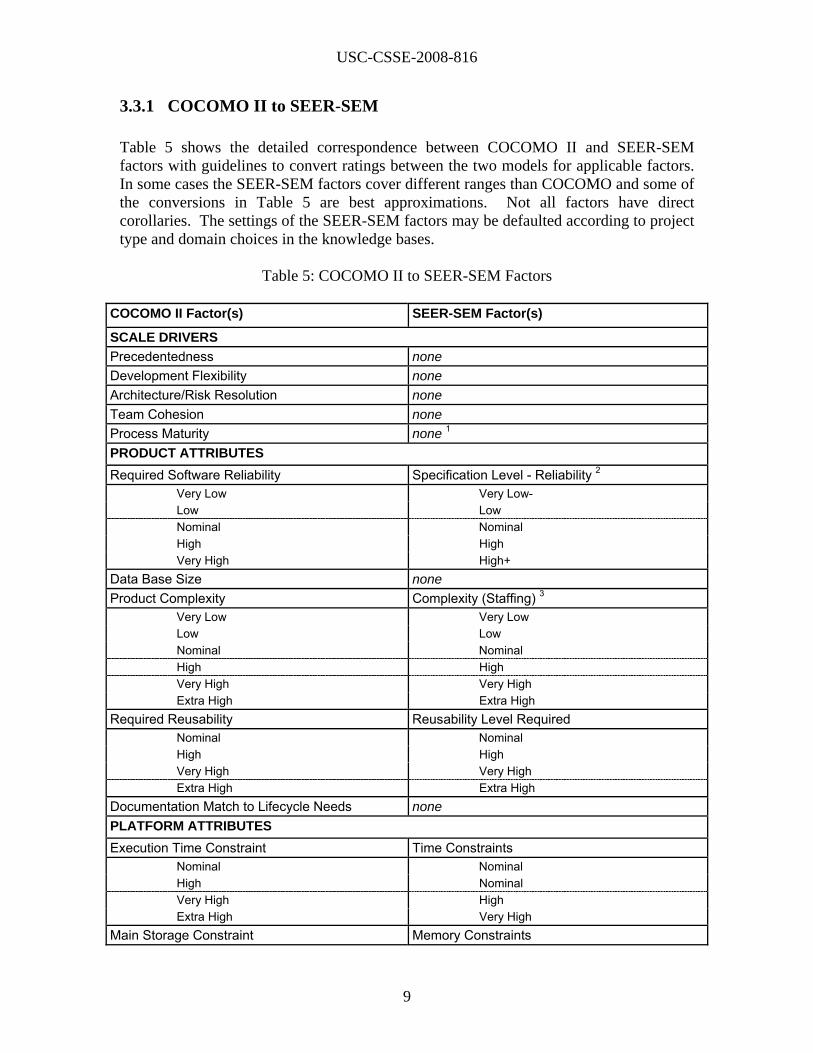
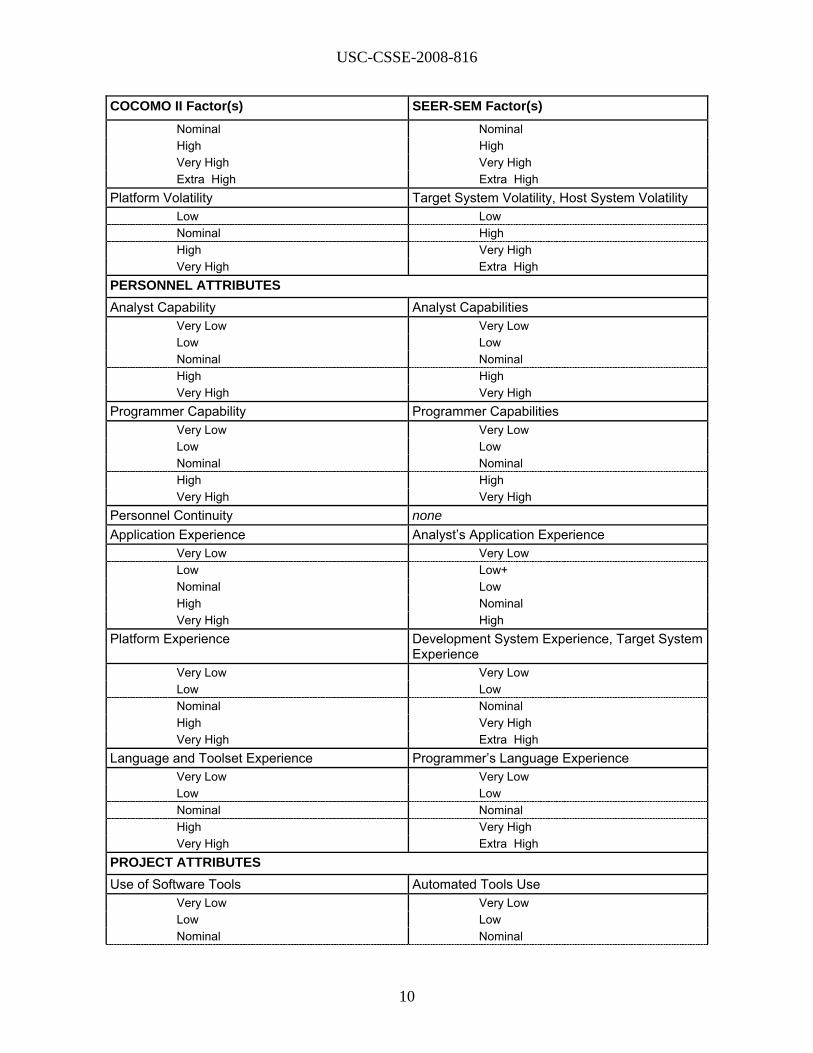
3.3.1 COCOMO II to SEER-SEM Table 5 shows the detailed correspondence between COCOMO II and SEER-SEM factors with guidelines to convert ratings between the two models for applicable factors. In some cases the SEER-SEM factors cover different ranges than COCOMO and some of the conversions in Table 5 are best approximations. Not all factors have direct corollaries. The settings of the SEER-SEM factors may be defaulted according to project type and domain choices in the knowledge bases.
Table 5: COCOMO II to SEER-SEM Factors
COCOMO II Factor(s) SEER-SEM Factor(s)
SCALE DRIVERS Precedentedness none Development Flexibility none Architecture/Risk Resolution none Team Cohesion none Process Maturity none 1 PRODUCT ATTRIBUTES Required Software Reliability Specification Level - Reliability 2 Very Low Very Low- Low Low Nominal Nominal High High Very High High+ Data Base Size none Product Complexity Complexity (Staffing) 3 Very Low Very Low Low Low Nominal Nominal High High Very High Very High Extra High Extra High Required Reusability Reusability Level Required Nominal Nominal High High Very High Very High Extra High Extra High Documentation Match to Lifecycle Needs none PLATFORM ATTRIBUTES Execution Time Constraint Time Constraints Nominal Nominal High Nominal Very High High Extra High Very High Main Storage Constraint Memory Constraints
9
USC-CSSE-2008-816
COCOMO II Factor(s) SEER-SEM Factor(s) Nominal Nominal High High Very High Very High Extra High Extra High Platform Volatility Target System Volatility, Host System Volatility Low Low Nominal High High Very High Very High Extra High PERSONNEL ATTRIBUTES Analyst Capability Analyst Capabilities Very Low Very Low Low Low Nominal Nominal High High Very High Very High Programmer Capability Programmer Capabilities Very Low Very Low Low Low Nominal Nominal High High Very High Very High Personnel Continuity none Application Experience Analyst’s Application Experience Very Low Very Low Low Low+ Nominal Low High Nominal Very High High Platform Experience Development System Experience, Target System
Experience Very Low Very Low Low Low Nominal Nominal High Very High Very High Extra High Language and Toolset Experience Programmer’s Language Experience Very Low Very Low Low Low Nominal Nominal High Very High Very High Extra High PROJECT ATTRIBUTES Use of Software Tools Automated Tools Use Very Low Very Low Low Low Nominal Nominal
10

USC-CSSE-2008-816
COCOMO II Factor(s) SEER-SEM Factor(s) High High Very High Very High Multi-site Development Multiple Site Development Very Low Extra High Low Very High Nominal High or Nominal High High or Nominal Very High Nominal Extra High Nominal Required Development Schedule none 4
1 - SEER-SEM Process Improvement factor rates the impact of improvement instead of the CMM level 2 – Related SEER-SEM factors include Test Level and Quality Assurance Level which are also usually driven by reliability requirements 3 – SEER-SEM also has Application Class Complexity to rate at the program level, and other complexity factors for the development environment 4 - Schedule constraints handled differently in models
11
USC-CSSE-2008-816
3.3.2 COCOMO II to PRICE S and True S Table 2 showed the top-level view of the COCOMO II to True S Rosetta Stone. Due to the new product being currently phased in, the Rosetta Stone will be refined for the next level of True S subfactors and will be provided at a later date. The more complete Rosetta Stone in Table 6 and Table 7 shows the correspondence to the PRICE S model. The factor names shown are being replaced with the modernized terms in True S in order to elaborate the detailed Rosetta Stone between COCOMO II and True S.
12

USC-CSSE-2008-816
Table 6: COCOMO II to PRICE S Rosetta Stone
COCOMO Factor(s) PRICE S Factor(s)
SCALE DRIVERS
Precedentedness noneDevelopment Flexibility noneArchitecture/Risk Resolution noneTeam Cohesion noneProcess Maturity none
PRODUCT ATTRIBUTES
Required Software Reliability PLTFM Very Low 0.65 Low 0.8 Nominal 1 High 1.2 Very High 1.4
Data Base Size PROFACProduct Complexity APPL Very Low 0.86 Low 2.3 Nominal 5.5 High 6.5 Very High 8.5 Extra High 10.95
Required Reusability CPLX1 Nominal +0 High +0.1 Very High +0.3 Extra High +0.5
Documentation Match to Lifecycle Needs
none
PLATFORM ATTRIBUTES
Execution Time Constraint UTIL - time Nominal 0.5 High 0.7 Very High 0.85 Extra High 0.95
Main Storage Constraint UTIL - memory Nominal 0.5 High 0.7 Very High 0.85 Extra High 0.95
Platform Volatility CPLX2 Low -0.05 Nominal +0 High +0.05 Very High +0.1
13

USC-CSSE-2008-816
Table 7: COCOMO II to PRICE S Rosetta Stone (Continued)
PERSONNEL ATTRIBUTES
Analyst Capability CPLX1 Very Low +0.1 Low +0.05 Nominal +0 High -0.05 Very High -0.1
Programmer Capability CPLX1 Very Low +0.1 Low +0.05 Nominal +0 High -0.05 Very High -0.1
Personnel Continuity noneApplication Experience CPLX1 Very Low +0.1 Low +0.05 Nominal +0 High -0.05 Very High -0.1
Platform Experience CPLX1 Very Low +0.1 Low +0.05 Nominal +0 High -0.05 Very High -0.1
Language and Toolset Experience PROFAC
Very Low +0.1 Low +0.05 Nominal +0 High -0.05 Very High -0.1
PROJECT ATTRIBUTES
Use of Software Tools CPLX1 Very Low Very Low Low Low Nominal Nominal High High Very High Very High
Multi-site Development NoneRequired Development Schedule Development Start date - mandatory
14
USC-CSSE-2008-816
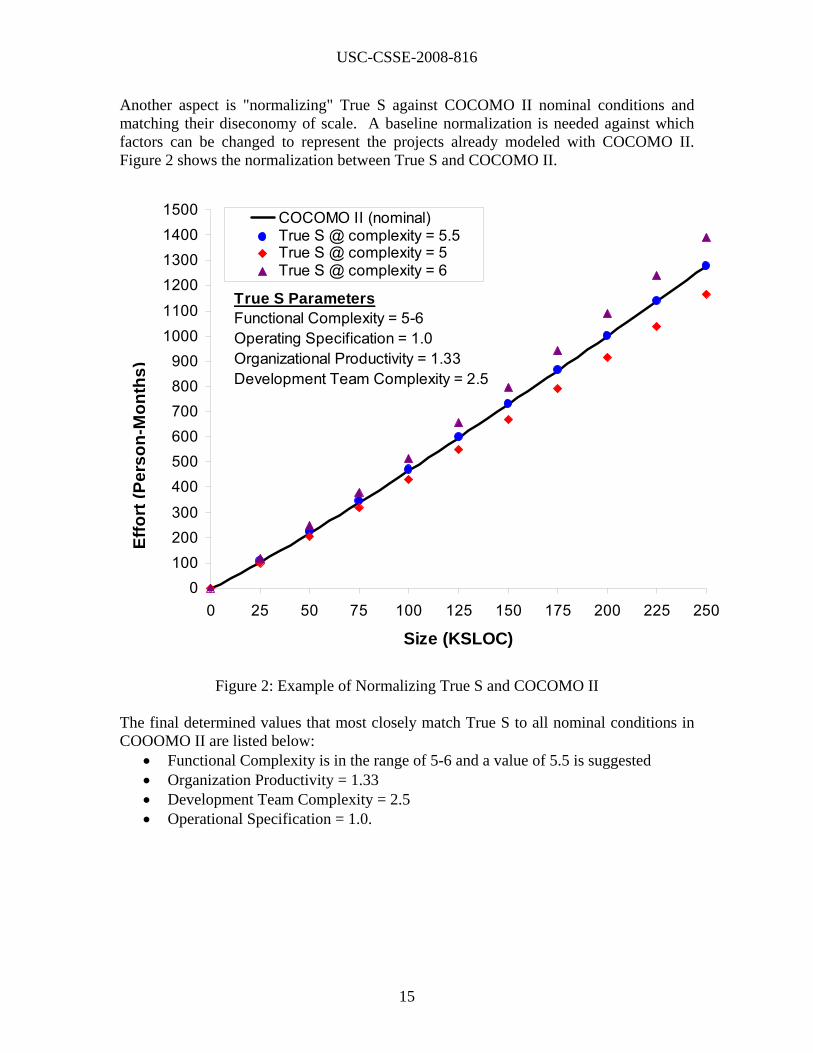
Another aspect is "normalizing" True S against COCOMO II nominal conditions and matching their diseconomy of scale. A baseline normalization is needed against which factors can be changed to represent the projects already modeled with COCOMO II. Figure 2 shows the normalization between True S and COCOMO II.
0100200300
400500600700800900
10001100
1200130014001500
0 25 50 75 100 125 150 175 200 225 250
Size (KSLOC)
Effo
rt(P
erso
n-M
onth
s)
COCOMO II (nominal)True S @ complexity = 5.5True S @ complexity = 5True S @ complexity = 6
True S ParametersFunctional Complexity = 5-6Operating Specification = 1.0Organizational Productivity = 1.33Development Team Complexity = 2.5
Figure 2: Example of Normalizing True S and COCOMO II The final determined values that most closely match True S to all nominal conditions in COOOMO II are listed below:
• Functional Complexity is in the range of 5-6 and a value of 5.5 is suggested • Organization Productivity = 1.33 • Development Team Complexity = 2.5 • Operational Specification = 1.0.
15

USC-CSSE-2008-816
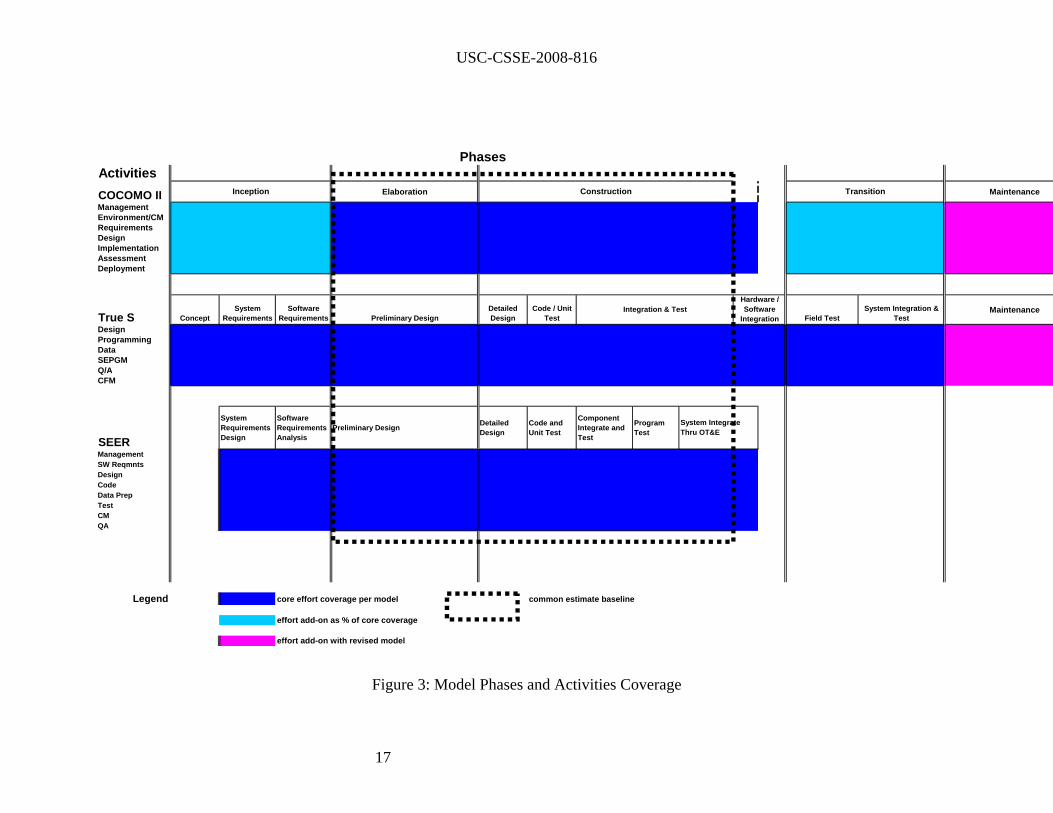
3.4 Phases and Activities Reconciliation of the effort work breakdown structures (WBS) is necessary for valid comparison between models. If estimates are to be compared they need to cover the same activities. The common estimate baseline consists of the elaboration and construction phases for software activities (per the COCOMO II default), and shown in Figure 3. Additionally the NASA 94 data came in the COCOMO format and is assumed to cover those activities; hence a model that estimates more must have some activities subtracted out for a valid comparison. The correspondence of the common baseline and the core effort coverage of the different models are also shown in Figure 3.
16
USC-CSSE-2008-816
ActivitiesCOCOMO II Elaboration Maintenance
ManagementEnvironment/CMRequirementsDesignImplementationAssessmentDeployment
True S ConceptSystem
RequirementsSoftware
Requirements Preliminary DesignDetailed Design
Code / Unit Test Field Test
System Integration & Test
Maintenance
DesignProgrammingDataSEPGMQ/ACFM
SEER
System Requirements Design
Software Requirements Analysis
Preliminary Design Detailed Design
Code and Unit Test
Component Integrate and Test
Program Test
ManagementSW ReqmntsDesignCodeData PrepTestCMQA
Legend core effort coverage per model common estimate baseline
effort add-on as % of core coverage
effort add-on with revised model
System Integrate Thru OT&E
Phases
Integration & Test
TransitionInception Construction
Hardware / Software
Integration
Figure 3: Model Phases and Activities Coverage
17
USC-CSSE-2008-816
Due to the differences, the SEER-SEM and True S estimates were refined by subtracting the activities described below.
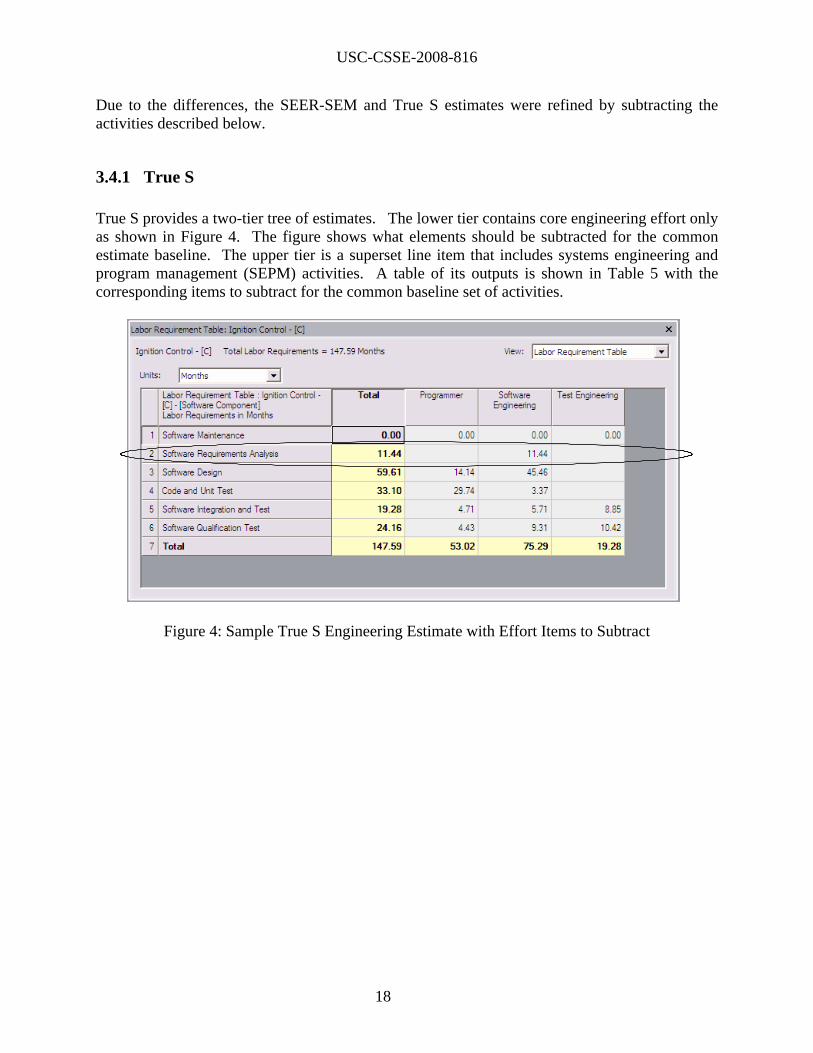
3.4.1 True S True S provides a two-tier tree of estimates. The lower tier contains core engineering effort only as shown in Figure 4. The figure shows what elements should be subtracted for the common estimate baseline. The upper tier is a superset line item that includes systems engineering and program management (SEPM) activities. A table of its outputs is shown in Table 5 with the corresponding items to subtract for the common baseline set of activities.
Figure 4: Sample True S Engineering Estimate with Effort Items to Subtract
18

USC-CSSE-2008-816
Table 8: Sample True S SEPM-Level Estimate with Effort Items to Subtract
Labor Requirement Table : Engine Control - [Software Assembly] \ Labor Requirements in Months Total
1 Software Maintenance 0.02 Manage Project 141.23 Perform Configuration Management 61.84 Perform Joint Technical Reviews 0.05 Perform Quality Assurance 55.86 Plan and Oversee 13.07 Plan Software Development 19.38 Write Documentation 58.09 Analyze System Requirements 9.6
10 Design System 6.4
11 Perform Assembly Integration and Test 88.1
12 Software Requirements Analysis 23.813 Software Design 122.914 Code and Unit Test 63.215 Software Integration and Test 33.116 Software Qualification Test 41.417 Perform HW/SW Integration and Test 26.1
18 Perform Software Product Evaluations 0.0
19 Perform System Qualification Test 11.620 Total 775.4
subtracted effort = 119.1 revised total = 656.3
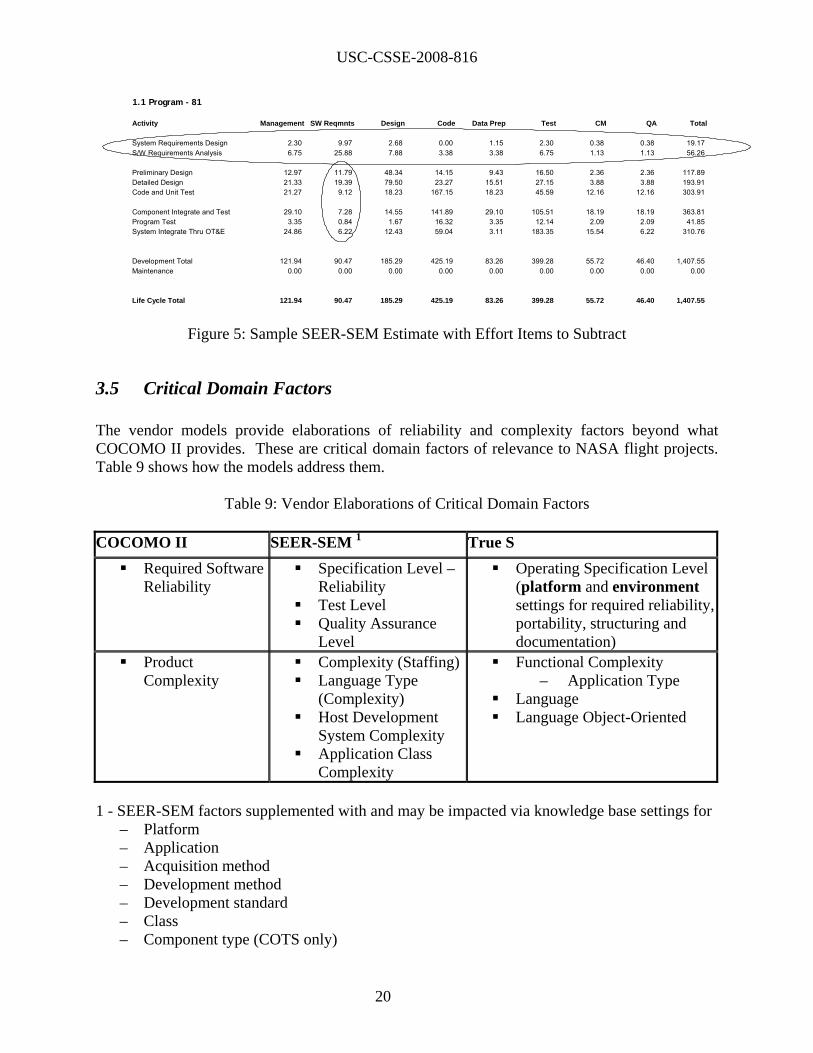
3.4.2 SEER Error! Reference source not found. shows a summarized SEER-SEM estimate and the items subtracted out for this analysis to make equivalent estimates.
19
USC-CSSE-2008-816
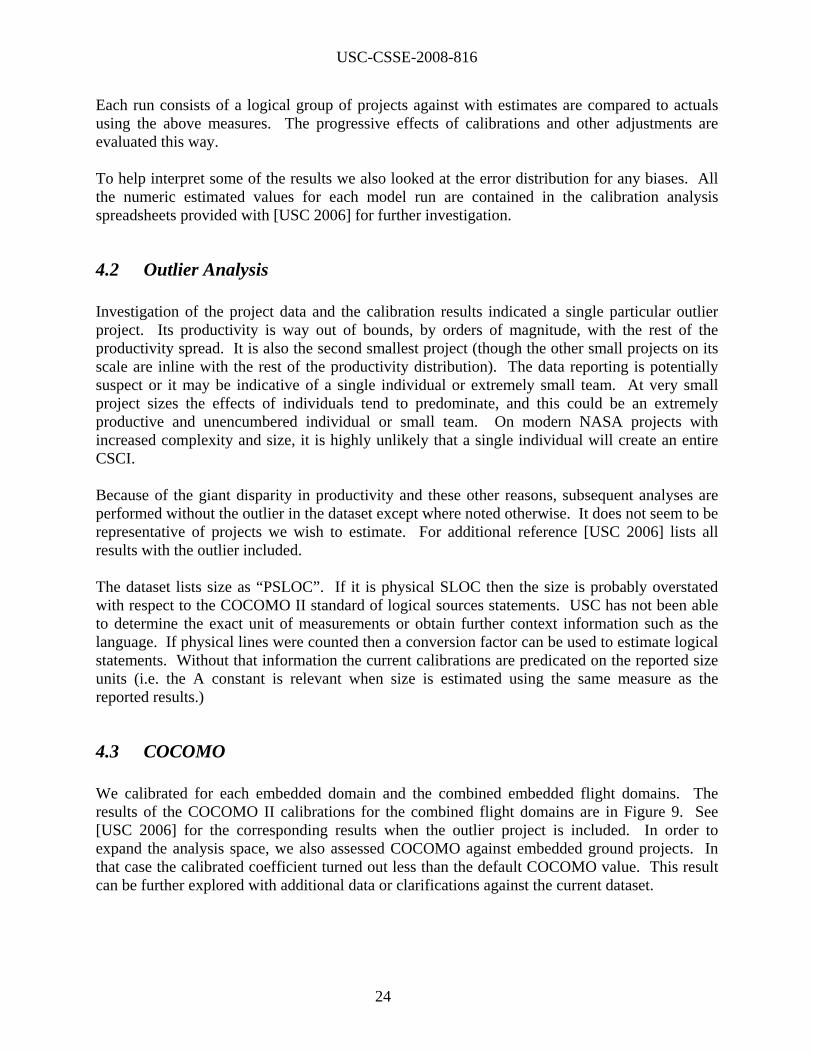
1.1 Program - 81
Activity Management SW Reqmnts Design Code Data Prep Test CM QA Total
System Requirements Design 2.30 9.97 2.68 0.00 1.15 2.30 0.38 0.38 19.17S/W Requirements Analysis 6.75 25.88 7.88 3.38 3.38 6.75 1.13 1.13 56.26
Preliminary Design 12.97 11.79 48.34 14.15 9.43 16.50 2.36 2.36 117.89Detailed Design 21.33 19.39 79.50 23.27 15.51 27.15 3.88 3.88 193.91Code and Unit Test 21.27 9.12 18.23 167.15 18.23 45.59 12.16 12.16 303.91
Component Integrate and Test 29.10 7.28 14.55 141.89 29.10 105.51 18.19 18.19 363.81Program Test 3.35 0.84 1.67 16.32 3.35 12.14 2.09 2.09 41.85System Integrate Thru OT&E 24.86 6.22 12.43 59.04 3.11 183.35 15.54 6.22 310.76
Development Total 121.94 90.47 185.29 425.19 83.26 399.28 55.72 46.40 1,407.55Maintenance 0.00 0.00 0.00 0.00 0.00 0.00 0.00 0.00 0.00
Life Cycle Total 121.94 90.47 185.29 425.19 83.26 399.28 55.72 46.40 1,407.55
Figure 5: Sample SEER-SEM Estimate with Effort Items to Subtract
3.5 Critical Domain Factors The vendor models provide elaborations of reliability and complexity factors beyond what COCOMO II provides. These are critical domain factors of relevance to NASA flight projects. Table 9 shows how the models address them.
Table 9: Vendor Elaborations of Critical Domain Factors COCOMO II SEER-SEM 1 True S Required Software
Reliability Specification Level –
Reliability Test Level Quality Assurance
Level
Operating Specification Level (platform and environment settings for required reliability, portability, structuring and documentation)
Product Complexity
Complexity (Staffing) Language Type
(Complexity) Host Development
System Complexity Application Class
Complexity
Functional Complexity – Application Type
Language Language Object-Oriented
1 - SEER-SEM factors supplemented with and may be impacted via knowledge base settings for
– Platform – Application – Acquisition method – Development method – Development standard – Class – Component type (COTS only)
20

USC-CSSE-2008-816
SEER-SEM has an extensive set of knowledge base choices. Table 10 shows example knowledge bases applicable to NASA flight projects.
Table 10: Example SEER-SEM Knowledge Bases Relevant to NASA Projects
Platform Knowledge Bases • Avionics • Ground System Non Critical • Ground-Based Mission Critical • Manned Space • Unmanned Space
Application Knowledge Bases • Flight Systems
In True S the Operating Specification factor describes the intended operating environment and defines the degree of required reliability, portability, structuring and documentation. Table 11 lists the categories for space software. Additional categories for military environments may also apply.
Table 11: True S Operating Specification Choices for Space Projects
Space Software • Unmanned • Manned
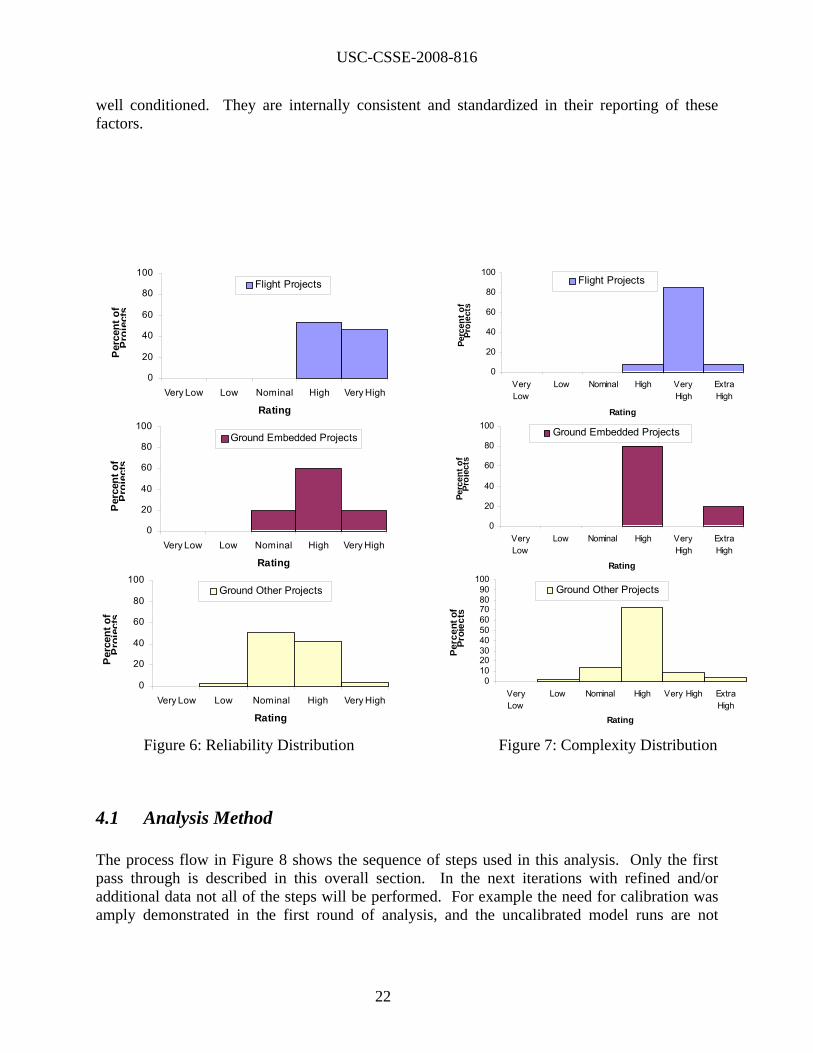
4. Model Analysis Against NASA 94 Project Data The research team was provided the “NASA 94” set of projects. Of the 95 projects only 13 are listed as flight projects. All the remaining analysis is predicated on those 13 projects alone except noted otherwise where COCOMO II was also applied to five ground embedded projects. The data came in the COCOMO 81 format. They were converted to COCOMO II per the guidelines in [Reifer et al. 2000] and further converted to SEER-SEM or True S factors per the Rosetta Stones in this report. See Appendix A for examples of the original and transformed data. The database covers flight and ground projects, and some ground projects are embedded. An analysis of the critical factor distributions for reliability and complexity indicate that flight projects, as expected, exhibit patterns for both higher reliability and complexity. Figure 6 and Figure 7 show the distributions of these factors in the database. These spreads are as expected, which also supports the contention that these projects provided in the COCOMO 81 format are
21
USC-CSSE-2008-816
well conditioned. They are internally consistent and standardized in their reporting of these factors.
0
20
40
60
80
100
Very Low Low Nominal High Very High
Rating
Perc
ent o
f Pr
ojec
ts
Flight Projects
0
20
40
60
80
100
Very Low Low Nominal High Very High
Rating
Perc
ent o
f Pr
ojec
ts
Ground Embedded Projects
0
20
40
60
80
100
Very Low Low Nominal High Very High
Rating
Perc
ent o
f Pr
ojec
ts
Ground Other Projects
0
20
40
60
80
100
Very Low Low Nominal High Very High
Rating
Perc
ent o
f Pr
ojec
ts
Flight Projects
0
20
40
60
80
100
Very Low Low Nominal High Very High
Rating
Perc
ent o
f Pr
ojec
ts
Ground Embedded Projects
0
20
40
60
80
100
Very Low Low Nominal High Very High
Rating
Perc
ent o
f Pr
ojec
ts
Ground Other Projects
Figure 6: Reliability Distribution
0
20
40
60
80
100
VeryLow
Low Nominal High VeryHigh
ExtraHigh
Rating
Perc
ent o
f Pr
o jec
ts
Flight Projects
0
20
40
60
80
100
VeryLow
Low Nominal High VeryHigh
ExtraHigh
Rating
Perc
ent o
f Pr
o jec
ts
Ground Embedded Projects
0102030405060708090
100
VeryLow
Low Nominal High Very High ExtraHigh
Rating
Perc
ent o
f Pr
ojec
ts
Ground Other Projects
0
20
40
60
80
100
VeryLow
Low Nominal High VeryHigh
ExtraHigh
Rating
Perc
ent o
f Pr
o jec
ts
Flight Projects
0
20
40
60
80
100
VeryLow
Low Nominal High VeryHigh
ExtraHigh
Rating
Perc
ent o
f Pr
o jec
ts
Ground Embedded Projects
0102030405060708090
100
VeryLow
Low Nominal High Very High ExtraHigh
Rating
Perc
ent o
f Pr
ojec
ts
Ground Other Projects
Figure 7: Complexity Distribution
4.1 Analysis Method The process flow in Figure 8 shows the sequence of steps used in this analysis. Only the first pass through is described in this overall section. In the next iterations with refined and/or additional data not all of the steps will be performed. For example the need for calibration was amply demonstrated in the first round of analysis, and the uncalibrated model runs are not
22

USC-CSSE-2008-816
necessary in subsequent data iterations. The sequences of the vendor tool runs will also vary slightly to reflect their recommended best practices.
NASA 94 database
Apply COCOMO 81→COCOMO II
Rosetta Stone
Outlier analysis
Select relevant domain projects
UncalibratedCOCOMO II analysis
COCOMO II calibration (via Costar)
Calibrated COCOMO II analysis
Apply COCOMO II→SEER
Rosetta Stone
Uncalibrated SEER analysis w/ additional factors defaulted
Apply SEER knowledge base settings
SEER analysis with knowledge base settings
Apply COCOMO II→True S
Rosetta Stone
Set additional True S factors for application domain
True S analysis with application domain settings
Additional data
SEER analysis with calibration and refined settings
Consolidated analysis
Update analysis?YNEnd
Start
Not all steps performed on iterations 2-n
SEER-SEM COCOMO II True S
Figure 8: Model Analysis Flow The model performances were evaluated with standard figures-of-merit per the equations below based on comparisons between actual and estimated effort for n projects in a dataset:
Relative Error (RE) = ( Estimated Effort – Actual Effort ) / Actual Effort Magnitude of Relative Error (MRE) = | Estimated Effort – Actual Effort | / Actual Effort Mean Magnitude of relative error (MMRE) = (ΣMRE) / n Root Mean Square (RMS) = ((1/n) Σ (Estimated Effort – Actual Effort)2) ½ Prediction Level PRED(L) = k/n,
where k = the number projects in a set of n projects whose MRE <=L.
23
USC-CSSE-2008-816
Each run consists of a logical group of projects against with estimates are compared to actuals using the above measures. The progressive effects of calibrations and other adjustments are evaluated this way. To help interpret some of the results we also looked at the error distribution for any biases. All the numeric estimated values for each model run are contained in the calibration analysis spreadsheets provided with [USC 2006] for further investigation.
4.2 Outlier Analysis Investigation of the project data and the calibration results indicated a single particular outlier project. Its productivity is way out of bounds, by orders of magnitude, with the rest of the productivity spread. It is also the second smallest project (though the other small projects on its scale are inline with the rest of the productivity distribution). The data reporting is potentially suspect or it may be indicative of a single individual or extremely small team. At very small project sizes the effects of individuals tend to predominate, and this could be an extremely productive and unencumbered individual or small team. On modern NASA projects with increased complexity and size, it is highly unlikely that a single individual will create an entire CSCI. Because of the giant disparity in productivity and these other reasons, subsequent analyses are performed without the outlier in the dataset except where noted otherwise. It does not seem to be representative of projects we wish to estimate. For additional reference [USC 2006] lists all results with the outlier included. The dataset lists size as “PSLOC”. If it is physical SLOC then the size is probably overstated with respect to the COCOMO II standard of logical sources statements. USC has not been able to determine the exact unit of measurements or obtain further context information such as the language. If physical lines were counted then a conversion factor can be used to estimate logical statements. Without that information the current calibrations are predicated on the reported size units (i.e. the A constant is relevant when size is estimated using the same measure as the reported results.)
4.3 COCOMO We calibrated for each embedded domain and the combined embedded flight domains. The results of the COCOMO II calibrations for the combined flight domains are in Figure 9. See [USC 2006] for the corresponding results when the outlier project is included. In order to expand the analysis space, we also assessed COCOMO against embedded ground projects. In that case the calibrated coefficient turned out less than the default COCOMO value. This result can be further explored with additional data or clarifications against the current dataset.
24

USC-CSSE-2008-816
Dataset Name: NASA 94Category: Avionics + ScienceMode: EmbeddedNumber of Projects = 12A = 5.80
Effort Prediction SummaryUncalibrated Calibrated
MMRE 43% 29%RMS 1366.4 460.2PRED(10) 9% 36%PRED(20) 9% 45%PRED(30) 18% 64%PRED(40) 36% 73%
Calibrated Effort Estimates vs. Actuals
100
1000
10000
100 1000 10000
Estimated Effort (Person-months)
Act
ual E
ffort
(Per
son-
mon
ths)
Figure 9: COCOMO Results for Embedded Flight Projects (Avionics + Science)
4.4 SEER
The first SEER-SEM runs for uncalibrated and initial knowledge base settings were a “blind” study whereby actuals were not used. The Rosetta Stone was used to map to SEER-SEM inputs and used for the uncalibrated run. No further factors were touched. In the second round USC chose three knowledge base settings without extensive knowledge of SEER-SEM. The previous COCOMO-derived factors overrode any conflicts in the settings. In the most recent iteration, SEER-SEM experts made further settings in the knowledge bases, with use of actuals for calibration, and including the outlier project.
4.5 True S
25

USC-CSSE-2008-816
These results for True S represent the first round of applying an expert-determined mapping to True S without calibration. Table 12 shows the True S project settings. There are still additional calibrations being done with True S and those results will be provided later.
26

USC-CSSE-2008-816
Table 12: True S Project Settings
Project Operational Specification IPT Use CMM
Design for
Reuse
Hardware Platform
Availability(Assembly
Input) Analysts Programmers Team ConProduct
FamPlatform
FamExp. Lang.
Design, Code and
Test Tools
Multiple Site Development
Start and End Date SLOC
81 Unmanned Spac NA IPT Casual and Team Some Success CMM 1 nominal na Unstable Capable Capable 5-10% 2-5 yrs <2 yrs <2 yrs nominal all Not 32,000 82 Unmanned Spac NA IPT Casual and Team Some Success CMM 1 nominal na Unstable Highly Cap Highly Cap 5-10% 5-10 yrs 5-10 yrs 5-10 yrs nominal set Enough 53,000 84 Unmanned Spac NA IPT Casual and Team Some Success CMM 1 nominal na Very Stable Expert Expert 5-10% > 10 yrs novice novice high at Time 41,000
89 Unmanned Spac NA IPT Casual and Team Some Success CMM 1 nominal na Very Stable Expert Expert 5-10% > 10 yrs novice novice high Entire for 24,000 91 Unmanned Spac NA IPT Casual and Team Some Success CMM 1 nominal na Mod. Stable Highly Cap Highly Cap 5-10% 5-10 yrs 5-10 yrs 5-10 yrs nominal Team Analysis 165,000 93 Unmanned Spac NA IPT Casual and Team Some Success CMM 1 nominal na Mod. Stable Highly Cap Highly Cap 5-10% 5-10 yrs 5-10 yrs 5-10 yrs nominal in of 70,000 94 Unmanned Spac NA IPT Casual and Team Some Success CMM 1 nominal na Mod. Stable Highly Cap Highly Cap 5-10% 5-10 yrs 5-10 yrs 5-10 yrs nominal Same Schedule 50,000 97 Unmanned Spac NA IPT Casual and Team Some Success CMM 1 nominal na Very Stable Highly Cap Capable 5-10% <2 yrs novice <2 yrs high Place 7,250 98 Unmanned Spac NA IPT Casual and Team Some Success CMM 1 nominal na Mod. Stable Highly Cap Highly Cap 5-10% 5-10 yrs 5-10 yrs 5-10 yrs nominal 233,000 99 Unmanned Spac NA IPT Casual and Team Some Success CMM 1 nominal na Unstable Capable Capable 5-10% 2-5 yrs <2 yrs <2 yrs nominal 16,300
100 Unmanned Spac NA IPT Casual and Team Some Success CMM 1 nominal na Unstable Capable Capable 5-10% 2-5 yrs <2 yrs <2 yrs nominal 6,200 -
92 Military Airpborne NA IPT Casual and Team Some Success CMM 1 nominal na Mod. Stable Highly Cap Highly Cap 5-10% 5-10 yrs 5-10 yrs 5-10 yrs nominal 65,000 101 Military Airpborne NA IPT Casual and Team Some Success CMM 1 nominal na Mod. Stable Capable Capable 5-10% 2-5 yrs 2-5 yrs 2-5 yrs nominal 3,000
7.866.27.2
7.2
7.867.17.1
7.867.867.867.2
0.950.880.88
0.88
0.95
0.950.950.950.88
Development Team ComplexityOrganizational Productivity
0.82
Functional Complexity
7.867.1
Project Constraints
0.950.820.82
27

USC-CSSE-2008-816
Some data uncertainties may impact True S like the other models. The True S results may need adjustment for the PSLOC size definition. There are also unknowns about the Operational Specification used. Some of the projects may be manned space, but without that knowledge subsystems cannot be assigned to manned or unmanned. The level of specification may also not be consistent and homogeneous on a spacecraft. 5. Effects of Calibration and Knowledge Bases The effects of calibration, knowledge base settings and other adjustments are evaluated with the respective models.
5.1 COCOMO II The improvement effects of calibration for the different project subgroups are clearly seen in the performance measures. It is evident that MMRE improves in Figure 10 for all cases and that PRED(40) also improves in each case shown in Figure 11.
0
10
20
30
40
50
60
70
80
90
100
Flight AvionicsEmbedded
Flight ScienceEmbedded
Flight (All) Ground Embedded
Project Types
Perc
ent
UncalibratedCalibrated
Figure 10: COCOMO II MMRE Calibration Effect
28
USC-CSSE-2008-816
0
10
20
30
40
50
60
70
80
90
100
Flight AvionicsEmbedded
Flight ScienceEmbedded
Flight (All) Ground Embedded
Project Types
Perc
ent
UncalibratedCalibrated
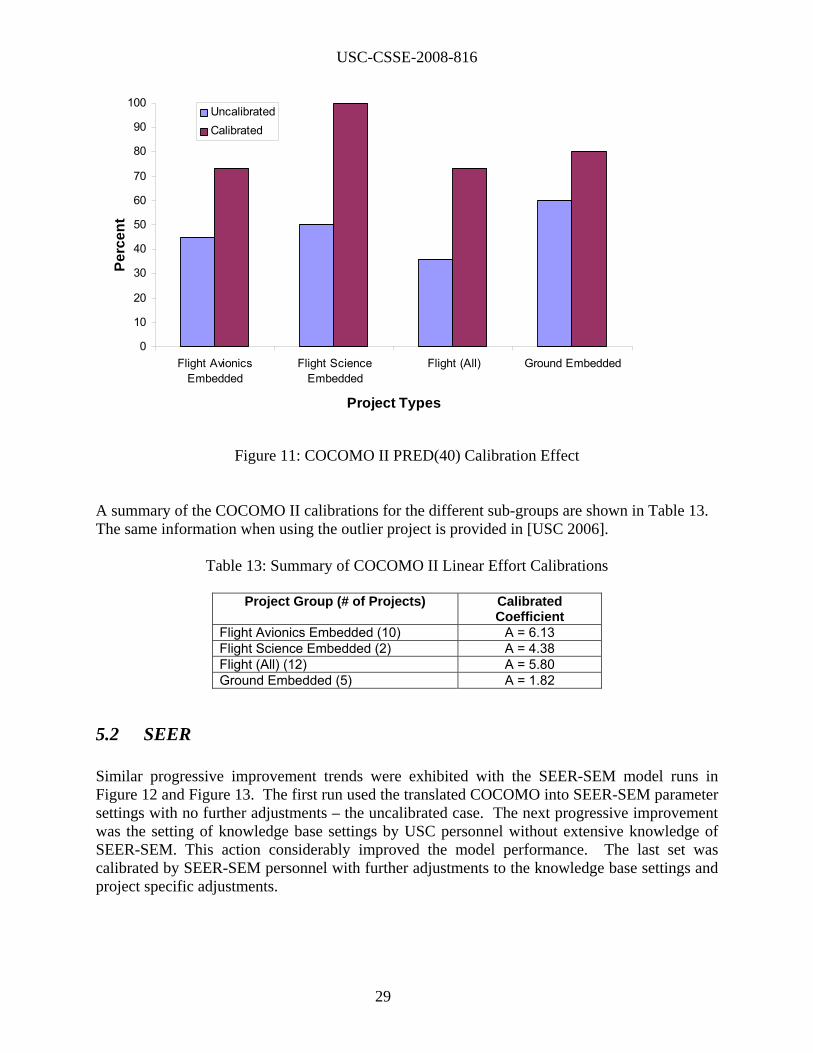
Figure 11: COCOMO II PRED(40) Calibration Effect A summary of the COCOMO II calibrations for the different sub-groups are shown in Table 13. The same information when using the outlier project is provided in [USC 2006].
Table 13: Summary of COCOMO II Linear Effort Calibrations
Project Group (# of Projects) Calibrated Coefficient
Flight Avionics Embedded (10) A = 6.13 Flight Science Embedded (2) A = 4.38 Flight (All) (12) A = 5.80 Ground Embedded (5) A = 1.82
5.2 SEER Similar progressive improvement trends were exhibited with the SEER-SEM model runs in Figure 12 and Figure 13. The first run used the translated COCOMO into SEER-SEM parameter settings with no further adjustments – the uncalibrated case. The next progressive improvement was the setting of knowledge base settings by USC personnel without extensive knowledge of SEER-SEM. This action considerably improved the model performance. The last set was calibrated by SEER-SEM personnel with further adjustments to the knowledge base settings and project specific adjustments.
29

USC-CSSE-2008-816
Flight Avionics Embedded Flight (All)
Project Types
Perc
ent
UncalibratedInitial Knowledge Base SettingsCalibrated and Project-Adjusted
Figure 12: SEER-SEM II MMRE Progressive Adjustment Effects
Flight Avionics Embedded Flight (All)
Project Types
Perc
ent
UncalibratedInitial Knowledge Base SettingsCalibrated and Project-Adjusted
Figure 13: SEER-SEM PRED(40) Progressive Adjustment Effects
One conclusion from the SEER-SEM analysis this is that although statistical calibration helps, it is very important to properly characterize the technical and programmatic characteristics of the software being estimated. The SEER-SEM results, both uncalibrated and calibrated, improved significantly with more accurate information about platform, application, effective size and other parameters. It is suspected performance could be even better, without calibration, with a complete technical description of the software modules and for a "full-up" estimate.
5.3 True S In the True S model the factor Application Type serves as a domain setting, similar to the SEER-SEM Knowledge Base settings. By setting Application Type then other factors are affected including
• Functional Complexity
30

USC-CSSE-2008-816
• Operating Specification • Development Team Productivity • Sizing-related parameters.
True S was handled somewhat differently than SEER-SEM. Instead of choosing a particular application type to preset them, other factors were independently adjusted to represent the detailed project characteristics. The results of the factor adjustments used for input in the True S runs are shown in Table 12.
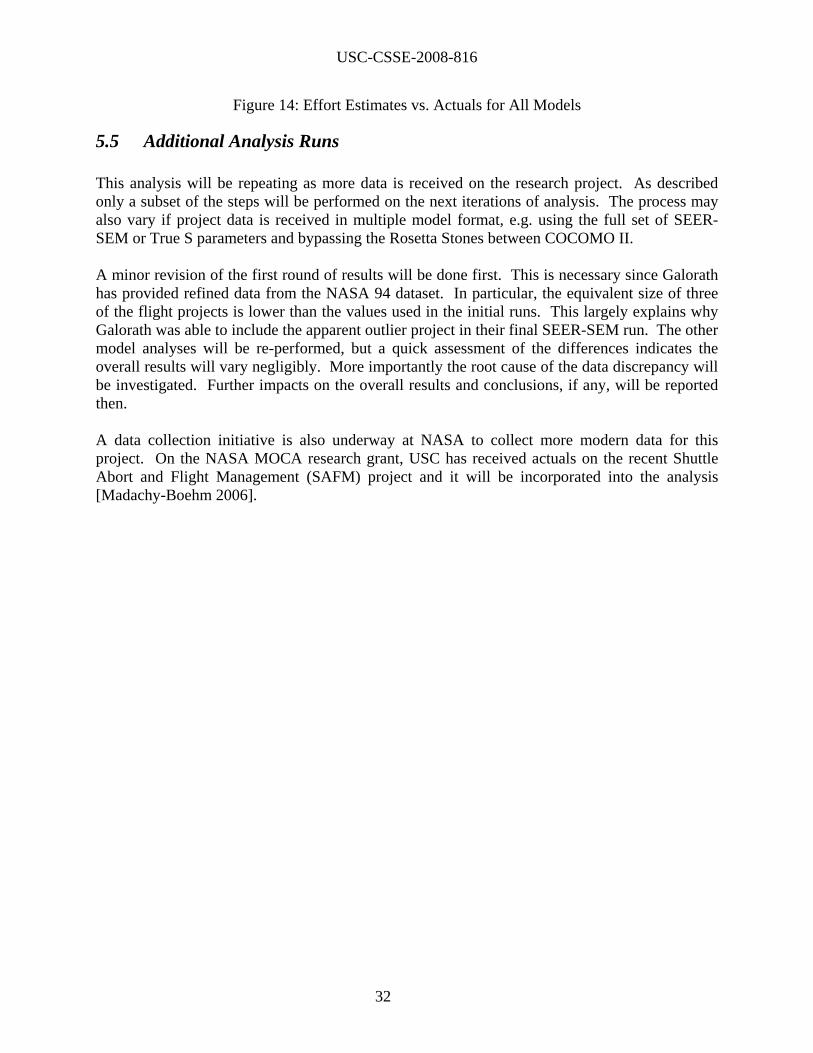
5.4 Model Performance Summaries A summary of the model performances in their last runs (COCOMO calibrated, SEER-SEM with refined knowledge base settings, True S with application domain settings) is shown in Table 14. A scatterplot of the effort estimates vs. actuals is shown in Figure 14.
Table 14: Model Performance Summaries
Model 1 Model 2 Model 3 MMRE 29% 39% 49% RMS 460.2 642.4 613.5 PRED(10) 36% 20% 17% PRED(20) 45% 50% 42% PRED(30) 64% 50% 50% PRED(40) 73% 60% 58%
100
1000
10000
100 1000 10000Actual Effort (Person-months)
Est
imat
ed E
ffort
(P
erso
n-m
onth
s)
Model 1Model 2Model 3
31
USC-CSSE-2008-816
Figure 14: Effort Estimates vs. Actuals for All Models
5.5 Additional Analysis Runs This analysis will be repeating as more data is received on the research project. As described only a subset of the steps will be performed on the next iterations of analysis. The process may also vary if project data is received in multiple model format, e.g. using the full set of SEER-SEM or True S parameters and bypassing the Rosetta Stones between COCOMO II. A minor revision of the first round of results will be done first. This is necessary since Galorath has provided refined data from the NASA 94 dataset. In particular, the equivalent size of three of the flight projects is lower than the values used in the initial runs. This largely explains why Galorath was able to include the apparent outlier project in their final SEER-SEM run. The other model analyses will be re-performed, but a quick assessment of the differences indicates the overall results will vary negligibly. More importantly the root cause of the data discrepancy will be investigated. Further impacts on the overall results and conclusions, if any, will be reported then. A data collection initiative is also underway at NASA to collect more modern data for this project. On the NASA MOCA research grant, USC has received actuals on the recent Shuttle Abort and Flight Management (SAFM) project and it will be incorporated into the analysis [Madachy-Boehm 2006].
32

USC-CSSE-2008-816
6. Conclusions and Future Work This paper has presented an overview of software cost models with a focus on critical flight software. The primary cost models were assessed against a relevant database of NASA and performed well, particularly with the absence of contextual data and potential flaws in the factor transformations. When using the NASA 94 dataset, calibration and knowledge base judgments for the domain improved all model performance versus using default parameter values. This study was performed by persons highly familiar with COCOMO but not necessarily with SEER-SEM or True S. The vendors of these models provided minor support, but do not yet certify or sanction the data nor information contained in this report. Specific vendor concerns include: the study limited to a COCOMO viewpoint only current Rosetta Stones need review and may be weak translators from the original data results not indicative of model performance due to ignored parameters risk and uncertainty were ground ruled out data sanity checking needed.
NASA flight projects are typified by extremely high reliability and complexity. Characterizations of the database projects in terms of these important descriptors provided useful and interesting results. Distributions of factor ratings for complexity and reliability factors showed relevant patterns across the subgroups in the database. It also helped to confirm that the COCOMO factor ratings were done consistently across the projects, and adhere to the COCOMO rating criteria. All models support effort variance due to these factors, but the vendor models provide additional elaborations of these factors and domain-specific defaults. Within the COCOMO II scope and subset of analyses, it can be concluded that the overall embedded flight domain calibration with this data is a linear coefficient A ≅ 6. The value is slightly less for embedded science vs. avionics projects. But the sample size for science projects was extremely small, and more data should be incorporated for a more robust and credible calibration. Successive experiments with the SEER-SEM model illustrated that the model performance measures markedly improved when incorporating knowledge base information for the domains. Simple educated guesses on the knowledge base choices without extensive SEER-SEM knowledge produced far better estimates than strict uncalibrated estimates. The initial uncalibrated runs from COCOMO II and SEER-SEM both underestimated the projects by approximately 50% overall. That is also reflected in the calibrated COCOMO II coefficient being about twice the default (A ≅ 6 vs. A=2.96). For all models (COCOMO, SEER, True S), calibration against the different subgroups exhibited nearly equivalent trends for embedded flight projects. The model performance measures for either individual flight groups (avionics or science) or combined together (avionics plus science)
33
USC-CSSE-2008-816
were about the same and the improvement trends between uncalibrated and calibrated were identical when the outlying project was excluded. Major future thrusts include refining and expanding the project dataset, and updating the COCOMO model(s) for flight applications. The calibrations are all derived with respect to the reported size termed PSLOC (likely to be physical lines). Further investigations to directly capture logical source statements or through the use of conversion factors may yield different calibrations for using COCOMO II with its current size definitions. The vendor models provide more granular factors for the overall effects captured in the COCOMO II Complexity (CPLX) factor. One consideration is to elaborate the current COCOMO definition with more levels of detail specifically interpreted for critical flight project applications. The COCOMO II Required Software Reliability (RELY) factor is also being elaborated for high dependability and security applications, and that research will be brought to bear on the current effort. The COCOMO II and COQUALMO models are being updated on this project for new technologies, IV&V techniques and new mission requirements (e.g. increased reliability for security and safety). Additional project data and Delphi studies are both being used. The revised models will undergo the same analysis and be re-calibrated again for flight projects with the additional data. One option to expand COCOMO II is to embed a knowledge-based capability into the model specifically for NASA projects. An example could be based on the observed reliability and complexity factor distributions. A sub-domain is selected by the user (flight science, flight avionics, ground embedded, etc.) and factor settings are defaulted in the model. This study has been helpful in reducing sources of misinterpretation across the models, and the current set of Rosetta Stones and other model comparisons have provided a usable framework for analysis, but considerably more should be done including: developing two-way and/or multiple-way Rosetta Stones explicit identification of residual sources of uncertainty across models and their estimates
not fully addressable by Rosetta Stones factors unique to some models but not others develop translations between the size input parameter factors address COTS estimation and sizing many-to-many factor mappings partial factor-to-factor mappings similar factors that affect estimates in different ways: linear, multiplicative, exponential,
other imperfections in data: subjective rating scales, code counting, counting of other size
factors, effort/schedule counting, endpoint definitions and interpretations, WBS element definitions and interpretations.
The study participants welcome sponsorship of further joint efforts to pin down sources of uncertainty, and to more explicitly identify the limits to comparing estimates across models.
34
USC-CSSE-2008-816
A more rigorous review of the detailed cost factor Rosetta Stones should be completed. Some of the future work to complete this work rests on the vendors. They will be further reviewing their specific sections and clarifying the USC interpretation of their work breakdown structures, factor interpretations and other aspects. Additional approaches for calibration are also being evaluated. Remaining work on the Rosetta Stones includes elaborating the detailed Rosetta Stone for True S, and rigorous review of all the top-level and detailed Rosetta Stones. The analysis process can also be improved on several fronts. The recommended sequence for vendor tool usage is to first set knowledge bases before COCOMO translation parameter setting. It is also desirable to capture estimate inputs in all three model formats, and try different translation directionalities. This analysis has also identified additional information on the projects that could be useful. The vendors are involved in this aspect and the model analyses are likely to be re-iterated for several reasons including additional or refined data assumptions. In practice no one model should be preferred over all others. The key to arriving at sound estimates is to use a variety of methods and tools and then investigate the reasons why the estimates provided by one might differ significantly from those provided by another. If the practitioner can explain such differences to a reasonable level of satisfaction, then it is likely that he or she has a good grasp of the factors which are driving the costs of the project at hand. He/she will be better equipped to support the project planning and control functions performed by management. Future work involves repeating the analysis with updated calibrations, revised domain settings, improved models and new data. It is highly desirable to incorporate more recent NASA project data in the cost model analyses. The MOCA project collected actuals on the SAFM project, more data is being solicited and it all will be used to update the analysis and support research demands for current data. Other data concerns include the units of size measurement in the NASA 94 dataset, which should be investigated for reasons previously stated in the analyses. With modern and more comprehensive data, COCOMO II and the other models can be further improved and tailored as necessary for NASA project usage.
6.1 References [Boehm 1981] Boehm B., Software Engineering Economics. Englewood Cliffs, NJ, Prentice-Hall, 1981 [Boehm et al. 2000] Boehm B., Abts C., Brown W., Chulani S., Clark B., Horowitz E., Madachy R., Reifer D., Steece B., Software Cost Estimation with COCOMO II, Prentice-Hall, 2000 [Boehm et al. 2000b] Boehm B, Abts C, Chulani S, “Software Development Cost Estimation Approaches – A Survey”, USC-CSE-00-505, 2000
35

USC-CSSE-2008-816
[Boehm et al. 2004] Boehm B, Bhuta J, Garlan D, Gradman E, Huang L, Lam A, Madachy R, Medvidovic N, Meyer K, Meyers S, Perez G, Reinholtz KL, Roshandel R, Rouquette N, “Using Empirical Testbeds to Accelerate Technology Maturity and Transition: The SCRover Experience”, Proceedings of the 2004 International Symposium on Empirical Software Engineering, IEEE Computer Society, 2004 [Galorath 2005] Galorath Inc., SEER-SEM User Manual, 2005 [Galorath-Evans 2006] Galorath D, Evans M, Software Sizing, Estimation, and Risk Management, Auerbach Publications, 2006 [Jensen 1983] Jensen R, “An Improved Macrolevel Software Development Resource Estimation Model”, Proceedings of 5th ISPA Conference, 1983 [Lum et al. 2001] Lum K, Powell J, Hihn J, “Validation of Spacecraft Software Cost Estimation Models for Flight and Ground Systems”, JPL Report, 2001 [Madachy 1997] Madachy R, Heuristic Risk Assessment Using Cost Factors”, IEEE Software, May 1997 [Madachy-Boehm 2006] Madachy R, Boehm B, “A Model of Options and Costs for Reliable Autonomy (MOCA) Final Report”, reported submitted to NASA for USRA contract #4481, 2006 [Park 1988] Park R, “The Central Equations of the PRICE Software Cost Model”, COCOMO User’s Group Meeting, 1988 [PRICE 2005] PRICE Systems, TRUE S User Manual, 2005 [Reifer et al. 1999] Reifer D, Boehm B, Chulani S, “The Rosetta Stone - Making COCOMO 81 Estimates Work with COCOMO II”, Crosstalk, 1999 [USC-CSE 2006] USC Center for Software Engineering, Model Comparison Report, Report to NASA AMES, Draft Version, July 2006 7. Acknowledgements This work is supported by the NASA AMES Research Center Cooperative Agreement No. NNA06CB29A for Software Risk Advisory Tools. Our colleagues helping on this research at NASA include Mike Lowry, Julian Richardson and Tim Menzies. It also would not have been possible without the contributions of other colleagues and generous organizations. We particularly thank Galorath Inc. and PRICE Systems for providing us with their tool information and people. Thanks are due to all the people mentioned below. • Tim Hohmann at Galorath Inc. helped as our primary technical contact for SEER-SEM
support. Additional assistance and support from Galorath Inc. came from Dan Galorath, Karen McRitchie and Bob Hunt.
36

USC-CSSE-2008-816
• David Seaver was our primary contact and provided technical support from PRICE Systems, and James Otte also provided early assistance.
• Jairus Hihn and Sherry Stukes from NASA JPL supported this analysis. • Dan Ligett from Softstar Systems graciously provided a calibration spreadsheet that was
modified for this research.
37
USC-CSSE-2008-816
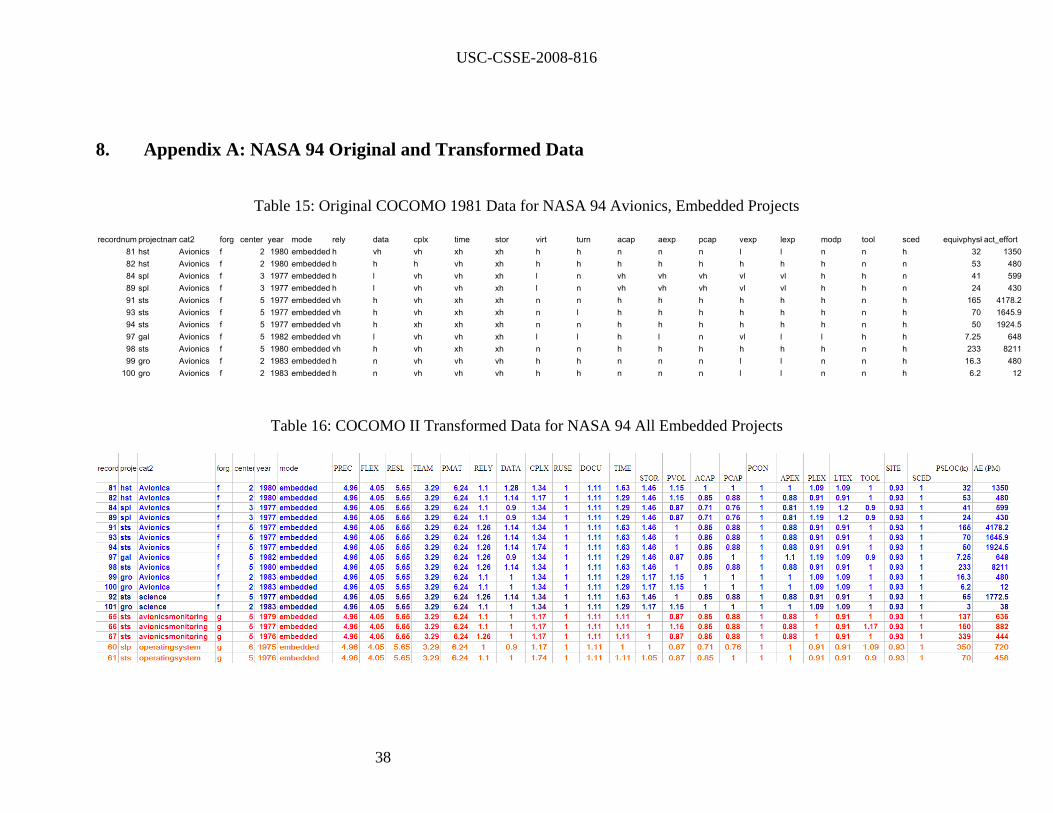
8. Appendix A: NASA 94 Original and Transformed Data
Table 15: Original COCOMO 1981 Data for NASA 94 Avionics, Embedded Projects recordnum projectnamcat2 forg center year mode rely data cplx time stor virt turn acap aexp pcap vexp lexp modp tool sced equivphyskact_effort
81 hst Avionics f 2 1980 embedded h vh vh xh xh h h n n n l l n n h 32 135082 hst Avionics f 2 1980 embedded h h h vh xh h h h h h h h h n n 53 48084 spl Avionics f 3 1977 embedded h l vh vh xh l n vh vh vh vl vl h h n 41 59989 spl Avionics f 3 1977 embedded h l vh vh xh l n vh vh vh vl vl h h n 24 43091 sts Avionics f 5 1977 embedded vh h vh xh xh n n h h h h h h n h 165 4178.293 sts Avionics f 5 1977 embedded vh h vh xh xh n l h h h h h h n h 70 1645.994 sts Avionics f 5 1977 embedded vh h xh xh xh n n h h h h h h n h 50 1924.597 gal Avionics f 5 1982 embedded vh l vh vh xh l l h l n vl l l h h 7.25 64898 sts Avionics f 5 1980 embedded vh h vh xh xh n n h h h h h h n h 233 821199 gro Avionics f 2 1983 embedded h n vh vh vh h h n n n l l n n h 16.3 480100 gro Avionics f 2 1983 embedded h n vh vh vh h h n n n l l n n h 6.2 12
Table 16: COCOMO II Transformed Data for NASA 94 All Embedded Projects
38

USC-CSSE-2008-816
39