comparative analysis of company’s
TRANSCRIPT

i
COMPARATIVE ANALYSIS OF COMPANY’S
FINANCIAL PERFORMANCE OF PRE AND POST
MERGER
(Case Study: PT Bank CIMB Niaga Tbk year 2002 – 2007 and 2009
- 2014)
By
Vany Hummaira Ziqra
ID No. 014201100076
A Skripsi presented to the
Faculty of Business President University
in partial fulfillment of the requirements for
Bachelor Degree in Economics in Management
February 2015

ii
SKRIPSI ADVISER
RECOMMENDATION LETTER
This skripsi entitled “COMPARATIVE ANALYSIS OF
COMPANY’S FINANCIAL PERFORMANCE OF PRE AND POST
MERGER (Case Study: PT Bank CIMB Niaga Tbk year 2002 - 2007
and 2009 -2014)” prepared and submitted by Vany Hummaira Ziqra in
partial fulfillment of the requirements for the degree of Bachelor in the
Faculty of Business has been reviewed and found to have satisfied the
requirements for a Skripsi fit to be examined. I therefore recommend this
Skripsi for Oral Defense.
Cikarang, Indonesia, January 21st 2015
Acknowledged by, Recommended by,
Vinsensius Jajat Kristanto SE., MM., MBA. Purwanto, ST, MM
Head of Management Study Program Advisor

iii
DECLARATION OF ORIGINALITY
I declare that the Skripsi, entitled “COMPARATIVE ANALYSIS OF
COMPANY’S FINANCIAL PERFORMANCE OF PRE AND POST
MERGER (Case Study: PT Bank CIMB Niaga Tbk year 2002 - 2007
and 2009 -2014)” is to the best of my knowledge and belief, an original
piece of work that has not been submitted, either in whole or in part, to
another university to obtain a degree.
Cikarang, Indonesia, February 3rd 2015
VANY HUMMAIRA ZIQRA

iv
PANEL OF EXAMINERS
APPROVAL SHEET
The Panel of Examiners declares that the Skripsi entitled
“COMPARATIVE ANALYSIS OF COMPANY’S FINANCIAL
PERFORMANCE OF PRE AND POST MERGER (Case Study: PT
Bank CIMB Niaga Tbk year 2002 - 2007 and 2009 -2014)” that was
submitted by Vany Hummaira Ziqra majoring in Management from the
Faculty of Business was assessed and approved to have passed the Oral
Examinations on February 3rd
, 2015
Ir. Yunita Ismail Masjud, M.Si
Chair – Panel of Examiners
Filda Rahmiati, BBA., MBA
Examiner 1
Purwanto, ST, MM
Examiner 2

v
ABSTRACT
This research aims to identify and find out the comparison of financial performance
of Bank CIMB Niaga of pre and post merger. Through purposive sampling with
secondary data from Bank CIMB Niaga financial statement, this research has got 22
samples from pre merger period which is on 2002 – 2007 as well as 22 samples from
pre merger period which is on 2009 – 2014 with 5 indicators of financial ratios which
are CAR, NPL, OER, LDR and ROE. This research uses quantitative research which
using some analysis methods such as descriptive statistic, normality testing by using
Kolmogorov-Smirnov test method, and hypothesis testing by using paired sample t-
test. The result of this study is that CAR and LDR’s post merger is significant higher
than pre merger then NPL, OER, and ROE’s post merger is lower than pre merger.
Among those 5 variables, LDR is having the most significant difference as it has the
highest of difference of average which is 9.8%. Compared based on the performance
of both periods, CAR, NPL, OER, and LDR of post merger has better performance
rather than in pre merger period. Conversely, ROE is not showing better performance
in post merger period.
Keywords: Pre Merger, Post Merger, CAR, NPL, OER, LDR, ROE

vi
ACKNOWLEDGE
Alhamdulillah all praise and gratitude to Allah SWT, the Blessed One, the Worthy
One, the fully Enlightened One. Shalawat and Salam are poured out to the Great
Prophet Rasulullah Muhammad SAW along with family, friends and followers until
the end of time.
This is the happiest moment after struggling with my undergraduate research and
obtaining my bachelor degree at President University. In this preface, the researcher
would like to express special sincere gratitude to:
a. My beloved Mom and Dad. Hard to describe my gratitude to both of you in
words, I am so glad to have parents like mom and dad who has been very
supportive and care as well as never stop to pray for all the time. I love you so
much.
b. My beloved brothers who cares a lot.
c. My Skripsi adviser, Mr. Purwanto. Thank you so much for your guidance,
attention, patience, and kindness for the betterment of the thesis.
d. To my beloved Banking and Finance 2011, especially to Agunda
Fistariansyah, Irlia Arni, Olga Arthaloka, Jessica Tiur, Novia Utami, Ety,
Raeny TJ, Zikra Azhara, Maria Octaviany, Vanny Christina, Tifani Indah,
Helmy Zulfa, Haniel Imanuel, Yorico Lampus, Nguyen Tuan Anh, Fellucia,
Ikhwan Aditya, and others. Thanks for being best college mates, all sharing
and caring. See you on top guys!
e. To my beloved best mates, Ryanda Rusadi, Erdy Anugrah, Tiara Anisa,
Firdha Aulia who always give huge support, love and care.
f. To Bosses and Colleagues in Citibank who support and make me keep spirit
in finishing this Skripsi. Thanks for caring and supporting during this hard
time.
vii
g. To Triputra Group as well as Triputra scholarship friends who support me in
obtaining the bachelor degree.
h. To all lecturers and staff of President University for supporting the research in
doing this Skripsi.
Without them, the researcher will not able to through the hard time in college life
until finish this research. Last but not least, the researcher would like to apologize for
being unable to mention other contributing person’s name one by one. Thanks for
you all.

viii
TABLE OF CONTENTS
SKRIPSI ADVISER RECOMMENDATION LETTER……………..……………… i
DECLARATION OF ORIGINALITY……………………………………………… ii
PANEL OF EXAMINERS APPROVAL SHEET………………………………...... iii
ABSTRACT……...………………………………………………………….……… iv
ACKNOWLEDGE .…………………………………………………………….….... v
TABLE OF CONTENTS……………………………………………………..…….. vi
LIST OF TABLES...................................................................................................... ix
LIST OF FIGURES ....….……………………………………………………..….…. x
LIST OF ACRONYMS ..........…………………………………………………..….. xi
CHAPTER I: INTRODUCTION……………………………………………………..1
1.1 Background of Study.…………………………………………………………1
1.2 Problem Identification...……………………………………………………... 8
1.3 Statement of Problem.……………...………………………………………... 8
1.4 Research Objective..……………...………………………………………….. 9
1.5 Research Limitation.…..……………………………………………………. 10
1.6 Definition of Terms.…...……………………………………………..…….. 10
1.7 Benefit of the Study.………………………………………….………...…... 11
CHAPTER II: LITERATURE REVIEW……………………………………………13
2.1 Theoretical Review.………...…………………………………...………….. 13
2.1.1 Bank.…..……………………………………...………………….…. 13

ix
2.1.2 Single Presence Policy……………………...……………………… 15
2.1.3 Merger.…...………………………………………………………… 16
2.1.4 Financial Performance.…………………………………………….. 28
2.1.5 The influence of merger towards the improvement of company’s
financial statement.………………………………………………..... 29
2.1.6 Financial ratios analysis.……….…………………………………... 30
2.2 Previous Research.………….…………………………………………….... 35
2.3 Theoretical Framework..…………………………………………………… 38
2.4 Hypothesis……………………………………………………….…………. 40
CHAPTER III: RESEARCH METHODOLOGY…………………………………...41
3.1 Research Method………………………………………….………………... 41
3.2 Research Framework.………………………………………………………. 42
3.3 Research of Data.……………………………………………….………....... 43
3.4 Sampling Design………………………………………………….………... 44
3.5 Operational Definition………………………………………….………….... 46
3.6 Research Instruments.………………………………………………………. 47
3.7 Method of Data Analysis.………………………………………………..…. 48
3.7.1 Descriptive statistic.……..………………………………………….. 48
3.7.2 Normality testing.…………..………………………………………. 48
3.7.3 Hypothesis Testing………………………………………………….. 49
3.7.4 Paired Sample t test.…….………………………………………….. 49
CHAPTER IV: ANALYSIS OF DATA AND INTERPRETATION OF RESULT...52
4.1 Company Profile……………………………………………………..……... 52
4.2 Data Result Analysis…………………………………………………..…… 55

x
4.2.1 Object statistical description……………………………………..… 55
4.2.2 Descriptive statistics of research variable.……….…….……………. 67
4.2.3 Normality testing.………………………………..…….…………… 70
4.2.4 Hypothesis testing.………………………………………………….. 72
4.2.5 Paired sample t test.………………………………………………… 72
4.3 Interpretation of Result.…………………......…………………………….... 77
4.3.1 CAR’s performance of post merger is significant higher than pre
merger...…………………………………………………………...... 77
4.3.2 NPL’s performance of post merger is significant lower than pre
merger..........................................................................................…... 78
4.3.3 OER’s performance of post merger is significant lower than pre
merger..........................................................................................…... 78
4.3.4 LDR’s performance of post merger is significant higher than pre
merger..........................................................................................…... 79
4.3.5 ROE’s performance of post merger is significant higher than pre
merger………………………………………………………......…... 79
4.3.6 The most difference of ratio in pre and post merger.……………..... 81
4.3.7 The performance of Bank CIMB Niaga of post merger.……………82
CHAPTER V: CONCLUSION AND RECOMMENDATION……………………. 83
5.1 Conclusion………………………………………………………………….. 83
5.2 Recommendation…………………………………………………………… 86
REFERENCES…………………………………………………………………....... 87
APPENDICES………………………………………………………………………. 92

xi
LIST OF TABLES
Table 3.1 Sample Size Calculation….………………………………….………45
Table 3.2 Operational Definitions and Variable………………...……………..46
Table 4.1 CAR Data in Percentage.………………………………..………......56
Table 4.2 NPL Data in Percentage.………………………………..……….......58
Table 4.3 OER Data in Percentage.………………………………..……….......61
Table 4.4 LDR Data in Percentage.………………………………..……….......63
Table 4.5 ROE Data in Percentage.………………………………..……….......65
Table 4.6 Pre merger descriptive analysis.………………………..………........67
Table 4.7 Post merger descriptive analysis.………………………..…………..69
Table 4.8 Pre merger One-sample Kolmogorov-Smirnov test.………………..70
Table 4.9 Post merger One-sample Kolmogorov-Smirnov test.…..…………..70
Table 4.10 CAR Paired sample test……………………………………………. 73
Table 4.11 NPL Paired sample test…………………………………………….. 74
Table 4.12 OER Paired sample test…………………………………………….. 75
Table 4.13 LDR Paired sample test…………………………………………….. 76
Table 4.14 ROE Paired sample test…………………………………………….. 77
Table 4.15 Summary of hypothesis result……………………………..………...78

xii
LIST OF FIGURES
Figure 1.1 Transition logo of Bank Niaga and Lippo Bank become Bank CIMB
Niaga………………………………………………………………… 5
Figure 1.2 Bank CIMB Niaga Position in Banking Industry of Pre Merger..........5
Figure 1.3 Bank CIMB Niaga Position in Banking Industry of Post Merger…....6
Figure 2.1 Merger illustration...………………………………………………….18
Figure 2.2 Acquisition Illustration………………………………..……...….…...19
Figure 2.3 Consolidation Illustration………………..…………………...………..20
Figure 2.4 Theoretical Framework...………………………………………………..38
Figure 3.1 Research Framework……………………………………….…..….42
Figure 4.1 Merger Implementation of Bank Niaga and Lippo Bank …...…….....54
Figure 4.2 CAR Performance of PT Bank CIMB Niaga…………………….….58
Figure 4.3 NPL Performance of PT Bank CIMB Niaga…………………….…..60
Figure 4.4 OER Performance of PT Bank CIMB Niaga…………………….….62
Figure 4.5 LDR Performance of PT Bank CIMB Niaga…………………….….64
Figure 4.6 ROE Performance of PT Bank CIMB Niaga………………………..66

xiii
LIST OF ACRONYMS
API = Arsitektur Perbankan Indonesia
BCHB = Bumiputera-Commerce Holdings Berhard
BPPN = Badan Penyehatan Perbankan Nasional
CAHB = Commerce Asset Holding Berhard
CAR = Capital Adequacy Ratio
DPNP = Direktur Direktorat Penelitian dan Pengaturan Perbankan
IMF = International Monetary Funds
LDR = Loan to Deposit Ratio
LOI = Letter of Intent
NPL = Non Performing Loan
OER = Operating Efficiency Ratio
PBI = Peraturan Bank Indonesia
PSAK = Pernyataan Standar Akuntansi Keuangan
ROE = Return on Equity
SE = Surat Edaran
SME = Small Medium Enterprise
SPP = Single presence Policy
TDF = Third Party Funds

1
CHAPTER I
INTRODUCTION
1.1 Background of Study
The existence of bank is very important in supporting and improving the economy of
society since almost every economy transaction in the community must be related to
the bank. According to Indonesian Law No. 10 of 1988 in article 1 point 2 about
banking, bank is the business entity which gathers funds from society in the form of
saving and channels it to society in the form of credit and other forms in order to
increase the people’s livelihood.
The history also shows the economic development was in line with the development
of banking institutions. According to article 4 year 1992, banking industry has an
active role in advancing the economy of a country. Bank which serves to transmit the
fund in the form of credits to the community help the provision of venture capital so
it can move the real sector. The better the real sector, it will affect to on the rising
national income.
The development of economic growth requires the existence of competing banks to
develop strategies in order to continue to grow and maintain its presence in the
current era of globalization. This effort is done so that the existing banks are not
returning crash as happened in 1997during the financial crisis in Asia which also
affect to Indonesian economy. Indonesia became the most devastated country since
this crisis does not only affect to the economic but also significantly affect to
political system and social situation in Indonesia (Indonesia-investments,2011).
The financial crisis in 1997 also resulted in the decline of the banking sector then
resulting in the government was forced to do tightening liquidity. These conditions
led to a crisis of confidence community against national banks, especially after the

2
revocation of licenses 16 banks on November 1st, 1997. This impact is very bad,
especially triggered the depreciation of confidence in the banking system. As a
manifestation of the crisis of confidence, withdrawals occurred on a large scale.
As a result, many banks are experiencing big liquidity problems (mismatch),
followed by the scarcity of liquidity in the economy as a whole (liquidity crunch).
The situation is exacerbated by the soaring interest rates Interbank Money Market
(Interbank) up to 300% per year. However, actually the liquidation action was
conducted to avoid the spread of banking crisis (systematic risk) and the magnitude
of risk borne by the community (economic cost). Besides that, the liquidation
decision is also the evaluation result and IMF recommendation which written on
Letter of Intent (LoI) between government and IMF on October 31st, 1997 (Bank
Indonesia).
Reflecting to bad experience in financial crisis occurred at 1997 and 1998 which also
resulted in decline of banking, so the strong national banking fundamental is
extremely needed. These things are supported also by Bank Indonesia as the central
bank which issues the Indonesian Banking Architecture (API) which a basic
framework of the Indonesian banking that is comprehensive and gives direction,
shape, and the structure of banking industry for a span of five to ten years into the
future. This policy based on the vision of a healthy banking system in order to create
strong and efficient financial system stability to help drive the growth of national
economy. That thing is done in order to strengthen the internal condition of the
national banking, realize the complete infrastructure and support the creation of a
healthy banking industry. API has six strong pillars which have to be owned by
healthy, strong and efficient banking system which are healthy banking structure,
effective regulatory system, effective and independent oversight system, strong
banking industry, adequate supporting infrastructure, and consumer protection
(Benny, 2007).

3
In order to implement the concept of API, according to Burhanudin Abdullah (2006)
on his book state that in strengthening of Pillar I of the national banking structure and
pillar III, the increasing effectiveness of the system of banking supervision in an
independent and effective, Bank Indonesia as the central bank as well as the
supervisor issued a policy called the policy package in October 2006. One of the
policy package in October 2006, known as Pakto 2006 was the single presence policy
(SPP). SPP is regulated in Bank Indonesia Regulation No. 8/16 / PBI / 2006 dated
October 5, 2006, then set in regulation of Bank Indonesia policy No. 9/12 / PBI /
2006 on article 1, paragraph 2, which states that SPP is a condition where a party just
become the controlling shareholder of the bank.
In addition, SPP also caused by the free trade system which has brought significant
effects to economy system in Indonesia, one of the effects is foreign investors easier
to conduct business transactions in Indonesia one of them is through banking
industry. Based on these conditions, here is the role of SPP in helping Bank
Indonesia to oversee the commercial bank and reduce the number of banks in
Indonesia. Decreasing the number of banks in Indonesia can improve the
effectiveness of supervision of Bank Indonesia. By SPP also, it implies the
controlling shareholders who have a controlling stake of more than one bank have to
choose whether to do the divestiture, merger, or form a bank of holding company.
The policy affected to Bank CIMB Niagawhich the result of Bank Niaga and Lippo
Bank’s merger. The Government of Republic of Indonesia for some time has ever
been a majority shareholder of Bank CIMB Niaga current financial crisis in the late
1990s. In November 2002, Commerce Asset-Holding Berhard (CAHB), now known
as CIMB Group Holdings Berhard (CIMB Group Holdings), acquired a majority
share of the Commercial Bank Restructuring Agency (BPPN). In August 2007, the
entire ownership is migrated to CIMB Group as part of an internal reorganization to
consolidate the activities of all subsidiaries of CIMB Group with universal banking
platform.

4
In a separate transaction, Khazanah which is the majority shareholder of CIMB
Group Holdings acquired majority ownership of Lippo Bank on September 30, 2005.
All share ownership is migrated then belong to CIMB Group on 28th October 2008
as part of the same internal reorganization. As the controlling shareholder of Bank
Niaga (via CIMB Group) and Lippo Bank, since 2007 Khazanah looked merger as an
effort that must be taken in order to comply with the SPP which has been set by Bank
Indonesia so that this merger is being the first merger in Indonesia regarding to SPP
Policy (Bank CIMB Niaga, 2009).
Principle permits for Niaga and Lippo bank in conducting the merger already issued
by Halim Alamsyah, as Bank of Indonesia Director of the Banking Research and
Regulation Directorate (DPNP). SPP which released by Bank of Indonesia is in line
with Niaga and Lippo Bank in conducting the merger so that the controlling
shareholders of more than one banks has to hand the business plan by the end of
2007. That business plan options is divided into merger, selling the shares or forming
the holding company. At that moment, more than 93% of Lippo Bank which owned
by Khazanah through BV Santubong Investments and Greatville Pte Ltd while the
indirect ownership on Bank Niaga is 64% through Bumiputera-Commerce Holdings
Berhard (BCHB) (Antara, 2008).
Bank Niaga and Lippo Bank represent two unique franchises and when combined,
represent one of the more exciting banking sector enterprises in Indonesia. The
merger takes advantage of Bank Niaga’s strong corporate presence and mortgage
niche together with Lippo Bank’s leadership in SME loans and payment processing
system. By combining the strengths of both banks, the merger will result in a bank
well positioned to compete and grow in the increasingly competitive Indonesian
banking environment (Bank CIMB Niaga, 2008).
Niaga and Lippo Bank agree to do merger on June 2nd
, 2008 then those merger banks
also approved by Bank of Indonesia on October 16th
, 2008. The approval was

5
accepted in the form of letter by date of October 15th
, 2008. The merger of both
banks causes PT. Lippo Bank name is missing from Indonesian banking industry
because the asset value owned by Bank Niaga is higher compared with Lippo Bank
so the total asset and liabilities of Lippo Bank is diverted to Bank Niaga and change
the name become Bank CIMB Niaga. This merger is formally announced at Graha
Niaga on November 3rd
, 2008. Thus, then Lippo Bank shares was not listed and
traded anymore at Indonesia Stock Exchange (Harun, 2008).
Figure 1.1 Transition logo of Niaga and Lippo Bank become Bank CIMB Niaga
Source: Bank CIMB Niaga, Merger Process and Achievement Report, January 2009
Figure 1.1 indicates that the new logo of Bank CIMB Niaga is a symbol the merger
result. Bank CIMB Niaga’s management realize that the name of Lippo Bank
resounds with the many activities of Lippo Group, the management deliberated that
the name of the new merged bank should build a new identity to the start of a new
chapter as part of the CIMB Group.
Figure 1.2 Bank CIMB Niaga Position in Banking Industry of Pre
Merger
Source: Bank CIMB Niaga, Merger Process and Achievement Report, January 2009

6
Figure 1.2illustrates the parable of CIMB bank existence that depicted with
combination between Bank Niaga and Lippo bank. Figure above shows that the value
of total asset Bank Niaga of pre merger is on grade 8th
around Rp60.51trillion below
Danamon Bank that has higher assets which has Rp103.46trillion while Lippo Bank
is on 12th
with total asset is Rp39.06trillion. Total asset of Bank CIMB Niaga based
on the figure shows the combination of Niaga and Lippo Bank which has Rp 99.57
trillion pre mergers. The power of Bank Niaga and Lippo Bank places the Bank
CIMB Niaga is on 6th
gradepre merger.
Figure 1.3 Bank CIMB Niaga Position in Banking Industry of Post Merger
Source: Bank CIMB Niaga Merger Process Closing Report, November 2009
Based on picture above, it shows that total asset of Bank CIMB Niaga post merger in
2009 reaches Rp101.8trillion and placed position in 5th
grade after Mandiri Bank,
BCA Bank, BRI Bank and BNI Bank. It shows the increasing of total assets before
merger when Bank CIMB Niaga is on 6th
grade. Total asset experiences a fairly
significant difference before and after merger which shows Bank CIMB Niaga did
great performance and achieved its goals to become the fifth largest bank in
Indonesia in terms of assets as stated by Nazir Razak, Group Chief Executive of
CIMB Group (Buletin Bisnis, 2008).
318,67
228,09 219,64 179,64
103,46 99,57 63,49 57,97 47,22 42,8
Total Asset (Rp Trillion)

7
Merger activities in Indonesia already existed in 1970 which implemented by banks
with aims to strengthen the structure of capital as well as to acquire tax
compensation. In the crisis condition, many companies do merger due to face of
funding problem. However, those activities are not always followed with success.
The percentage of failure also high which is around 50% up to 70% (Cartwight and
Cooper, 1993).
The impact of that merger implementation of course has considerable influence for
internal and external condition of company. One of the impacts which often come up
from the implementation of that merger is on the performance of company. The
impact on the performance of company which should be considered is from its
financial performance.
To assess the success of the company’s financial performance after conducting the
merger can be determined by comparing the financial statement by using financial
ratio as the tools to evaluate the financial performance of the company. Financial
ratios are the analysis tools used to analyze the business and financial performance at
a predetermined time. The financial ratio is used to determine the trends in Industry
which in the end will help the business in improving their activities (Asma Arshad,
2012).
Based on above phenomenon, the researcher interest to do research by analyzing the
merger’s impact of financial performance of bank by using financial ratios which are
Capital Adequacy Ratio (CAR), Non Performing Loan (NPL), Operating Efficiency
Ratio (OER), Loan to Deposit Ratio (LDR) and Return on Equity (ROE)in time
period of 2002 – 2014 quarterly. The title of research which will be analyzed and
discussed is “Comparative Analysis of Company’s Financial Performance of Pre
and Post Merger” (Case Study: PT Bank CIMB Niaga, Tbk year 2002- 2007 and
2009 - 2014).

8
This research will highlight the merger impacts on the financial performance of
organizations and their shareholders. It will be significant importance for the industry
and other firms in the industry to recognize the importance of mergers and impacts
on company’s performance and the synergies achieved through them.
1.2 Problem Identification
Currently, banking industries are experiencing the significant growth, it is evidenced
by many national and international banks contribute to the growth of the banking
industry. To realize the health banking structure as well as restructure the ownership
structure of banks in order to support the effectiveness of bank supervision, Bank
Indonesia issued the regulation No.8/16/PBI/2006 about single ownership of banks in
Indonesia where one party only can be a controlling shareholder in one bank. Merger
is one of ways to meet these conditions. In this research, the researcher focused on
analyzing the comparison on Bank CIMB Niaga financial performance of pre and
post merger. Based on the comparison, the differences of finacial performance after
merger implemented will be carefully identified.
1.3 Statement of Problem
This research is conducted to analyze the merger’s impact of financial performance
of bank. The researcher is using non probability sample to select the object which be
analyze which is Bank CIMB Niaga by comparing the financial ratios such as CAR,
NPL, OER, LDR and ROE in order to find out the comparison of financial
performance especially in post merger activity. Refers to that, the researcher has
constructed problem statements which in this research will be analyzed, which are:
1. Is CAR’s performance of post merger is significant higher than pre merger?
2. Is NPL’s performance of post merger is significant lower than pre merger?
3. Is OER’s performance of post merger is significant lower than pre merger?
4. Is LDR’s performance of post merger is significant higher than pre merger?

9
5. Is ROE’s performance of post merger is significant higher than pre merger?
6. What is the most difference on the financial ratio of Bank CIMB Niaga in pre
and post merger?
7. How is the performance of Bank CIMB Niaga of post merger?
Other performance aspects related to the merger after the implementation of merger
activity is not considered in this research including consolidation (merger that led to
the formation of a new company). Those aspects including the economic and non-
economic aspects such as the impact on technology, taxation, labor, market
expansion, distribution networks, managerial capability, customer satisfaction, and so
on that may be very affected by the implementation of merger.
1.4 Research Objective
Based on the preceding research questions, the research objectives of the study can
be translated as follows:
1. To know if CAR’s performance post merger is significant higher than pre
merger
2. To know if NPL’s performance post merger is significant lower than pre
merger
3. To know if OER’s performance post merger is significant lower than pre
merger
4. To know if LDR’s performance post merger is significant higher than pre
merger
5. To know if ROE’s performance post merger is significant higher than pre
merger
6. To know the most difference on the financial ratio of Bank CIMB Niaga of
pre and post merger
7. To know Bank CIMB Niaga’s performance of post merger

10
1.5 Research Limitation
This research is executed with certain limitation. The limitation put to make the
researcher easier but depth in understanding and analysis, so the beneficial
information can be provided to the readers and researcher-self. A limitation in this
research is regarding to the number of banks that will be chosen as the sample and
also the period of time in analyzing the research, which are:
1. The period will be used for this research is from Q3 2002 – Q2 2014. The
data is separated based on the time of period which is pre and post merger
time. Since merger was occurred in 2008, so the pre merger data will be
obtained from Q3 2002 – Q4 2007 then post merger data will be obtained
from Q1 2009 – Q2 2014.
2. The objects taken by the researcher for this research are commercial banks
which affected by single presence policy and of course listed in IDX, which is
Bank CIMB Niaga. Therefore, the research will focus on merger activity
conducted by Bank CIMB Niaga based on the impact of single presence
policy to get deeply insight of its effect especially in its financial
performance.
3. The indicators will be used are CAR, NPL, OER, LDR and ROE with aims of
this research to find the impact regarding to merger activity conducted by
Bank CIMB Niaga.
1.6 Definition of Term
In this research, some terms are used to strengthen the understanding according to
Investopedia dictionary.
1. CAR is a ratio that shows how much the entire assets banks that contain risks
(credit, equity, precious fibers, the bill other banks) participated financed
from the bank's own capital funds in addition to obtaining funds from sources
outside the bank, such as public funds, loan (debt), and others.

11
2. Financial performance is a subjective measure of how well a firm can use
assets from its primary mode of business and generate revenues. This term is
also used as a general measure of a firm's overall financial health over a given
period of time, and can be used to compare similar firms across the same
industry or to compare industries or sectors in aggregation.
3. LDR is commonly used statistic for assessing a bank's liquidity by dividing
the banks total loans by its total deposits. This number, also known as the
LDR, is expressed as a percentage. If the ratio is too high, it means that banks
might not have enough liquidity to cover any unforeseen fund requirements;
if the ratio is too low, banks may not be earning as much as they could be.
4. Merger is combination of two or more companies, generally by offering the
stockholders of one company securities in the acquiring company in exchange
for the surrender of their stock.
5. NPL is a sum of borrowed money upon which the debtor has not made his or
her scheduled payments for at least 90 days. A nonperforming loan is either
in default or close to being in default.
6. OER is a measurement of bank efficiency ratio of operating expenses to
operating income.
7. ROE is a performance metric that examines how successful a firm's
investment decisions are compared to its debt situations. A negative value
denotes that the firm did not make an optimal decision, because interest
expenses were greater than the amount of returns generated by investments.
1.7 Benefit of the Study
Through this research hopefully could provide benefit, knowledge, information, and
suggestion which can be used for:

12
1. Researcher
To find out deeply about the comparison of the financial performance of a
company pre and post merger which focused on Bank of CIMB Niaga. Then,
to be able to understand in detail how is the function of financial ratios to
measure the financial performance so the research will enrich the knowledge
of researcher about financial matters as the researcher study concentration
which is Banking and Finance.
2. Company and customers
(i) Through this research, the company can find out the comparison of
financial performance of pre and post merger. Then become
references and consideration to the company in choosing the merger
as its strategy to keep its existence and compete with others in this
globalization era.
(ii) As the consideration of the investors to invest their funds in Bank
CIMB Niaga as well as the Investors could determine the prospect of
the investment and reference of company’s image.
3. University students and academics
There are few benefits of the research for university students as well as
academics
This research can be used as the guidance and reference for students as well
as to academics who want to analyze the comparison of financial performance
of Bank CIMB Niaga of pre and post merger.

13
CHAPTER II
LITERATURE REVIEW
2.1 Theoretical Review
2.1.1 Bank
Bank has an important role in economics. The primary role of Bank is to take in
funds (deposits) from those with money, pool them, and lend them to those who need
funds. Banks are intermediaries between depositors (who lend the money to the
bank) and borrowers (to whom the bank lends money). The amount banks pay for
deposits and the income they receive on their loans are both called interest.
1. Definition of bank
Decision letter of Indonesia Finance Ministry No. 792 year 1990 confirms that
bank is an entity with the activities in finance field by collecting and distributing
the funds to the community especially to finance the company’s investment.
Bank is defined as financial institutions with the main activity is to collect funds
from the public and distribute the funds back to the people as well as providing
other banking services (Kasmir, 2008:2).
According to Law No. 10 article 1 year 1988 regarding to the changes in the Law
No. 7 year 1992 about banking is “business entity which collect funds from
community in the form of saving and distribute them to the community in the
form of credit and or others form in order to improve the standard of people
living”.

14
Financial Accounting Standard (PSAK) No. 31 defines that bank is an institution
which acts as a financial intermediary between parties who have surplus of funds
and parties who need the funds, as well as an institution that serves expedite the
payment traffic.
2. Bank Types
According to Banking regulation No. 10 year 1998, Bank can be divided as
follows:
a. Based on the functions
i) Common Bank
Common bank is type of bank that provides the services in kinds of
transaction.
ii) Rural Bank
Rural bank executes the business activities conventionally or based on the
sharia principal which is not provided any services in transaction traffic in
its business activities.
b. Based on the ownership
i) State Bank
State bank is the type of bank which the ownership is belongs to
government in the form of shares.
The state banks in Indonesia such as Bank Mandiri, BRI, BNI and others.
ii) Cooperative Bank
Ownership of the bank's shares is owned by a company incorporated
cooperative. For example: Commercial Cooperative Bank Indonesia
15
iii) National Private Bank
National private bank is type of a bank which the ownership is belongs to
private institution and organization. The national private bank in
Indonesia such as Bank Central Asia (BCA), Danamon, Mega and others.
iv) Foreign Bank
Foreign bank is a type of bank which owned by the multinational
company/groups. In Indonesia, the foreign bank is just like Citibank,
Commonwealth, Bank of America, etc.
2.1.2 Single Presence Policy
Single Presence Policy is condition which only one party as controlling shareholder
at one bank (Benny Soewita, 2008). This policy has objective to achieve a healthy
and strong banking structure, realignment of bank ownership structure as well as to
support the effectiveness of bank supervision. This thing is confirmed by Bank
Indonesia regulation No: 8/16/PBI/2006 article 1, no. 3 which explains the
controlling shareholder is legal entity and or individual or group of business which:
1. Having the bank shares by 25% or more of the issued shares of bank and have
voting rights
2. Having the bank shares less than 25% of the issued shares of bank and have
voting rights but it can be proven that already controlled the bank either
directly or indirectly
The provision regarding to single presence policy is excluded for (Bank Indonesia
regulation No: 8/16/PBI/2006, article 2, paragraph 2):
1. Controlling shareholder in two banks and each of them is conducting the
business activities with different principles, namely conventional and sharia
principles.
2. Controlling shareholder in two banks which one of them is joint venture bank

16
3. Holding company bank, legal entity which is formed and or owned by
controlling shareholder to consolidate and control directly all of bank
activities which is its subsidiaries.
Parties who already became the controlling shareholder on more than one bank are
obligated to do adjustment the ownership structure as follow (Bank Indonesia
regulation No: 8/16/PBI/2006, article 3, paragraph 1):
1. Transferring the part or all of its share to one or more banks under its control
to other parties so that only a part is being part of controlling shareholder in
one bank
2. Do the merger or consolidation of banks which is on its control
3. Forming the holding company by:
a. Establishing new legal entity as holding company bank
b. Designating one of banks under its control as holding company bank
The ownership structure adjustment is done within a period the latest is December
2010. According to the demand of controlling shareholder and banks under his
control, Bank Indonesia is able to give the extension period of ownership structure
adjustment if based on Bank Indonesia the high complexity problem faced by
controlling shareholder or banks under his control because the adjustment of
shareholders cannot be completed with that time period. (Bank Indonesia regulation
No: 8/16/PBI/2006, article 7, paragraph 1 and 2)
2.1.3 Merger
In this globalization era, companies are competing to be the market leader. Strategies
are created to keep maintaining the existence in their industry. One of those strategies
which often found is merger. Merger is the process of two or more companies in
which companies take control will remain standing while the merged entity will
disappear.

17
The parties that still alive or who receives merger called surviving firm or party
whose to issue shares (issuing firm) while companies who stop and scatter after
merger is called merger firm. Surviving firm has larger size due to all of assets and
liabilities of merger firm are transferred to the surviving firm. Merged companies
will leave its legal status as a separate entity and after merger the status changed into
parts (business unit) under surviving firm. Thus, merged firm is unable to act of law
on his own name (Abdul Moin, 2003:6).
According to Scott C. Whitaker (2012), merger is often used as an effort in the
process of merging companies. Merger could be done internally and externally. The
internal merger occurs when the target companies is on the same possession group
while external merger occurs when the target companies is on different possession
group.
1. Difference between merger, acquisition and consolidation
In business is very often found the misunderstanding of defining merger.
Understanding about mergers often in equate with the terms of acquisition which
actually those terms is containing different sense. The other combination of merger is
consolidation.
a. Merger
Regulation of Indonesia government No. 27 year 1998 about merger,
consolidation, and acquisition limited liability companies is defining merger as
follow:
“Merger is legal activity which done by a company or more to merge with
another existing company and then the merging company be liquidated”.
Financial Accounting Standard (PSAK) No. 22 defines that merger is a process of
merger attempt by taking over one or more other companies. After the takeover
occurred so a company that taken over being dissolved or liquidated, so that its

18
existence as a legal entity disappeared, thus its business activities continued by a
company who took over.
The merger will provide synergies to other banks that still keep their existence.
Merger is also one way for the development and growth of the bank. Through the
merger, the banks merge and divide the resources at their disposal to achieve a
common goal. Typically in a merger of the shareholders of the bank who joined
the often remain in the position as co-owners combined entity (Munir Fuady,
2002).
Figure 2.1 Merger illustration
Source: Munir Fuady, 2002
According to several of merger definition above, it can be conclude that merger is
a process of combining two or more companies in which companies take control
will remain standing while the merged entity will disappear.
b. Acquisition
Acquisition is another way of business amalgamation. Company is able to raise
the target company as its subsidiaries, in other words, either the acquiring
company or target company will remain standing (Agus Sartono, 2001).
In the business terms, acquisition can be defined as takeover ownership or control
of the share or assets of an enterprise by another enterprise, and in both
companies who take control or who taken control will be exist as a separate legal
entity (Abdul Moin, 2003).

19
Financial Accounting Standard (PSAK) No. 22 defines that acquisition is the
form of company’s ownership takeover by acquirer so will transfer the control of
acquired entity (acquire). Company’s control which questioned is the power to:
i) Manage the financial and operation policies of the company
ii) Appoint and dismiss the management
iii) Acquire the majority of voting rights in the editorial meeting.
Basically, Acquisition is different with merger since acquisition does not cause
other parties dismissed as legal entity. Companies involved in the acquisition of
juridical still stands and operate independently but has been transferred by the
acquirer. Compared with shareholder of acquirer company, most of target
company’s shareholders will obtain many benefits in the acquisition process.
These things could happen when the tender of takeover, many companies are
participating so the share dealing of company becomes higher.
Figure 2.2 Acquisition Illustration
Source: Munir Fuady, 2002
c. Consolidation
According to regulation of Indonesia government No. 27 year 1998 about merger,
consolidation and acquisition limited liability companies is defining
consolidation as follow:

20
“Consolidation is legal act performed by two or more to consolidate by
forming new company and each of them who are consolidating becomes
dismissed”.
According to Abdul Moin (2007) defines consolidation is legal act which done by
both companies or more to consolidate and each of those company that
consolidate become dismissed”.
Figure 2.3 Consolidation Illustration
Source: Munir Fuady, 2002
2. Types of merger
According to Lawrence J Gitman (2009:766) defines types of merger based on
economic activities that serves to get new technologies, reduces tax payers, expands
the access to distributors, customers, products, purveyors, and creditors. Those types
of mergers are:
a. Horizontal Merger
Horizontal Merger is merger between two or more companies in the same
industry. It occurs between firms who operate in the same space, often as
competitors offering the same good or service.
b. Vertical Merger
Vertical Merger is integration which involving the companies in the
production or operation process. It occurs when two or more firms, operating
at different levels within an industry's supply chain, merge operations. Most

21
often the logic behind the merger is to increase synergies created by merging
firms that would be more efficient operating as one.
c. Conglomerate Merger
Merger between two or more companies which each of them moves in the
unrelated industry. There are two types of conglomerate mergers: pure and
mixed. Pure conglomerate mergers involve firms with nothing in common,
while mixed conglomerate mergers involve firms that are looking for product
extensions or market extensions.
d. Market Extension Merger
Merger which done by two or more companies that have objective to expand
the market. The main purpose of the market extension merger is to make sure
that the merging companies can get access to a bigger market and that ensures
a bigger client base.
e. Product Extension Merger
Merger which done by two or more companies in order to expand the line of
company’s product. It allows the merging companies to group together their
products and get access to a bigger set of consumers. This ensures that they
earn higher profits.
3. Merger motives
According to Lawrence J Gitman (2009:764), merger motives as follow,
a. Growth or Diversification
Company which has objective of market shares growth. Companies can
achieve the same goals in a short time in combining the companies. This
strategy more save on the cost compared with floating production capacity
required.

22
b. Synergy
Merger synergy is economies scale resulted by overhead of the company
combined which lower. The clearer synergy is when the company do merger
with other company in the same field since many of the functions excessive
and employees could be deducted. It could reduce the production cost.
c. Fund Raising
Companies are merging to improve their skills in raising the funds. Company
cannot obtain the funds to have internal expansion, however they can obtain
external funds merger. The objective of this merger allows the funds raised
externally with the lower cost.
d. Increased Managerial Skill or Technology
Company will have good potential that it finds itself cannot fully develop due
to shortage in certain areas of the management or the absence of product
needed or production technology needed. Merger which done to complete the
lack of technology field.
e. Tax Consideration
Tax consideration is one of the key motives to merger. Generally, tax benefits
derived from the fact that one of company has tax loss forward.
f. Increased Ownership Liquidity
The merger of small and big companies can provide smalls business owners
with greater liquidity. This is due to higher selling power associated with a
large company shares.
g. Defense against Takeover
To be more effective, a defensive takeover must create the value for
shareholders and they will realize after the company is merged with other
company.

23
4. Processes of merger
According to Estanol and Jo (2005), there are three stages in doing merger which are,
a. Pre – Merger
This stage is the situation before merger which in this stage, the task of entire
board of directors and management of the two or more companies is
collecting the competent and significant information for the benefit of the
merger of the company so it can happen that the synergy of the merger will be
carried out.
b. Merger
When company decides to do merger, thing to do for the first time in this
stage is adjustment and mutual integrate themselves with their partners, so the
synergy can occurs.
c. Post – Merger
In this stage, there are some steps should be done by company. The first step
is by restructuring which often occurs in merger is the leadership dualism that
will bring bad influence in organization. The second step is by building a new
culture in which this culture can be a combination of both company’s culture
or also can be a completely new culture for the company. The third step is by
smoothing the transition which should be done in this case is to build a
partnership also can be a combined team or mutual cooperation.
5. Factors that determine the success of merger
The success of a merger depends heavily on the accuracy of the analysis and
thorough research on the factors aligning or compatibility between organizations that
will join. Neil M. Kay (1997) in his book, Pattern in Corporate Evolution, stated that
merger and acquisition will be success if among companies will join has a market
and technological links. Robins (2000) in his book, Organizational Behavior,
explained that the compatibility of organizational culture which will join in a merger

24
is often non-economic factors are crucial in supporting the success of merger itself.
While Pringle and Harris (1987) in his book, Essentials of Managerial Finance,
consider that financial performance of merged company is crucial factor should be
considered when two or more companies will join.
a. Factors of markets and marketing
According to Neil Kay (1997), the company can succeed in doing merger if
there is similarity in the market which he described as market linkages. One
of the expected results of merger is synergy generated by increasing the
company access to a new market that has not been touched.
Potential sources in this case are combining the market opportunities by
market share respectively occupied (cross marketing). With a boarder product
line, every company can sell more products to customers of that has been
done. This cross marketing allows each company to increase its revenue very
quickly. Thus, enabling cross selling that will increase the company’s
revenues result of mergers and acquisition. For example, a means of cross
marketing is one of product’s brand powers will give effect to the others
product which generated from the result of merger and acquisition.
The sustainability of company is highly dependent on the positive market
toward what they offer. Even though it has the ability to produce quality
goods or services if market does not have positive response so the company
will not earn profit while profit is fundamental to the survival of a company.
b. Factors of technology
According to Neil Kay (1997), company can execute merger and acquisition
if there is similarity in technology resources and production that he said as
technological linkages. This technological linkage can include the
incorporation of the production process due to the sample process as was the
case in horizontal mergers.

25
The process of product development also can be a means of achieving
synergies of information technology in the organization. When the same
technology used, the potential synergy can be created. By doing merger and
acquisition process in a healthy potential synergies will result the useful
economy of scale and scope. Technology can be defined as the ability of
production and innovation owned by company which is reflected from
qualifications of human resources, skills, and expertise they have, the type of
product they over as well as the capital goods equipment they use.
This is where the policy makers also need to be careful. Do not let the
company resulted from merger and acquisition instead become unproductive
due to technological gap.
c. Factors of culture
Organizational culture is one of non economic factors that really important to
be considered when two or more companies will do merger and acquisition.
In some of merger’s case in companies, the problem of culture is often
become a crucial problem. The difference of cultural backgrounds among
employee can cause the employee are reluctant to cooperate, each are trying
to do something based on the way of method that they have been done for a
long time, to be able to adapt often takes a long time.
Organizational culture is defined by Robins (2000) as shared perceptions
adopted by the members of organization. Schein (1997) stated that the
organizational refers to shared system adopted by the members which
distinguishes the organization from others. While Kotter and Heskett (1992)
explained that in a organization, culture represents the value and how that is
shared by those involved in organization. The value itself viewed as basic
beliefs about what should or should not to be done and what is important and
what is not important to the organization.
26
This difference of culture can cause conflicts. The impact is the cooperation is
hard to created, weak organizational cohesiveness, synergy is not created, the
productivity of company eventually result of mergers and acquisitions as well
be worse than before.
Differences in organizational culture can certainly be resolved, because
culture itself is something that can be changed. But it takes time and ability to
manage the change properly. Therefore prior to mergers and acquisitions
carried out would need to be prepared models of cultural transition that can be
accepted and followed by all components in each company will mergers and
acquisitions.
d. Factors of financial
One of the reasons why mergers and acquisitions is implemented is the
expectation of the synergy through the resources combination of some
company.
From financial sides, this synergy means the ability to generate the profit of
mergers and acquisitions company which greater than the ability if each
company’s earnings before mergers and acquisitions. These synergies that
become the beginning of merger are occurred. These synergies also allow the
company can finance the mergers and acquisitions process as well as able to
give the premium dividend to the shareholders.
The synergy effect of mergers and acquisition is rooted to two activities
which are synergy in operational and financial matters. Operational synergy
can be revenue enhancement and cost reduction.
In practice, effort to increase the revenue is more difficult rather than effort to
reduce the production cost. This is because production cost is more visible
and measurable so easily identified. While synergy in financial thing is
related to the possibility of lower costs of capital gain for the company

27
resulted from merger and acquisition for company rather than before merger
and acquisition is executed.
The planners of mergers and acquisitions are likely to see the reduction of
costs as the main source of operational synergies. This cost reduction is much
more derived from economies of scale which is reduction in the cost per unit
of product generated by the improvement of production volume or company’s
operational scale.
High of the cost per unit of product come due to operational fixed costs which
only generate few outputs. Process which increases the amount of output that
subsequently resulted in a decrease in the cost per unit is usually called
spreading overhead. Another source that can reduce costs is increasing
specialization of labor and management, as well as the use of more efficient
capital goods, which is not possible at low output levels.
6. Advantages and disadvantages of merger
Merger is one common strategy implemented by the company to maintain its
existence in the industry has a lot of advantages, namely: (Abdul Moin, 2003)
a. Obtain the quick cash flow because the product and the market is already
clear
b. Obtain the ease funding or financing because creditor is more confidence with
the company that has been established
c. Obtain the employees who have experienced
d. Obtain the customers who already well established without having pioneered
from the beginning.
e. Obtain well established operational and administrative system
f. Reduce the risk of business failure because it does not need to find the new
customers
g. Save time to enter the new business

28
h. Obtain the infrastructure to achieve the faster growth
However, beside the advantages, mergers also have some disadvantages which are,
a. The process of integration which is not easy
b. Difficulty in determining accurately the value of the target company
c. The cost of expensive consultant
d. The increasing complexity of bureaucracy
e. The coordination cost which is expensive
f. Often demoralize the organization
g. Does not guarantee an increase in the value of the company
h. Does not guarantee an increase in shareholders’ wealth
2.1.4 Financial Performance
One of methods to assess the success of company is by looking at its financial
performance. Financial performance can be retrieved from company’s financial
statement which can be a consideration for investors to assess the condition of
companies.
Irham Fahmi (2006:64) defines the financial performance as follow,
“Financial performance as reflection of company’s achievement can be
interpreted as the results achieved of various activities which have done.
Financial performance which assessed based on the financial statement
presented by management will give meaning when analyzed towards the
implementation of work. From the analysis result, will be able to know the
level of companies’ health also can be found the weaknesses as well as the
achievement owned by the companies, so the interested parties will be able to
use it as the consideration in making the decision”.
According to definition above, it can be concluded that financial performance of
company is the achievement in finance field achieved by the company in the certain
period of time which can be assess through its financial statement. This financial
performance would get high attention from interested parties through the result of
performance development, so the involved parties are able to take their decision.

29
Anita Febriyani and Rahadian Zulfadin (2003:42) explain that information given by a
company’s financial performance can be used as analysis and evaluation of financial
statement. The information of financial position and performance in the future and
other things which directly attract the attention of its user such as dividend payment,
wages, price securities of movement and company’s skill to meet its commitment
when the due date.
To determine the financial performance of the company so generally need to analyze
the financial statements which according to Brigham and Houston (2001, p78)
contains, (1) comparison of the company’s performance with other companies in the
same industry and (2) evaluation of a company's financial position trend over time.
Theoretically, the size of company is going to be larger on post merger due to asset,
liabilities, and equity of companies combined together and post merger’s
performance is supposed to be better compared with pre merger.
Financial performance also used as factor to measure the effectiveness and efficiency
of an organization. The decreasing of financial performance continuously can lead to
financial distress. Financial distress on bank which not directly solved can cause the
loss of customers’ confidence.
2.1.5 The influence of merger towards the improvement of company’s financial
performance
According to Moin (2007, p.308), immediately after the merger, the size of the
company by itself increases because the assets, liabilities and equity of the company
merged together. Basic logic of measurement based accounting is that if the size of
the company grew coupled with the synergies resulting from the combined activities
simultaneously, the company's profit also increased. Therefore, the post-merger
company's financial performance should have been better than it was before the
merger. With the merger between the two companies supposedly an increase in

30
financial performance. Allegation of improved financial performance can be
described in the following form:
a. CAR’s company of post merger is higher than pre merger
b. NPL’s company of post merger is lower than pre merger
c. ROA’s company of post merger is higher than pre merger
d. ROE’s company of post merger is higher than pre merger
e. OER’s company of post merger is lower than pre merger
f. LDR’s company of post merger is higher than pre merger
g. PER’s company of post merger is higher than pre merger
h. EPS’s company of post merger is higher than pre merger
i. PBV’s company of post merger is higher than pre merger
2.1.6 Financial ratios analysis
For business people especially investors, it becomes the important thing to be able to
determine the condition of funds disposition which done by knowing the exact
condition, stability, and continuity of the effort. Thus, the demand of maximum as
well as accurate information is an absolute must since with the complete of
information can be analyzed how exactly the condition of the business.
Analysis conducted can be used for several analysis methods which already existed,
one of them is by using financial ratio. Financial ratio helps the several of company’s
strength and weaknesses (Keown 1996:94).
The analysis of financial performance in this research aims to assess the
implementation of company’s strategy in terms of merger. According to Brigham and
Houston (2001, p7) can be measured by using financial ratios to determine the power
of company simultaneously as well as correcting the weaknesses of the company.
31
Basically, ratio analysis is a past event, therefore the factors that may exist in the
coming period, may affect the financial position or results of operations in future. For
that an analysis is required in order to give the results of the analysis and
interpretation of good and careful, because the results of this analysis will be useful
in determining the discretion of management for retrieval in the future.
Financial ratios used in the measurement of company performance pre and post
merger in this research are CAR, NPL, OER, LDR and ROE
a. CAR
Lukman Dendiwijaya (2005:121) stated that CAR is ratio of bank’s financial
performance to measure the capital adequacy of banks to support assets that
contain or produce risk. It is the capital ratio which shows the ability of bank in
providing the funds for business development and to accommodate the risk
caused by bank operational. This ratio is measuring how far the decreasing in
total assets which still could be covered by equity capital available.
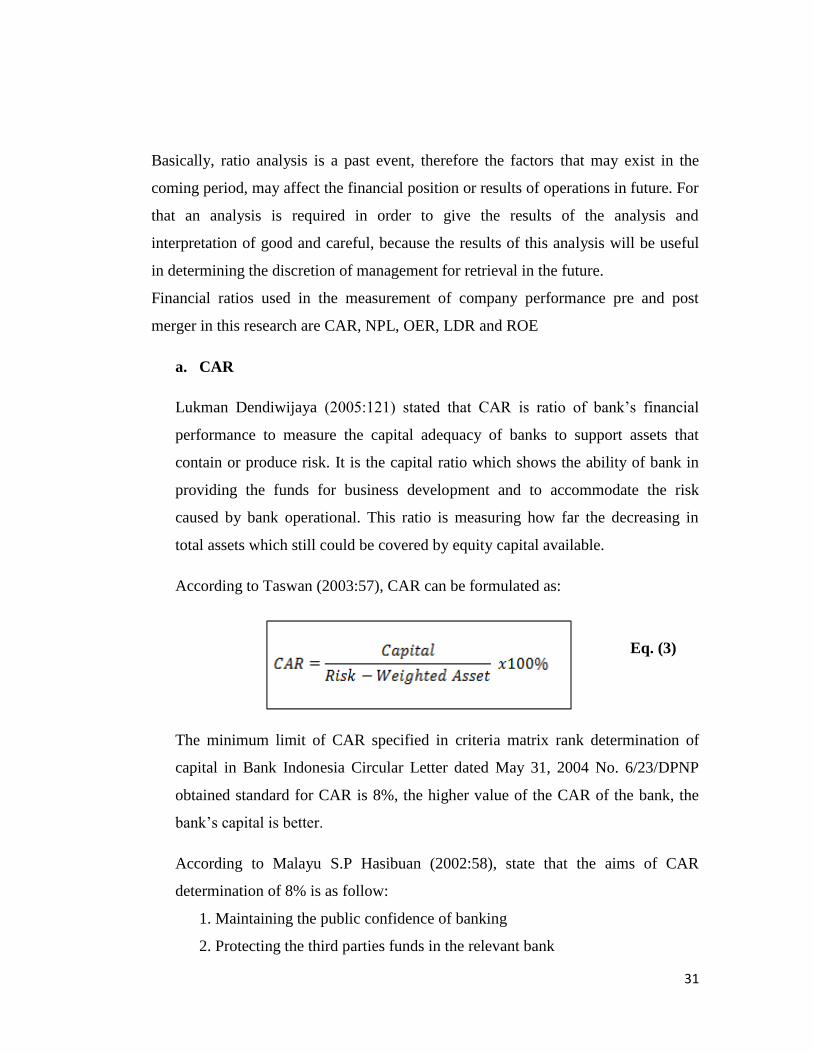
According to Taswan (2003:57), CAR can be formulated as:
Eq. (3)
The minimum limit of CAR specified in criteria matrix rank determination of
capital in Bank Indonesia Circular Letter dated May 31, 2004 No. 6/23/DPNP
obtained standard for CAR is 8%, the higher value of the CAR of the bank, the
bank’s capital is better.
According to Malayu S.P Hasibuan (2002:58), state that the aims of CAR
determination of 8% is as follow:
1. Maintaining the public confidence of banking
2. Protecting the third parties funds in the relevant bank

32
3. To fulfill the provisions of BIS international banking standards with the
following formula:
a. 4% of primary capital which consist of shareholder equity, preferred
stock, and free reserves.
b. 4% of secondary capital which consist of subordinate debt, loan loss
provision, hybrid securities and revolution reserves.
b. NPL
According to Teguh Hidayat (2010), NPL is the ratio between loans that are not
returned by the borrower (bad debts) or refunded but haltingly, with total loans
distributed by banks to the public.
This ratio indicates that the ability of bank management in managing problem
loans granted by the bank. It is credit given to third parties excluding loans to
other banks. Nonperforming loans are loans classified as substandard, doubtful
and loss (Almilia and Herdiningtyas, 2005).
It is also described in Financial Accounting Standards No. 31 (revised 2000)
which states that:
"Non-performing loans generally are loans for which the principal / or interest
have been past ninety days or more after the due date or credits timely
collection is very doubtful."
According to Bank Indonesia Circular Letter No. 3/30/DPNP Date December 14,
2001, the NPL can be calculated by the formula:
Eq. (2)

33
According to Bank Indonesia Regulation No.6/10/PBI/2004, 12 April 2004
concerning the Rating System for Commercial Banks, the higher the value of
NPLs (above 5%), the bank is not healthy.
High NPL caused a decline in profits that will be accepted by the bank. Profit
decline resulted in the dividend also diminishing so that the growth rate of retun
bank stocks will decline.
c. OER
OER is the ratio that can provide an assessment of banking efficiency is
calculated by comparing total operating expenses to total operating income (SE
BI No. 6/23/DPNP/2004, 31 Mei 2004). Based on the criteria matrix rank
determination of capital in Bank Indonesia Circular Letter, standard of OER is
below then 94.72%.
The value of OER can be calculated by the formula (Dendawijaya, 2009:147):
OER =
x 100% Eq. (3)
If the bank OER ratio in a year decreased from the previous year, the operations
of the bank more efficient while if the OER ratio increased from the previous
year, the bank's operations are increasingly inefficient. This means showing the
lower the value of a bank's OER shows more efficient the bank (Financial
Institution Statistics, 2009: 30).
d. LDR
LDR is ratio which used to measure the composition of the total loans amount
compared to the amount of public funds and equity capital used. Based on
Kasmir (2011) LDR is used to measure the composition of the number of loans
compared to the amount of public funds and equity capital used.

34
According to Bank Indonesia Circular Letter No. 6/23/DPNP on May 31st 2004,
Loan to Deposit (LDR) is credit ratio given to third party funds (Current
Account, Savings, Certificates of Deposit, and Time).
Slamet Riyadi (2006:195) stated the understanding of LDR is as follow:
"LDR is a comparison between the total loans to total Third Party Funds
(TPF), which can be collected by the bank."
Taswan (2003:59) explains the formula to calculate LDR, as follow:
Eq. (4)
The greater this ratio indicates that the more aggressive bank liquidity, otherwise
the smaller this ratio is also greater in third party funds are not used for placement
to credit so will a lot of idle funds. LDR maximum allowed by BI is 100%.
e. ROE
ROE is a profitability ratio that measures the ability of a firm to generate profits
from its shareholders investments in the company. ROE illustrates how far the
company’s ability to generate profits can be gained by shareholders (Tandelilin,
2001).
The higher of this ratio means the better equity productivity in earning the profit.
It means that the profitability achieved by bank is greater and the possibility of
getting trouble is smaller (Statistik Lembaga Keuangan, 2009:32).
The growth of ROE shows the prospect of company which better since it means
the potential for increased company profits. This is captured by investors as the
positive signal for company so it will increase the investor’s confidence and will
facilitate the management of company to make the capital in the form of shares.

35
If there is an increasing of share’s demand of company, then it will indirectly
increase its share price on the stock market (Irawan, 1996).
Based on Bank of Indonesia decree No 23/67/KEP/DIR, the minimum value of a
good ROE is 10%.
ROE can be measured by using formula as follow (Agus Sartono, 2001):
Eq. (1)
The level of quality and character of shareholders affect capital adequacy because
their policies determine whether the return is distributed or not.
If the owner of the bank prefers return as retained earnings (so ROE decreases)
then return can be used to meet capital (Faisal, 2003). Retained earnings are
reinvested to company as a source of internal funds. The existence of retained
earnings on balance sheet will add the total earnings paid because retained
earnings is the property of the shareholders in the form of undistributed profits
(Jogiyanto, 2003).
2.2 Previous Research
M. Aji Nugroho (2010) in his research titled “Analisis Perbandingan Kinerja
Keuangan Perusahaan Sebelum dan Sesudah Merger dan Akuisisi” explain that there
is no any significant difference for NPM, ROA, ROE, Debt Ratio, EPS, TATO and
CR in research for 1 year before and after merger & acquisition as well as 1 and 5
year after merger & acquisition. However, there is little difference on comparison
between 1 year before with 2,3 and 4 year after merger & acquisition where the
financial ratio which is DER indicates there is difference significantly.

36
Deri Triawan Anugrah (2013) in his research titled “Analisis Perbandingan Tingkat
Kesehatan Bank Sebelum dan Sesudah Merger (Studi Kasus Bank OCBC NISP)”.
From the result of the research, there is no significant difference of pre and post
merger. There are only CAR, NPL, NIM, and OER which has significant difference
of pre and post merger. It is concluded that merger implemented is not effective due
to performance achieved after merger implemented is not facing significant
improvement.
Research by Dita Awalia Afriani (2012) entitled “Analisis Kinerja Keuangan
Sebelum dan Setelah Merger (Studi Kasus: Bank UOB Indonesia”. The analysis
result showed although based on t-test indicated that cash ratio, LDR, LAR, ROA,
ROE, OER, CAR, DER, and DTAR is not significant different of pre and post
merger however those ratios showed the improvement.
Research by R. ArisDijkgraaf in (2012) entitled “Analisis Perbandingan Kinerja
Keuangan Bank Sebelum dan Sesudah Merger”. From ratios used to analyze the
comparison of financial performance of pre and post merger which are CAR, NPL,
OER, ROA, ROE, NIM and LDR, only CAR nad LDR that has difference of pre and
post merger. Conversely, NPL, OER, ROA, ROE and NIM that has no difference of
pre and post merger.
Journal “Analysis and Impact of Financial Performance of Commercial Banks After
Mergers in India” written by Nedunchezhian & Premalatha (2013) has objective to
find out whether the bank achieved performance during the post-merger period
namely in the areas of Capital Adequacy Ratio, Management Efficiency Ratio,
Earnings and Profitability Ratio, Leverage Ratio. Method used is comparing the local
banks during the pre-merger period (2003-2006) and post-merger period (2008-
2011). The result of this study shows the growth rate of Return on Asset ratio and
other Income to Total Income except Indian Overseas Bank shows less improvement
after mergers. Overall, the performance of selected Banks after merger shows better
improvement in most of the areas.

37
Research by Ika Sisbintari (2011) entitled “Analisis Komparatif CAR, LDR, ROA,
dan ROE Sebelum dan Sesudah Merger Pada PT. Bank CIMB Niaga Tbk” explain
that the result of ratio calculation indicates the increasing of benefits achieved by
Bank CIMB Niaga characterized by the increase in ROA and ROE after merger
while the higher lending is marked with the increasing of LDR as well as the decline
of CAR at 2010 which indicates the minimum bank’s capital ownership is decreasing
due to the increase in liabilities of the bank after the merger.
Yulinda Lestari (2011) in her research article with title, “Perbandingan Kinerja
Keuangan Sebelum dan Setelah Merger” indicates that there are significant
differences between the Financial Performance Pre and Post-merger if measured by
using liquidity is LDR. But if measured by using asset quality are NPL, APB, PPAP
ratios, sensitivity to market risk are IRR and PDN ratios, profitability ratios are
ROA,OERand NIM and capital ratios, there are no significant between Financial
Performance pre and Post-merger
Payamta & Sholikah (2001) in his journal with title, “Pengaruh Merger dan Akuisisi
Terhadap Kinerja Perbankan di Indonesia”, the analysis use CAMEL and shows
that there is no significant difference in the level of financial performance measured
by CAMEL ratios for 1 year pre and post merger. Negative result also found by
Payamta & Setiawan (2004) which examines the financial performance of companies
doing mergers and acquisitions of financial ratios. From his research shows financial
ratios two years before and after the events of mergers and acquisitions do not
undergo significant changes.

38
2.3 Theoretical Framework
Figure 2.4: Theoretical Framework
Comparing (Paired Sample T-Test)
Source: Self-developed by the researcher and supported by previous research
Based on the theoretical review from previous research that explained previously, the
researcher has developed model for theoretical framework of this research that
presented above. As can be seen, in this research, the researcher wants to compare
the financial performance of pre and post merger by using financial ratios which can
be one of measurement of company whether it success or not in implementing
Pre Merger
CAR
NPL
OER
LDR
ROE
Post Merger
CAR
NPL
OER
LDR
ROE
Financial Performance
Financial Ratios
Performance of bank of post merger

39
merger activity. Those variables which are CAR, NPL, OER, LDR, and ROE then
will be explained briefly below.
1. Capital Adequacy Ratio is one of capital ratio which shows the ability of bank
in providing the funds for business development and to accommodate the risk
caused by bank operational. This ratio is importance because it measure how
far the decreasing in total assets which still could be covered by equity capital
available. The researcher interest to analyze the capital adequacy which bank
has of post merger. The minimum limit of CAR is 8% which means the
higher value of the CAR of the bank, the bank’s capital is better.
2. Non Performing Loan defined as ratio to indicate the ability of bank
management in managing problem loans granted by the bank. It is credit
given to third parties excluding loans to other banks. High NPL caused a
decline in profits that will be accepted by the bank. Profit decline resulted in
the dividend also diminishing so that the growth rate of retun bank stocks will
decline.
3. Operating Efficiency Ratio defined as ratio that can provide an assessment of
banking efficiency is calculated by comparing total operating expenses to
total operating income. Based on the criteria matrix rank determination of
capital in Bank Indonesia Circular Letter, standard of OER is below then
94.72%.Higher OER means the bank's operations are inefficient. This means
showing the lower the value of a bank's OER shows more efficient the bank.
4. Loan to Deposit Ratio is liquidity ratio to measure the composition of the
total loans amount compared to the amount of public funds and equity capital
used. The greater this ratio indicates that the more aggressive bank liquidity,
otherwise the smaller this ratio is also greater in third party funds are not used
for placement to credit so will a lot of idle funds. LDR maximum allowed by
BI is 100%.

40
5. Return on Equity is one of profitability indicator ratios to measure the ability
of a firm to generate profits from its shareholders investments in the
company. The growth of ROE shows the prospect of company which better
since it means the potential for increased company profits. This is captured by
investors as the positive signal for company so it will increase the investor’s
confidence and will facilitate the management of company to make the capital
in the form of shares.
2.4 Hypothesis
Based on the research hypothesis mentioned above as well as the previous researches
that has been gathered, there are five variables that will be tested with sample paired t
– test using Microsoft Excel 2007. Those variables are CAR, NPL, OER, LDR, and
ROE. Hypothesis will be tested in this research is whether the variables has
significant difference of pre and post merger. So, based on theoretical and results
from previous research that expected before, the researcher has formuled the
hypothesis as follows:
Hypothesis 1 : CAR’s performance of post merger is significant higher than
premerger
Hypothesis 2 : NPL’s performance of post merger is significant lower than pre
merger
Hypothesis 3 : OER’s performance of post merger is significant lower than pre
merger
Hypothesis 4 : LDR’s performance of post merger is significant higher than pre
merger
Hypothesis 5 : ROE’s performance of post merger is significant higher than pre
merger

41
CHAPTER III
RESEARCH METHODOLOGY
3.1 Research Method
In doing scientific research, there are two methods which can be used. Those are
quantitative and qualitative research. The differences between quantitative and
qualitative research are the type of data, research process, instrument in collecting
data and the objective of research itself.
Quantitative research is the systematic empirical investigation of observable
phenomena through a statistical, mathematical or numerical data or computational
techniques. The objective of quantitative research is to develop and employ
mathematical models, theories and/or hypotheses pertaining to phenomena. The
process of measurement is central to quantitative research because it provides the
fundamental connection between empirical observation and mathematical expression
of quantitative relationships. Quantitative data is any data that is in numerical form
such as statistics, percentages and others (Lisa M. Given, 2008).
Qualitative research produces information only on the particular cases studied and
any more general conclusions are only propositions (informed assertions).
Quantitative methods can be used to seek empirical support for such research
hypotheses. Qualitative research asks broad questions and collects word data from
phenomena or participants. The most common method is the qualitative research
interview, but forms of the data collected can also include group discussions,
observation and reflection field notes, various texts, pictures and other materials
(Magi & Claire, 2012).

42
3.2 Research Framework
Figure 3.1 Research Framework
)
Source: self-developed by the researcher
Identify the problem and
define the research
question
Find and collect
related theory
Analyzing related
variables
Collect the data
needed
Process the data
Using Microsoft
Excel 2007
Using Microsoft
Excel 2007 and
SPSS version 20
Data transforming
Interpretation of
results
Conclusion and
recommendation
Retrieved from
official website of
Bank CIMB
Niaga and Bank
Indonesia

43
Before conducting this research, the researcher begins with identifying the problem.
This research analyzes the comparison of financial performance of Bank CIMB
Niaga pre and post merger from 2002 up to 2014. After identifying the problem, the
next step is discovering the basic theory related with the problem. The basic theory as
literature review supports the problem which identified. The next step is collecting
and arranging the complete data which retrieved from financial statement of Bank
CIMB Niaga for each variable. Then the data is analyzed and processed by using
Microsoft Excel as well as SPSS version 20. After that, the result of data is
interpreted. Finally, the points of conclusion and recommendation are given to this
study.
3.3 Source of Data
There are two types of data such as primary and secondary data. Primary data is
collected from first-hand experience and is reliable and authentic. The data can be
collected directly by conducting surveys, interviews, focus group, or observation.
This information can be analyzed by other experts who may decide to test the
validity of the data by repeating the same experiments (Ehow.com, 2013).
Conversely, secondary data is already published which already been collected by
someone else. It is information gathered for purposes other than the completion of a
research project and Secondary data is also used to gain initial insight into the
research problem (Steppingstones.ca, 2013).
In this research, the researcher is using secondary data retrieved from trusted sourced
which is financial statements. The secondary data being used is the financial ratios.
The research also supported by studying and reading the journal, literature, book, and
summarize the understanding theories related to the problem identified.

44
3.4 Sampling Design
According to Kenneth Ross (2005), sampling design is defined as a selection process
of a subset population created to collect information from a chosen sample of a large
group. If a sampling is done correctly, statistical analysis can be used to generalize a
whole population. Population refers to the entire group of people, events, or things
that the researchers wish to investigate (Sekaran & Bougie, 2010). In this research,
the population will be PT Bank CIMB Niaga, Tbk.
Sampling design provides information on the target and final sample size, strata
definition, and methodology of the sample selection. Sampling design will explain
the research method being used to obtain the sample before processing it into
statistical analysis.
Basically, there are two types of sampling technique which includes of probability
and non-probability sampling (Sekaran & Bougie, 2010). In probability sampling, the
elements in the population have some known non-zero chance or every element has
equal chance selection. There are several types of probability sampling which consist
of simple random sampling, systematic sampling, stratified sampling, and cluster
sampling.
According to Zikmund (2010), state that non-probability sampling is the probability
where any particular members of population will be chosen is unknown. Non-
probability sampling technique is used in this research where some elements of the
population have no equal chances of being selected. Under non-probability sampling
there are four types which are convenience (accidental), judgment (purposive), quota,
and snowball sampling.
In this research, the researcher uses non-probability sampling and focused on
judgment or purposive sampling. According to Merriam (1998:61), purposive
sampling emphasizes on a criterion based selection of information rich cases from
which a researcher can discover, understand and gain more insight on issues crucial
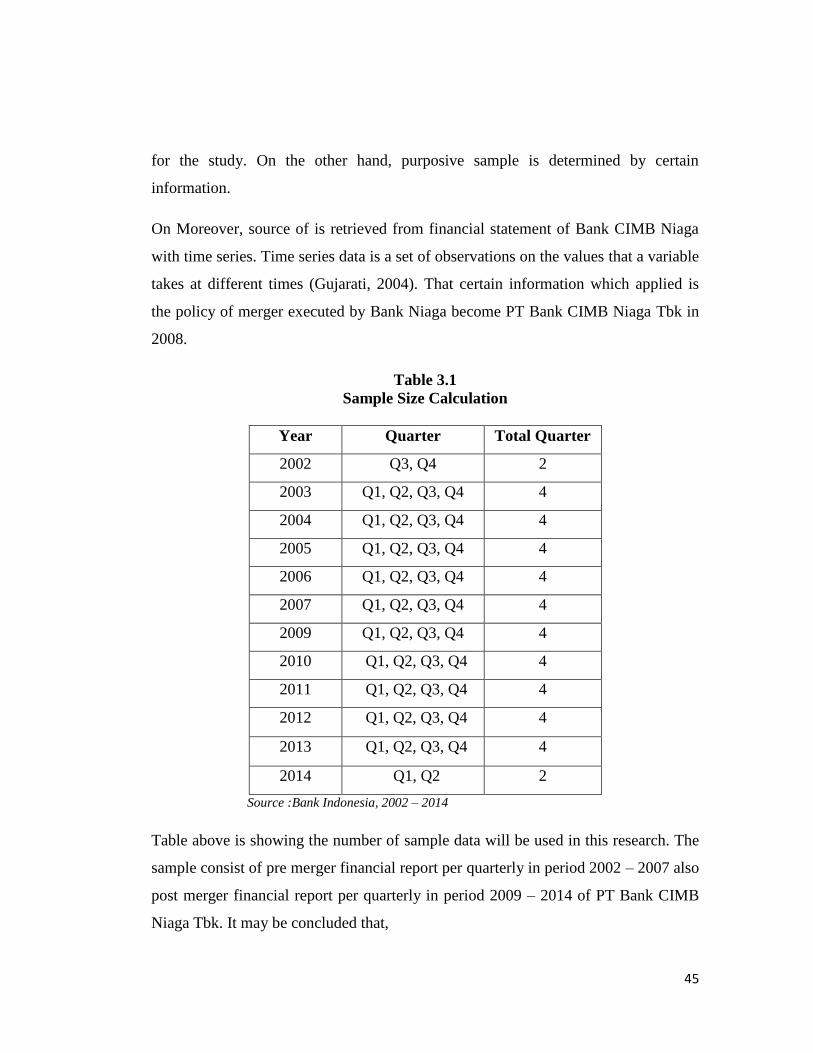
45
for the study. On the other hand, purposive sample is determined by certain
information.
On Moreover, source of is retrieved from financial statement of Bank CIMB Niaga
with time series. Time series data is a set of observations on the values that a variable
takes at different times (Gujarati, 2004). That certain information which applied is
the policy of merger executed by Bank Niaga become PT Bank CIMB Niaga Tbk in
2008.
Table 3.1
Sample Size Calculation
Year Quarter Total Quarter
2002 Q3, Q4 2
2003 Q1, Q2, Q3, Q4 4
2004 Q1, Q2, Q3, Q4 4
2005 Q1, Q2, Q3, Q4 4
2006 Q1, Q2, Q3, Q4 4
2007 Q1, Q2, Q3, Q4 4
2009 Q1, Q2, Q3, Q4 4
2010 Q1, Q2, Q3, Q4 4
2011 Q1, Q2, Q3, Q4 4
2012 Q1, Q2, Q3, Q4 4
2013 Q1, Q2, Q3, Q4 4
2014 Q1, Q2 2
Source :Bank Indonesia, 2002 – 2014
Table above is showing the number of sample data will be used in this research. The
sample consist of pre merger financial report per quarterly in period 2002 – 2007 also
post merger financial report per quarterly in period 2009 – 2014 of PT Bank CIMB
Niaga Tbk. It may be concluded that,

46
n = 22 (pre merger)
n = 22 (post merger)
The data may be collected at regular time intervals, which this research is using
quarterly data of Bank CIMB Niaga. In time series data, the sample size will be
based on total of the times range. The sample size will be identified as follow:
3.5 Operational Definition
Table 3.2
Operational Definitions and Variables
Variable Operational Definition Formula Measuring
scale
CAR
Ratio to measure the
capital to cover the
possibility of failure in
credit purchases.
x 100%
Ratio (%)
NPL
Ratio to indicate the
ability of bank
management in managing
problem loans granted by
the bank.
x 100%
Ratio (%)
OER
Ratio to assess banking
efficiency is calculated by
comparing total operating
x 100%
Ratio (%)

47
expenses to total operating
income
LDR
Ratio to measure the
composition of the total
loans amount compared
to the amount of public
funds and equity used
x 100%
Ratio (%)
ROE
Profitability ratio that
measures the ability of a
firm to generate profits
from its shareholders
investments in the
company
x 100%
Ratio (%)
Source : Investopedia
3.6 Research Instruments
Secondary data will be used in this research. The data then will be processed by
using several instruments below,
1. Microsoft Excel 2007 for data input as well as in testing the hypothesis. It
helps a lot for the researcher to summarize and analyze the financial data
which retrieved from financial ratio in financial statement to find out the
result of hypothesis testing.
2. SPSS version 20 which is a statistical tools and it will be used to process data
for descriptive statistics and normality testing.

48
3.7 Method of Data Analysis
To satisfy this research’ problem statement, the researcher have to follow the
following approach. To test whether there is a significant difference in the financial
performance of banks caused by merger implementation, the researcher will compare
the pre merger financial ratios with the post merger financial ratios.
3.7.1 Descriptive statistics
According to Sugiyono (2004), descriptive statistics used to analyze the data by
describing data that has been collected as without intending to apply to general
conclusions or generalizations.
Descriptive statistic shows the descriptions of data which can be assess from mean
value, standard deviation, and variance with the following procedures:
1. Determine the level of mean, standard deviation and variance indicators of
financial performance of the company’s financial ratios pre and post merger
in terms of the performance of company listed in Indonesia Stock Exchange.
2. Determine the difference of mean whether it increases/decreases of
company’s financial performance indicators among pre and post merger.
3.7.2 Normality testing
Normality test is one part of the test data analysis requirements or classical
assumption, meaning that before we do real analysis, the research data should be in
the test distribution normality.
To detect the normality of the data can be performed with the Kolmogorov-Smirnov
test method, the method selection is based on the normality test of the data (Hair,
1998).
The purpose of this test is to determine whether the samples used in this research is
having a normal distribution or not. Samples are normally distributed if Asymptotic

49
sig> confidence level used in the test, in this case is 95% or α = 5%. Conversely said
to be normal if the asymptotic sig < level of confidence. If the significance value
greater than 0.05 then the data is otherwise normal, whereas if the significance value
less than 0.05 then the data is not normally distributed (Ghozali,2011).
If the test results show samples of normal distribution, the different tests that will be
used in this research is a parametric test (paired sample t-test). But if the sample is
not normally distributed, the different test that will be used in this study is a non-
parametric test (Wilcoxon sign test).
3.7.3 Hypothesis testing
According to the parameter, statistic is divided into two which are parametric and
nonparametric statistics. Non-parametric statistics are part of a statistical population
parameter does not follow a specific distribution nor have a free distribution
requirements and its variants do not need to be homogeneous. Conversely, parametric
statistics are part of a statistical population parameter which follows a specific
distribution.
Paired sample t-test and wilcoxon signed rank test are popular models used to
analyze the pre-post study or before and after. Different test is used to evaluate
treatment (treatment) on one particular same sample at two different observation
periods. Certain observation in this study is the event of mergers. If this treatment
does not affect the object then the average measurement value is equal to or
considered zero or null hypothesis (H0) is accepted. If it turns influential statement,
the average measurement value is not equal to zero and the null hypothesis (H0) is
rejected, then the alternative hypothesis is accepted.
3.7.4 Paired Sample T Test
According to Sugiyono (2001), “when the sample is correlated or in pairs, for
example, comparing before and after treatment, the different test used is paired

50
sample t – test”. The data is coming from two measurements or two different period
of research that taken from paired subjects (Ghozali, 2011).Selection of this method
since there are samples with the same subject but experience two different treatment
or measurement, as well as since the data that already test before is having normal
distribution. This hypothesis testing used is null hypothesis testing (H0) which state
that financial performance of post merger is lower than pre merger and alternative
hypothesis (H1) which state the opposite.
Hypothesis:
a. Hypothesis 1
H0:µ1 ≥ µ2 CAR’s performance of post merger is significant lower than
pre merger
H1 : µ1< µ2 CAR’s performance of post merger is significant higher than
pre merger
b. Hypothesis 2
H0:µ1≤µ2 NPL’s performance of post merger is significant higher than
pre merger
H1 : µ1>µ2 NPL’s performance of post merger is significant lower than
pre merger
c. Hypothesis 3
H0:µ1 ≤ µ2 OER’s performance of post merger is significant higher than
pre merger
H1 : µ1>µ2 OER’s performance of post merger is significant lower than
pre merger

51
d. Hypothesis 4
H0:µ1 ≥ µ2 LDR’s performance of post merger is significant lower than
pre merger
H1 : µ1< µ2 LDR’s performance of post merger is significant higher than
pre merger
e. Hypothesis 5
H0:µ1 ≥ µ2 ROE’s performance of post merger is significant lower than
pre merger
H1 : µ1< µ2 ROE’s performance of post merger is significant higher than
pre merger
Significance level used in this research is 0.05 or 5% means probability to make
mistake is lower and significance level is able to used in this research. Besides using
significance level 0.05, determination of degrees of freedom (df) is n-1, where:
n = the number of data
According to Santoso (2002), indicators of paired sample t-test is determined by:
a. H0 is accepted if t value ≥t table
b. H0 is rejected if t value <t table
To examine the statistical test or hypothesis testing, researcher use parametrical
statistics approach which is by using t-test analysis to test the two independent
samples which has small sample (n<30). Reflecting to Sugiyono statement in his
book is given instructions to select the formula t-test, ie when the sample correlated /
pairs, for example, comparing before and after treatment, or compared with the
control group experimental group is using paired sample t-test.

52
CHAPTER IV
ANALYSIS OF DATA AND
INTERPRETATION OF RESULT
4.1 Company Profile
Bank CIMB Niaga established on September 26th
1995 under the name of Bank
Niaga. The Government of the Republic of Indonesia for some time has ever been a
majority shareholder of Bank Niaga current financial crisis in the late 1990s. In
November 2002, Commerce Asset-Holding Berhard (CAHB), now known as CIMB
Group Holdings Berhard (CIMB Group Holdings) acquired a majority share of the
Commercial Bank Restructuring Agency (BPPN). In August 2008, the entire
ownership is changed hand to CIMB Group as part of an internal reorganization to
consolidate the activities of all subsidiaries of CIMB Group with universal banking
platform.
In a separate transaction, Khazanah which is the majority shareholder of CIMB
Group Holdings acquired majority ownership of Lippo Bank on September 30th
,
2005. All share ownership changed hands belong to CIMB Group on 28th
October
2008 as part of the same internal reorganization. In high professionalism, Bank Niaga
finally used by government of Indonesia as the majority ownership while the
financial crisis occurred in the end of 90’s. Forerunner of Bank Niaga occurred in
November 2002 while Bumiputera-Commerce Holdings Berhard (BCHB) held the
majority ownership and then transferred to CIMB Group, a wholly –owned
subsidiaries by BCHB on August 16th
, 2007. Ownership shares changed in August
2007 with a universal banking platform.
To create healthy banking structure as well as improvement of the supervision
function of Bank Indonesia is by is by issuing the policy regarding to sole ownership

53
of banks which called as single present policy (SPP). It indicates that policy which
obligates the majority owner of the bank has sole ownership of the banks operating in
Indonesia as well as implies the controlling shareholders who have a controlling
stake of more than one bank have to choose whether to do the divestiture, merger, or
form a bank of holding company.
As the owner of a controlling share of Bank Niaga (via CIMB Group) and Lippo
Bank, since 2007 Khazanah looked merger (merger) as an effort that must be taken in
order to comply with the SPP policy which has been set by Bank Indonesia.
The business case is the first merger in Indonesia related to the SPP policy. In May
2008, the name changed to Bank CIMB Niaga. Agreement Merger Plan of Bank
Niaga and Lippo Bank was signed in June 2008, followed by the Application for
Approval of Plan of Merger of Bank Indonesia and the issuance of Letter of
Approval for Merger Notification by the Ministry of Law and Human Rights in
October 2008.Lippo Bank officially merged into Bank Niaga on November 1st, 2008
(Legal Day 1 or LD1) which was followed by the introduction of a new logo to the
public.
The merger was effected after CIMB Group Sdn Bhd acquired 51% of Lippo Bank
shares from Santubong Investments BV, on 28 October 2008, and followed by Lippo
Bank’s shareholders to exchange their shares to Bank CIMB Niaga. On the other
hand, Lippo Bank shares were de-listed from the Indonesia Stock Exchange.

54
Figure 4.1 Merger Implementation of Bank Niaga and Lippo Bank
Source: CIMB Niaga Annual Report 2008
Bank Niaga and Lippo bank are the complementary bank and will have strong
synergy if they are merged since Bank Niaga owns the local customers as well as
strong in lending and Lippo Bank is strong with Chinese customer also strong with
the deposits.
With the merger, Bank CIMB Niaga’s total assets increase to around Rp100 trillion,
and is supported by almost 11.000 professional employees. Its products and services
are now offered through a wider network of over 650 branches and 1.450 ATM and
Self Service Terminal (SST) services across 120 cities nationwide.
In running their business as new beginning of Bank CIMB Niaga as well as to
success the merger implementation, they built their own strong vision and mission as
well as core values which will bring them to achieve their goals. They are as follow:
1. Vision and Mission
To be the most trusted Indonesian bank that is part of South East Asia’s
leading universal bank by understanding our customers’ needs, providing the
right comprehensive financial solutions and building lifetime relationships.

55
2. Core Values
a. Integrity is everything
i) Speak and act honestly and sincerely
ii) Reliable in all dealings with a sense of professionalism
b. Always Put Customers First
i) Strive in creating value and solutions to exceed customers’ expectation
ii) Having a desire to help and to serve others, to meet and to anticipate
stakeholders’ needs
c. Passion for Excellence
i) Passionate in delivering the best quality in our product, service and
process.
ii) Develop open leadership, empower people, and have ownership for our
decisions.
The merger has strengthened Bank CIMB Niaga’s position as the sixth largest bank
in Indonesia in terms of assets. The combination of both banks strengths has created
a well-positioned bank.
4.2 Data Result Analysis
4.2.1 Object statistical description
Object statistical description consists of variables that use financial ratios as the
measuring tools to assess the Bank CIMB Niaga’s performance in implementing the
merger. Those variables are CAR, NPL, OER, LDR and ROE. The time range of the
data is divided into two periods, firstly is in pre merger period (2002 to 2007), and
secondly is in post merger period (2009-2014). Data of each variable will be
elaborated as follows.

56
1. CAR
CAR is ratio which shows the ability of bank in providing the funds for business
development and to accommodate the risk caused by bank operational. This ratio
is measuring how far the decreasing in total assets which still could be covered
by equity capital available.
In accordance to the Bank Indonesia Circular Letter dated May 31, 2004
No.6/23/DPNP obtained standard for CAR is 8%. Performance of CAR of Bank
CIMB Niaga in pre and post merger can be seen as below table and figure,
Table 4.1
CAR Data in Percentage
Source : Bank Indonesia, 2002 - 2014
According to above table, it illustrates CAR number in percentage of pre merger
(2002 – 2007) and post merger (2009 – 2014) quarterly. Based on the table, we
may conclude that the lowest CAR of pre merger is 10% which can be found on
quarter 4 in 2004 and quarter 2 in 2005 while the highest one is 18% found on
quarter 1 in 2006 and 2007. The average of pre merger CAR is 14.05%. While
the lowest CAR of post merger is 12% which can be found on quarter 1, 2 and 3
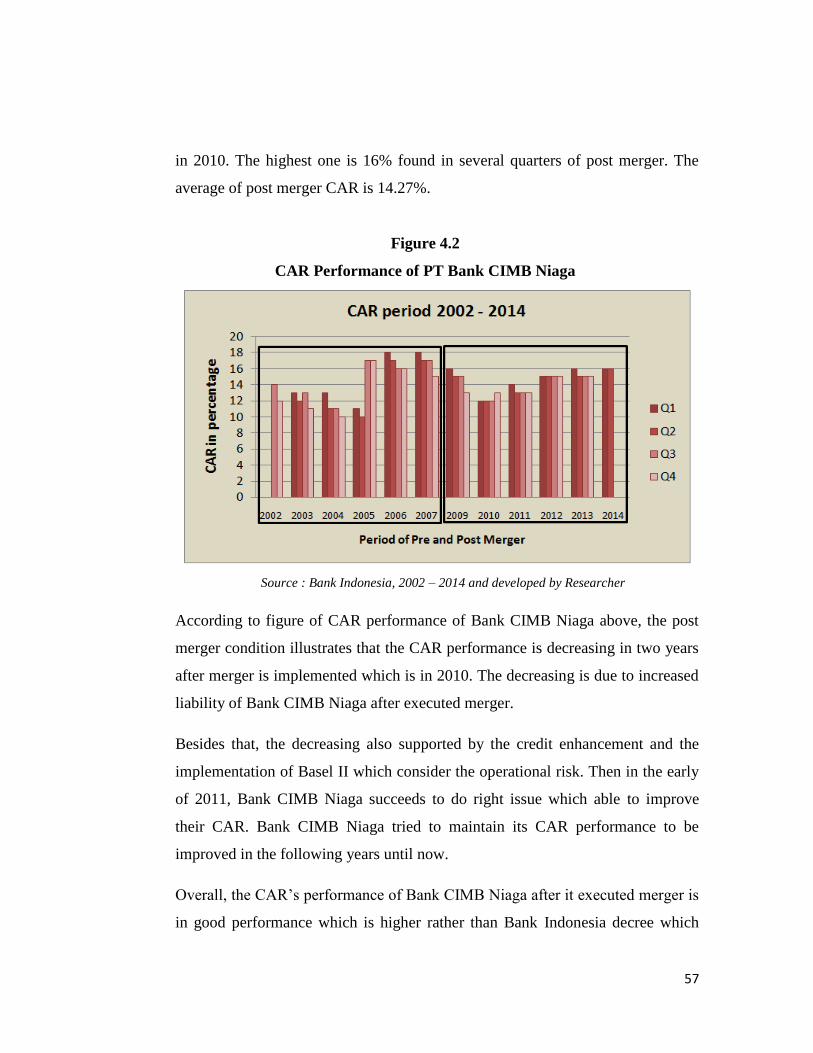
57
in 2010. The highest one is 16% found in several quarters of post merger. The
average of post merger CAR is 14.27%.
Figure 4.2
CAR Performance of PT Bank CIMB Niaga
Source : Bank Indonesia, 2002 – 2014 and developed by Researcher
According to figure of CAR performance of Bank CIMB Niaga above, the post
merger condition illustrates that the CAR performance is decreasing in two years
after merger is implemented which is in 2010. The decreasing is due to increased
liability of Bank CIMB Niaga after executed merger.
Besides that, the decreasing also supported by the credit enhancement and the
implementation of Basel II which consider the operational risk. Then in the early
of 2011, Bank CIMB Niaga succeeds to do right issue which able to improve
their CAR. Bank CIMB Niaga tried to maintain its CAR performance to be
improved in the following years until now.
Overall, the CAR’s performance of Bank CIMB Niaga after it executed merger is
in good performance which is higher rather than Bank Indonesia decree which

58
Period Q1 Q2 Q3 Q4
2002 5 6
2003 6 4 4 3
2004 3 5 4 3
2005 2 4 4 4
2006 3 4 2 2
2007 3 3 3 2
2009 1 1 1 1
2010 2 1 1 1
2011 1 1 1 1
2012 1 1 1 1
2013 1 1 1 1
2014 1 1
NPL (%)
has the minimum CAR is 8%. It means good for bank since Bank CIMB Niaga is
able to provide the funds for what needed by bank operational.
2. NPL
NPL is a troubled loan where the debtor cannot meet loan payments and interest
arrears within the time agreed in the agreement. This ratio indicates that the
ability of bank management in managing problem loans granted by the bank.
According to Bank Indonesia Regulation No. 6/10/PBI/2004, 12 April 2004
concerning the Rating System for Commercial Banks, the higher the value of
NPLs (above 5%), the bank is not healthy.
Table 4.2
NPL Data in Percentage
Source : Bank Indonesia, 2002 - 2014
According to above table, it illustrates NPL number in percentage of pre merger
(2002 – 2007) and post merger (2009 – 2014) quarterly. Based on the table, we
may conclude that the lowest NPL of pre merger is 2% which can be found in
several quarters of pre merger while the highest one is 5% found on quarter 1 in
2002 and quarter 2 in 2004. The average of pre merger NPL is 3.59%. The

59
lowest NPL of post merger is 1% which can be found almost on each quarter of
pre merger while the highest one is 2% found in quarter 1 of year 2010. The
average of post merger CAR is 1.05%.
Figure 4.3
NPL Performance of PT Bank CIMB Niaga
Source : Bank Indonesia, 2002 – 2014 and developed by Researcher
According to figure above, NPL performance of Bank CIMB Niaga in pre merger
condition which has ever touched above 5% is indicating that Bank CIMB Niaga
is in unhealthy condition, since the loss due to credit is high and coupled with the
ability of bank management in managing problem loans is not proper. The high
number of NPL in pre merger is due to uniformity collectability issued by BI in
2005.
Reflecting the bad performance of NPL in pre merger condition, in the first year
after merger is implemented, the performance of NPL is decreasing and going
stable in the following years. The significant difference of NPL can be identified
from their average which has difference for 2.55%.The increasing of NPL

60
occurred in the first quarter of 2010 in small changes which is only 1%. As
reported on its financial report, the growth of credit in Bank CIMB Niaga is
undeniable due to the increasing of operating income which is the result of
credit’s increasing so there is small possibility problem with its NPL. However,
the stable of NPL’s performance in post merger is proving that Bank CIMB
Niaga is maintaining its asset quality properly. It means, even though credit
contribution of Bank CIMB Niaga is higher, Bank CIMB Niaga still able to select
the prospective lenders properly so the possibility for having high NPL is small.
The low number of NPL indicates that Bank CIMB Niaga is in healthy condition.
It reflects to Bank Indonesia Regulation No. 6/10/PBI/2004, which concern that
unhealthy bank is having value for above than 5%.
3. OER
OER is the ratio that can provide an assessment of banking efficiency is
calculated by comparing total operating expenses to total operating income. This
means showing the lower the value of a bank's OER shows more efficient the
bank.
Based on the criteria matrix rank determination of capital in Bank Indonesia
Circular Letter dated May 31, 2004 No.6/23/DPNP standard for OER is good if
the number is less than 94.72%.
If the bank OER ratio in a year decreased from the previous year, the operations
of the bank more efficient while if the OER ratio increased from the previous
year, the bank's operations are increasingly inefficient.

61
Table 4.3
OER Data in Percentage
OER (%)
Period Q1 Q2 Q3 Q4
2002 93 100
2003 92 91 88 88
2004 73 70 74 79
2005 76 5 81 5
2006 84 84 83 82
2007 83 83 83 82
2009 86 82 81 82
2010 77 77 77 76
2011 75 76 76 76
2012 74 72 71 71
2013 72 72 72 73
2014 74 77 Source : Bank Indonesia, 2002 - 2014
According to above table, it illustrates OER number in percentage of pre merger
(2002 – 2007) and post merger (2009 – 2014) quarterly. Based on table above, we
may conclude that the lowest OER of pre merger is 5% which can be found on
quarter 2 and 4 in 2005. Those numbers are showing significant difference with
another number in pre merger period. On the other hand, the highest one is 100%
found on quarter 4 in 2002. For post merger period, the highest number is 86%
which found on quarter 1 in 2009, conversely the lowest number of OER in post
merger is 71% which found on quarter 3 and 4 in 2012.
By checking to the average number of pre merger, OER has 76.32% while the
average number of post merger OER is 75.86%. If we reflect to the criteria matrix
rank determination of capital in Bank Indonesia Circular Letter dated May 31, 2004
No. 6/23/DPNP, OER number of pre and post merger are in the good performance
since those numbers are less than 94.72%.

62
Figure 4.4
OER Performance of PT Bank CIMB Niaga
Source : Bank Indonesia, 2002 – 2014 and developed by Researcher
As illustrated in above figure, the performance of OER ratio of post merger is
stable enough compared with performance in pre merger. In 2002, OER
performance touched 100%, means Bank CIMB Niaga is having inefficient of
operation. It is due to Bank Niaga expansion in 2002 and the other effect of this
expansion is in the credit growth. In 2005, changing performance of OER caused
by operational expenses by increasing the number of branches and ATM.
Compared with pre merger, performance of OER in post merger is better which
means Bank CIMB Niaga is more efficient in maintaining its operation. One of
strategy implemented in reducing the OER number to make it more efficient is by
developing the branchless banking in 2013 due to cost expended is not high.
Overall, average of OER ratio post merger is higher than Bank Indonesia decree
which is the good range of OER is lower than 94.72%. It indicates that financial
performance of Bank CIMB Niaga in OER of post merger is better.

63
4. LDR
LDR is a financial ratio of banking company related to liquidity aspects. It is
comparison between loans to Third Party Funds (TPF). LDR is used to assess
ability of banks to pay back the withdrawal of funds by depositors to rely on
loans as a source of liquidity. LDR maximum allowed by BI is 100%.
The higher bank’s LDR, then the lower ability of the bank's liquidity and it makes
the possibility of a bank in error will be greater. The performance of LDR of
Bank CIMB Niaga can be seen in as below table and figure.
Table 4.4
LDR Data in Percentage
LDR (%)
Period Q1 Q2 Q3 Q4
2002 49 59
2003 62 64 67 72
2004 72 78 84 85
2005 90 93 90 85
2006 87 90 88 84
2007 87 95 95 92
2009 85 87 90 95
2010 87 84 88 87
2011 89 92 92 92
2012 94 96 91 92
2013 83 95 89 90
2014 94 93
Source : Bank Indonesia, 2002 - 2014
According to above table, it illustrates LDR number in percentage of pre merger
(2002 – 2007) and post merger (2009 – 2014) quarterly. Based on the table, we
may conclude that the lowest LDR of pre merger is 49% which can be found on
quarter 1 in 2002 while the highest one is 95% found on quarter 2 in 2007. The
average of pre merger LDR is 80.36%. The lowest LDR of post merger is 85%

64
which can be found on quarter 1 in 2009. The highest one is 96% found in quarter
2 in 2012. The average of post merger LDR is 90.23%.
Figure 4.5
LDR Performance of PT Bank CIMB Niaga
Source : Bank Indonesia, 2002 – 2014 and developed by Researcher
According to figure above, there is increasing of LDR performance in pre merger
condition. In 2009, the LDR performance is affected by the growth of credit
which some of them is coming from credit distribution outside Java and reflects
that Bank CIMB Niaga succeed to run the strategy of credit distribution evenly in
Indonesia.
Year by year, Bank CIMB Niaga keep maintain the LDR performance by
improving the credit distribution also supported by the increasing of third party
funds, and it is proven by increasing of LDR in 2011.
Overall, the number of LDR which Bank CIMB Niaga had have not reached the
100% yet since the higher LDR performance, the lower ability of the bank's
liquidity and it makesthe possibility of a bank in error will be greater. So, Bank

65
CIMB Niaga should pay attention on this matter for avoiding keep increasing the
LDR.
5. ROE
ROE illustrates how far the ability of company to generate profits which can be
gained by shareholders. The increasing of this ratio means there is an increasing
in net profit of the bank concerned. Based on Bank of Indonesia decree No
23/67/KEP/DIR, the minimum value of a good ROE is 10%.
Table 4.5
ROE Data in Percentage
ROE (%)
Period Q1 Q2 Q3 Q4
2002 12 12
2003 17 37 36 39
2004 46 39 48 41
2005 30 28 25 21
2006 18 18 18 16
2007 18 18 17 17
2009 10 14 16 16
2010 20 22 23 24
2011 23 22 22 21
2012 21 22 22 22
2013 19 19 19 18
2014 17 15
Source : Bank Indonesia, 2002 – 2014
According to above table, it illustrates ROE number in percentage of pre merger
(2002 – 2007) and post merger (2009 – 2014) quarterly. Based on the table, we
may conclude that the lowest ROE of pre merger is 12% which can be found on
quarter 3 and 4 in 2002 while the highest one is 48% found on quarter 3 in 2004.
The average of pre merger ROE is 25.95%. While the lowest ROE of post merger
is 10% which can be found on quarter 1 in 2010. The highest one is 24% found
on quarter 4 in 2010. The average of post merger ROE is 19.41%.

66
Figure 4.6
ROE Performance of PT Bank CIMB Niaga
Source : Bank Indonesia, 2002 – 2014 and developed by Researcher
According to figure above, there is significant difference of ROE in pre and post
merger. Pre merger condition shows the increasing then decreasing performance
while the performance in post merger is little bit increasing.
In 2009, the first year after merger is implemented, the performance of ROE
began grow up. The increasing of net income is caused by the growth of interest
income and commission income as well as the improvement in cost efficiency.
The performance is keeping increase in 2010 when Bank CIMB Niaga has
significant increasing in net profit which caused by improvement of operational
income, absence of merger cost in 2010 and decreasing of provision for losses.
Compared with the pre merger performance, the number is lower but more stable.
This significant difference is the effect of low interest rate that occurred in 2003
and 2004 which led to the growth of bank loans distributed so the net interest
income is increasing which derived from interest income from loans which
contribute to generate the increasing net profit.

67
Overall, average of ROE ratio in pre and post merger is higher than Bank
Indonesia decree which is the minimum of ROE is 10%. This indicates that
financial performance of Bank CIMB Niaga in ROE side is good.
4.2.2 Descriptive Statistics of Research Variable
The Descriptive statistics designed to test the hypothesis will provide general
information of the data observation. If the standard deviation is greater than mean
value, means the existing data has a large variation. Conversely, if the standard
deviation is smaller than mean value, it means that the data has a low variation. The
maximum value indicates the highest value in the data, while the lowest value
indicates the smallest value in the data.
1. Pre Merger
Table 4.6
Source: SPSS version 20
According to table of descriptive statistics of pre merger, there are five variables
with samples (N) of 22 for each variable. The samples are taken from five years
and six months on quarterly basis. So samples collected are 22 samples.
Based on table above which illustrates the pre merger condition, the information
of variables is elaborated as follows:
a. The first variable, CAR, has the lowest value which is 10% in quarter 2 in
2005 and the highest value is 18% in quarter 1 in 2007. Mean of CAR

68
from 2002 to 2007 is 14.05. The deviation of CAR in this research is good
as the standard deviation is 2.803 which are lower than mean value.
b. The second variable, NPL, has the lowest value which is 2% and founded
in several quarters in pre merger. Meanwhile, the highest NPL is 6%
which found on quarter 1 in 2003. The mean of NPL from 2002 to 2007 is
3.59. The standard deviation is 1.182 which implies good deviation since
the standard deviation is lower than mean.
c. The third variable is OER, where the lowest value is 5% in quarter 2 and
4 in 2005 while the highest value of OER is 100% in quarter 4 in 2002.
The mean of OER from 2002 up to 2007 is 76.32. The deviation of OER
in this research is good as the standard deviation is 24.096 which is lower
than mean value.
d. The fourth variable, LDR, has the lowest value of 49% in quarter 3 in
2002 while the highest value is 95% in quarter 4 in 2009. On the other
hand, the mean value of LDR which calculated from 2002 – 2007 is
80.36. The LDR’s standard deviation of 13.070 is lower than mean which
means the deviation of this variable is good.
e. The fifth variable is ROE which has the lowest value of 12% in quarter 3
and 4 in 2002 while the highest value is 48% which is in quarter 3 in
2004. ROE’s mean value is 25.95 and the value of standard deviation is
11.483, it indicates the good deviation since the standard deviation value
is lower than mean.

69
2. Post Merger
Table 4.7
Source: SPSS version 20
According to table of descriptive statistics of pre merger, there are five variables
with samples (N) of 22 for each variable. The samples are taken from five years
and six months on quarterly basis. So samples collected are 22 samples.
Based on table above which illustrates the pre merger condition, the information
of variables is elaborated as follows:
a. The first variable, CAR, has the lowest value which is 12% in quarter 1, 2,
and 3 in 2010 and the highest value is 16% in several quarters in post merger
period. Mean of CAR from 2009 to 2014 is 14.27. The deviation of CAR in
this research is good as the standard deviation is 1.386 which is lower than
mean value.
b. The second variable, NPL, has the lowest value which is 1% and founded in
almost quarters in post merger period. Meanwhile, the highest NPL is 2%
which found on quarter 1 in 2010. The mean of NPL from 2009 to 2014 is
1.05. The standard deviation is 0.213 which implies good deviation since the
standard deviation is lower than mean.
c. The third variable is OER, where the lowest value is 71% in quarter 3 and 4
in 2012 while the highest value of OER is 86% in quarter 1 in 2009. The

70
mean of OER from 2009 to 2014 is 75.86. The deviation of OER in this
research is good as the standard deviation is 3.980 which is lower than mean
value.
d. The fourth variable, LDR, has the lowest value of 83% in quarter 1 in 2013
while the highest value is 96% in quarter 2 in 2012. On the other hand, the
mean value of LDR which calculated from 2009 to 2014 is 90.23. The LDR’s
standard deviation of 3.690 is lower than mean which means the deviation of
this variable is good.
e. The fifth variable is ROE which has the lowest value of 10% in quarter 1 in
2009 while the highest value is 24% which is in quarter 4 in 2010. ROE’s
mean value is 19.41 and the value of standard deviation is 3.528, it indicates
the good deviation since the standard deviation value is lower than mean.
4.2.3 Normality Testing
Normality testing is needed to find out whether the data taken by the researcher in
pre and post merger data is coming from normally distributed population. This
normality testing will use kolmogorov-smirnov test. The selection of this method is
because of kolmogorov-smirnov test is a method which common used to test
normality data (Hair et al, 1998).
The objective of this test is to know if the sample will be used in this research is
normal distribution if the probability > significance level defined which is α = 0.05.
If the result is showing that the sample is normal distributed, the test will be used in
this research is parametric test. Conversely, if the result is showing that the sample is
abnormal distributed, the test will be used in this research is non parametric test.
1. Pre Merger
Normality test of financial ratios data will be done by using method of
kolmogorov-smirnov for pre merger period can be seen in the following table,

71
Table 4.8
Source: SPSS version 20
According to normality testing, indicate that the value of probability is higher than
significant level (α = 0.05). It concludes that the financial ratios data in pre merger
condition has normal distribution. Based on the conclusion, to analyze the financial
ratios data in this research will be used sample paired t-test to do hypothesis testing
partially.
2. Post Merger
Table 4.9
Source: SPSS version 20
Normality testing of financial ratios which done by kolmogorov-smirnov for post
merger period is describes by above table.

72
According to normality testing, indicate that the value of probability is higher than
significant level (α=0.05). It concludes that the financial ratios data in pre merger
condition has normal distribution. Based on the conclusion, to analyze the financial
ratios data in this research will be used sample paired t-test to do hypothesis testing
partially.
4.2.4 Hypothesis Testing
This hypothesis testing aims to answer the question of statement of problem
constructed previously which proxies into five variables of financial ratios which are
CAR, NPL, OER, LDR, and ROE. The hypothesis testing used is paired sample t-
test.
4.2.5 Paired Sample T-Test
Paired sample t-test is done in this research to test the hypothesis which already
designed. Selection of this method since there are samples with the same subject but
experience two different treatment or measurement, as well as since the data that
already test before is having normal distribution.
Degree of freedom (df) in this research is n-1 = 22-1 = 21 so we can reflect to t-table
and the number of t-table will be 1.721.
Criteria of acceptance
a. H0 is accepted if t value ≥ t table, so H1 is rejected
b. H0 is rejected if t value <t table, so H1 is accepted

73
1. Hypothesis analysis
a. CAR
Table 4.10
Paired sample t-test
Source: Microsoft Excel2007
From the output of hypothesis testing in paired sample t-test table above,
researcher can make decision according to criteria acceptance by using t value
and t table. According to the statistic result above, t-table which presented as t
critical one-tail used to examine the t value resulted from the test (1.720).
The table shows that t value of CAR is -0.5097. It means t value of CAR is lower
than t table. So we may conclude that H0 is rejected which means financial
performance of CAR of post merger is significant higher than pre merger.

74
b. NPL
Table 4.11
Paired sample t-test
Source: Microsoft Excel2007
From the output of hypothesis testing in paired sample t-test table above,
researcher can make decision according to criteria acceptance by using t value
and t table. According to the statistic result above, t-table which presented as t
critical one-tail used to examine the t value resulted from the test (1.720).
The table shows that t value of NPL is -10.081. It means t value of NPL is lower
than t table. So we may conclude that H0 is rejected which means financial
performance of NPL of post merger is significant lower than pre merger.

75
c. OER
Table 4.12
Paired sample t-test
Source: Microsoft Excel2007
From the output of hypothesis testing in paired sample t-test table above,
researcher can make decision according to criteria acceptance by using t value
and t table. According to the statistic result above, t-table which presented as t
critical one-tail used to examine the t value resulted from the test (1.720).
The table shows that t value of OER is 0.091. It means t value of OER is lower
than t table. So we may conclude that H0 is rejected which means financial
performance of OER of post merger is significant lower than pre merger.

76
d. LDR
Table 4.13
Paired sample t-test
Source: Microsoft Excel2007
From the output of hypothesis testing in paired sample t-test table above,
researcher can make decision according to criteria acceptance by using t value
and t table. According to the statistic result above, t-table which presented as t
critical one-tail used to examine the t value resulted from the test (1.720).
The table shows that t value of LDR is -3.8847. It means t value of LDR is lower
than t table. So we may conclude that H0 is rejected which means financial
performance of LDR of post merger is significant higher than pre merger.

77
e. ROE
Table 4.14
Paired sample t-test
Source: Microsoft Excel2007
From the output of hypothesis testing in paired sample t-test table above,
researcher can make decision according to criteria acceptance by using t value
and t table. According to the statistic result above, t-table which presented as t
critical one-tail used to examine the t value resulted from the test (1.720).
The table shows that t value of ROE is 3.170. It means t value of ROE is lower
than t table. So we may conclude that H0 is rejected which means financial
performance of ROE of post merger is significant higher than pre merger.
4.3 Interpretation of Result
4.3.1 CAR’s performance of post merger is higher than pre merger
According to SPSS result in Table 4.11 which analyzed for 2002-2007 in pre merger
and 2009-2014 in post merger, shows that the t-value of CAR is -0.5097, which is

78
lower than t table (1.720). It means that the H0is rejected so we may conclude that
CAR performance of post merger is significant higher than pre merger.
Lukman Dendiwijaya (2005:121) stated that CAR is ratio of bank’s financial
performance to measure the capital adequacy of banks to support assets that contain
or produce risk. The minimum limit of CAR based on Bank Indonesia regulation is
8%.Based on theory stated by Abdul Moin (2007, p.308) that state the size of
company which implemented merger is increasing because the assets, liabilities, and
equity companies merged together is supported the increasing of CAR even though
the performance is not moving much.
This analysis agreed with research by Cevi Purnama (2008) which found that
performance of CAR of post merger is higher rather than pre merger however based
on the descriptive data show the small changes. Furthermore, this analysis is not in
line with research of Ika Sisbintari (2013) which explained that CAR performance in
post merger is decreasing.
In addition, the achievement of Bank CIMB in managing its CAR is quite good since
both CAR number in pre and post merger is much higher rather than minimum limit
of CAR based on Bank Indonesia regulation which is 8%.
4.3.2 NPL’s performance of post merger is lower than pre merger
According to SPSS result in Table 4.12 which analyzed for 2002-2007 in pre merger
and 2009-2014 in post merger, shows that the t-value of NPL is -10.081which is
lower than t table (1.720). It means that H0is rejected so we may conclude that NPL
performance of post merger is significant lower than pre merger.
By checking to their average number NPL pre merger is 3.59% then decrease to
1.05% which means the decreasing number of NPL occurred in post merger.
According to its changing of performance in post merger, we can conclude that NPL

79
performance in post merger is better since Bank CIMB Niaga is maintaining its asset
quality properly.
According to Teguh Hidayat (2010), NPL is the ratio between loans that are not
returned by the borrower (bad debts), or refunded but haltingly, with total loans
distributed by banks to the public. This ratio indicates that the ability of bank
management in managing problem loans granted by the bank. According to Bank
Indonesia Regulation No6/10/PBI/2004, 12 April 2004 concerning the Rating System
for Commercial Banks, the higher the value of NPLs (above 5%), the bank is not
healthy.
The result of this analysis is supported by research of Deri Triawan Anugrah (2013)
which analyzes the financial performance of post merger bank and state that NPL
performance of post merger is lower than pre merger. In Addition, by looking to NPL
performance of post merger, it can be indicated that Bank CIMB Niaga is in healthy
condition since the value of NPL does not excess 5% (Bank Indonesia, 2004).
4.3.3 OER’s performance of post merger is lower than pre merger
According to SPSS result in Table 4.13 which analyzed for 2002-2007 in pre merger
and 2009-2014 in post merger, shows that the t-value of OER is 0.0918which is
lower than t table (1.720). It means that H0 is rejected so we may conclude that OER
performance of post merger is significant lower than pre merger.
The average of OER also indicates that OER of pre merger has average for 76.32%
while post merger average has 75.6%. The decreasing performance indicates that
performance of post merger better because the number is lower which means the
operational of Bank CIMB Niaga is efficient. It is supported by theory of Financial
Institutions Statistics (2009:30) which explain that the lower of OER so it indicates
the more efficient is bank. OER is ratio that can provide an assessment of banking
efficiency is calculated by comparing total operating expenses to total operating
income (Bank Indonesia, 2004). Based on the criteria matrix rank determination of

80
capital in Bank Indonesia Circular Letter dated May 31, 2004 No.6/23/DPNP,
standard of OER is below then 94.72%.
This analysis also in line with the research of Dita Awalia Afriani (2012) which
found that OER performance of post merger is significant lower than pre merger. The
analysis is supported as well by Abdul Moin (2007, p.308) in his allegation regarding
to the improvement of financial performance after merger is OER of post merger is
lower compared with pre merger performance.
In addition, the achievement of Bank CIMB Niaga is managing its OER of post
merger is more efficient since OER of post merger is lower than minimum limit of
OER based on Bank Indonesia regulation which is 94.72%.
4.3.4 LDR’s performance of post merger is higher than pre merger
According to SPSS result in Table 4.14 which analyzed for 2002-2007 in pre merger
and 2009-2014 in post merger, shows that the t-value of LDR is -3.8846which is
lower than t table (1.720). It means that H0 is rejected so we may conclude that LDR
performance of post merger is significant higher than pre merger. By checking to
their average number, the difference is quite high which is 9.86%, from 80.36% to
90.23. It shows the increasing of LDR performance in post merger, so we can
conclude that LDR performance in post merger is better rather than in pre merger
According to Kasmir (2011) LDR is used to measure the composition of the number
of loans compared to the amount of public funds and equity capital used. In addition,
LDR number maximum allowed by BI is 100%.
This analysis is in line with the research of R. Aris Dijkgraaf in 2012 which found
that performance of LDR of post merger is significant higher than pre merger period.
By looking to the performance, Bank CIMB Niaga is able to maintain its LDR since
the number had have not reached the 100% yet because the higher LDR performance

81
so the ability of the bank’s liquidity is lower then it will make the possibility of bank
error will be greater (Lesmana, 2008).
4.3.5 ROE’s performance of post merger is higher than pre merger
According to SPSS result in Table 4.15 which analyzed for 2002-2007 in pre merger
and 2009-2014 in post merger, shows that the t-value of ROE is 3.1702which is
higher than t table (1.720). It means that H0 is accepted so we may conclude that
ROE performance of post merger is significant lower than pre merger. It is also
reflected to the average number of ROE in pre merger(25.95%) and post
merger(19.41%), it indicates that the performance of ROE is decreasing means that
pre merger performance much better rather than in post merger period.
ROE is used to measure the ability of a firm to generate profits from its shareholders
investments in the company. According to Bank Indonesia decree No.
23/67/KEP/DIR, the minimum value of a good ROE is 10%. Thus, the higher of
ROE the profit earned by company also higher and its ability to generate profit for its
shareholder also better.
The result of ROE analysis is not in line with previous research conducted by M. Aji
Nugroho (2010) which stated in his research that the performance of post merger
ROE is better rather than in pre merger but agreed with Dyaksa Widyaputra (2006)
which found that ROE is decreasing in post merger.
The significance difference in ROE due to the merger’s effect is showing that the
bank’s ability to generate profits which can be gained by shareholders is lower rather
than in pre merger condition. However, those values are good since the number is
higher than Bank Indonesia decree about the minimum value of good ROE.
4.3.6 The most difference of ratio in pre and post merger
According to the average calculation result of each variable, the variable that has the
highest average of difference is LDR which has 9.8%. It means that LDR is having

82
the most difference of CIMB Niaga in time period 2002 – 2007 of pre merger and
2009 – 2014 of post merger. The second most difference is ROE based on average
number calculation which is 6.5% then by NPL with 2.54% as the third most
difference then OER with 0.45% as the fourth most difference followed by CAR with
the average is 0.22% as the last most difference. Among all the financial ratios as the
variables, LDR is the most difference as it has the highest of difference of average
which is 9.8%.
4.3.7 The performance of Bank CIMB Niaga of post merger
As result of this merger is indicated by five variables which are CAR, NPL, OER,
LDR, and ROE. From those variables, it indicates that performance of CAR of post
merger is increasing which means Bank CIMB Niaga is good in maintaining their
capital to support assets that contain or produce risk. NPL is showing good
performance due to the lower number of post merger which means Bank CIMB
Niaga’s ability in managing problem loans is good. It is also followed by OER which
has good performance. OER has decreased performance of pre and post merger
which indicates that operational of Bank CIMB Niaga is efficient. Next, LDR
performance of post merger also good due to the increasing of its number. However,
the decreasing occurred in ROE of post merger which means the performance of
ROE is not good.
Overall, the performance of Bank CIMB Niaga which measured by those variables is
indicating in good result. That is agreed by Abdul Moin (2007, p.308) which stated
that after the company is implemented merger, the size of the company by itself
increases because the assets, liabilities and equity of the company merged together.
Basic logic of measurement based accounting is that if the size of the company grew
coupled with the synergies resulting from the combined activities simultaneously, the
company's profit also increased. Therefore, the post-merger company's financial
performance should have been better than it was before the merger.
83
CHAPTER V
CONCLUSION AND RECOMMENDATION
5.1 Conclusion
In this globalization era, companies are competing to be the market leader. Strategies
are created to keep maintaining the existence in their industry. One of those strategies
which often found is merger. Merger implementation should be affect to the
performance of company since immediately after the merger, the size of the company
by itself increases because the assets, liabilities and equity of the company merged
together.
That’s why it is important to know the affection of merger itself in a company, so
financial performance can be one of assessment to indicate the success of merger.
The aim of this research is to compare the financial performance of company of pre
and post merger. Aster deep and long analysis as well as discussion that had in
previous chapters, the result can be concluded as follows:
1. From sample paired t-test result, the difference of variables can be concluded
as follows:
a. On CAR variable, t value of CAR is -0.5097, which is lower than t
table (1.720). So then, H0 is rejected and we may conclude that CAR
performance of post merger is significant higher than pre merger..
From the average number, pre merger CAR’s is having 14.05% and
post merger CAR’s is having 14.27%.The achievement of Bank
CIMB in managing its CAR is quite good since both CAR number in
pre and post merger is much higher rather than minimum limit of
CAR based on Bank Indonesia regulation which is 8%.

84
b. On NPL variable, its t-value(-10.018)is lower than t table (1.720). It
means that H0 is rejected so we may conclude that NPL performance
of post merger is significant lower than pre merger. By checking to
their average number, the difference is for 2.55% from 3.59% to
1.05% means the decreasing number of NPL occurred in post merger.
Its changing of performance in post merger indicates that NPL
performance in post merger is better since Bank CIMB Niaga is
maintaining its asset quality properly.
c. The result of OER variable tested shows that the t-value of OER is
0.0917 which is significant lower than t table (1.720). It means that
H0is rejected so we may conclude that OER performance of post
merger is lower than pre merger. The average of OER also indicates
the difference is only 0.45% but in quality side, OER of post merger is
better because the number is lower which means the operational of
Bank CIMB Niaga is efficient. The achievement of Bank CIMB Niaga
is managing its OER of post merger is more efficient since OER of
post merger is lower than minimum limit of OER based on Bank
Indonesia regulation which is 94.72%.
d. On LDR variable tested shows that the t-value of LDR is –3.884
which is significant lower than t table (1.720). It means that H0 is
rejected so we may conclude that LDR performance of post merger is
higher than pre merger. By checking to their average number, the
difference is quite high which is 9.86%, from 80.36% to 90.23. It
shows the increasing of LDR performance in post merger, so we can
conclude that LDR performance in post merger is better rather than in
pre merger. By looking to the performance, Bank CIMB Niaga is able
to maintain its LDR since the number had have not reached the 100%
yet because the higher LDR performance so the ability of the bank’s

85
liquidity is lower then it will make the possibility of bank error will be
greater
e. The last variable tested is ROE. The result shows that the t-value of
ROE is 3.1702which is significant higher than t table (1.720). It
means that H0 is accepted so we may conclude that ROE performance
of post merger is lower than pre merger. The average number of ROE
in pre merger is 25.95% and post merger is 19.41% which indicates
that pre merger ROE is much better rather than in post merger period.
The decreasing of ROE due to the merger’s effect is showing that the
bank’s ability to generate profits which can be gained by shareholders
is lower rather than in pre merger condition
2. The most difference on the financial ratio of Bank CIMB Niaga in pre and
post merger
Among CAR, NPL, OER, LDR and ROE as the variables, LDR is having the
most difference as it has the highest of difference of average which is 9.8%.
The second most difference is ROE with 6.5% then NPL with 2.54%. OER
with 0.45% as the fourth most difference followed by CAR with the average
is 0.22% as the last most difference.
3. The performance of Bank CIMB Niaga of post merger
Overall, among CAR, NPL, OER, LDR and ROE as the variables, the
performance of Bank CIMB Niaga is indicating in good result. It is proven by
CAR of post merger is increasing which means Bank CIMB Niaga is good in
maintaining their capital to support assets that contain or produce risk. NPL
also shows good performance due to the lower number of post merger which
means Bank CIMB Niaga’s ability in managing problem loans is good. It is
also followed by OER which has good performance. OER has decreased
performance of pre and post merger which indicates that operational of Bank
86
CIMB Niaga is efficient. Next, LDR performance of post merger also good
due to the increasing of its number. However, the decreasing occurred in
ROE of post merger which means the performance of ROE is not good.
5.2 Recommendation
From this study, the researcher would like to suggest several recommendations which
are explained as follows.
1. To the company
From this research, the result is expected to be beneficial for the company.
The company should keep its performance especially in ratio of financial
performance which indicates in good result as the successful of merger
implementation and can attract the investor to invest in the company
Conversely, the company is expected to improve the ratio of financial
performance that is not in good result to complete the good performance of
financial performance of post merger.
2. The next researcher
The researcher would like to suggest to next researcher to add more indicators
in analyzing the comparison of Bank CIMB Niaga of pre and post merger
then not only focus on financial performance but also on its management
performance regarding the merger implementation.

87
REFERENCES
Books
Abdullah, B. (2006). Jalan Menuju Stabilitas : Mencapai Pembangunan Ekonomi
Berkelanjutan. Jakarta: LP3ES.
Abdullah, Faisal M. (2005). Manajemen Perbankan: (Teknik Analisis Kinerja
Keuangan Bank) ( 1st ed.). Malang: Universitas Muhammadiyah Malang
Abdullah, Faisal. (2003). Dasar-Dasar Manajemen Keuangan (1st ed.). Malang:
Universitas Muhammadiyah
Brigham, Eugene F. dan Joel F. Houston. (2001). Manajemen Keuangan (8th ed.).
Jakarta : Erlangga
Dendiwijaya, Lukman. (2005). Manajemen Perbankan. Bogor: Ghalia Indonesia
Fahmi, Irham. (2006). Analisis Investasi Dalam Persepektif Ekonomi Dan Politik.
Bandung: Penerbit Refika Aditama
Fitch, P. Thomas. (2006). Dictionary of Banking Term (5th ed.). Barron's Educational
Series, Inc
Fuady, Munir. (2001). Hukum tentang akuisisi, take over, dan LBO (1st ed.).
Bandung: Citra Aditya Bakti
Ghazali, Imam. (2009). Aplikasi Analisis Multivariate dengan Program SPSS (4th
ed.). Semarang: Badan Penerbit Universitas Diponegoro
Gitman, Lawrence J. (2006). Principple of Managerial Finance (11th ed.). Boston:
Pearson
Gitman, Lawrence J. (2009). Principle of Managerial Finance (12th ed.). Boston:
Pearson
Given, Lisa M. (2008). The Sage encyclopedia of qualitative research methods. Los
Angeles, Calif.: Sage Publications
Husnan, S. (2011). Manajemen Keuangan Teori dan Penerapannya (Keputusan
Jangka Pendek) (4th ed.). Yogyakarta: BPFE

88
Ikatan Akuntansi Indonesia.(2004). Standar Akuntansi Keuangan. SalembaEmpat,
Jakarta
IrhamFahmi. (2006). Analisis Investasi. Bandung: Alfabeta
Jogiyanto. (2003). Teori Portfolio dan Analisis Investasi. Yogyakarta: BPFE
Kasmir.(2008). Manajemen Perbankan Edisi Revisi. Jakarta: PT. Raja Grafindo
Persada
Merriam, S.B. (1998). Qualitative Research and Case Studies Applications in
Education. San Francisco: Jossey-Bass Publications
Moin, Abdul. (2003). Merger, Akusisi, dan Divestasi(1st ed.). Yogyakarta: Ekonosia
Moin, Abdul. (2007). Merger, Akuisisi dan Divestasi (2nd ed.). Yogyakarta: Ekonisia
Ross, K. N. (2005). Sample design for educational survey research. In Quantitative
research methods in educational planning. Paris: UNESCO
Sartono, Agus. (2001). Manajemen Keuangan: Teori dan Aplikasi(4th ed.).
Yogyakarta: BPFE
Savin-Baden, M. & Major, C. (2013).Qualitative Research: The Essential Guide to
Theory and Practice. London: Routledge
Sekaran, U., &Bougie, R. (2010).Research methods for business: A skill building
approach(5th ed.). West Sussex, UK: John Wiley & Sons Ltd.
Stice K. Earl, Stice D. James, Skosusen Fred. K. (2004).Intermediate Accounting
(15th ed.). Jakarta: Salemba Empat.
Undang-Undang Republik Indonesia No. 10 Tahun 1998 tentang Perbankan. (1998).
Jakarta: Departemen Keuangan Republik Indonesia.
Whittaker, Scott C. (2012). Mergers & Acquisitions Integration Handbook (1sted.).
John Wiley & Sons Inc
Zikmund, W. G., Babin, B. J., Carr, J. C., & Griffin, M. (2010).Business Research
Method (8th ed.). South-Western: Cengage Learning

89
Journals
(2008). 2008.A New Beginning - Bank CIMB Niaga. Jakarta: PT Bank CIMB
NiagaTbk.
(2009). 2009 Merger Process and Achievement Report – Bank CIMB Niaga. Jakarta:
PT Bank CIMB NiagaTbk.
Afriani, D. A. (2012). Analisis Kinerja Keuangan Bank UOB Indonesia Sebelum
dan Setelah Merger , 26, 250 - 266.
Almilia, Luciana Spica., & Herdiningtyas, Winny. (2005). Analisis Rasio CAMEL
terhadap Prediksi Kondisi Bermasalah pada Lembaga perbankan Periode 2000
– 2002.Jurnal akuntansi dan keuangan, 7
Arshad, Asma. (2012). Post Merger Performance Analysis of Standard Chartered
Bank Pakistan., Interdisciplinary Journal of Contemporary Research in
Business. 4 – 167
Cartwright. S., & Cooper, C. L. (1993).The role of culture compatibility in successful
organizational marriage. Academy of Management Executive, 7, 57-70
Febriyani, A., Zulfadin, Rahadian. (2003). Analisis Kinerja Bank Devisa dan Bank Non
Devisa di Indonesia. Jurnal Ekonomi dan Keuangan, 7 Irawan, Ridwan A.C. (1996). IPO Sebagai Alternatif Sumber Pendanaan Bagi
Perusahaan. Usahawan, 4 ,14-19
Lesmana, Y. (2008). Konsistensi Antara Discretionary Accrual dengan Rasio
Keuangan Camel dalam Mengukur Tingkat Kesehatan Bank. Usahawan
Websites
2011, Krisis Keuangan Asia. Retrieved October, 2014, from Indonesia-Investments:
www.indonesia-investments.com/id/budaya/ekonomi/krisis-keuangan-
asia/item246
Ade. (2008, October 16). BI Sahkan Merger CIMB Niaga-Lippo. Retrieved October,
2014, from Okezone:
http://economy.okezone.com/read/2008/10/16/21/154750/bi-sahkan-merger-
cimb-niaga-lippo/larg

90
Antara. (May 30, 2008). BI Setujui Merger Bank Niaga and Lippo. Retrieved
October, 2014, from Liputan 6:http://news.liputan6.com/read/189971/bi-setujui-merger-bank-niaga-dan-lippo
Arsitektur Perbankan Indonesia. (n.d). Retrieved October, 2014, from Bank
Indonesia: http://www.bi.go.id/id/publikasi/perbankan-dan-
stabilitas/arsitektur/Default.aspx
CIMB Niaga nama baru bank hasil merger Lippo dan Niaga. (n.d). Retrieved
October, 2014, from Buletin Bisinis:
https://buletinbisnis.wordpress.com/2008/06/03/cimb-niaga-nama-baru-bank-
hasil-merger-lippo-dan-niaga/
Dwiantika, Nina. (2 May, 2013). CIMB Niaga menekan biaya dari branchless
banking. Retrieved January, 2015, from Keuangan kontan:
http://keuangan.kontan.co.id/news/cimb-niaga-menekan-biaya-dari-
branchless-banking
Ehow.com. (2013). Primary Data. From:
http://www.ehow.com/about_4685513_primarydata_.html
Hidayat, Teguh. (2010). Mengenal Fundamental Perbankan. Retrieved December,
2014, from: Indonesia Value Investor:
http://www.teguhhidayat.com/2010/11/mengenal-fundamental-
perbankan.html#uds-search-results
Ihsan, Amal. (26 Februari, 2004). Bank Niaga Cetak Rekor Laba Rp 467 Miliar.
Retrieved December, 2014, from:
http://www.tempo.co/read/news/2004/02/26/05640066/Bank-Niaga-Cetak-
Rekor-Laba-Rp-467-Miliar
Peraturan Bank Indonesia No: 8/16/PBI/2006. (n.d). Retrieved November, 2014,
from: Bank Indonesia:
http://www.bi.go.id/id/peraturan/perbankan/Documents/f5cb004a929c4f09a66
a0b03ad5930d4pbi_81607.pdf
Mahbub, Harun. (2008). CIMB NiagadanLipporesmi merger. Retrieved October,
2014, from: Tempo
Interaktif:http://tempointeraktif.com/2008/11/03/%20cimbniaga-dan-lippo-
resmi-merger/

91
Ratag, Benny A. (2007). Arsitektur Perbankan Indonesia dan kondisi perbankan saat
ini. Retrieved November, 2014, from: .httpkebijakan.wordpress.com
Sejarah Perbankan Periode 1997 – 1999. (n.d). Retrieved October, 2014, from Bank
Indonesia:
http://www.bi.go.id/id/tentangbi/museum/sejarahbi/bi/Documents/f2310af437
15441bb8d57d865ea7987cSejarahPerbankanPeriode19971999.pdf)
Soewita, Benny. (2008). Pelaksanaan Single Presence Policy di Bank BUMN.
Retrieved November, 2014, from: Wealth Indonesia:
http://www.wealthindonesia.com/mutual-fund/index.php/pelaksanaansingle-
presence-policy-di-bank-bumn.html
Steppingstones.ca. (2013).Secondary data. From:
http://www.steppingstones.ca/artman/publish/article_60.shtml
Student Exercise Series: SPSS. (2011). Retrieved December, 2014, from: Referensi
dosen narotama: http://referensi.dosen.narotama.ac.id/files/2011/12/SES-
SPSS.pdf
The Sampling Frame and Sampling Location (n.d). Retrieved November, 2014, from:
Business Teacher http://www.businessteacher.org.uk/essays/management/the-
sampling-frame-and-sampling-location.php#ixzz3IYYCSxVL

92
APPENDICES
Table 1. Financial Ratios of Pre Merger Period
Time Period CAR NPL OER LDR ROE
Quartile 3 2002 14 5 93 49 12
Quartile 4 2002 12 6 100 59 12
Quartile 1 2003 13 6 92 62 17
Quartile 2 2003 12 4 91 64 37
Quartile 3 2003 13 4 88 67 36
Quartile 4 2003 11 3 88 72 39
Quartile 1 2004 13 3 73 72 46
Quartile 2 2004 11 5 70 78 39
Quartile 3 2004 11 4 74 84 48
Quartile 4 2004 10 3 79 85 41
Quartile 1 2005 11 2 76 90 30
Quartile 2 2005 10 4 5 93 28
Quartile 3 2005 17 4 81 90 25
Quartile 4 2005 17 4 5 85 21
Quartile 1 2006 18 3 84 87 18
Quartile 2 2006 17 4 84 90 18
Quartile 3 2006 16 2 83 88 18
Quartile 4 2006 16 2 82 84 16
Quartile 1 2007 18 3 83 87 18
Quartile 2 2007 17 3 83 95 18
Quartile 3 2007 17 3 83 95 17
Quartile 4 2007 15 2 82 92 17
Source: Bank Indonesia, 2002 - 2007

93
Table 2. Financial Ratios of Post Merger Period
Time Period CAR NPL OER LDR ROE
Quartile 1 2009 16 1 86 85 10
Quartile 2 2009 15 1 82 87 14
Quartile 3 2009 15 1 81 90 16
Quartile 4 2009 13 1 82 95 16
Quartile 1 2010 12 2 77 87 20
Quartile 2 2010 12 1 77 84 22
Quartile 3 2010 12 1 77 88 23
Quartile 4 2010 13 1 76 87 24
Quartile 1 2011 14 1 75 89 23
Quartile 2 2011 13 1 76 92 22
Quartile 3 2011 13 1 76 92 22
Quartile 4 2011 13 1 76 92 21
Quartile 1 2012 15 1 74 94 21
Quartile 2 2012 15 1 72 96 22
Quartile 3 2012 15 1 71 91 22
Quartile 4 2012 15 1 71 92 22
Quartile 1 2013 16 1 72 83 19
Quartile 2 2013 15 1 72 95 19
Quartile 3 2013 15 1 72 89 19
Quartile 4 2013 15 1 73 90 18
Quartile 1 2014 16 1 74 94 17
Quartile 2 2014 16 1 77 93 15
Source: Bank Indonesia, 2009 - 2014