comparative analysis of endophytic bacterial microbiomes in
TRANSCRIPT

Sample to Insight
Comparative Analysis of Endophytic Bacterial Microbiomes in Grapevine
Application Note

2 Comparative Analysis of Endophytic Bacterial Microbiomes in Grapevine
This Application Note describes 16S rRNA gene based microbiome analysis using the pre-built workflows in CLC Microbial Genomics Module. This module is an extension of CLC Genomics Workbench.
Data 1. Publicly available NGS sequencing reads (A. Campisano
et al. 2014) were downloaded from Japanese Trace Archive in FASTQ format. The sequencing samples used in this analysis were generated via 16S sequencing of grapevine endophytic communities. Two grapevine varieties were grown in multiple locations under two different pest management practices: organic, and IPM (Integrated Pest Management):
• Two samples from organic Chardonnay vineyards
• Two samples from organic Merlot vineyards
• Three samples from IPM Chardonnay vineyards
• Two samples from IPM Merlot vineyards
2. The primer sequences used for this project (799F and 1520R) were added to the Trim Adapter List in CLC Genomics Workbench.
3. Greengenes, 16S rRNA reference database v13_5.
Software: CLC Genomics Workbench 8.5.1 with CLC Microbial Genomics Module 1.2.
OverviewMicrobial Genomics Module has various tools for OTU (Operational Taxonomic Unit) clustering and analysis. They are shown in Figure 1. For this analysis, we used the two pre-built workflows shown in Figure 2 and the three stand-alone tools: “Download OTU Reference Database“, “Add Metadata to Abundance Table“ and “PERMANOVA Analysis“. The elements of each workflow are presented in Figures 3 and 4.
AnalysisThe analysis consisted of five steps: Data Import, Data QC and OTU clustering, Visualization of OTU Table, Estimation of Alpha and Beta diversities, and PERMANOVA Analysis. Each step is described below.
• Data Import
The Greengenes OTU Reference Database was downloaded to CLC Genomics Workbench using the “Download OTU Reference Database” tool, and the NGS data files were imported using the Illumina Import tool.
• Data QC and OTU clustering
The first workflow “Data QC and OTU clustering” com-bines multiple tools into a single analysis step that is easy to execute, and minimizes hands-on time for the
Figure 1. OTU Clustering Tools
Figure 2. Prebuilt standard workflows for OTU clustering and analysis
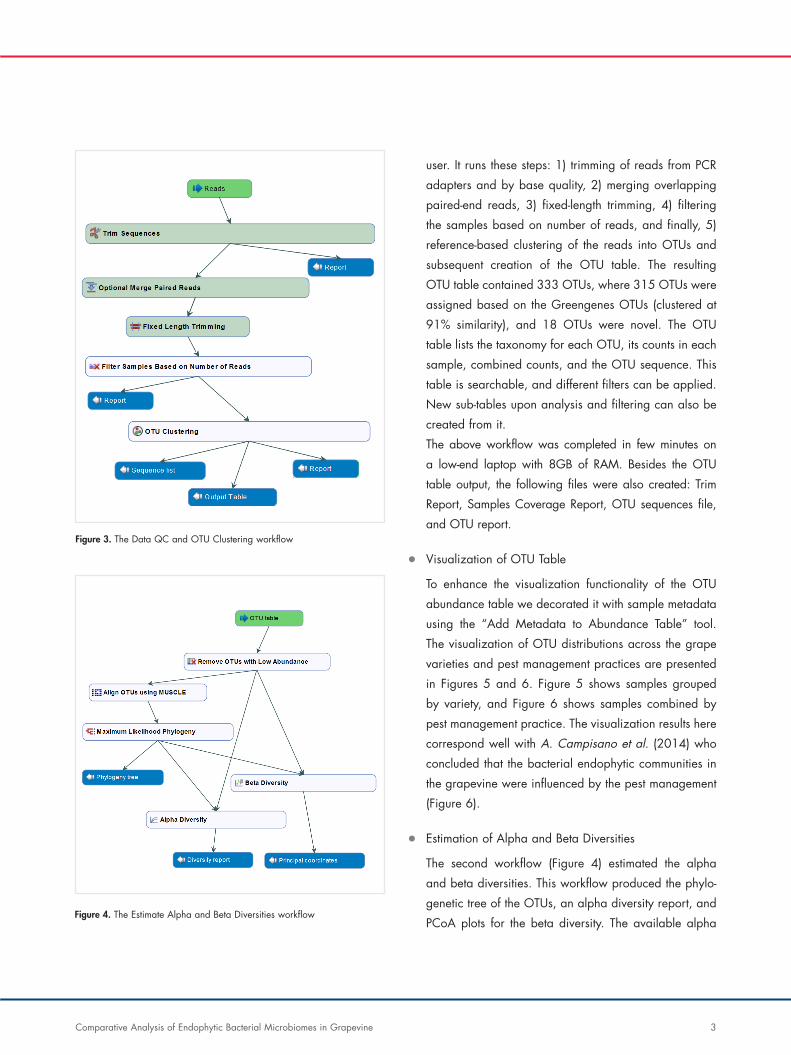
user. It runs these steps: 1) trimming of reads from PCR adapters and by base quality, 2) merging overlapping paired-end reads, 3) fixed-length trimming, 4) filtering the samples based on number of reads, and finally, 5) reference-based clustering of the reads into OTUs and subsequent creation of the OTU table. The resulting OTU table contained 333 OTUs, where 315 OTUs were assigned based on the Greengenes OTUs (clustered at 91% similarity), and 18 OTUs were novel. The OTU table lists the taxonomy for each OTU, its counts in each sample, combined counts, and the OTU sequence. This table is searchable, and different filters can be applied. New sub-tables upon analysis and filtering can also be created from it.The above workflow was completed in few minutes on a low-end laptop with 8GB of RAM. Besides the OTU table output, the following files were also created: Trim Report, Samples Coverage Report, OTU sequences file, and OTU report.
• Visualization of OTU Table
To enhance the visualization functionality of the OTU abundance table we decorated it with sample metadata using the “Add Metadata to Abundance Table” tool. The visualization of OTU distributions across the grape varieties and pest management practices are presented in Figures 5 and 6. Figure 5 shows samples grouped by variety, and Figure 6 shows samples combined by pest management practice. The visualization results here correspond well with A. Campisano et al. (2014) who concluded that the bacterial endophytic communities in the grapevine were influenced by the pest management (Figure 6).
• Estimation of Alpha and Beta Diversities
The second workflow (Figure 4) estimated the alpha and beta diversities. This workflow produced the phylo-genetic tree of the OTUs, an alpha diversity report, and PCoA plots for the beta diversity. The available alpha
Figure 3. The Data QC and OTU Clustering workflow
Figure 4. The Estimate Alpha and Beta Diversities workflow
Comparative Analysis of Endophytic Bacterial Microbiomes in Grapevine 3

Sample to Insight
diversity measures include: number of OTUs, Chao 1, Chao 1 bias-corrected, Shannon Entropy, and Simpson’s index. All organic samples showed a higher Simpson’sindex than the IPM samples.
The beta diversity analysis tool provides various distance measures for PCoA. Here we show two beta diversity plots in Figure 7. The PCoA plot generated based on the Euclidean distance measure is on the left side of the figure and the plot generated based on Jaccard distance is on the right. Organic (green) and IPM (red) samples showed clear separation. This separation was confirmed by PERMANOVA analysis (p < 0.05), which is also included in the module. These plots provide addi-tional visualization supporting the claim that maintaining the bacterial endophytic communities in the grapevine depend on pest management practices.
Concluding RemarkThe tools and workflows of CLC Microbial Genomics Module allow for speedy and comprehensive analysis of
Figure 7. Beta diversity, Euclidean measure PCoA is on the left, and Jaccard is on the right. All organic samples are shown with green spheres, and IPM samples with red spheres.
Figure 5. OTU composition for samples combined by variety. Figure 6. OTU composition for samples combined by pest management practice.
microbial communities. The preconfigured example work-flows and intuitive visualization provide the gateway to sophisticated microbiome analysis, and empower users at any level of bioinformatics experience.
References:
Campisano A, Antonielli L, Pancher M, Yousaf S, Pindo M, et al. (2014) Bacterial Endophytic Communities in the Grapevine Depend on Pest Management. PLoS ONE 9(11): e112763. doi:10.1371/journal.pone.0112763