comparative analysis of incentive provision in construction industry
TRANSCRIPT

COMPARATIVE STUDY OF INCENTIVES PROVISION IN INDIGENOUS AND INDIGENISED FIRMS IN NIGERIA.
L.M. Amusan Department Of Building Technology
Covenant University, Canaan Land Ota. Ogun –State.Nigeria.
E-mail: [email protected]
ABSTRACT.
The need for improved productivity and a means of stimulating it with particular bias for incentives prompts this research work. The objectives are to determine the types of incentives in operation (financial and non-financial), incentives that could be combined with other types so as to reinforce the effect of financial based incentives, and to determine the preferences or priority accorded to these incentives in the firms. To achieve these objectives, a field survey involving 30 samples of construction firm’s workers which form the nucleus of the population, which was selected by random sampling, was conducted.
The sample was categorized into large scale construction firm, small scale local firm and medium scale local firm. Primary Data are collected with the aid of structured questionnaire which was designed in Likert scale, 1-4 rating, were analyzed with percentages and important index to determine the order of ranking of these incentives, and the degree of availability. Secondary Data were collected through Journals, Thesis, Text Books and Past works.
The research/Study discovers that foreign firms-engaged more of financial Incentives then the local firms, so also non-financial incentives, the like of social security, conducive work environment, accident free work environment, involvement in decision making and prompt payment of wages, could be used to reinforce the financial based incentives.
The research considers this discovery, as a potential high productivity inducer if well managed and administered.
KEY WORDS: Productivity Incentives, Firms, Indigenized, Compare.
1

INTRODUCTION
Background of the Research
Productivity could be considered as relationship between output and input, ratio of output to input or
outflow to inflow of resources (Kaming, 1997 Robert, 1972 and Owolana, 1997)
Productivity is on decline in firms as a result of low morale of workers and this should be a major
concern of every organisation that desires long-term survival, thus companies in Nigeria in order to
escape this malaise, are currently applying various incentives schemes in order to motivate their
employee onto higher productivity through financial and non-financial based incentive schemes
(Fagbenle et al, 2004, Gilson et al, 2004). For instance, construction activities in Vietnam is a risky
venture, few companies ventures into construction activity in this area as a result of various health
hazards, good environment and other factors involved, thus, for health workers on site at rural parts of
such an area, high level of motivation package is essential, in order to sustain their productivity
(Dielman et al, 2003).
However, general school of though classified incentives as financial, semi-financial and non-financial
incentives. The attempt to study these incentives taking holistic approach, as an inducer that workers
need to enhance their productivity prompts this research work.
Aim and Objectives of the Research
Incentives are not just jumpstarted in provision without adequate pre-investigation of type and
approach to adopt. The aim of this research work is to determine (1) the type of incentives in operation
2

in construction firms (2) Priority accorded the incentives and (3) the incentives that could be used to
produce reinforcing effect on others.
The Variables of the Research
There are two variable groups involved: Incentives and Construction Firms.
Incentives variable group consist of financial incentives and non-financial incentives while the
Construction firms Variable group are large Scale Construction Firms (non-Indigenized firms), Small
scale Local Firms and Medium Scale Local Firm.
Conceptual Frameworks for the Research
The tool of the research pivots around the variables, the incentives and construction workers that
belong to the firm’s categories. The concept of the framework of this research is that incentives are
part of input and that input is inversely proportional to productivity and directly proportional to
output/performance. This is represented with this equation.
Productivity = Output (Performance) Input (factor of production, incentives etc)
Fir
3
Firmsi Indigenousii Non-Indigenous
Incentivesi. Financialii. Non-Financial

REVIEW OF THE PAST WORKS
General school of thought classified incentives into three broad categories: Financial, Semi-financial
and non-financial incentives, several researchers in a bid to put a paid to this line of thought have
researched extensively in this regard.
Financial, Semi-financial and Non-financial incentives schemes that could be used according to (Mc
Caffer and Harris, 2005) in Workforce Motivation includes: Profit sharing, Day work, Piece work, in
Financial incentive category, while Non-financial incentives includes Improved working conditions,
Salary increase, Relationship with others, Company policy. Semi-financial incentives on the other
hand, as state by Kelly, (2007), Mc Caffer , (2005) Amusan, (2000), Wahab, (1992) are categorized as
follows; Pension Scheme, Holidays with Pay, Restaurant facilities, Telephone bills, Expense account,
Sports facilities, Company cars, Good basic salaries and Career promotion prospects for employee.
Reinforcing this line of thought however, Fagbenle et al, (2004) presented the perception of operatives
on Non-financial factors of incentives as having demotivating effect on jobs satisfaction the like of
little production, poor supervision, lack of participation in decision making, unsafe work environment,
poor communication lack of recognition of good effort and poor treatment by superior. These were
believed to be a potential productivity enhancer if duly managed and administered.
4

RESEARCH METHODS SAMPLE SIZE AND SAMPLING TECHNIQUE
Field survey was carried out, involving samples of Thirty (30) Site Workers, selected randomly from
the population of construction firms in selected states in Nigeria, the data generated there- from is a
reflection of workers of the sampled firms. The primary data were collected with the aid of a structural
questionnaire, designed on Likert scale of 1 to 4, Very important is rated as 4, Not Important as 2,
Important as 3 and Somewhat Important as 1, they were analyzed to determine the importance index,
and the ranking in order of priority as indicated by the workers.
Secondary data were collected through Journal Articles, Conference proceedings, and Past works.
Simple Ranking method was used in ranking the incentives in order of importance and importance
index formula used to determine the priority accorded various alternatives.
TYPES OF DATA ANALYSIS TOOL
Simple percentages and Importance Index were used as the tool of analysis for the data. Based on the
derived importance index the incentives were ranked in order of importance.
RESULT AND DISCUSSION
The results are presented in Tables 1-4 and discussion on the findings as presented in the Tables
follows accordingly.
5

TABLE 1.0 AVAILABLE OF INCENTIVE (FINANCIAL) ININDIGINISED AND NON-INDIGENISED (INDIGENOUS) FIRMS
FINANCIAL OFFERED PERCENTAGE NOT OFFER PERCENTAGE
S/N INCENSIVES I N.I I N.I I N.I I N.I
1 Cash Award 8 2 72.73 20 3 8 27.27 80
2 Leave allowance 8 0 72.73 0 3 10 27.27 100
3 Luncheon 11 0 100 0 0 10 0 100
4 End of years bonus 8 0 72.73 0 3 7 27.27 70
5 Transport allowance 11 10 100 0 0 0 0 0
6 Housing allowance 4 4 36.36 100 7 6 63.64 60
7 Holiday pay 10 2 90.91 40 1 8 9.09 80
8 Over time with pay 4 10 36.36 20 7 0
63.64 0
9 Vehicle loan 11 2 100 100 0 8 0 80
10 Gratuity/Retirement Award 5 0 45.45 0 6 10 54.54 100
11 Accident Insurance 6 2 54.54 20 5 8 45.45 80
12 Pieces Rates 6 10 54.54 100 5 0 45.45 0
13 Hospital Allowance 0 9 0 90 1 1 9.09 10
14 Tools allowance 0 6 0 60 11 4 100 40
15 Long service allowance 11 0 100 0 0 10 0 100
16 Transfer allowance 5 8 45.45 80 6 2 54.54 20
6

I = Indigenised, N.I = Non-Indigenised (Indigenous).
TABLE 2.0 AVAILABLE OF INCENTIVE (NON-FINANCIAL) IN
INDIGENISED AND NON-INDIGENISED (INDIGENOUS)
NON-FINANCIAL Offered Percentages % Not Offered Percentages
S/N INCENTIVES. I N.I I N.I I N.I I N.I
1 Education/training 11 2 100 20 0 8 0 8
2 Sports facilities 11 0 100 0 0 10 0 100
3 Social facilities 8 2 72.73 20 3 8 27.27 80
4 Finish and go 2 8 18.18 80 9 2 81.82 20
5 Prompt payment of wages 10 10 90.90 100 0 0 0 0
6 Involvement in decision 6 0 54.55 0 5 10 45.45 100
Making
7 Conducive work 7 8 63.64 80 4 2 36.36 20
environment
8 Allow participation in 6 0 54.55 0 5 10 45.45 100
professional conferences
9 Good equipment 11 4 100 40 0 6 0 60
10 Sufficient break 11 9 100 90 0 1 0 10
11 Adequate safety aids 10 4 90 40 1 6 9.09 60
Indigenised N.I = non-Indigenised (Indigenous)
7

The Data in Table 1.0 and 2.0 were analysed using simple percentage. In indigenised firms
among the non-financial incentives being offered are Education Training, Sports facilities,
good equipment and sufficient break which occupies 100% this reveals its full intensity of
application of wages (90.9%) and social facilities, while the least of the incentives, is finish
and go with (18.8%).
However in indigenous firms, the chief of the incentives that are in application are prompt
payments of wages (l00%), and sufficient break which occupies (90%), while involvement
in decision making, these are all morale buster occupies the least position (20%) . Sport
facilities, allow participation in professional conferences occupies (0%).
So also, in the category of incentives not being offered in indigenised firms finish and go
netted (82%), while adequate safety aid is the least with (9%). In indigenous (non
indigenised) firms, sport facility, Allow participation in professional conferences and
Involvement in decision making takes (100%), this indicate that these ,are not being
apphed, prompt payment of wages occupies (0%), which indicates the fact that workers are
being paid promptly, which can boost workers morale.
8

TABLE 3.0 PREFERENCE OF WORKERS FOR FINANCIAL INCENTIVES
FINANCIAL V.I N.I I S.I TOTAL IMP RANK-
S/N INCENTIVES INDEX ING
4 2 3 1
1 Cash award 11 0 8 2 21 0.86 1
2 Leave allowance 11 0 7 3 21 0.81 4
3 Luncheon Voucher 10 3 5 3 21 0.76 6
4 End of year bonus 11 0 7 3 21 0.84 2
5 Transport allowance 11 0 8 4 22 0.82 3
6 Housing allowance 9 0 8 5 22 0.74 8
7 Holiday with pay 10 3 5 4 22 0.73 10
8 Overtime with pay 12 0 6 4 22 0.79 6
9 Vehicle loan 8 5 6 3 22 0.72 11
10 Gratuity/Retirement award 8 6 5 3 22 0.71 10
11 Accident insurance 11 0 8 3 22 0.81 4
12 Pieces Rates 10 3 4 4 21 0.74 9
13 Hospital allowance 5 6 5 5 21 0.76 6
14 Zools allowance 5 6 5 5 21 0.63 12
15 Long service award 4 2 7 8 21 0.54 13
16 Transfer allowance 7 4 6 4 21 0.69 11
Total 148 35 100 60 343
V.I = Very important, N.I = Not important, I = important, S.I = Somewhat Important
IMP. Index = Importance Index.
9

Imp Index = 4N4 + 3N3 + 2N2 + N1
4(N4 + N3 + N2 +N1
Where V.I – N4
N.I – N2
I - N2
S.I – N1
From Table 3.0, It could be observed that worker that worker prefers cash award relative
to other type of financial incentives thus, It was ranked first thus most preferred closely followed
with end of the year bonus and transport allowance leave allowance and accident insurance
which were ranked fourth(4th), while application of luncheon voucher, overtime with pay and
hospital allowance ranked sixth.
However, lone service award and tool allowance were the least, thus least desired.
10
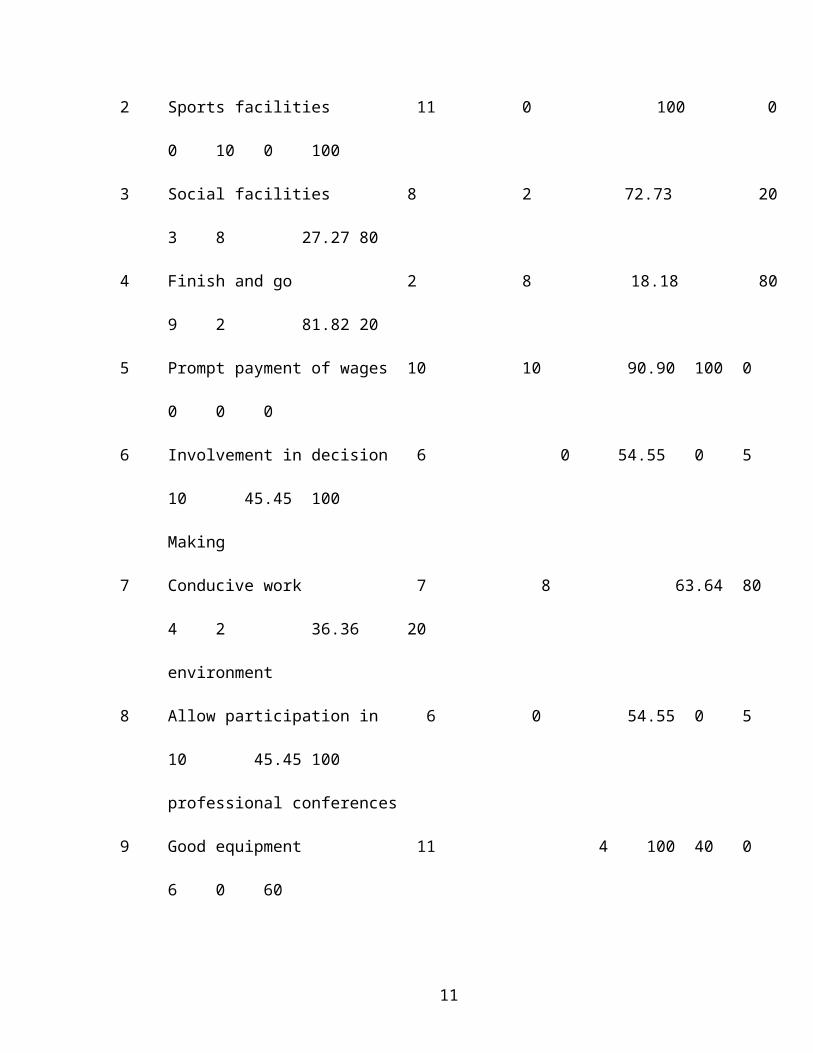
TABLE 4.0 PREFERNCE OF WORKERS FOR FINANCIAL INCETIVES
NON-FINANCIAL V.I N.I I S.I TOTAL IMP
RANK-
S/N INCENTIVES 4 2 3 1 INDEX ING
1 Education/Training 10 0 9 2 21 0.71 8
2 Sports facilities 11 6 7 3 27 0.73 4
3 Social securities 8 5 6 3 22 0.77 1
4 Finish and go 11 6 8 3 28 0.72 6
5 Prompt payment of wages 12 0 6 4 22 0.73 4
6 Involvement in decision 10 3 5 3 21 0.74 2
making
7 Conducive work environment 11 0 8 2 21 0.74 2
8 Allowing participation in 4 3 6 9 22 0.52 11
Professional conferences
9 Good equipment 10 3 4 5 22 0.71 8
10 Sufficient break 11 0 8 3 22 0.72 6
11 Adequate safety aids 7 4 6 4 21 0.72
V.I = Very important, N.I = Not important, I = important, S.I = Somewhat Important
IMP. Index = Importance Index.
V.I – Very Important
N.I – Not Important Imp. Index = 4N4 + 3N3 +2N2 +N1
I – Important
Imp. Index – Important Index 4(N4 + N3 +N2 +N1)
Where V.I = N4 N.I = N2
11

I =N3 S.I = N1
With reference to Table 4, the result of the analysis shows social securities ahead of other types of
Non-financial incentives, involvement in decision making and condusive work environment ranked
second (2nd) all these are most preferred by workers, and increases their productivity.Availablity of
sport facilities and prompt payment of wages were ranked fourth (4th), finish and go, sufficient break
are ranked sixth (6th), education training and good equipment ranked eight (8th), while Adequate safety
aids ranked tenth (10th) and Allowing participation in conferences ranked least.
DISCUSSION OF RESULTS/FINDINGS
The results of analysis indicate gradation in the types of Incentives available in Indigenized and Non-
Indigenized (Indigenous) firms. From Table 1.0 and 2.0, Non- Financial incentives like Education,
Training, Sport facilities, good equipment and sufficient break have greater percentages relative to
other.
Analysis shows that, “Finish and go” is not offered at all in indigenized firms, so also they are not
allowed to participate in professional conferences, while involvement in decision making, is not
offered at all. Most significant is the provision of Sport facilities, this is evident in the formation of
football club in names of some of the indigenized firms, this tend to create relax atmosphere around
the workers.
Critical appraisal of Table 3 and 4 reveals social security as being made priority over others eg. Health
Insurance, Accident Insurance among others, this encourages workers in taken on risks at work.
12

The financial incentives like Transport allowance, Hospital allowance, Cash awards, Overtime- with -
pay and Accident insurance have been found prevalent in foreign firms while less of these are engaged
at indigenous (non-indigenized) firms. This disparity could be accounted for margin in job satisfaction
in indigenized firm relative to their counterparts.
CONCLUSION
The objectives of the research work have been achieved. The research work has however revealed the
wide margin existing among the indigenised firms and their non-indigenized (indigenous) counterpart,
approaching, it firm incentives perspective. However, in order to boost productivity, certain of the
non-financial incentives could be used to reinforce others like social security, conducive work
environment, accident free environment, involvement in decision making and prompt payment of
wages, could be a potential high productivity inducer if well administered and managed, this was
rooted in the respondents preference for the listed incentives, thus, the management of construction
firms should consider their implementation So also the research work has highlighted various types
Incentives obtainable, and their arrangement in order of priority.
RECOMMENDATION
Based on the facts emanated from the work, the following recommendation are put forward to enhance
workers output:
1. Management of construction firms should give further encouragement to the provision of
Financial incentives such as Cash awards, Transport allowance, Overtime-with -pay,
13

2. Accident insurance, Hospital allowance since they are preferred by the workers.
3. Management of construction firms should introduce incentives like Sport facilities, Educational
facilities, involvement in decision making and participation in conferences that stimulates
sense of common purpose among workers.
4. Incentives like Overtime-with- pay should be carefully handled, as this can lead to workers
deliberate substituting official work for overtime
REFERENCES
Amusan, L.M (2000): Importance of Incentives in promoting workers performance in
Constructions Firms, in relation to the growth of the firms. These submitted to Department of
Building, University of Lagos, Akoka, Yaba.
Dielman, M, Gouong, P, Ann, M (2007): Financial an Non-Financial Incentives:
Identifying factors for job motivation in Vietnam. Journal of construction management and
Economics, 22,899-991.
Fagbenle, O.I. Adeyemi, A.Y, and Adesanya, D.A (2004): The Impact of Non-Financial
Incentives on Bricklayers productivity in Nigeria. Journal of Construction Management and
Economics 22, 890-892.
Gilson, O (2004): Exploring the influence of Workplace Trust over Health performance.
Journal of Health Economics. 10,101.
Kelly, K (2007): Feedback and Incentives on Non-Financial value drivers on managerial
Decision making. Contemporary Accounting Research. 24,2
Kaming, E. A (1997): Factors influencing craftsmen productivity in Indonesia. Journal of
14

Management. 15 (1), 21-30
Mac Caffer, R and Harris, F.(2005): Modern Construction management. Blackwell
publisher, State Avenue, Anies. Iowa.
Owolana, O. O (1997): The influence of welfare factors on site workers performance.
These submitted to Department of Building, University of Lagos, Akoka.
Robert, H. I (1972): Turnover in the Labour Force. Brooking paper. Journal of Human
Resources 3, 709-78
Wahab, K(1992): Improving productivity in construction industry Human Resources
Development. Paper presented at seminar organized by Yaba College of Technology pg 5.
Walter, E, and David, L (1974): Wage determination in the public sector. Industrial and
Labour Relation Review.
15