comparative analysis of prototype two-component systems with either bifunctional or monofunctional...
TRANSCRIPT

Molecular Microbiology (2003)
48
(1), 25–51
© 2003 Blackwell Publishing Ltd
Blackwell Science, LtdOxford, UKMMIMolecular Microbiology 0950-382X Blackwell Publishing Ltd, 200348
12551
Original Article
Alternative regulatory designs for two-component systemsR. Alves and M. A. Savageau
Accepted 28 October, 2002. *For correspondence. [email protected]; Tel. (
+
1) 530 752 1033; Fax(
+
1) 530 754 5739.
†
Present address: Department of BiomedicalEngineering, One Shields Avenue, University of California, Davis, CA95616, USA.
Comparative analysis of prototype two-component systems with either bifunctional or monofunctional sensors: differences in molecular structure and physiological function
Rui Alves
1,2,3
and Michael A. Savageau
1
*
†
1
Department of Microbiology and Immunology, University of Michigan Medical School, 5641 Medical Science Building II Ann Arbor, MI 48109–0620, USA.
2
Grupo de Bioquimica e Biologia Teoricas, Instituto Rocha Cabral, Calçada Bento da Rocha Cabral 14, 1250 Lisboa, Portugal.
3
Programa Gulbenkian de Doutoramentos em Biologia e Medicina, Departamento de Ensino, Instituto Gulbenkian de Ciencia, Rua da Quinta Grande 6, 1800 Oeiras, Portugal.
Summary
Signal transduction by a traditional two-componentsystem involves a sensor protein that recognizes aphysiological signal, autophosphorylates and trans-fers its phosphate, and a response regulator proteinthat receives the phosphate, alters its affinity towardspecific target proteins or DNA sequences and causeschange in metabolic activity or gene expression. Insome cases the sensor protein, when unphosphory-lated, has a positive effect upon the rate of dephos-phorylation of the regulator protein (bifunctionalsensor), whereas in other cases it has no such effect(monofunctional sensor). In this work we identifystructural and functional differences between thesetwo designs. In the first part of the paper we usesequence data for two-component systems from sev-eral organisms and homology modelling techniquesto determine structural features for response regula-tors and for sensors. Our results indicate that eachtype of reference sensor (bifunctional and monofunc-tional) has a distinctive structural feature, which weuse to make predictions regarding the functionality ofother sensors. In the second part of the paper we usemathematical models to analyse and compare the
physiological function of systems that differ in thetype of sensor and are otherwise equivalent. Ourresults show that a bifunctional sensor is better thana monofunctional sensor both at amplifying changesin the phosphorylation level of the regulator causedby signals from the sensor and at attenuating changescaused by signals from small phosphodonors. Cross-talk to or from other two-component systems is bettersuppressed if the transmitting sensor is monofunc-tional, which is the more appropriate design whensuch cross-talk represents pathological noise. Cross-talk to or from other two-component systems is betteramplified if the transmitting sensor is bifunctional,which is the more appropriate design when suchcross-talk represents a physiological signal. Theseresults provide a functional rationale for the selectionof each design that is consistent with available exper-imental evidence for several two-component systems.
Introduction
Two-component systems (TCS) are signal transductionmodules that exist mainly in bacteria but have also beenfound in fungi and plants (recently reviewed in Hellingwerf
et al
., 1998; see also Parkinson, 1993; Hoch and Silhavy,1995; Perego and Hoch, 1996; Schaller, 1997; Posas
et al
., 1998). Two-component systems differ from eukary-otic phosphorylation cascades like the MAP kinase cas-cade. In the former, ATP is only consumed in the first stepof the cascade to provide for autophosphorylation of ahistidine residue in the sensor, whereas in the latter, ATPis consumed at each step in the cascade to provide forphosphorylation of the protein at that step. More than 180different TCS have been identified in bacteria (Kadner,1996; see also http://www.genome.ad.jp/kegg/regulation.html) and over one thousand putative sensorsand response regulators in over one hundred organismshave had their gene sequence determined (e.g.http://www.expasy.ch/srs5/ http://www-fp.mcs.anl.gov/
~
gaasterland/genomes.html). Two-component systemsare often involved in complex circuits that exhibit enor-mous variation in design. The physiological importance of

26
R. Alves and M. A. Savageau
© 2003 Blackwell Publishing Ltd,
Molecular Microbiology
,
48
, 25–51
TCS provides strong motivation to search for underlyingdesign principles that would allow one to rationalize thevariations in design. The search is in its infancy and thereare undoubtedly many design principles that remain to bediscovered.
Here we focus on a specific example of a simpledesign principle involving TCS composed of a sensorprotein and a response regulator protein. These tradi-tional TCS can be considered the prototype for a motifthat has been elaborated on and modified in more com-plex cases that will not be considered here. [For exam-ple, we will not address cases in which there are specificaspartate phosphatases (e.g. Perego and Hoch, 1996;Blat
et al
., 1998) that are independent of the sensor pro-tein.] In some prototype cases the sensor protein, whenunphosphorylated, has a positive effect upon the rate ofdephosphorylation of the regulator protein (bifunctionalsensor) whereas in other cases it has no such effect(monofunctional sensor). For example, the TCS involvedin the regulation of chemotaxis via the CheA/CheYcascade in
Escherichia coli
has a monofunctional sensor(reviewed in Eisenbach, 1996), whereas the TCSinvolved in the regulation of osmotic pressure via theEnvZ/OmpR cascade has a bifunctional sensor (reviewedin Pratt
et al
., 1996). These bifunctional and monofunc-tional sensor proteins exhibit specific differences inmolecular structure that, by homology modelling, arefound to reoccur in many other TCS.
In the first part of this paper we use sequence data forother TCS from several organisms, together with homologymodelling techniques, to predict structural features and inturn functionality of their sensor proteins. These predictionsare confirmed in a few cases for which there is independentbiochemical or genetic evidence for functionality. Ourresults suggest an association between a sensor’s modeof action (monofunctional or bifunctional) and the structureof its ATP-binding domain. In the second part of this paperwe analyse and compare the functional effectiveness ofTCS with either bifunctional or monofunctional sensors byusing a technique known as Mathematically ControlledComparison. This technique, which is analogous to a well-controlled experiment, determines the differences in thephysiology between alternative designs that are otherwiseequivalent. This approach reveals qualitative differences(independent of specific values for the parameters of thesystems) as well as quantitative differences (statisticaltendencies when a large sample of numerical values forthe parameters is examined). We also obtain results thatdiscriminate between different types of cross-talk to andfrom TCS. Our results suggest physiological situations thatfavour each of the two sensor designs. Hence, theseresults provide a functional rationale for the selection ofeach design. Experimental evidence for several TCS isdiscussed in the light of this rationale.
Results
Abstractions of the alternative designs for a prototypeTCS are represented in Fig. 1. The unphosphorylatedsensor protein (
S
,
X
3
) becomes phosphorylated (
S*,X
1
) inresponse to changes in a physiological signal (
Q
1
,X
5
).Autophosphorylation of the sensor is achieved with con-sumption of ATP. Once phosphorylated, the sensor losesits phosphate group, either by auto-dephosphorylation(although this occurs on a time scale that is not of interesthere) or by transfer of the phosphate to an aspartateresidue in the regulator protein (
R*,X
2
) (e.g. Weiss andMagasanik, 1988; Sanders
et al
., 1989; Hsing
et al
.,1998; Jung and Altendorf, 1998; Jiang and Ninfa, 1999).This covalent modification causes changes in theresponse regulator, thereby altering its affinity towardspecific target proteins or DNA sequences (
T
), and this inturn leads to changes in metabolic activity or geneexpression. The dephosphorylation of response regula-tors (e.g. Perego and Hoch, 1996) is, in some cases,enhanced by the unphosphorylated form of the sensorprotein (bifunctional sensor, Fig. 1A). In other cases, thesensor protein lacks this ability (monofunctional sensor,Fig. 1B). In either case, the regulator protein also can bephosphorylated by other mechanisms (
Q
2
,X
6
), e.g. bysmall phosphodonors like acetyl-phosphate, but not byATP (e.g. Lukat
et al
., 1992; McCleary, 1996; Mayover
et al
., 1999). Cross-talk from the sensor proteins of othertwo-component systems has been demonstrated withpurified proteins
in vitro
(Ninfa
et al
., 1988) and with over-expressed proteins
in vivo
(Grob
et al
., 1994), but thephysiological significance of these results has been ques-tioned (Wanner, 1992).
Structure of regulators
Structures of some response regulators have beendetermined and can be used as templates to predictthe 3D structure of other regulators by homology mod-elling. The known structures of response regulatorshave receiver domains composed of alternating
a
-helices and
b
-sheets. The 3D shape resembles a barrelcomposed of five
a
/
b
sequential segments, with paral-lel
b
-sheets (blue) in the middle, surrounded by the
a
-helices (red) shown in Fig. 2. In the protein classifica-tion database SCOP (Murzin
et al
., 1995) response reg-ulators are classified within the flavodoxin-like folds. Theaspartate residue that is phosphorylated is at the tip ofone of the internal
b
-sheets, almost in the loop thatconnects it to the next
a
-helix (Fig. 2A). These struc-tural features appear to be at least partially conservedin the receiver domains of all the response regulatorswe have been able to model (Fig. 2B, Table 1). Com-parison of the experimentally determined structures of

Alternative regulatory designs for two-component systems
27
© 2003 Blackwell Publishing Ltd,
Molecular Microbiology
,
48
, 25–51
response regulators did not reveal structural featuresthat might indicate any distinction between responseregulators of TCS with either bifunctional sensors ormonofunctional sensors. Similar results also wereobtained when we examined the modelled structures forresponse regulators. Although the phosphorylationdomain of all response regulators whose structure hasbeen determined or modelled so far have similar struc-tures this does not allow us to conclude that the hun-dreds to thousands more that are as of yet unresolved
all share the same structure. There are known caseswhere protein domains with very similar sequence havevery different folds and cases where protein domainswith very different sequence have very similar folds.Table 1 may be used as a guide to indicate responseregulators that are likely to have similar structures. Inthe effort to explore the fold space of response regula-tors, it will probably be more informative to concentrateon resolving structures of response regulators that arenot present in Table 1.
Fig. 1.
Schematic representation of two-component system modules with either a bifunctional or a monofunctional sensor.A. Module with a bifunctional sensor in which
S*
phosphorylates
R and S
increases the rate of dephosphorylation of
R*
.B. Module with a monofunctional sensor in which
S*
phosphorylates
R and S
and has no direct effect on the rate of dephosphorylation of
R*
.C. Example of a TCS module with a bifunctional sensor. EnvZ is the sensor protein of the module. It is a membrane protein that responds to changes in the osmotic pressure by changing its phosphorylation state. In its phosphorylated state (EnvZ
~
P) it transfers phosphate to the response regulator OmpR. Phosphorylated OmpR represses expression of proteins that form large pores and induces expression of proteins that form small pores. Unphosphorylated EnvZ increases the rate of OmpR
~
P dephosphorylation, repressing expression of small membrane pores and derepressing expression of larger membrane pores. OmpR can also be phosphorylated by other phospho-donors, for example acetyl-P.D. Example of a TCS module with a monofunctional sensor. CheA is a membrane protein that is attached to a complex sensorial system. The system senses gradients of nutrients in the medium. When a nutritional gradient is sensed, CheA autophosphorylates and transfers its phosphate to the response regulator CheY. CheY can also be phosphorylated by other phospho-donors, for example acetyl-P. Phosphorylated CheY changes the tumbling movement of the cells into a directed motion towards the higher concentrations of nutrients by affecting flagellar proteins. Unphosphorylated CheA has no effect on CheY.Symbols:
S
(
X
3
) – unphosphorylated sensor protein;
S*
(
X
1
) – phosphorylated sensor protein;
R
(
X
4
) – unphosphorylated response regulator protein;
R*
(
X
2
) – phosphorylated regulator protein;
Q
1
(
X
5
) – signal that modulates the fraction of phosphorylated sensor;
Q
2
(
X
6
) – signal that modulates the fraction of phosphorylated regulator independent of signalling by the cognate sensor;
T
– target for the response regulator.

28
R. Alves and M. A. Savageau
© 2003 Blackwell Publishing Ltd,
Molecular Microbiology
,
48
, 25–51
Structure of sensors
Partial structures for both types of sensors also have beendetermined and can be used as templates to predict the3D structure of other sensors by homology modelling.Structures of the soluble domains of the CheA sensor(monofunctional, Fig. 3A) as well as the EnvZ sensor(bifunctional, Fig. 4A) have been determined. The CheAtransmitter domain is of the type HPt, reminiscent of thePTS phosphotransferase systems. The EnvZ sensor hasan HK transmitter domain. In the protein classification
database SCOP (Murzin
et al
., 1995) sensor histidinekinases are classified within the ROP-like folds (‘four heli-ces; dimers of identical alpha-hairpin subunits; bundle,closed, left-handed twist’). Even though the domains ofthe EnvZ sensor responsible for its bifunctionality are notdefined, an HK transmitter domain appears to be essentialfor the increase in the rate of dephosphorylation of theresponse regulator (Zhu
et al
., 2000). In the same work,Zhu
et al
. (2000) also showed that this increase is muchless for the bifunctional sensors if their catalytic ATP-binding domain is truncated from their transmitter domain.
Fig. 2.
Three-dimensional structure for the receiver domain of response regulators.A. Structure determined by X-ray crystallography for the Spo0F regulator from
Bacillus subtilis
(PDB reference identifier 1NAT).B. Structure predicted by homology modelling for the ArcA regulator from
Haemophilus influenza
.
Fig. 3.
Three-dimensional structure for the catalytic domain of monofunctional sensors.A. Structure determined by X-ray crystallography for the CheA sensor from
Thermotoga maritima
(PDB reference identifier 1B3Q).B. Structure predicted by homology modelling for the CheA sensor from
Escherichia coli
.

Alternative regulatory designs for two-component systems
29
© 2003 Blackwell Publishing Ltd,
Molecular Microbiology
,
48
, 25–51
Fig. 4.
Three-dimensional structure for the catalytic domain of bifunctional sensors.A. Structure determined by X-ray crystallography for the EnvZ sensor from
Escherichia coli
(PDB reference identifier 1BXD).B. Structure predicted by homology modelling for the putative O66656 sensor from
Aquifex aeolicus
.
Table 1.
Putative response regulator proteins that yielded a predicted structure by homology modelling techniques.
Organism SWISSPROT entry no. Name
Aeromas jandaei
P97015 P97015P97018 P97018
Agrobacteriumtumefaciens
Q07783 CHVIP07545 VIRGQ44430 NTRR
Alcaligenes eutrophus
Q44006 CZCRP29267 HOXAP94153 P94153
Anabaena sp.
P39048 PatAO87395 OrrA
Aquifex aeolicus
O66551 NtrC1AQ1792 NtrC2O66596 NtrC3O66657 PhoB
Arabidopsis thaliana
Q9ZWS8 Q9ZWS8Q9ZWS7 Q9ZWS7Q9ZWK0 Q9ZWK0Q9ZWJ9 Q9ZWJ9Q9ZWS9 Q9ZWS9O80365 O80365O80366 O80366Q9ZQJ8 Q9ZQJ8O82798 O82798
Archeoglobus fulgidus
O29221 CheBO28035 O28035O28381 O28381O28799 O28799O28887 O28887O29012 O29012O29199 O29199O29220 O29220O29800 O29800O30252 O30252
Azorhizobiumcaulonidans
P26487 FixJQ04849 NtrX
Azospirillum brasiliense
P45671 NtrC
Azobacter vinelandii
O87478 O87478
Bacillus brevis
Q44929 GTCRP54662 DEGUP52929 SP0A
Bacillus megaterium
P39486 YGD1
Bacillus subtillis
P45709 CCDBQ05522 CHEBP37583 CHEYP14204 CMA1O34534 CITTP13800 DEGUQ02115 LYTRO34804 PHOPP35163 RESDP06534 SP0AP06535 SP0BP06628 SP0FQ9R9J8 YBDGO31432 YBDJP40759 YCBBP42244 YCBLP70955 YCCHP94413 YCLJO31517 YESNP94439 YFIKO07528 YHCZO34903 YKOGO34723 YOCGP54443 YRKPO34951 YTSAO05251 YUFMO06978 YVCPQ9L4F3 YVFUO32192 YVQAO32197 YVQCP94504 YVRHP42421 YXDJP55184 YXJLP37478 YYCF
Bacillus thurigiensis
P52935 Spo0AP52942 Spo0F
Bacteroidesthetaiotamicron
Q45788 RTEAQ00936 RTEB
Bordetella pertussis
P16574 BvgA
Organism SWISSPROT entry no. Name

30
R. Alves and M. A. Savageau
© 2003 Blackwell Publishing Ltd,
Molecular Microbiology
,
48
, 25–51
O88117 RisA
Borrelia burgdorferi
O51380 O51380O51501 O51501O51517 O51517O51615 O51615O51704 O51704
Bradyrhizobiumjaponicum
P72489 RegRP10576 NTRcQ45272 NwsBO52845 PhoBP31908 HoxAP23221 FixJ
Brucella abortus
Q9ZHS1 CtrAO67996 BvrR
Brucella melitensis
Q9XDD4 Q9XDD4
Brucella suis
O31409 FEUP
Campylobacter jejuni
P71129 CheYO68795 O68795
Campobacterium divergens
Q9ZEG3 Q9ZEG3
Caulobacter crescentus
Q45976 DviKQ46020 PleDQ45994 SokA
Chlamydia trachomatis O84474 O84474Clostridium difficile P52938 Spo0AClostridium innocuum P52939 Spo0AClostridium pasteurianum P52940 Spo0AClostridium perfringens Q9XDT7 VirICyanidium caldarium P48259 P48259
P48359 P48359P28257 YC27
Cyanophora paradoxa P48259 Yc27Desulfovibrio vulgaris P33394 RRF1Enterococcus faecalis Q06239 VanRA
Q47744 VanRBErwinia amylovora Q9X3S9 HrpYErwinia carotovora O86197 EXPM
O32556 O32556a
Q9ZIN9 Q9ZIN9O08235 RPFA
Escherichia coli P03026 ARCAQ06065 ATOCB2381 B2381P30846 BAERP30843 BASRP78070 CHEBP06143 CHEYP76777 CPXRP08368 CREBP76794 DCURQ54149 DPIAP30854 EVGAP21502 FIMZP37055 HNRP14375 HYDGP77512 YFHAP76822 KDPEP10957 NARLP31802 NARPP06713 NTRCP03025 OMPRP08402 PHOBP23836 PHOPP14374 RCSBP35163 RESDP52108 RSTAP56644 SGARP77344 TORRP10940 UHPA
Organism SWISSPROT entry no. Name
P07027 UVRYP97172 YEDWP33356 YEHTP52076 YGIXP77380 YLCA
Eubacteriumacidaminophilum
O86183 NtrC
Fermiella diplosiphon O32610 O32610Q01473 RCAC
Guillardia theta O78425 YC27Haemophilus influenza P44918 ARCA
P76777 CPXRP44845 NARPP45189 PHOBP45337 YGIX
Helicobacter pylori O25337 CHEVP71403 CHEYHP0703 HP0703HP1365 HP1365O25408 O25408O25684 O25684O25918 O25918O24973 OMPR
Hyphomicrobiummethylovorum
P56644 SgaR
Klebsiela pneumoniae P03029 NTRCP45605 PHOB
Lactobacillus sake Q9ZI91 Q9ZI91Q9ZI93 Q9ZI93Q9ZI95 Q9ZI95Q9ZI97 Q9ZI97Q9ZIA0 Q9ZIA0
Lactococcus lactis Q9ZI77 Q9ZI77Listeria monocytogenes Q48767 Q48767Methylobacterium
extorquensO30796 MXABQ49121 Q49121
Mycobacterium leprae Q50136 PHOPQ4Z5G8 Q4Z5G8Q50136 YV17
Mycobacteriumtuberculosis
Q10531 COPRQ50447 MTRAMTV43 MTV43MTV44 MTV44MTV25 MTV25O50447 O50447O50806 O50806O50447 O50447O50806 O50806O53856 O53856O53894 O53894O69730 O69730P71814 PHOPQ50825 Q50825Q11156 RGX3O07776 TCRAQ50806 TRCR
Neisseria meningitides NMB0114 NMB0114NMB0595 NMB0595
Nostoc punctiforme Q51309 Q51309Plectonema boryuanum P51586 YSO1Porphyra purpurea P51358 YC27
P51343 YC29Porphyrium aerugineum P28835 YC27Proteus vulgaris P28787 NTRCProvidencia stuartii O85058 O85058
O85059 O85059Pseudoalteromonas sp. O68498 O68498Pseudomonas aeruginosa P29369 AGMR
Organism SWISSPROT entry no. Name
Table 1. Cont.

Alternative regulatory designs for two-component systems 31
© 2003 Blackwell Publishing Ltd, Molecular Microbiology, 48, 25–51
a. These response regulators are fused to sensors as part of a composite TCS consisting of a sensor-regulator protein, a sensor-regulator-sensor protein, or a sensor-regulator-sensor-regulator protein.
P23747 ALGBP26275 ALGRQ51455 CHEYQ51454 FLERQ51373 GACAP72150 GLTRO33493 O33493O54039 O54039Q04803 PFERP23620 PHOBP46384 PILGP43501 PILHQ00934 PILR
Pseudomonas aureofaciens Q9XD07 GACAPseudomonas pseudomallei O31395 IRLRPseudomonas putida Q52201 PPRAPseudomonas solanacearum O07846 O07846
O07847 O07847Q52582 VIRRQ45417 VSRD
Pseudomonas syringae Q02540 COPRQ52406 CORPQ52376 GACA
Pseudomonas tolaasii O34175 PHENa
Rhizobium leguminosarum Q9X574 CELRP10046 DCTDQ52852 POPP
Rizhobium meliloti P50350 CHVIP13632 DCTDO54063 EXSFP10577 NTRCQ52990 PHOBQ52913 Q52913P55701 Y4XI
Rhodobacter sphaeroides O33553 CHERa
O30741 DMSOO32479 DMSRP95652 P95652Q53228 REGA
Rhodobacter sulfidophilus O82868 RegARhodococcus erythropolis Q9ZNJ4 Q9ZNJ4Rickettsia prowazekii O05971 OmpRSaccaromyces cereviseae P38889 SNK7Salmonella dublin O85302 CopRSalmonella typhimurium P36556 BASR
P04042 CHEBP06657 CHEYP26319 FIMZP25852 HYDGQ56065 MVIAP41789 NTRCP41405 OMPRP06184 PGTAP14146 PHOPQ56127 RCSBQ56128 RCSCa
P96058 SIRAP22104 TCTDP27667 UHPA
Shigella dysenteriae P45606 PhoBShigella flexneri P45607 PhoBStaphylococcus aureus P96456 LYTS
Q9XCM7 YYCFStreptococcus pneumoniae Q54954 CIAR
O54138 KDPEQ9X4S8 PNPR
Organism SWISSPROT entry no. Name
Streptomyces coelicolor O50496 O50496Streptomyces hygroscopicus Q54292 Q54292Streptomyces lividans P72471 P72471
Q9X6J0 Q9X6J0Streptomyces peucetius Q54821 Q54821Streptomyces violaceoruber Q9ZA47 Q9ZA47Synechococcus sp. O68523 NBLR
P72561 P72561Q56180 PHOBP39663 SPHRQ56003 SRRB
Synechocystis sp. P72781 P72781P72790 P72790P72936 P72936P72948 P72948P73006 P73006P73036 P73036P73078 P73078P73104 P73104P73150 P73150P73175 P73175P73176 P73176P73243 P73243P73404 P73404P73927 P73927P73686 P73686P73864 P73864P73928 P73928P74014 P74014P74138 P74138P74139 P74139P74288 P74288P74294 P74294P74298 P74298P74314 P74314P74541 P74541P74626 P74626Q55733 Q55733Q55808 Q55808Q55890 Q55890Q55919 Q55919Q55933 Q55933Q55942 Q55942slr0474 RCP1S11797 S11797
Thermotoga maritima Q9WY30 Q9WY30Q9WYN0 Q9WYN0Q9WYT9 Q9WYT9Q9WZY6 Q9WZY6Q9X181 Q9X181Q56312 CHEYP74922 P74922Q9WXY0 Q9WXY0Q9WXZ0 Q9WXZ0
Thiocystis violacea P45365 P45365Vibrio cholerae O30664 O30664
O68318 O68318O85089 O85089Q9X2S6 Q9X2S6Q9ZH73 Q9ZH73
Vibrio harveyi P54299 LUXOWollinela succinogenes P74968 P74968Xanthomas campestris Q04527 Q04527Yersinia pseudotuberculosis P74991 PHOP
Organism SWISSPROT entry no. Name
Table 1. Cont.

32 R. Alves and M. A. Savageau
© 2003 Blackwell Publishing Ltd, Molecular Microbiology, 48, 25–51
We have made predictions regarding the monofunc-tional or bifunctional character of the sensor for many TCS(Table 2). In most cases, TCS have been identified bysequence similarity, and definitive biochemical evidenceregarding the monofunctional or bifunctional character oftheir sensor is lacking. Our predicted molecular modelsfor these sensors reveal a consistent difference in thefolding of their catalytic domain: the fold resembles eitherthat of the monofunctional template or that of the bifunc-tional template.
We also have tested our predictions with the TCS forwhich biochemical and genetic evidence regarding themonofunctional or bifunctional character of their sensor isavailable and homology modelling was possible (Table 3).
The sensor protein has an ATP-binding domain that con-tains a small sequence of amino acids giving rise to a 3Dstructure known as the ATP lid. This structure is highlyorganized and its position shifts, enclosing the nucleotideor releasing it from its binding site. The secondary struc-ture of the ATP lid is mostly a-helical. If the sensor isknown to be bifunctional, we find that its ATP lid resemblesthat of EnvZ (Fig. 3B). Approximately in the middle of theamino acid sequence, the a-helix fold is interrupted by asmall non-a-helical T-loop. If the sensor protein is knownto be monofunctional, we find a different folding of the ATPlid in which the three-dimensional structure resembles theATP-binding domain of CheA (Fig. 4B). In this case, thea-helical structure of the ATP lid is interrupted by two
Table 2. Putative sensor proteins that yielded a predicted structure by homology modelling techniques.
OrganismSWISSPROTentry no. Name Prediction
Agrobacteriumtumefaciens
Q07737 ChvG Bi
Aquifex aeolicus O66656 O66656 BiO66597 O66597 Bi
Arabidopsis thaliana P49333 ETR1 Lidd
O22267 O22267 Lidd
O48834 O48834 Lidd
O82798 O82798 Lidd
Archeoglobusfulgidus
O28171 O28171 Lidb
O28653 O28653 Lidb
O28800 O28800 Lidb
O28789 O28789 Lidb
O29222 O29222 MonoO30214 O30214 Lidb
Azorhizobiumcaulonidans
P26489 FixL Lidb
Q04850 NtrY Bia
Azospirillumbrasiliense
P45670 NtrB Monoe
Bacillus subtillis P29072 CheA MonoP37599 CheV Lidd
Q03069 DegM Lidb
P16497 KinA Lidb
Q08430 KinB Bia
P39764 KinC Lidb
P23545 PhoR BiP35164 ResE Lidb
Q9Z2K7 SpaF Lidb
P33113 SpaK BiP94414 YclK BiBG11896 YxjM BiO34638 YkoH BiO32193 IvqB BiO34989 YvrG Lidb
P42422 YxdK BiQ45614 YycG Bi
Bordetellabronchiseptica
P26762 BvgS Bic
Bordetellaparapertusis
P40330 BvgS Bic
Bordetella pertussis P16575 BvgS Bic
Borrelia burgdorferi Q44737 CheA MonoO51381 O51381 Lidd
Q44875 Q44875 MonoBradyrhizobium
japonicumP23222 FixL Lidb
P10578 NtrB Monoe
Calothrix viguieri O52937 O52937 BiCandida albicans O74171 O74171 Lidd
O42696 Canik1 Lidd
O42695 Casln1 Lidd
O59892 HK1 Lidd
Caulobactercrescentus
Q9X688 CckA Lidb
Q03228 DivJ BiP37894 PleC Lidb
Colletotrichumgloeosporioides
P79086 CHK1 Lidb
Deinococcus DR1175 DR1175 Bic
radiodurans DR1606 DR1606 Lidb
DR0892 DR0892 Bia
DR2416 DR2416 Lidb
DR205 DR205 Lidd
DR744 DR744 BiDictyostelium
discoideumO15763 DhkB Lidd
Q23901 HkA Lidd
O15783 O15783 Lidd
O15784 HkC Lidd
Enterococcusfaecalis
Q47745 VanSB Bi
Escherichia coli P22763 ARCB MonoQ06067 ATOS BiP30847 BAES Bia
P26607 BARA Lidd
P30844 BASS Bia
P08336 CPXA BiP08401 CREC Bia
P77644 EVGS Lidd
P14377 HYDH BiP21865 KDPD Lidb
P06712 NTRB Monoe
P23837 PHOQ Bia
P76457 RCSC Lidd
P35164 RESE Lidb
P18392 RSTB Bia
P75887 TORS Bia
P77485 YBCZ Bia
P76339 YEDV Bia
P76587 YFHK Bia
Fusarium solani O94094 FikS Lidd
Haemophilus P44578 ARCB Bia
influenza P71380 PHOR MonoP45336 YGIY Bi
OrganismSWISSPROTentry no. Name Prediction

Alternative regulatory designs for two-component systems 33
© 2003 Blackwell Publishing Ltd, Molecular Microbiology, 48, 25–51
Halobacteriumsalinarium
Q48297 CheA like Mono
Helicobacter pylori Q9ZKE9 Q9ZKE9 MonoO25153 O25153 Mono
Herbaspirillumseropedicae
O86056 O86056 Lidb
Klebsielapneumoniae
P06218 NTRB Monoe
P45608 PHOR Lidb
Lactobacillus sake Q9ZI92 Q9ZI92 BiQ9ZI94 Q9ZI94 Lidb
Lactococcus lactis Q48675 NisK BiO07382 O07382 Monoe
O07383 O07383 Bia
O07384 O07384 Bia
O07386 O07386 Bia
Listeriamonocytogenes
Q48768 CheA Mono
Mastigocladuslaminosus
O07114 O07114 Mono
Methanobacteriumthermoautotrophicum
MT902 MT902 Lidd
MT901 MT901 Lidd
O26540 O26540 Lidd
O26544 O26544 Lidb
O26545 O26545 Lidd
O26546 O26546 Lidd
O26547 O26547 Lidd
O26557 O26557 Lidd
O26648 O26648 Lidd
O26879 O26879 Lidd
O26913 O26913 Lidd
O26987 O26987 Lidd
O26988 O26988 Lidd
O27644 O27644 Lidd
O27792 O27792 Lidd
Methanococcusjannaschii
MJECL24 Spo0J Lidb
Methylobacteriumextorquens
Q49120 Q49120 Lidb
Mycobacterium leprae P54883 YV16 BiMycobacterium
tuberculosisP96372 KDPD BiMT1302 MT1302 Lidb
MT3764 MT3764 Lidb
MT490 MT490 Lidb
MT902 MT902 BiMT982 MT982 Lidb
MT600 MT600 BiO53895 O53895 Lidb
P71815 P71815 Bimtu:Rv0758 PhoR BiQ10560 Q10560 BiQ11155 Sex3 Lidb
Y902 Y902 BiNeisseria meningitides Q9K1K2 NtrX Lidd
NMB114 NMB114 BiNMB1792 NMB1792 BiNMB594 NMB594 Bi
Neurospora crassa O93851 NIK1 Lidd
Q01318 OS1P Lidd
Nostoc punctiforme Q9Z693 Q9Z693 Lidb
Proteus mirabilis O85662 RcsB Lidd
Pseudomonas Q51453 FLES Lidb
aeruginosa O34206 KINB BiQ04804 PFES Bia
P33639 PILS Bia
O68597 PIRS BiQ51453 PSEA Bia
Q51420 Q51420 Lidb
OrganismSWISSPROTentry no. Name Prediction
O34206 KINB Bia
O68596 O68596 Lidd
Pseudomonaspseudomallei
O31396 IrlS Bi
Pseudomonas putida O07831 BziP Lidb
Pseudomonassolanacearum
O07845 O07845 Bia
Pseudomonas syringae O06437 CVGS Lidd
P48027 GACS Lidb
Q9WWH5 Q9WWH5 Lidd
Q9WWH9 Q9WWH9 Lidd
Pseudomonas tolaasii Q9ZNQ1 RtpA Lidb
Pyrococcus horikoshii O58192 CheA MonoRathayibacter rathayi O34971 KdpD BiRhizobium
leguminosarumP10047 DctB Bia
P41503 NtrB Monoe
Rizhobium meliloti Q52880 CHEA MonoP13633 DCTB Bia
P10955 FIXL Lidb
Q52912 Q52912 BiRhodobacter
capsulatusP09431 NTRB Monoe
P37739 DCTS Bia
Rhodobactersphaeroides
Q53135 CheA MonoQ53163 HupS Lidd
O33554 O33554 MonoQ53162 Q53162 Bia
Rhodospirillumcentenum
Q9W2W8 Q9W2W8 Lidd
Rickettsia prowazekii Q9ZDU5 BarA BiRiftia pachyptila
symbiontO33541 RSSA Lidd
O33542 RSSB Lidd
Saccaromycescereviseae
P39928 SLN1 Lidd
Salmonella dublin O85303 CopS Bia
Salmonellatyphimurium
P36557 BASS BiP09384 CHEA MonoP41406 ENVZ BiP37461 HYDH Lidb
Q9ZHD4 Q9ZHD4 Bia
Scizosaccaromyces O14002 MCS4 Lidd
pombe O74539 O74539 Lidd
Shigella dysenteriae P45609 PHOR Lidb
Shigella flexneri O31140 EnvZ BiStaphylococcus aureus Q9XCM6 YYCG BiStreptococcus
pneumoniaeQ54955 Q54955 Bi
Streptomyceshygroscopicus
Q54293 Q54293 Bi
Synechococcus sp. Q56181 PHOR Bia
P72560 P72560 Lidb
P20169 P20169 BiP72728 P72728 Lidb
P72791 P72791 Lidb
P73025 P73025 Bia
P73035 P73035 Bia
P73184 P73184 Lidb
P73337 P73337 Lidb
P73687 P73687 Lidb
P73828 P73828 Lidd
P73865 P73865 Bia
P73926 P73926 Lidd
P73932 P73932 Lidd
P74004 P74004 Lidb
P74015 P74015 Lidb
Synechocystis sp. P74622 P74622 Bia
Q55475 Q55475 Lidb
Q55693 Q55693 Lidb
OrganismSWISSPROTentry no. Name Prediction
Table 2. Cont.

34 R. Alves and M. A. Savageau
© 2003 Blackwell Publishing Ltd, Molecular Microbiology, 48, 25–51
a. These are partially modelled structures that closely resemble the ATP-binding domain of sensor EnvZ. The resulting model has the ATP lid and a portion, but not all, of the remaining ATP binding domain of the sensor EnvZ.b.These are partially modelled structures that only slightly resemble the ATP-binding domain of sensor EnvZ. The resulting model has an ATP lid similar to that of EnvZ, but lacks the remainder of the EnvZ-like ATP binding domain.c. These are partially modelled structures obtained from a composite TCS. The resulting model has the ATP lid and a portion, but not all, of the remaining ATP binding domain of the sensor EnvZ, as in a.d. These are partially modelled structures obtained from a composite TCS. The resulting model has an ATP lid similar to that of EnvZ, but lacks the remainder of the EnvZ-like ATP binding domain, as in b.e. This is a case in which the sensor protein, NRI, is monofunctional unless it is bound with a second protein, PII, in which case it becomes bifunctional.
small non- a-helical loops, with the a-helix stretch inbetween the two loops laying almost perpendicular to theother two a-helical stretches.
Qualitative functional differences
The concentrations of the input signal molecules (X5 pri-mary input, such as a chemical gradient of nutrients in theCheA case or osmotic pressure changes in the EnvZcase, and X6 secondary input, such as acetyl phosphate)and the total concentrations of sensor protein(X7 = X1 + X3) and regulator protein (X8 = X2 + X4) aredetermined by external influences that are independent of
changes within the system. Thus, these are defined asindependent variables. By contrast, the concentrations ofthe sensor proteins (X1 phosphorylated and X3 unphos-phorylated) and of the regulator proteins (X2 phosphory-lated and X4 unphosphorylated) are determined by thevalues of the independent variables and by the system’sinternal dynamical behaviour. These variables are definedas dependent state variables in our models.
Protein synthesis and degradation occur on a time-scale that is much slower than that of phosphorylation,phosphotransfer and dephosphorylation in the TCS mod-ules. Thus, on the time scale of interest here, one canignore gene regulation and consider the total amount ofsensor protein (STotal, X7) and the total amount of regulatorprotein (RTotal, X8) to be conserved quantities (i.e.X1 + X3 = X7 = constant and X2 + X4 = X8 = constant).
Thus, when considering changes in the dependent vari-ables, in this and the following section, we need onlyemphasize the phosphorylated forms of the sensor pro-tein X1 and the regulator protein X2. The correspondingchanges in the unphosphorylated forms, X3 and X4, havethe same magnitude but opposite sign. If for any reason,one of the X species in one of the conserved pairsincreases by some amount, then the other X species ofthe pair must decrease by exactly the same amount. Forexample, amplification of signals at the level of theunphosphorylated proteins is equal to the negative of thatat the level of the phosphorylated proteins. This amplifi-cation can be measured by the logarithmic gain L(Xk,Xj)(see Experimental procedures section), which is definedas the percentage change in a dependent variable Xk in
Q55718 Q55718 Lidb
Q55783 Q55783 Lidb
Q55838 Q55838 Lidb
Q55918 Q55918 Bia
Q55932 Q55932 Bia
Q55941 Q55941 Bia
Q73276 Q73276 Lidb
Q74111 Q74111 Lidb
Q74137 Q74137 BiQ9ZAL8 Q9ZAL8 Lidd
slr 2099 slr 2099 Lidb
P39664 P39664 Lidb
Y437 Y437 Bia
OrganismSWISSPROTentry no. Name Prediction
Thermotoga maritima Q56310 CheA MonoP74923 P74923 Lidb
Q9WYN1 Q9WYN1 BiQ9WZV7 Q9WZV7 BiQ9X180 Q9X180 Lidb
Vibrio alginolyticus P19906 NtrB Monoe
Vibrio cholerae O30663 FlrB Lidb
O68317 O68317 BiO85090 PhoR Bi
Vibrio harveyi P54302 LUXQ Lidd
P54301 LUXN Lidd
Xanthomas campestris P49246 RpfC Lidd
OrganismSWISSPROTentry no. Name Prediction
Table 2. Cont.
Table 3. Sensor proteins observed and predicted, on the basis ofhomology modelling techniques, to be either monofunctional orbifunctional.
Sensorname
Functionality
ReferencePredicted Observed
CheA(E. coli)
Mono Mono Ninfa et al. (1991)
EnvZ(E. coli)
Bi Bi Kanamaru et al. (1989)
KdpD(E. coli)
Bi Bi Jung et al. (1997)
VanSA(E. faecalis)
Bi Bi a Wright et al. (1993)
PhoR(B. subtilis)
Bi Bi b Shi et al. (1999)
a. Inferred from gene expression results.b. Shows an increase in the rate of dephosphorylation only for thesoluble domain of PhoR in the presence of ADP or ATP.

Alternative regulatory designs for two-component systems 35
© 2003 Blackwell Publishing Ltd, Molecular Microbiology, 48, 25–51
response to a one per cent change in an independentvariable Xj. Thus, L(X3,Xj) = - L(X1,Xj) and L(X4,Xj) =-L(X2,Xj), where Xj is any independent variable of themodel. Similarly, the parameter sensitivities in the levelsof the unphosphorylated proteins in response to parame-ter fluctuations are equal to the negative of those in thelevels of the phosphorylated proteins. These parametersensitivities can be measured by the expression S(Xk,pj)(see Experimental procedures section), which is definedas the percentage change in a dependent variable Xk inresponse to a one per cent change in a parameter pj.Thus, S(X3,pj) = - S(X1,pj) and, S(X4,pj) = - S(X2,pj) wherepj is any parameter of the model.
The kinetic behaviour of the models in Fig. 1 can bedescribed by a system of differential equations [Equations(1) (2) and (2’)], as outlined in the Experimental proce-dures section. Solving these equations allows us to quan-tify and to compare the systemic properties of thealternative designs shown in Fig. 1 based on the followingfunctional considerations.
A signal transduction cascade should have a set oflarge logarithmic gains to amplify physiological signalsand another set of small logarithmic gains that attenuatepathological noise. The cascade should be robust, i.e. itshould function reproducibly despite perturbations in thevalues of the parameters that define the structure of thesystem. This is, by definition, equivalent to saying that theparameter sensitivities should, in general, be as low aspossible. The steady state of the system should be stableand have a sufficient margin of stability, such that it willnot become unstable when subjected to random fluctua-tions in the parameters of the system. If the margin ofstability is small, a small change in a parameter of thesystem (e.g. ionic strength of the medium) may destroythe possibility of a stable steady state and make the sys-tem dysfunctional. Finally, the system should respondquickly to changes in its environment because otherwisethe system is unlikely to be competitive in rapidly changingenvironments.
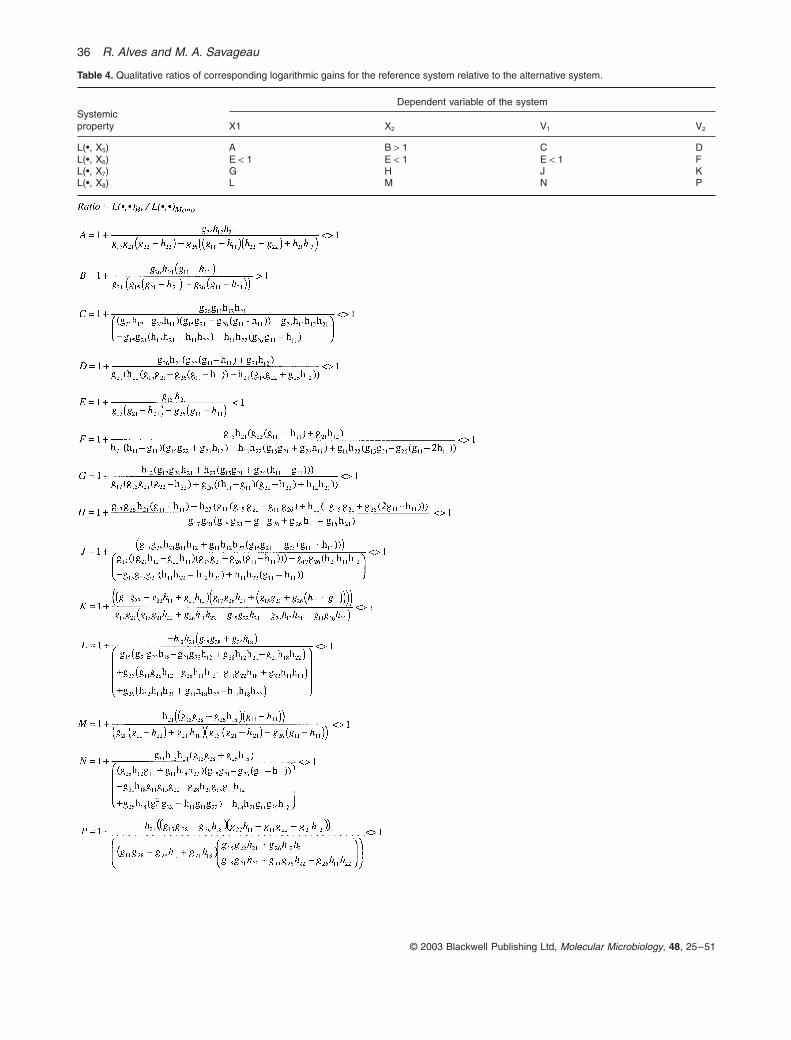
These properties, for each of the alternative models, arequantified and then compared by taking the ratio of thevalue for a property in the reference system (bifunctionalsensor) to the corresponding value in the alternative sys-tem (monofunctional sensor). As we have analyticalexpressions for the steady-state properties, we can deter-mine in some cases whether the ratio is always equal toone, less than one, or greater than one, independent ofparameter values. With this approach, we have obtainedthe following qualitative results for steady-state concentra-tions and the amplification factors.
The concentrations (and rates of change) of the corre-sponding state variables in the two models can always bethe same (see Calculating the constraints for externalequivalence). Changes in the secondary signal X6 are
amplified less in each of the corresponding state variables[i.e. each L(Xi,X6) for i = 1, 2, 3 and 4] with the bifunctionaldesign. Similarly, these changes are amplified less in theflux through each of the sensor pools [i.e. L(Vi,X6) for i = 1and 3] with the bifunctional design. This is shown in Table 4by the ratio E, which is always less than 1. On the otherhand, amplification of the phosphorylated regulator X2 inresponse to a percentage change in the primary inputsignal X5 [i.e. L(X2,X5)] is always greater with the bifunc-tional design. This is shown in Table 4 by the ratio B, whichis always greater than 1.0. In all other cases, the differ-ences between the amplification factors of the alternativedesigns are dependent upon the specific numerical valuesof the parameters and can not be determined analyticaly.
Quantitative functional differences
Although some functional differences between TCS withthe alternative sensor designs are analyticaly indetermi-nate, numerical comparisons can be used to determinequantitative differences in function, and thus to establishstatistical tendencies in the differences. With thisapproach we have obtained the following quantitativeresults for signal amplification, robustness, margin of sta-bility, response time, and phosphorylation/dephosphoryla-tion ratio.
Numerical results for signal amplification of concentra-tions are shown in Fig. 5 and described in detail in thenext paragraph. The data are represented as Density ofRatios plots for moving medians (as described in Experi-mental procedures). The moving median of the ratio forthe bifunctional design (reference) to monofunctionaldesign (alternative), shown on the vertical axis, is a func-tion of the moving median of the amplification for thebifunctional design, shown on the horizontal axis. [In sym-bolic terms, <L(Xi,Xj)Bi/L(Xi,Xj)Mono> is plotted as a functionof <L(Xi,Xj)Bi>, where Xj indicates an independent variable,Xi a dependent variable and the angular brackets indicateaverages.
The pattern of responses exhibited by the sensor pro-tein is as follows. Overall, values for the amplification ofthe phosphorylated sensor signal X1 in response to apercentage change in the primary input signal X5
[L(X1,X5)] are similar in both designs. This is shown by thecurve in Fig. 5A, which remains about 1.0. Values for theamplification of the phosphorylated sensor signal X1 inresponse to a percentage change in the secondary inputsignal X6 [L(X1,X6)] are also smaller in the bifunctionaldesign (the curve remains below 1.0 in Fig. 5B). On theother hand, values for the amplification of the phosphory-lated sensor signal X1 in response to a percentage changein either the total concentration of sensor protein X7
[L(X1,X7)] or the total concentration of regulator proteinX8 [L(X1,X8)] are similar for the two designs (curves
36 R. Alves and M. A. Savageau
© 2003 Blackwell Publishing Ltd, Molecular Microbiology, 48, 25–51
Table 4. Qualitative ratios of corresponding logarithmic gains for the reference system relative to the alternative system.
Systemicproperty
Dependent variable of the system
X1 X2 V1 V2
L(•, X5) A B > 1 C DL(•, X6) E < 1 E < 1 E < 1 FL(•, X7) G H J KL(•, X8) L M N P

Alternative regulatory designs for two-component systems 37
© 2003 Blackwell Publishing Ltd, Molecular Microbiology, 48, 25–51
remain very close to the y-axis value of 1.0 in Fig. 5C andD), except when signal amplification values are close tozero.
The regulator protein exhibits a different pattern ofresponses. Values for the amplification of the phosphory-lated regulator signal X2 in response to a percentagechange in the primary input signal X5 [L(X2,X5)] are greaterfor the bifunctional design as can be seen by the curve inFig. 5E, which is always above 1. For low median valuesof the gain L(X2,X5) in the bifunctional design, the differ-ences in gain can be as large as 100%. For high medianvalues, the differences are around 30%, with the gain inthe bifunctional design being higher. This means that, forexample, the bifunctional design will provide for largerchanges in gene expression than would a monofunctionaldesign for the same amount of osmotic pressure changein the EnvZ/OmpR system. Values for the amplification ofthe phosphorylated regulator signal X2 in response to apercentage change in the secondary input signal X6
[L(X2,X6)] are smaller in the bifunctional design (Fig. 5F).On the other hand, values for the amplification of thephosphorylated regulator signal X2 in response to a per-centage change in the total concentration of sensor pro-tein X7 [L(X2,X7)] can be larger in either alternativedepending on the parameter values (Fig. 5G). If the loga-rithmic gain L(X2,X7) in the bifunctional design is negative,then the amplification in the bifunctional design is smaller(in absolute value) as can be seen in Fig. 5G. If the log-arithmic gain in the bifunctional design is positive, thenthe amplification in the monofunctional design is smaller.Values for the amplification of the phosphorylated regula-tor signal X2 in response to a percentage change in thetotal concentration of regulator protein X8 [L(X2,X8)] alsocan be larger in either alternative depending on theparameter values (Fig. 5H). If the logarithmic gain L(X2,X8)in the bifunctional design is negative, then the amplifica-tion in the bifunctional design is larger (in absolute value);if the logarithmic gain in the bifunctional design is positive,then the amplification in the monofunctional design islarger. Even though it seems that this shift occurs at val-ues of about -0.3 for L(X2,X8) in this case, the actualvalues are about zero. Because of the moving averagingtechnique there are residual ratios that keep the medianabove 1.0. When the values for L(Xi,Xi) change sign, thecurves tend to exhibit a dip, which is a consequence ofthe moving average technique when positive and negativevalues are being averaged.
Numerical results for signal amplification in flux areshown in Fig. 6. The pattern of responses exhibited by fluxthrough the pools of sensor protein is as follows. Valuesfor the amplification of the flux V1 in response to a per-centage change in the primary input signal X5 [L(V1,X5)]can be larger in either alternative depending on theparameter values (Fig. 6A). If the logarithmic gain L(V1,X5)
Fig. 5. Comparison of signal amplification factors for concentrations in two-component systems with either a bifunctional or a monofunc-tional sensor. The logarithmic gains are compared in a density of ratios plot using moving medians (see Numerical analysis). On the x-axis are average values of a given logarithmic gain for the bifunc-tional design. On the y-axis are average values for the ratio of that logarithmic gain in the bifunctional design (Fig. 1A) over the corre-sponding logarithmic gain in the monofunctional design (Fig. 1B).A. Logarithmic gain in phosphorylated sensor protein X1 with respect to changes in the primary input signal X5.B. Logarithmic gain in X1 with respect to changes in the secondary input signal X6.C. Logarithmic gain in X1 with respect to changes in the total amount of sensor, X7.D. Logarithmic gain in X1 with respect to changes in the total amount of regulator, X8.E. Logarithmic gain in phosphorylated regulator protein X2 with respect to changes in the primary input signal X5.F. Logarithmic gain in X2 with respect to changes in the secondary input signal X6.G. Logarithmic gain in X2 with respect to changes in the total amount of sensor, X7.H. Logarithmic gain in X2 with respect to changes in the total amount of regulator, X8.

38 R. Alves and M. A. Savageau
© 2003 Blackwell Publishing Ltd, Molecular Microbiology, 48, 25–51
in the bifunctional design is negative, then the amplifica-tion in the bifunctional design is larger (in absolute value);if the logarithmic gain in the bifunctional design is positive,then the amplification in the monofunctional design islarger. Values for the amplification of the flux V1 inresponse to a percentage change in the secondary inputsignal X6 [L(V1,X6)] are smaller in the bifunctional design(Fig. 6B). Values for the amplification of the flux V1 inresponse to a percentage change in the total concentra-tion of sensor protein X7 [L(V1,X7)] in the monofunctionaldesign are always larger in absolute value (Fig. 6C). Val-ues for the amplification of the flux V1 in response to apercentage change in the total concentration of regulatorprotein X8 [L(V1,X8)] can be larger in either alternativedepending on the parameter values (Fig. 6D). If the loga-rithmic gain L(V1,X8) in the bifunctional design is negative,then the amplification in the monofunctional design islarger (in absolute value); if the logarithmic gain in thebifunctional design is positive, then the amplification in thebifunctional design is larger.
The pattern of responses exhibited by the flux throughthe pools of regulator protein is as follows. Values for theamplification of the flux V2 in response to a percentagechange in the primary input signal X5 [L(V2,X5)] can belarger in either alternative depending on the parametervalues (Fig. 6E). If the logarithmic gain L(V2,X5) in thebifunctional design is negative, then the amplification inthe bifunctional design is larger (in absolute value); if thelogarithmic gain in the bifunctional design is positive, thenthe amplification in the monofunctional design is larger.Even though it seems that this shift occurs at values ofabout -0.8 for L(V2,X5) in this case, the actual values areabout zero. Because of the moving averaging techniquethere are residual ratios that keep the median above 1.0.Values for the amplification of the flux V2 in response to apercentage change in the secondary input signal X6
[L(V2,X6)] can be larger in either alternative depending onthe parameter values (Fig. 6F). If the logarithmic gainL(V2,X6) in the bifunctional design is negative, then theamplification in the monofunctional design is larger (inabsolute value); if the logarithmic gain in the bifunctionaldesign is positive, then the amplification in the bifunctionaldesign is larger. Values for the amplification of the flux V2
in response to a percentage change in the total concen-tration of sensor protein X7 [L(V2,X7)] is on average largerin the monofunctional design (Fig. 6G). Values for theamplification of the flux V2 in response to a percentagechange in the total concentration of regulator protein X8
[L(V2,X8)] can be larger in either alternative depending onthe parameter values (Fig. 6H). If the logarithmic gainL(V2,X8) in the bifunctional design is negative, then theamplification in the monofunctional design is larger (inabsolute value); if the logarithmic gain in the bifunctionaldesign is positive, then the amplification in the bifunctional
Fig. 6. Comparison of signal amplification factors for fluxes in two-component systems with either a bifunctional or a monofunctional sensor. The logarithmic gains are compared in a density of ratios plot using moving medians (see Numerical analysis). On the x-axis are average values of a given logarithmic gain in the bifunctional design. On the y-axis are average values for the ratio of that logarithmic gain in the bifunctional design (Fig. 1A) over the corresponding logarithmic gain in the monofunctional design (Fig. 1B).A. Logarithmic gain in flux through the pool of phosphorylated sensor protein V1 with respect to changes in the primary input signal X5.B. Logarithmic gain in V1 with respect to changes in the secondary input signal X6.C. Logarithmic gain in V1 with respect to changes in the total amount of sensor, X7.D. Logarithmic gain in V1 with respect to changes in the total amount of regulator, X8.E. Logarithmic gain in flux through the pool of phosphorylated regu-lator protein V2 with respect to changes in the primary input signal X5.F. Logarithmic gain in V2 with respect to changes in the secondary input signal X6.G. Logarithmic gain in V2 with respect to changes in the total amount of sensor, X7.H. Logarithmic gain in V2 with respect to changes in the total amount of regulator, X8.

Alternative regulatory designs for two-component systems 39
© 2003 Blackwell Publishing Ltd, Molecular Microbiology, 48, 25–51
design is larger. Even though it seems that this shiftoccurs at values of about 0.5 for L(V2,X8) in this case, theactual values are about zero. Again, because of the mov-ing averaging technique there are residual ratios that keepthe median above 1.0. When the values for L(Vi,Xj) changesign, the curves tend to exhibit a dip, which is a conse-quence of the moving average technique when positiveand negative values are being averaged. The dip for thelogarithmic gains in flux tends to be more pronouncedthan for the logarithmic gains in concentration.
Numerical results for robustness of the alternativedesigns are shown in Fig. 7. The data for aggregateparameter sensitivities are represented as Density ofRatios plots for moving medians. The moving median ofthe ratio for the bifunctional design (reference) to mono-functional design (alternative) is on the vertical axis, andthe moving median of aggregate parameter sensitivity forthe bifunctional design is on the horizontal axis. [In sym-bolic terms, <S(Xi)Bi/S(Xi)Mono> as a function of <S(Xi)Bi>,or <S(Vi)Bi/S(Vi)Mono> as a function of <S(Vi)Bi>, where Xi
indicates a dependent concentration, Vi a dependent fluxand the angular brackets indicate averages.] On average,the aggregate sensitivities of the sensor signals (Fig. 7Aand C) are less in the bifunctional design than in themonofunctional design when the values for the parametersensitivities are low, whereas the aggregate sensitivities
of the regulator signals (Fig. 7B and D) are greater in thebifunctional design than in the monofunctional designunder these conditions. The aggregate sensitivities of allthe signals are lower in the monofunctional design whenthe values for the parameter sensitivities are high, whichis the less physiologically relevant case. However, in allcases, the average differences in corresponding sensitiv-ities between the monofunctional and the bifunctional sys-tem are very small. In the case of the sensor signals, thisdifference is negligible and the median ratio is for allpractical purposes 1.0.
Numerical results for the stability margins of the alter-native designs are shown in Fig. 8. These magnitudes,which correspond to the two critical Routh Criteria forstability, provide a measurement for the amount of per-turbation that the system will tolerate before the steadystate becomes unstable (see the Experimental proce-dure section). The bifunctional design has a larger mar-gin of stability with respect to the first of the criticalRouth criteria when this margin is small, which is whenthis margin is most important. When this marginbecomes large, and its value becomes less important,the two designs have essentially the same value(Fig. 8A). The bifunctional design also has a larger mar-gin of stability with respect to the second of the criticalRouth criteria (Fig. 8B).
Fig. 7. Comparison of robustness for two-com-ponent systems with either a bifunctional or a monofunctional sensor. The aggregate param-eter sensitivities (see Steady-state solution and key systemic properties) are compared in a density of ratios plot using moving medians. On the x-axis are average values of a given aggre-gate sensitivity in the bifunctional design. On the y-axis are average values for the ratio of that aggregate sensitivity in the bifunctional design (Fig. 1A) over the corresponding aggre-gate sensitivity in the monofunctional design (Fig. 1B).A. Aggregate sensitivity of phosphorylated sen-sor protein X1.B. Aggregate sensitivity of phosphorylated reg-ulator protein X2.C. Aggregate sensitivity of flux through the pool of phosphorylated sensor protein V1.D. Aggregate sensitivity of flux through the pool of phosphorylated regulator protein V2.

40 R. Alves and M. A. Savageau
© 2003 Blackwell Publishing Ltd, Molecular Microbiology, 48, 25–51
Numerical results for the temporal responsiveness ofthe alternative designs are shown in Fig. 9. Theresponse time, t, is defined as time required for thereturn to a steady state following a perturbation (seethe Experimental procedures section). The data arerepresented as Density of Ratios plots for the raw data(Fig. 9A) and for moving medians (Fig. 9B). The ratio forthe bifunctional design (reference) to monofunctionaldesign (alternative) is on the vertical axis, and theresponse time for the bifunctional design is on the hori-zontal axis. [In symbolic terms, <tBi /tmono> as a functionof <tBi>, where t is the response time and the angularbrackets indicate averages.] On average, the responsetime is slightly less for the bifunctional design whenresponse times are small, but the differences betweendesigns become insignificant as the response timesbecome larger.
In this work we allowed the sensor and regulator eachto have steady-state operating levels of phosphorylationbetween 0% and 100%. In practice, the random values forthe ratios ƒ31 = - X10 / X30 and ƒ42 = - X20 / X40 in ourensemble range between -0.0000001 and -999. Theamplification properties of the TCS with a bifunctionaldesign are not influenced to any large extent by the
steady-state operating value for phosphorylation of eitherthe sensor or the regulator (data not shown), althoughmore significant changes can be seen in some caseswhen the operating value for phosphorylation drops tonear 0%.
Discussion
In this work we examined alternative designs for the sen-sor proteins of prototype TCS. A bifunctional sensor ischaracterized by two functions: (i) when phosphorylated,the sensor transfers its phosphate group to the responseregulator; (ii) when unphosphorylated the sensorincreases the dephosphorylation rate of the response reg-ulator. A monofunctional sensor has only the first of thesefunctions. Our results have identified both structural andfunctional attributes of these alternative designs.
Structural differences
The results of our homology modelling show a highlyconserved structural feature (‘ATP lid’) that appears to bedistinctive for each of the alternative designs (Figs 3 and4). Whether or not the characteristic ATP lid is responsible
Fig. 8. Comparison of stability margins for two-component systems with either a bifunctional or a monofunctional sensor. The stability margins determined by the two critical Routh criteria for local stability (see Steady-state solution and key systemic properties) are compared in a density of ratios plot using moving medians. On the x-axis are average values of a given stability margin in the bifunctional design. On the y-axis are average values for the ratio of that stability margin in the bifunctional design (Fig. 1A) over the corresponding stability margin in the mono-functional design (Fig. 1B).A. First critical Routh criterion.B. Second critical Routh criterion.
Fig. 9. Comparison of response times for two-component systems with either a bifunctional or a monofunctional sensor. The response times (see Steady-state solution and key systemic properties), t, are compared in a density of ratios plot. On the x-axis are values of response times for the bifunctional design. On the y-axis are values for the ratio of response times for the bifunctional design (Fig. 1A) over the response times for the monofunctional design (Fig. 1B).A. Raw data.B. Average values in a moving median plot.

Alternative regulatory designs for two-component systems 41
© 2003 Blackwell Publishing Ltd, Molecular Microbiology, 48, 25–51
for the bifunctionality of a sensor is unknown, but recentexperiments suggest that this part of the sensor has a rolein enhancing the rate of dephosphorylation of theresponse regulator for EnvZ/OmpR (Zhu et al., 2000) andfor NRII-PII/NRI (Pioszak and Ninfa, 2003). An experimentthat exchanges the ATP lid of the EnvZ and CheA sensorproteins and assays the resulting proteins for bifunctionalbehaviour would help to resolve this issue. Whether thisstructural feature is responsible for the bifunctionality of asensor or not, our rigorous comparative analysis of phys-iological function demonstrates that there is a clear basisfor selection of monofunctional and bifunctional sensorproteins.
Functional differences
Protein levels for the majority of TCS are regulated on aslow time-scale by mechanisms affecting transcription.Regulation by these mechanisms, which have been stud-ied elsewhere (Hlavacek and Savageau, 1995, 1996,1997), is beyond the scope of this article, which focuseson the more rapid time scale of regulation within the TCS.Nevertheless, the results for the logarithmic gains in con-centrations (Fig. 5C, D, G and H) and fluxes (Fig. 6C, D,G and H) with respect to changes in the total concentra-tion of sensor (X7) and regulator (X8) provide some insightregarding the influence of changing protein levels.
The mathematically controlled comparisons in our studyshow that monofunctional and bifunctional designs forsignalling within TCS differ on the basis of several criteriafor functional effectiveness. The model with a bifunctionalsensor has higher signal amplification in response tochanges in the primary signal (Fig. 5E), X5, as repre-sented by L(X2,X5). It has lower signal amplification inresponse to changes in the secondary signal (Fig. 5F), X6,as represented by L(X2,X6). If X5 is considered to be thephysiological signal for a TCS, then this implies that themodel with the bifunctional sensor is more effective inresponding to this signal. Robustness, except in the caseof V2, tends to be similar when the values for the param-eter sensitivities are low (Fig. 7). Although, robustness forall the variables is greater in the bifunctional design whenthe values for the parameter sensitivities are high, sys-tems with high parameter sensitivities are less likely to bebiologically significant. The margins of stability for thesteady state, as measured by both Routh criteria, arelarger for the bifunctional design (Fig. 8). Response timesare similar for the alternative designs (Fig. 9). These func-tional differences have implications for cross-talk amongTCS.
Cross-talk to and from a TCS
The specificity of sensors and regulators is not absolute.
Regulator proteins can respond to signals other thanthose transmitted by their cognate sensor, and sensorproteins can transmit signals to destinations other thantheir cognate regulator. In some cases, this cross-talkmight be undesirable noise that should be minimized.Sensors that are homologous to the cognate sensor butare involved in distinct physiological responses may rep-resent such a case. In other cases, this cross-talk mightrepresent the physiological co-ordination of several pro-cesses that needs to be enhanced. Chemotaxis repre-sents such a case, where the state of cellular metabolismneeds to be taken into account before the cell migratestowards nutrient sources. It is less important for a cell thatis already well fed to spend energy in migrating towardsnutrients than if the cell is starving. The results in theprevious sections allow us to identify designs that areappropriate for dealing with cross-talk in each of thesecontexts.
Cross-talk to a TCS module is represented by any sec-ondary input signal (Q2) coming from sources other thanthe regulator’s cognate sensor that causes a change inphosphorylation level of the module’s response regulator(R*). The schematic diagrams in Fig. 1 explicitly repre-sent the case in which the secondary signal is a smallphosphodonor like acetyl-phosphate, but not ATP. Cross-talk in this case is less amplified by the module with abifunctional sensor (Fig. 1A) than by the module with themonofunctional sensor (Fig. 1B). Thus, the design with abifunctional sensor is better at attenuating the cross-talkto the module, and this is appropriate when the cross-talkis physiologically undesirable. Conversely, the designwith a monofunctional sensor is better at amplifying thecross-talk to the module, and this is appropriate when thecross-talk is a relevant physiological signal. A TCS with adesign that could change from bifunctional, when only itsprimary signal conveyed physiologically relevant informa-tion, to monofunctional, when other signals should alsobe considered, would have an advantage in dealing withmore complex situations in which there is a changingrequirement for suppression or integration of secondarysignals. (The NRI/NRII system of E. coli, which will bediscussed below, may be one such example.)
Cross-talk to the module also can result from secondaryinput signals originating from other sensors. There areseveral formal possibilities shown schematically in Fig. 10.The analysis of these possibilities yields results similar tothose already described (data not shown). A controlledcomparison of the alternatives in Fig. 10A and B showsthat a bifunctional design for the cognate sensor (S1) isbetter at enhancing amplification of the regulator (R)response to the primary input signal (Q1) while it is betterat suppressing noise represented by the secondary inputsignal (Q2). A controlled comparison of the alternatives inFig. 10C and D shows a similar result. Thus, regardless

42 R. Alves and M. A. Savageau
© 2003 Blackwell Publishing Ltd, Molecular Microbiology, 48, 25–51
of the design for the non-cognate sensor, a bifunctionaldesign for the cognate sensor results in better amplifica-tion of the primary input signal and better suppression ofthe secondary input signal. A controlled comparison of thealternatives in Fig. 10B and D shows that a bifunctionaldesign for the non-cognate sensor (S2) results in betteramplification of the regulator (R) response to the second-ary input signal (Q2). Taken together, these results sug-gest that the design in Fig. 10C is preferred for enhancingamplification of the primary input signal while promotingattenuation of the secondary input signal. However, thedesign in Fig. 10A is preferred for enhanced cross-talk toachieve a more balanced integration of the two inputsignals.
Cross-talk from the module occurs when the cognatesensor transmits its signal to a non-cognate regulatorprotein. Again, there are several formal possibilities,shown schematically in Fig. 11, that we have analysed(data not shown). A controlled comparison of the alterna-tives in Fig. 11A and B shows that the design with asensor that is bifunctional with respect to its cognate reg-ulator (R1) is better in two respects. It is better at amplify-ing the signal that is transmitted from the input Q to theprimary output (T1) and better at suppressing the signalthat is transmitted to the secondary output (T2). A con-trolled comparison of the alternatives in Fig. 11C and Dshows a similar result. Thus, regardless of the designwith respect to the non-cognate regulator, the design with
a sensor that is bifunctional with respect to its cognateregulator is better at amplifying the signal transmitted tothe primary output and at suppressing that to the sec-ondary output. A controlled comparison of the alterna-tives in Fig. 11B and D shows that the design with asensor that is bifunctional with respect to the non-cog-nate regulator (R2) is better at amplifying the signal trans-mitted from the input Q to the secondary output (T2).Taken together, these results suggest that the design inFig. 11C is more effective in suppressing cross-talk fromthe module to the response regulators of other TCS.However, the design in Fig. 11A is more effective inenhanced cross-talk to achieve a more balanced set ofresponse in both regulators.
Examples
The results in the previous sections suggest a rationalefor selection of the two alternative sensor designs basedon the physiology of the system in which the TCS isembedded. Assume that the output of the module is thephosphorylation level of the response regulator (X2).Phosphorylation levels change as a response to changesin the input signals X5 and X6. Usually, X5 is thought of asthe input signal and X6 is not considered. However, X6 isalso an input signal because it changes the phosphoryla-tion level of the response regulator. Thus, we can considerthe TCS in Fig. 1 as integrators of two signals, X5 and X6.
Fig. 10. Cross-talk to a common response reg-ulator from two distinct sensor proteins.A. Both sensors are bifunctional with respect to the common response regulator.B and C. One sensor is bifunctional and the other is monofunctional with respect to the common response regulator.D. Both sensors are monofunctional with respect to the common response regulator. See text for discussion.

Alternative regulatory designs for two-component systems 43
© 2003 Blackwell Publishing Ltd, Molecular Microbiology, 48, 25–51
When compared to the TCS with a monofunctional sensor,those with a bifunctional sensor maximize amplification ofthe signal X5 and minimize amplification of the signal X6.On the other hand, the TCS with a monofunctional sensormaximize X6 amplification and minimize X5 amplificationwhen compared to otherwise equivalent TCS with abifunctional sensor. Thus, in systems for which X5 is themajor signal and the influence of other signals (repre-sented by X6) needs to be minimized, the design with abifunctional sensor should be selected; in systems forwhich the other signals need to be taken into account andintegrated, the design with a monofunctional sensorshould be selected. We will clarify these notions with afew examples.
The regulation of pore size in bacteria by changes inthe osmolarity of the medium is mediated by a TCS witha bifunctional sensor. The pores in their cell membraneare composed of two different proteins. Subunit OmpFforms large pores, whereas OmpC forms smaller pores.EnvZ (X1) is a membrane protein and the sensor for a TCSmodule. Changes in the osmolarity of the medium lead tochanges in the EnvZ protein. In a high osmolarity medium,EnvZ increases its autophosphorylation rate. This in turnleads to a transfer of phosphate from EnvZ to theresponse regulator of the TCS, OmpR (X2). OmpR is atranscription factor that binds DNA either in its phospho-rylated (high affinity) or unphosphorylated (low affinity)form. In its phosphorylated form, OmpR dimerizes toincrease its interaction with DNA. This leads to increasedexpression of OmpC and to decreased expression of
OmpF (Pratt et al., 1996 for a review). The sensor in thissystem, EnvZ, is bifunctional (Igo et al., 1989), which canbe rationalized in terms of our results as follows. Pore sizeshould be determined exclusively by differences in osmo-larity between the intracellular and the extracellularmedium. If pore size were to be affected by other signals,such as changes in the levels of small phosphodonors,then osmotic balance could not be maintained and cellviability would be diminished. Thus, the bifunctional sen-sor design used in this TCS module is the one that max-imizes amplification of changes in the osmotic pressure(X5) and minimizes amplification of changes in other spu-rious signalling processes (X6).
The VanS/VanR module in Enterococus faecalis isanother example of a TCS with a bifunctional sensor(Wright et al., 1993, Arthur et al., 1997). This TCS regu-lates synthesis of proteins responsible for the organism’sresistance to antibiotics. Again, as the function of theproteins is to confer resistance to antibiotics, it should notbe activated by other signals, because this would unnec-essarily increase the protein burden of the cell. Thus,selection of the design with a bifunctional sensor is to beexpected.
Chemotaxis in E. coli is mediated by a TCS module witha monofunctional sensor (see Eisenbach, 1996; for areview). In this case, the CheA sensor protein (X1) trans-fers its phosphate to either of two response regulators,CheY or CheB (X2). CheB is responsible for desensitizingthe cell to chemical gradients, whereas CheY is respon-sible for changing the rate of cell tumbling so as to pro-
Fig. 11. Cross-talk from a common sensor pro-tein to two distinct response regulator proteins.A. The sensor is bifunctional with respect to both response regulators.B and C. The sensor is bifunctional with respect to one response regulator and monofunctional with respect to the other.D. The sensor is monofunctional with respectto both response regulators. See text fordiscussion.

44 R. Alves and M. A. Savageau
© 2003 Blackwell Publishing Ltd, Molecular Microbiology, 48, 25–51
mote movement towards favourable concentrations. CheAis a monofunctional sensor, which means that CheY andCheB can be more effectively phosphorylated by othersources (X6), either by phospho-donors or by other sen-sors, than they could if CheA were a bifunctional sensor.Thus, the internal metabolism of the bacterium regulatingthe levels of these phospho-donors is more likely to beinvolved in determining whether the cell will search fornutrients than it would be if CheA were a bifunctionalsensor. [It must be emphasized that the chemotaxis sys-tem in E. coli has a phosphatase protein, CheZ, that actsdownstream of both response regulators. Another casewhere this situation also occurs is in the Spo0 phospho-relay in B. subtilis. These phosphatases are also the sub-ject of regulation. However, in this work our goal has beento evaluate the effect of alternative sensor design on sig-nal transmission within the prototype module and down-stream aspects of design will not be considered here.]
FlbE/FlbD in Caulobacter crescentus is a presumptiveTCS module involved in flagellum assembly and cell cycleregulation (e.g. Wingrove and Gober, 1996). We are notaware of studies showing whether FlbE is a bifunctionalor monofunctional sensor, but based on its involvement inthe cell cycle we would predict that it would have a mono-functional sensor as several signals must be integrated toco-ordinate the timing of cell cycle events. Similar argu-ments apply to the co-ordination of sporulation events inBacillus subtilis. The Spo phosphorelay system appearsto have a monofunctional sensor and to include differentphosphatases that are specific for the different compo-nents of the relay (Perego and Hoch, 1996 for a review).
PhoR/PhoP is a TCS module with a monofunctionalsensor involved in regulating expression of genes respon-sible for the transport of phosphate in B. subtilis. Thismodule transduces signals generated by phosphate star-vation (X5). There is also cross-regulation between thismodule and PTS sugar systems (X6) (Hulett, 1996; for areview). Thus, it is important for this TCS to sense othersignals, beside the one coming from PhoR, and thedesign with a monofunctional sensor should be favoured.In fact, it has been shown that membrane-bound PhoRdoes not seem to influence the dephosphorylation rate ofPhoB significantly (Shi et al., 1999) and thus it borders onthe design of a monofunctional sensor. However, fromTable 3, the PhoR sensor is predicted to be bifunctionalwhich seem to contradict this result. A careful analysis ofShi et al. (1999) explains the apparent contradiction. Asoluble version of PhoR (without the membrane spanningdomains) enhances the dephosphorylation rate of PhoPonly slightly in the absence of ATP or ADP but much moresignificantly in the presence of either of these molecules.Thus, the design of soluble PhoR is that of a bifunctionalsensor as predicted from the homology modelling; how-ever, this bifunctionality is effectively inhibited and trans-
formed into monofunctionality by locating PhoR in themembrane.
If one accepts the rule we have suggested for the selec-tion of monofunctional and bifunctional sensors, and thesupportive evidence in the above cases where the physi-ological context can be interpreted in a fairly straightfor-ward fashion, then one can go on to apply this rule in theinterpretation of more complex systems. Two such casesin E. coli are considered below, the NRI/NRII systeminvolved in nitrogen fixation and the NarX/NarL and NarQ/NarP systems involved in nitrate and nitrite dependentgene expression.
The NRI/NRII system in E. coli regulates nitrogen fixa-tion and glutamine production. NRII is the sensor proteinthat phosphorylates the response regulator NRI. Underconditions of low nitrogen availability NRI upregulates theexpression of glutamine synthase. This enzyme con-denses nitrogen and glutamate to form glutamine.Glutamine increases the affinity of a third protein, PII,towards the sensor protein NRII, inhibiting NRII phospho-rylation and creating a complex that binds phosphorylatedNRI and increases NRI¢s rate of dephosphorylation.Alone, NRII has little or no effect upon the rate of NRIdephosphorylation (Keener and Kustu, 1988). Thus, undernormal nitrogen conditions (i.e. with normal levels ofglutamine), this TCS is bifunctional and nitrogen fixationis more sensitive to regulation by glutamine levels than itwould be if the module were monofunctional. Under nitro-gen depletion (causing a decrease in the concentration ofglutamine) PII does not bind NRII, which then becomesmonofunctional. This causes the module to integrate thesignals coming from glutamine/glutamate levels withthose coming from other parts of metabolism, via thechanges in the concentration of acetyl-phosphate, moreefficiently than it would if NRII were bifunctional. Intuitively,one might think that, under nitrogen depletion, NRIIshould be bifunctional, in order to more efficiently respondto the nitrogen fixation needs of the cell and buffer againstregulation of this fixation by other parts of metabolism.However, probably as a result of the central role ofglutamate in amino acid biosynthesis, this is not so.Glutamate is a ubiquitous amino acid that is needed forthe biosynthesis of all other amino acids and not justglutamine. Under nitrogen depleting conditions, it is impor-tant that the use of glutamate be co-ordinately regulatedby the concentration of all amino acids, in order not todeplete the cell of some of them, by its overuse to produceglutamine. It has been reported that cell growth on glu-cose minimal medium containing arginine, a poor nitrogensource, is greatly decreased in mutants lacking either NRIIor phosphate acetyl-transferase (E.C. 2.3.1.8) (Fenget al., 1992). This implies that phosphorylation by bothNRII and acetyl-phosphate is important under these con-ditions, which agrees with a strong regulatory role for

Alternative regulatory designs for two-component systems 45
© 2003 Blackwell Publishing Ltd, Molecular Microbiology, 48, 25–51
secondary signals in nitrogen fixation that get integratedthrough the NRI/NRII module. It is clear that the NR sys-tem is complex and that a more detailed model wouldprovide additional insight.
Two TCS modules are involved in nitrate and nitritedependent gene expression in E. coli, NarX/NarL andNarQ/NarP. NarX and NarQ are sensor proteins (X1) thatindependently recognize nitrate in the medium. Each ofthese sensors can transfer phosphate to both regulatorsNarL and NarP (X2) which have different specificities(Schroder et al., 1994; Chiang et al., 1997). WhereasNarL regulates expression of genes encoding nitrate andfumarate reductases as well as nitrite exporter proteins,both NarL and NarP regulate expression of genes encod-ing nitrite reductase and anaerobically expressed pro-teins. NarQ and NarX are both sensors for NarL. NarQhas a higher affinity than NarX for phosphorylating NarL.However, NarX is more effective in enhancing the rate ofNarL dephosphorylation (Schroder et al., 1994). In light ofour results this can be interpreted as a design that maxi-mizes the signals transduced via NarX/NarL with respectto those transduced via NarQ/NarL, because NarX isbifunctional with respect to NarL whereas NarQ is not. Itwould be interesting to determine whether either of thesensors is bifunctional with respect to NarP. If not, thiswould indicate that NarP, in contrast to NarL, is designedto integrate signals coming from both NarX and NarQ.
It is clear from the examples above, and others, thattwo-component systems exhibit a diversity of designissues that are not well understood. Our analysis hascontributed to the elucidation of just one of the variationsin design, monofunctional versus bifunctional sensors.Based on our results, we have proposed the following rule:Relative to the transduction of cognate signals, bifunc-tional sensors enhance suppression of signals from non-cognate sources whereas monofunctional sensorsenhance their integration. The experimental evidence wehave discussed is consistent with this rule. This leads usto suggest that this rule may be useful in understandingwhether other TCS are acting simply as transducers of thesensor signal or as integrators of signals coming fromdifferent sources.
Experimental procedures
Structures for TCS
Crystal or NMR structures have been determined for a limitednumber of TCS sensor and regulator proteins. In the PDBdatabase one can find structures for a prototype bifunctionalsensor (EnvZ: PDB reference identifiers 1BXD and 1JOY)and for a prototype monofunctional sensor (CheA: PDB ref-erence identifiers 1A0O, 1B3Q and 1FWP). Partial structureshave been determined for other sensor proteins (ArcB: PDBreference identifiers 1A0B and 2A0B; FixL: PDB reference
identifiers 1D06, 1DRM, 1DRQ and 1EW0) and otherresponse regulators (NarL: PDB reference identifiers 1A04and 1RNL; CheY: PDB reference identifiers 1A0O, 1BDJ,1C4W, 1D4Z, 1DJM, 1EAY, 1EHC, 1VLZ, 2CHE, 2CHF,2CHY, 5CHY and 6CHY; Spo0A: PDB reference identifiers1DZ3, 1FC3 and 1QMP; Spo0F: PDB reference identifiers1FSP, 1SRR and 2FSP; Spo0B: PDB reference identifiers1IXM and NAT; OmpR: PDB reference identifiers 1ODD and1OPC (DNA binding domain; no structure for the phosphory-lation domain); CheB: PDB reference identifiers 1A2O and1CHD; DrrD: PDB reference identifier 1KGS; NtrC: PDB ref-erence identifiers 1NTRC, 1NTC, 1DC7 and 1DC8; Etr1:PDB reference identifier 1DCF; FixJ: PDB reference identifi-ers 1D5W, 1DBW, 1DCK and 1DCM; PhoB: PDB referenceidentifiers 1B00, 1GXP, 1GXQ and 1QQI; Rcp1: PDB refer-ence identifiers 1I3C and 1JLK). This is a very small portionof the total number of TCS with identified proteins. However,the known structures can be used in combination withsequence data and homology modelling techniques to pre-dict the structures for these other proteins of TCS.
Sequence data for proteins of TCS
We searched GeneBank and Swissprot for Two ComponentSystems proteins. We also looked for proteins of TCS in thedatabases for sequenced microbial genomes (listed inMAGPIE at http://www-fp.mcs.anl.gov/~gaasterland/genomes.html). Whenever necessary, we translated thecDNA sequence into its corresponding amino acid sequence.The protein sequences that we extracted from the databaseswere then catalogued by organism. We did homology mod-elling of each protein by submitting the sequence to SWISS-
MODEL (Guex and Peitsch, 1997). Those that weresuccessfully modelled (at least for some domain of the pro-tein) by this program are presented in Tables 1 and 2.
Homology modelling
The protein sequences were submitted via internet to theSwissModel server (http://swissmodel.expasy.org/; Guex andPeitsch, 1997). As templates for the homology modelling wehave used files from the PDB database (http://www.rcsb.org/pdb/ Berman et al., 2000). The server attempted to generatea three-dimensional model for each sequence and returnedthe results via E-mail. In many cases there was not enoughhomology to any known structure to create a working model.In the remaining cases we have modelled (at least partially)the catalytic domain of the sensor as well as the receiver andDNA-binding domains of the regulator. In some cases wewere also able to model the transmitter or the signal-sensingdomain of the sensors. We then visualized and manipulatedthe models using SWISSPROTVIEWER (Guex and Peitsch,1997).
Mathematical representations
We can describe the dynamical behaviour of a system exhib-iting variations about any of its steady states by using a well-established power-law formalism for modelling biochemicalsystems (Savageau, 1969; Shiraishi and Savageau, 1992).

46 R. Alves and M. A. Savageau
© 2003 Blackwell Publishing Ltd, Molecular Microbiology, 48, 25–51
For the models in Fig. 1, the independent variables of ourmodels are the concentrations of the input signal molecules(X5 primary and X6 secondary) and the concentration totalsfor sensor protein (X7 = X1 + X3) and regulator protein(X8 = X2 + X4). The dependent state variables, which aredependent upon the values of the independent variables andthe internal dynamics of the system, are the concentrationsof the sensor proteins (X1 phosphorylated and X3 unphospho-rylated) and of the regulator proteins (X2 phosphorylated andX4 unphosphorylated).
There is one equation for each of the four dependentvariables. For each dependent variable Xi its change in con-centration with time (dXi / dt) is given by the differencebetween the corresponding aggregate rate of production (Vi)and the aggregate rate of consumption (V–i). Each of theseaggregate rates is represented by a mathematical rate lawwhose exact form is unknown, but whose arguments consistof all the variables that have a direct influence on the aggre-gate rate in question. For example, the aggregate rate lawfor consumption of the phosphorylated sensor protein inFig. 1 is a function of its concentration X1 and of the concen-tration of the unphosphorylated regulator protein X4 acting asa co-substrate.
Each aggregate rate law can be represented by a productof power-law functions, one for each argument in the rate law.This representation is guaranteed to be an accurate repre-sentation for some region of operation about a nominalsteady state (e.g. see Shiraishi and Savageau, 1992). Thus,the equations for the first two dependent variables of the TCSwith the bifunctional sensor (Fig. 1A) are the following (thedependent variables X3 and X4 will be treated below).
(1)
(2)
The corresponding equations for the TCS with the monofunc-tional sensor (Fig. 1B) are the same, except for the last termin Equation (2):
(2’)
The primed parameters [in Equation (2’)], whose significancewill become evident below, have values that in general aredifferent from the corresponding unprimed parameters inEquation (2).
The multiplicative parameters (rate constants), the a’s forproduction and the b’s for consumption, influence the timescales of the reactions and are always non-negative. Thesubscript of a rate constant refers to the molecular speciesthat is being produced or consumed. For example, a1 is therate constant for the aggregate rate of production of X1
(phosphorylated sensor kinase). The exponential parame-ters (kinetic orders), g’s for production and h’s for consump-tion, represent the direct influence of each variable on eachaggregate rate law. These parameters need not have integervalues, but can assume real values (positive, negative orzero). The first subscript of a kinetic order refers to themolecular species that is being produced or consumed; thesecond refers to the variable that has a direct influence onthe aggregate rate of production or consumption. For exam-ple, the influences on V-1, the aggregate rate of consump-
tion of X1 (phosphorylated sensor protein), are representedby the kinetic orders h11, which is the kinetic order represent-ing the influence of X1 (phosphorylated sensor protein) act-ing as substrate in the aggregate rate of its ownconsumption, and h14, which is the kinetic order representingthe influence of X4 (unphosphorylated response regulator)acting as a co-substrate in the aggregate rate of consump-tion of X1.
It may seem more natural to represent the aggregate rateof consumption of X1 by two separate terms such as
. However, it has been demonstrated thatthis is less accurate than the simple product of power-lawfunctions described above for small variations about thesteady state; this also tends to be the case for large varia-tions, although this is not necessarily true in general (Voit andSavageau, 1987).
Protein synthesis and degradation occur on a time-scalethat is in much slower than that of the catalytic activities withinthe TCS modules. Thus, on the time scale of interest here,the total amount of sensor protein (STotal, X7) and the totalamount of regulator protein (RTotal, X8) are considered to beconserved quantities. This permits one dependent variable tobe expressed in terms of the conserved total minus the otherdependent variable. Accordingly, one can write:
X3 = X7 - X1 (3)
X4 = X8 - X2 (4)
Because of these conservation relationships [Equations (3)and (4)], the rate of change in the concentration X3 is equalin amount and opposite in sign to that in the concentrationX1 and the rate of change in the concentration X4 is equalin amount and opposite in sign to that in the concentrationX2.
At any given steady state, one can represent the differ-ences in Equations (3) and (4) by the following products ofpower-laws (see Sorribas and Savageau, 1989; for a moredetailed explanation of the procedure)
(5)
(6)
The new parameters in Equations (5) and (6) are definedas follows: ƒ37 = (X7 / X30)(dX30 / dX7) = X7 / X30, ƒ31 = (X10 / X30)(dX30 / dX10) = - X10 / X30, g3 = X30 / , ƒ48 = (X8 / X40)(dX40 / dX8) = X8 / X40, ƒ42 = (X20 / X40)(dX40 / dX20) = - X20 / X40, and g4 = X40 / . The additional subscript 0
indicates the operating point at which the representation ismade (in this case, the steady state). It must be emphasizedthat this representation is exact at the operating point. Themultiplicative and exponential parameters in Equations (5)and (6) are analogous to the rate-constant and kinetic-orderparameters in Equations (1), (2) and (2’). Thus, the g’s arenon-negative and the ƒ’s are real (positive, negative or zero).The subscript of a g parameter, and the first subscript of anƒ parameter, refers to the dependent variable that is beingrepresented in terms of its paired variable and their sum. Thesecond subscript of an ƒ parameter refers to either the pairedvariable or the variable representing their sum.
( )7 1037f 31fX X
( )8 2048f 42fX X

Alternative regulatory designs for two-component systems 47
© 2003 Blackwell Publishing Ltd, Molecular Microbiology, 48, 25–51
The final form of the equations that will be used here isobtained by substituting the expressions in Equations (5) and(6) into Equations (1), (2) and (2’), and then redefining terms.Thus, one can write
(7)
(8)
and
(8¢)
where the new parameters in Equations (7), (8), and (8¢) arerelated to the original parameters in Equations (1), (2), (2’),(5) and (6) as follows: , , ,
, , , ,, , , , and.
All of the parameters in Equations (7), (8) and (8¢) arepositive except for g11, h12, g22 and h21, which are negative. Anegative exponent implies that an increase in the argumentresults in a decrease in the value of the power-law function.For example, an increase in X2 results in a decrease in therate of consumption of X1. This apparent inhibition of V-1 byX2 is a result of the conservation relation among the differentforms of the response regulator. Thus, an increase in X2
corresponds to an equivalent decrease in X4, which actuallycauses a de-activation of V-1. Similar explanations accountfor the behaviour associated with the other negative kineticorders.
As a practical matter, the results for the monofunctionaldesign can be obtained directly from those for the bifunctionaldesign simply by making the following exchanges: h21 Æ 0,h27 Æ 0, and b20 Æ b¢20, and h22 Æ h¢22. Hence, in the follow-ing sections we shall focus on the bifunctional design, makethese exchanges to obtain the corresponding results forthe monofunctional design, and then make the appropriatecomparisons.
Steady-state solution and key systemic properties
The equations describing the dynamic behaviour of themodel in Fig. 1A. [Equations (7) and (8)] can be solved ana-lytically for the steady state (Savageau, 1969; 1971a), wherethe rates of aggregate production and aggregate consump-tion for each metabolite are the same. By equating theseaggregate rates, taking logarithms of both sides of the result-ing equations and rearranging terms, one can write thesteady-state equations as follows:
a11Y1 - h12Y2 = b1 - g15Y5 - g17Y7 + h18Y8 (9)
a21Y1 + a22Y2 = b2 - g26Y6 - h27Y7 - g28Y8 (10)
where Yi = log Xi, bi = log(bi0 / ai0), and aij = gij – hij. Equations(9) and (10) are single linear algebraic equations that can besolved for the dependent variables Y1 and Y2 in terms of theparameters of the system, the input variables Y5 and Y6, andthe total concentrations of sensor and regulator proteins Y7
and Y8. Thus,
(11)
(12)
Two types of coefficients, logarithmic gains and parametersensitivities, can be used to characterize further the steadystate of such models. Because steady-state solutions existin explicit form [Equations (11) and (12)], we can calculateeach of the two types of coefficients simply by taking theappropriate derivatives. Although the mathematical opera-tions involved are the same in each case, it is important tokeep in mind that the biological significance of the two typesof coefficients is very different.
Logarithmic gains provide important information concern-ing the amplification or attenuation of signals as they arepropagated through the system (Savageau, 1971a; Shiraishiand Savageau, 1992). For example,
(13)
measures the percent change in the value of the dependentconcentration variable Xi (or in Vi the flux through the pool ofXi) caused by a percentage change in the concentration ofthe input signal X5. A positive sign indicates that the changesare in the same direction (both increase or both decrease);a negative sign indicates that the changes are in the oppositedirection (one increases while the other decreases).
Parameter sensitivities provide important informationabout system robustness, i.e. how sensitive the system is toperturbations in the structural determinants of the system(Savageau, 1971b; Shiraishi and Savageau, 1992). Forexample,
(14)
measures the per cent change in the value of the dependentconcentration variable Xi (or in Vi the flux through the pool ofXi) caused by a percentage change in the value of theparameter pj. Again, a positive sign indicates that thechanges are in the same direction (both increase or bothdecrease); a negative sign indicates that the changes are inthe opposite direction (one increases while the otherdecreases). The aggregate sensitivity of a given variable isdefined as the Euclidean norm of the vector whose compo-nents are the individual parametric sensitivities for that vari-able. That is,
(15)
These systems should be stable in the face of perturbationsin their dependent state variables. That is, following a pertur-bation, the systems should return to their predisturbance

48 R. Alves and M. A. Savageau
© 2003 Blackwell Publishing Ltd, Molecular Microbiology, 48, 25–51
state. The local stability of the steady state can be deter-mined by applying the Routh criteria (Dorf, 1992). The mag-nitude of the two critical Routh conditions can be used toquantify the margin of stability (Savageau, 1976). The twocritical Routh conditions are given by
F1a11 + F2a22 < 0 (16)
F1F2(a11a22 + h12a21) > 0 (17)
where F1 = V10 / X10 and F2 = V20 / X20 are the reciprocal of theturnover times for the X1 and X2 pools respectively.
Systems should respond quickly to changes in their envi-ronment (Savageau, 1975). Thus, another key property of thesystems is their temporal response, which was determinedby computer solution of the dynamic equations [Equations (7)(8) and (8’)]. At time zero, each intermediate concentrationwas set to a value 20% less than its steady-state value. Theconcentrations were then followed as a function of time fromthis initial condition, and the time for all the concentrations tosettle within 1% of their final steady-state value was calcu-lated and denoted by the symbol t.
Mathematically controlled comparisons
To determine the differences in systemic behaviour betweenthe reference model (bifunctional sensor, Fig. 1A) and thealternative model (monofunctional sensor, Fig. 1B) we use atechnique known as mathematically controlled comparison(Savageau, 1972, 1976; Irvine and Savageau, 1985; Alvesand Savageau, 2000a). This technique introduces mathemat-ical controls to ensure that the differences observed in thesystemic behaviour of alternative models are a result of thespecific differences in the design and not some accidentaldifference. The parameters of the alternative model are fixedrelative to those of the reference model by introducing con-straints to ensure that the two models are as nearly equivalentas possible from both an internal and an external perspective.
Only the step that accounts for the dephosphorylation ofthe regulator is allowed to differ between the referencemodel and the alternative model. Therefore, to establishinternal equivalence (Savageau, 1972, 1976; Irvine, 1991)between the two designs, we require the values for the cor-responding parameters of all other steps in the two modelsto be the same. The step that accounts for the dephospho-rylation of the regulator is then the only step that differsbetween the reference model and the alternative model. Ifwe reason that loss or gain of an activation site on theregulator protein comes about by mutation, and that thismutation can cause changes in all the parameters of theprocess, then a mutation that converts a bifunctional sensorto a monofunctional sensor would change the parametersh22, h23, and b2 in Equation (2) to h’22, h’23 = 0, and b’2 inEquation (2’). Alternatively, the parameters, h21, h22, h27, andb20 in Equation (8) would change to h’21 = 0, h’22, h’27 = 0,and b’20 in Equation (8’).
Because we wish to determine the differences that are duesolely to changes in the structure of the system, we need tospecify values for h’22 and b’2 that minimize all other differ-ences. This is accomplished by deriving the mathematicalexpression for a given steady-state property in each of thetwo models, equating these expressions to produce a con-
straint, and then solving the constraint equation for the valueof a primed parameter (see Calculating the constraints forexternal equivalence). The process we have just describeddetermines the maximal degree of external equivalence(Savageau, 1972, 1976; Irvine, 1991) between the two mod-els. Once the two primed parameters have been determinedin this manner, there are no more ‘free’ parameters that canbe adjusted to reduce the differences, and all remainingdifferences can be attributed to the change in system struc-ture from one with a bifunctional sensor to one with a mono-functional sensor. Having established the conditions on theparameters for maximal equivalence, we can proceed toanalyse the two models and determine their remaining differ-ences.
Calculating the constraints for external equivalence
Each constraint is established by requiring the value of arelevant systemic property to be the same in both designs.Because we have two primed parameters that need to beconstrained, we require two different systemic properties tobe invariant between the designs.
First, the value of h’22 is fixed by requiring the total gain ofthe system, L(X2,X5) + L(X2,X6) , to be the same in bothdesigns. This total gain is determined from the explicit solu-tion for X2 [Y2 = log X2] in Equation (12)] by calculating thelogarithmic gains as defined by the derivatives in Equation(13). Equating the results for each of the alternative designsallows the value of h’22 to be calculated as a function of thekinetic-order parameters in the reference model, which istaken to be the bifunctional case.
(18)
By using this constraint we ensure that the output signal ofthe response regulator X2 is the same for both designs inresponses to the aggregate of signals X5 and X6 that changeits phosphorylation state. We also have constrained the alter-native designs to have equal responses to the primary inputsignal X5 [L(X2,X5)],or to the secondary input signal X6
[L(X2,X6)]. The results of the comparative analysis in theseother cases are qualitatively the same as those of the com-parative analysis reported here (data not shown).
Second, the value of b’20 is fixed by requiring the steady-state concentrations of the corresponding variables to be thesame in both designs. By equating the explicit solution for X2
[Y2 = log X2 in Equation (12)] in each of the designs, and byutilizing the result in Equation (18), one is able to express thevalue of b’20 in terms of the independent variables and param-eters of the reference model.
(19)

Alternative regulatory designs for two-component systems 49
© 2003 Blackwell Publishing Ltd, Molecular Microbiology, 48, 25–51
In addition to making the steady-state value of X2 equal inthe alternative designs, this value of b’20 also makes thesteady-state value of X1 [and X3 (= X7 - X1) and X4 (= X8 -X2)], and the steady-state values of the corresponding fluxesV2 (= V4) and V1 (= V3) equal in the alternative designs.
Numerical analysis
The analytical results give qualitative information that char-acterizes the effect of bifunctional versus monofunctionalsensors in the models of Fig. 1. To obtain quantitative infor-mation about the comparisons, one must introduce specificvalues for the parameters and compare models (Alves andSavageau, 2000a). For this purpose we have randomly gen-erated a large ensemble of parameter sets and selected5 000 of these sets that define models consistent with variousphysical and biochemical constraints. These constraintsinclude conservation of mass considerations, a requirementfor positive signal amplification, and stability margins largeenough to ensure local stability of the systems. A detaileddescription of these methods can be found in Alves andSavageau (2000b).
When applied to the current comparisons, the procedureis as follows. We select random values for all the unprimedparameters and for all the independent concentration vari-ables (X5 through X8) in Equations (7) (8) and (8’). The valuesof the primed parameters in Equation (8’) are then fixed bythe relationships in Equations (18) and (19). The analyticalsolution in Equations (11) and (12) determines the steady-state values for dependent state variables (X1 and X2), com-plementary variables (X3 and X4), fluxes, logarithmic gainsand parameter sensitivities. This information in turn deter-mines the values for all the parameters following Equations(6) and (8). Taken together, this information determines thevalues for all the parameters in the original equations [Equa-tions (1) (2) and (2’)]. Mathematica™ (Wolfram, 1997) wasused for all the numerical procedures.
To interpret the ratios that result from our comparativeanalysis we use Density of Ratios plots as defined in Alvesand Savageau (2000c). The primary density plots from theraw data have the magnitude for some property of the refer-ence model on the x-axis and the corresponding ratio ofmagnitudes (reference model to alternative model) on the y-axis. Secondary density plots are constructed from the pri-mary plots by the use of moving quantile techniques with awindow size of 500. The slope in the secondary plot mea-sures the degree of correlation between the quantities plottedon the x- and y-axes.
Acknowledgements
This work was supported in part by a joint PhD fellowshipPRAXIS XXI/BD/9803/96 granted by PRAXIS XXI throughPrograma Gulbenkian de Doutoramentos em Biologia eMedicina (R.A), U.S. Public Health Service Grant RO1-GM30054 from the National Institutes of Health (M.A.S.), andU.S. Department of Defense Grant N00014-97-1-0364 fromthe Office of Naval Research (M.A.S.). We thank Drs SusanaNery, Armindo Salvador, Vic DiRita and Alex Ninfa for criticallyreading early versions of this manuscript and making useful
comments. We also thank an anonymous referee for a verycareful and constructive review of the original manuscript.This work was completed while MAS was a guest at theInstitut des Hautes Études Scientifiques, Bures-sur-Yvette,France. He thanks Drs A. Carbonme. M. Gromov and F. Képèsfor providing resources, intellectual stimulation and generoushospitality.
References
Alves, R., and Savageau, M.A. (2000a) Extending themethod of mathematically controlled comparison to includenumerical comparisons. Bioinformatics 16: 786–798.
Alves, R., and Savageau, M.A. (2000b) Systemic propertiesof ensembles of metabolic networks: application of graph-ical and statistical methods to simple unbranched path-ways. Bioinformatics 16: 534–547.
Alves, R., and Savageau, M.A. (2000c) Comparing systemicproperties of ensembles of biological networks by graphicaland statistical methods. Bioinformatics 16: 527–533.
Arthur, M., Depardieu, F., Gerbaud, G., Galimand, M.,Leclercq, R., and Courvalin, P. (1997) The VanS sensornegatively controls VanR-mediated transcriptional activa-tion of glycopeptide resistance genes of Tn1546 andrelated elements in the absence of induction. J Bacteriol179: 97–106.
Berman, H.M., Westbrook, J., Feng, Z., Gilliland, G., Bhat,T.N., Weissig, H., et al. (2000) The Protein Data Bank.Nucleic Acids Res 28: 235–242.
Blat, Y., Gillespie, B., Bren, A., Dahlquist, F.W., and Eisen-bach, M. (1998) Regulation of phosphatase activity in bac-terial chemotaxis. J Mol Biol 284: 1191–1199.
Chiang, R.C., Cavicchioli, R., and Gunsalus, R.P. (1997)Locked on and locked off signal transduction mutations inthe periplasmic domain of the Escherichia coli NarQ andNarX sensors affect nitrate and nitrite dependent regulationby NarL and NarP. Mol Microbiol 24: 1049–1060.
Dorf, R.C. (1992) Modern Control Systems, 6th edn. Read-ing, MA: Addison-Wesley.
Eisenbach, M. (1996) Control of bacterial chemotaxis. MolMicrobiol 20: 903–910.
Feng, J., Atkinson, M.R., McCleary, W., Stock, J.B., Wanner,B.L., and Ninfa, A.J. (1992) Role of phosphorylated meta-bolic intermediates in the regulation of glutamine syn-thetase synthesis. J Bacteriol 174: 6061–6070.
Grob, P., Hennecke, H., and Gottfert, M. (1994) Cross talkbetween the two component regulatory systems NodVWand NwsAB of Bradyrhizobium japonicum. FEMS MicrobiolLett 120: 349–353.
Guex, N., and Peitsch, M.C. (1997) SWISS-MODEL and theSwiss-PdbViewer: An environment for comparative proteinmodelling. Electrophoresis 18: 2714–2723.
Hellingwerf, K.J., Crielaard, W.C., and de Mattos, M.J.T.(1998) Current topics in signal transduction in bacteria.Anton Leeuw Int J G 74: 211–227.
Hlavacek, W.S., and Savageau, M.A. (1995) Subunit struc-ture of regulator proteins influences the design of genecircuitry: Analysis of perfectly coupled and completelyuncoupled circuits. J Mol Biol 248: 739–755.
Hlavacek, W.S., and Savageau, M.A. (1996) Rules for cou-

50 R. Alves and M. A. Savageau
© 2003 Blackwell Publishing Ltd, Molecular Microbiology, 48, 25–51
pled expression of regulator and effector genes in induciblecircuits. J Mol Biol 255: 121–139.
Hlavacek, W.S., and Savageau, M.A. (1997) Completelyuncoupled and perfectly coupled gene expression inrepressible systems. J Mol Biol 266: 538–558.
Hoch, J.E., and Silhavy, T.J. (1995) Two-Component SignalTransduction. Washington D.C.: American Society forMicrobiology Press.
Hsing, W.H., Russo, F.D., Bernd, K.K., and Silhavy, T.J.(1998) Mutations that alter the kinase and phosphataseactivities of the two-component sensor EnvZ. J Bacteriol180: 4538–4546.
Hulett, F.M. (1996) The signal-transduction network forPho regulation in Bacillus subtilis. Mol Microbiol 19:933–939.
Igo, M.M., Ninfa, A.J., Stock, J.B., and Silhavy, T.J. (1989)Phosphorylation and dephosphorylation of a bacterial tran-scriptional activator by a transmembrane receptor. GeneDevel 3: 1725–1734.
Irvine, D.H. (1991) The method of controlled mathematicalcomparisons. In Canonical Nonlinear Modeling: S-Sys-tems Approach to Understanding Complexity. Voit, E.O.,(ed.) New York: Van Nostrand Reinhold, pp. 90.
Irvine, D.H., and Savageau, M.A. (1985) Network regulationof the immune response: alternative control points for sup-pressor modulation of effector lymphocytes. J Immunol134: 99–109.
Jiang, P., and Ninfa, A.J. (1999) Regulation of autophospho-rylation of Escherichia coli Nitrogen regulator II by the PIIsignal transduction protein. J Bacteriol 181: 1906–1911.
Jung, K., and Altendorf, K. (1998) Individual substitutions ofclustered arginine residues of the sensor kinase KdpD ofEscherichia coli modulate the ratio of kinase to phos-phatase activity. J Biol Chem 273: 26415–26420.
Jung, K., Tjaden, B., and Altendorf, K. (1997) Purification,reconstitution, and characterization of KdpD, the turgorsensor of Escherichia coli. J Biol Chem 272: 10847–10852.
Kadner, R.J. (1996) Cytoplasmic membrane. In EscherichiaColi and Salmonella: Cellular and Molecular Biology.Neidhardt, F.C., (ed). Washington D.C.: American Societyfor Microbiology Press, pp. 58–87.
Kanamaru, K., Aiba, H., Mizushima, S., and Mizuno, T.(1989) Signal transduction and osmoregulation in Escher-ichia coli. A single amino acid change in the protein kinase,EnvZ, results in loss of its phosphorylation and dephos-phorylation abilities with respect to the activator protein,OmpR. J Biol Chem 264: 21633–21637.
Keener, J., and Kustu, S. (1988) Protein kinase and phos-phoprotein phosphatase activities of nitrogen regulatoryproteins NTRB and NTRC of enteric bacteria: roles of theconserved amino-terminal domain of NTRC. Proc NatlAcad Sci USA 85: 4976–4980.
Lukat, G.S., McCleary, W.R., Stock, A.M., and Stock, J.B.(1992) Phosphorylation of bacterial response regulatorproteins by low molecular weight phosphodonors. ProcNatl Acad Sci USA 89: 718–722.
Mayover, T.L., Halkides, C.J., and Stewart, R.C. (1999) Kineticcharacterization of CheY phosphorylation reactions: Com-parison of P-CheA and small-molecule phosphodonors.Biochemistry 38: 2259–2271.
McCleary, W.R. (1996) The activation of PhoB byAcetylphosphate. Mol Microbiol 20: 1155–1163.
Murzin, A.G., Brenner, S.E., Hubbard, T., and Chothia, C.(1995) SCOP. a structural classification of proteins data-base for the investigation of sequences and structures. JMol Biol 247: 536–540.
Ninfa, A.J., Ninfa, E.G., Lupas, A.N., Stock, A., Magasanik,B., and Stock, J. (1988) Crosstalk between bacterialchemotaxis signal transduction proteins and regulators oftranscription of the NTR regulon – Evidence that nitrogenassimilation and chemotaxis are controlled by a commonphosphotransfer mechanism. Proc Natl Acad Sci USA 84:5492–5496.
Ninfa, E.G., Stock, A., Mowbray, S., and Stock, J. (1991)Reconstitution of the bacterial chemotaxis signal transduc-tion system from purified components. J Biol Chem 266:9764–9770.
Parkinson, J.S. (1993) Signal transduction schemes of bac-teria. Cell 73: 857–871.
Perego, M., and Hoch, J.A. (1996) Protein aspartate phos-phatases control the output of two-component signal trans-duction systems. Trends Genetics 12: 97–101.
Pioszak, A.A., and Ninfa, A.J. (2003) Genetic and biochem-ical analysis of the phosphatase activity of Escherichia coliNRII (NtrB) and its regulation by the PII signal transductionprotein. J. Bacteriol 185: 1299–1315.
Posas, F., Takekawa, M., and Saito, H. (1998) Signal trans-duction by MAP kinase cascades in budding yeast. CurrOp Microbiol 1: 175–182.
Pratt, L.A., Hsing, W.H., Gibson, K.E., and Silhavy, T.J.(1996) From acids to osmZ: Multiple factors influence syn-thesis of the OmpF and OmpC porins in Escherichia coli.Mol Microbiol 20: 911–917.
Sanders, D.A., Gillecastro, B.L., Stoch, A.M., Burlingame,A.L., and Koshland, D.E. (1989) Identification of the site ofphosphorylation of the chemotaxis response regulator pro-tein, CheY. J Biol Chem 264: 21770–21778.
Savageau, M.A. (1969) Biochemical Systems Analysis II: Thesteady-state solution for an n-pool system using a power-law approximation. J Theor Biol 25: 370–379.
Savageau, M.A. (1971a) Concepts relating the behaviour ofbiochemical systems to their underlying molecular proper-ties. Arch Biochem Biophys 145: 612–621.
Savageau, M.A. (1971b) Parameter sensitivity as a criterionfor evaluating and comparing the performance of biochem-ical systems. Nature 229: 542–544.
Savageau, M.A. (1972) The behavior of intact biochemicalcontrol systems. Curr Top Cell Reg 6: 63–130.
Savageau, M.A. (1975) Optimal design of feedback controlby inhibition: Dynamical considerations. J Mol Evol 5: 199–222.
Savageau, M.A. (1976) Biochemical Systems Analysis: aStudy of Function and Design in Molecular Biology. Read-ing, MA: Addison-Wesley.
Schaller, G.E. (1997) Ethylene and cytokinin signalling inplants: the role of two-component systems. Essays Bio-chem 32: 101–111.
Schroder, I., Wolin, C.D., Cavicchioli, R., and Gunsalus, R.P.(1994) Phosphorylation and dephosphorylation of theNarQ, NarX, and NarL proteins of the nitrate dependent

Alternative regulatory designs for two-component systems 51
© 2003 Blackwell Publishing Ltd, Molecular Microbiology, 48, 25–51
two-component regulatory system of Escherichia coli. JBacteriol 176: 4985–4991.
Shi, L., Liu, W., and Hulett, F.M. (1999) Decay of activatedBacillus subtilis pho response regulator, PhoP-P, involvesthe PhoR-P intermediate. Biochemistry 37: 14575–14584.
Shiraishi, F., and Savageau, M.A. (1992) The tricarboxylicacid cycle in Dictyostelium discoideum II. Evaluation ofmodel consistency and robustness. J Biol Chem 267:22919–22925.
Sorribas, A., and Savageau, M.A. (1989) A comparison ofvariant theories of intact biochemical systems 1. Enzyme–enzyme interactions and biochemical systems theory.Math Biosci 94: 161–193.
Voit, E.O., and Savageau, M.A. (1987) Accuracy of alterna-tive representations for integrated biochemical systems.Biochemistry 26: 6869–6880.
Wanner, B.L. (1992) Is cross regulation by phosphorylationof two-component response regulator proteins important inbacteria? J Bacteriol 174: 2053–2058.
Weiss, V.V., and Magasanik, B. (1988) Phosphorylation ofnitrogen regulator I (NRI) of Escherichia coli. Proc NatlAcad Sci USA 85: 5492–5496.
Wingrove, J.A., and Gober, J.W. (1996) Identification of anasymmetrically localized sensor histidine kinase responsi-ble for temporally and spatially regulated transcription. Sci-ence 274: 597–601.
Wolfram, S. (1997) Mathematicatm: a System for DoingMathematics by Computer. Menlo Park, CA: Addison-Wesley.
Wright, G.D., Holman, T.R., and Walsh, C.T. (1993) Purifica-tion and characterization of VanR and the cytosolic domainof VanS – A two component regulatory system required forvancomycin resistance in Enterococcus faecium BM4147.Biochemistry 32: 5057–5063.
Zhu, Y., Qin, L., Yoshida, T., and Inouye, M. (2000) Phos-phatase activity of histidine kinase EnvZ without kinasecatalytic domain. Proc Natl Acad Sci USA 97: 7808–7813.