comparative economic analysis of using natural gas for liquefied natural gas production and...
TRANSCRIPT
International Journal of Research in Engineering and Science (IJRES)
ISSN (Online): 2320-9364, ISSN (Print): 2320-9356
www.ijres.org Volume 2 Issue 9 ǁ September. 2014 ǁ PP.09-26
www.ijres.org 9 | Page
Comparative Economic Analysis of Using Natural Gas For
Liquefied Natural Gas Production and Converting Natural Gas
To Diesel Through Gas-To-Liquid Technology In Nigeria
Anyadiegwu Charley Iyke C.*, Muonagor Chukwuemeka M.**,
Nnakaihe Stephen E.*** *Department of Petroleum Engineering, Federal University of Technology, Owerri.
**Institute of Petroleum Studies, Port Harcourt, in affiliation with Institut Francais du Petrole (IFP), France.
***Department of Petroleum Engineering, Federal University of Technology, Owerri.
ABSTRACT: Comparative economic analysis of the production of diesel through Gas-to-Liquid (GTL)
Technology and the production of Liquefied Natural Gas (LNG) both using natural gas was presented. The data
for costs of constructing and running GTL and LNG plants were obtained for the study. Plant procurement
costs, shipping and tanker facilities costs, the expected capacities of the GTL and LNG plants and the feed gas
volume needed to produce those capacities of liquid products were gathered with which the costs analyses and
revenue analyses were conducted. Two assumptions made were that the diesel would be the only product of the
GTL project and LNG, the only product of the LNG plant. The 33000bbl/day of liquid product from the GTL
plant was taken to be all diesel while the 5mmtpa of NGL got from the LNG plant was ignored. The
33000bbl/day of diesel and 22mmtpa of LNG were then used for the analyses. Concentration was on the profit
indicators used to evaluate the advantage of one over the other. Figures were used to determine the pay-out of
the projects which is 9.16years for GTL and 1.97years for LNG respectively. The Net Present Value (NPV) and
Profit per Dollar Invested (P/$) that make up the project economics were estimated for GTL and LNG. The
NPV over 15years and at an expected rate of return of 10% was $2.11billion for GTL and $45.17billion for
LNG. For GTL, the P/$ was 2.02 and for LNG, it was 6.62. From the whole analysis done it is easily seen that
the LNG project is more economically viable than the GTL project since the LNG project has higher NPV,
lower pay-out and higher P/$ than the GTL project.
Key words: economics, gas, liquid, diesel, LNG, GTL, NGL, costs, revenue, profitability, analysis, investment,
NPV, payout, IRR.
I. GTL TECHNOLOGY BACKGROUND STUDY
Natural gas is converted to diesel and other products using a technology known as Gas to Liquids (GTL)
technology in a process called the Fischer-Tropsch (FT) process. The Fischer–Tropsch process is a collection of
chemical reactions that converts a mixture of gases into liquid hydrocarbons. It was first developed by Franz
Fischer and Hans Tropsch at the "Kaiser-Wilhelm-Institut für Kohlenforschung" in Mülheim an der Ruhr
(Germany) in 1925. The process, a key component of gas to liquids technology, produces a synthetic lubrication
oil and synthetic fuel, typically from coal, natural gas, or biomass (Wikimedia Foundation Inc., 2013). The
Fischer–Tropsch process has received intermittent attention as a source of low-sulfur diesel fuel and to address
the supply or cost of petroleum-derived hydrocarbons.
GTL is the term used to describe the chemical conversion of a gas into synthetic fuels by the Fisher-Tropsch
(FT) synthetic process. The synthetic fuel is then refined by traditional methods to produce ultra clean liquid
transport fuels.
GTL represents one of three major alternatives for owners of natural gas to monetize their gas. While
pipeline and liquefied natural gas (LNG) options focus on the natural gas markets; GTL provides an option for
gas producing nations to diversify into the transportation fuel market like diesel and jet fuel. Due to the removal
of impurities before the gas is converted to liquid, GTL products have superior properties in terms of
combustion efficiency and emission of some pollutants. GTL fuels are compatible with old, existing and future
diesel engine technologies. This means that FT fuels can be directly substituted for traditional fuels without any
large scale modification to fleets or infrastructure. GTL products include diesel, naphtha, DME, LPG etc. In this
work, the concentration is mainly on diesel which is the major product of GTL technology.
FT diesel is considered superior to conventional diesel as it has no sulphur content, near zero aromatics and a
high cetane number ie its combustion quality during compression ignition, providing excellent combustion
properties. FT diesel has superior environmental performance compared to conventional crude oil refinery

Comparative Economic Analysis of Using Natural Gas For Liquefied Natural Gas
www.ijres.org 10 | Page
diesel providing significant reductions in emissions of particulates NOx, SOx, carbon monoxide and light
hydrocarbons. FT diesel is highly valuable as a blending stock for petroleum based diesel fuel. It is spotlighted
as a clean fuel for next-generation diesel engine. Table 1.1 shows a convention of the products of GTL
technology and their compositions.
Table 1.1: Convention of GTL Fuel Names and Composition
NAME SYNONYMS COMPONENTS
Fuel gas C1- C2
LPG C3 – C4
Gasoline C5 – C12
Naphtha C8 - C12
Kerosene Jet Fuel C11 – C13
Diesel Fuel Oil C13 – C17
Middle Distillate Light Gas Oil C10- C10
Soft Wax C19- C23
Medium wax C24 – C35
Hard wax C35+
The scale of a GTL plant currently represents an important dimension for strategic positioning in the gas
market. Some actors are positioning themselves in search of greater-scale natural trajectory of chemical
processes aiming to reduce the cost of production and increase profitability on the large investments needed.
The large petroleum companies which possess aiming great reserves of stranded natural gas are the most
interested in large-scale plants. On the other hand, some companies seek efficient plants on a smaller scale
capable of exploring a large number of small stranded natural gas fields. Some of the main natural gas operators
are Chevron, Shell, ExxonMobil etc (Mattei, 2005).
1.1 Technology Overview of GTL
According to Onaiwu, (2008), the current applications of modern natural gas based FT technology can be
categorized into two viz:
The High Temperature FT Process: this process uses iron as a catalyst within a temperature range of 300-
350oC. The products from the process include petrol and gas oil which has almost zero sulphur but
contains aromatics.
The Low Temperature FT process – This Process uses cobalt as a catalyst within a temperature range of
200-240oC. The process produces GTL fuel and very clean synthetic fractions of gas oil.
There are various commercial applications of the FT processes, the difference in the application of the
technology relate to the design of the reactor and catalyst technology. Virtually all of them however include the
following key steps;
1. Natural gas separation and treatment to remove water and impurities.
2. Production of sales gas (CH4).
3. Fischer- Tropsch conversion to produce hydrocarbon waxes.
4. Final upgrade of finished products.

Comparative Economic Analysis of Using Natural Gas For Liquefied Natural Gas
www.ijres.org 11 | Page
Fig 1.1: Schematic of GTL Product Extraction from Produced Gas
II. LNG PRODUCTION BACKGROUND STUDY According to Shively et al, (2010): The three basic steps of the liquefaction process are as follows:
1. Removal of impurities and recovery of natural gas liquids (NGLs)
2. Refrigeration of the gas until it liquefies
3. Movement of the LNG to storage and ultimately into the tanker
2.1 Removal of Impurities and Recovery of NGLs
The gas supply that comes from the production field is called raw feed gas. This is typically made up of
methane, other hydrocarbons such as ethane, propane, butane, and/or pentane, and substances such as water,
sulfur, mercury, and other impurities. The raw feed gas is delivered via pipeline to a processing plant. Here the
gas is processed to remove impurities as well as valuable NGLs. The first step is pretreatment, which includes
the removal of acid gas such as carbon dioxide and sulfur, as well as mercury and other substances. All of these
must be removed either because their freezing points are well above the temperature of the final LNG product
(and they could freeze and damage equipment during the cooling process), or because they are impurities that
must be removed to meet pipeline specifications at the delivery point. Next water is removed.
After the above steps, the NGLs such as ethane, propane, butane, and pentanes (also known as heavy
hydrocarbons) are removed and collected. In many cases the gas is processed upstream of the liquefaction unit,
using traditional gas processing technology (i.e., the same processing that is done to any gas entering an
interstate pipeline system). In other cases, the NGLs recovery may be done as an integral step in the liquefaction
process. The NGLs collected are valuable products in their own right, and may also be used as refrigerants for
the liquefaction process or may be re-injected into the LNG stream at a later point to adjust the Btu content and
flammability characteristics of the LNG. Pentanes and other heavy hydrocarbons are generally exported as a
gasoline product. Butane and propane are often also exported as separate products and/or used as refrigerants.
Ethane is often re-injected into the LNG stream and may also be used as a refrigerant. A schematic of the
integrated NGLs and LNG process is as shown below:

Comparative Economic Analysis of Using Natural Gas For Liquefied Natural Gas
www.ijres.org 12 | Page
Fig 2.1: Integrated NGLs and LNG Process
2.2 Liquefaction of the Methane
Next, the methane along with any re-injected components, is further cooled to –260 degrees Fahrenheit
using LNG liquefaction technology. In this step, the methane mixture liquefies into the final cryogenic liquid
state. Although slightly different processes are used in various liquefaction facilities, the basic cooling and
liquefaction principles of each process are the same. The key technology is heat exchange. Here, a cold liquid
refrigerant is passed through cooling coils and the natural gas stream is allowed to flow over them, resulting in
cooling of the gas stream. As the temperature drops to about -260 degrees Fahrenheit, the gas becomes liquid
and can then be pumped into a storage tank.
Different liquefaction processes include the APCI MCR Process, the Phillips Optimized Cascade Process, and
the Linde/Shell Fluid Cascade Process. The process chosen is a design decision and depends on various factors
including the composition of the feed gas, the availability of refrigerants, whether the NGLs are being removed
upstream, the size of the facility, requirements for operational flexibility, and the cost/availability of power for
compressors.
Liquefaction facilities are generally constructed in modular units called trains. A train is a complete stand-alone
processing unit, but often multiple trains are built side-by-side. Train sizes currently range from less than 1 to
5mmtpa. Future designs may extend sizes to as large as 8mmtpa as engineers attempt to take advantage of
economies of scale.
PRE- TREATMENT
Hydrogen Sulfide Carbon Dioxide Mercaptans Mercury
DEHYDRATIO N
Water
LNG LIQUEFACTIO N
LNG
Refrigerant
Butane/ Propane used as refrigerant
REFRIGERATIO N SYSTEM
NGLs PRO CESSING
Pentanes Butane Ethane Propane
Feed Gas
IN TEG RATED N G LS AN D LN G PRO CESS
Comparative Economic Analysis of Using Natural Gas For Liquefied Natural Gas
www.ijres.org 13 | Page
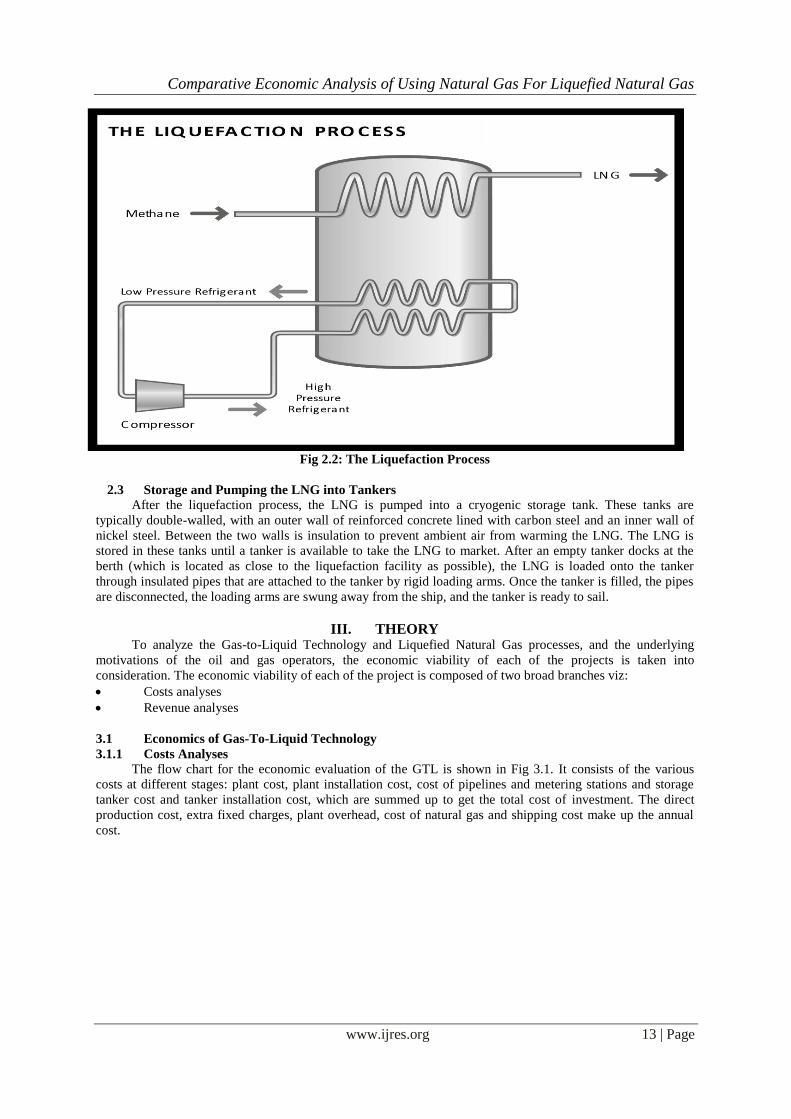
Fig 2.2: The Liquefaction Process
2.3 Storage and Pumping the LNG into Tankers
After the liquefaction process, the LNG is pumped into a cryogenic storage tank. These tanks are
typically double-walled, with an outer wall of reinforced concrete lined with carbon steel and an inner wall of
nickel steel. Between the two walls is insulation to prevent ambient air from warming the LNG. The LNG is
stored in these tanks until a tanker is available to take the LNG to market. After an empty tanker docks at the
berth (which is located as close to the liquefaction facility as possible), the LNG is loaded onto the tanker
through insulated pipes that are attached to the tanker by rigid loading arms. Once the tanker is filled, the pipes
are disconnected, the loading arms are swung away from the ship, and the tanker is ready to sail.
III. THEORY To analyze the Gas-to-Liquid Technology and Liquefied Natural Gas processes, and the underlying
motivations of the oil and gas operators, the economic viability of each of the projects is taken into
consideration. The economic viability of each of the project is composed of two broad branches viz:
Costs analyses
Revenue analyses
3.1 Economics of Gas-To-Liquid Technology
3.1.1 Costs Analyses
The flow chart for the economic evaluation of the GTL is shown in Fig 3.1. It consists of the various
costs at different stages: plant cost, plant installation cost, cost of pipelines and metering stations and storage
tanker cost and tanker installation cost, which are summed up to get the total cost of investment. The direct
production cost, extra fixed charges, plant overhead, cost of natural gas and shipping cost make up the annual
cost.

Comparative Economic Analysis of Using Natural Gas For Liquefied Natural Gas
www.ijres.org 14 | Page
Fig 3.1: GTL Economic Viability Flow Diagram
Several items contribute to the total investment necessary to put a GTL plant into use and market the product
for sales, as demonstrated in Fig 3.1; they include:
i. Cost of procuring and installing the plant
ii. Cost of pipelines and metering stations.
iii. Cost of buying the storage tankers and installing them.
The total investment cost is given by equation 3.1:
Total investment cost = Plant cost + Plant Installation cost + Cost of Pipelines and Meters + Cost of Storage
Tanker 3.1
It is represented mathematically as:
I = P + Pi + Cpm + T 3.2
The Annual cost =
GTL Product Manufacturing cost + Cost of Natural Gas + Shipping cost 3.3
This is represented mathematically as:
A = Pc + N + S 3.4
3.1.1.1 Total Investment Cost, (I)
3.1.1.1.1 Plant Cost, (P)
Plant cost is the cost of procuring the gas-to-liquid technology plant and all the necessary facilities for its
operation. The most available gas-to-liquid technology facility at present is the Fischer-Tropsch (FT) plant. The
Fischer-Tropsch plant has many installations that take in natural gas to give chemical products.
3.1.1.1.2 Plant Installation Cost, (Pi)
It is not all about buying or procuring the FT plant, the plant has to be put into workability. Plant installation
cost is the cost of installing the FT plant and all its parts for operation. The installation cost comprises the cost
of all the connections put in place in the FT plant for it to be able to perform the gas-to-liquid operation.
3.1.1.1.3 Cost of Pipelines and Metering Stations, (Cpm)
The pipelines and metering stations in this context are the piping facilities for transporting the bought natural
gas from the buying point to the FT plant site. The essence of the metering station is to take measurement of the
amount of natural gas that is fed into the FT plant at any point in time for conversion; the volume of the
products yielded by the FT plant after conversion. The metering station installed for natural gas measurement
would be able to read the volume of gas fed into the FT plant in scf while the metering station installed for
Storage Tanker Cost
Plant Installation Cost
Pipelines and Meters
Cost
Direct Production
Cost
Extra Fixed Charges
and Tax
Plant Overhead
Cost of Natural Gas
Shipping Cost
GTL Product
Manufacturing Cost
Annual Cost
Investment Cost
Plant Cost

Comparative Economic Analysis of Using Natural Gas For Liquefied Natural Gas
www.ijres.org 15 | Page
measuring the volume of the yielded liquid product would read the volume in bbl. The amount of natural gas
received by the FT plant as read by the metering station per day is represented in scf/d while the volume of
product yielded by the FT plant per day is represented in bbl/d. Pipeline diameters of 12’, 14’ and 18’ and
length of about 40 miles are commonly used, and 2 metering stations are installed; one for natural gas
measurement and the other for the measurement of the liquid product volume.
3.1.1.1.4 Cost of Tanker, (T)
The tankers are the storage tankers procured for storing the liquid product manufactured through the FT
process. Since shipping facilities are booked on hire, it is advisable to maximize the shipping capacity by
storing the liquid product manufactured over time till the volume reaches the maximum capacity of the ship,
and then the ship could be hired to carry the yielded product to market points overseas. For this cause, storage
tanker is needed for the product of the FT process. The amount of money spent in buying the tanker and
installing it for use is termed Cost of Tanker.
3.1.1.2 Annual Cost, (A)
Annual cost is the amount of money spent in producing the liquid product and shipping it out for sales in a
year. It comprises the GTL product manufacturing cost, natural gas cost and the shipping cost.
3.1.1.2.1 GTL Product Manufacturing Cost, (Pc)
This comprises the whole expenses incurred in running the FT plant in a year apart from the cost of buying
the natural gas. GTL Product Manufacturing cost comprises the cost of direct production, extra fixed charges
and plant overhead. The GTL Product Manufacturing Cost is expressed below:
Pc = Direct Production Cost + Extra Fixed Charges + Plant Overhead 3.5
It is estimated mathematically as shown below:
Pc = Dp + Fc + Op 3.5a
3.1.1.2.1.1 Direct Production Cost, (Pc)
The Direct Production cost, Dp =
Utilities + Maintenance Cost + Cost of Operating Supplies + Labour Cost + Cost of Direct Supervision +
Laboratory Charges + Royalty 3.6
It is represented mathematically as:
Dp= U + Mc + Cos + L + Ds + Lc+ R 3.6a
According to Douglas, (1988), certain clues and correlations are used in estimating the values of parts of the
annual costs. The clues and correlations were modified taking more real cases into consideration to give the
ones below:
- Utilities
- Maintenance Cost
This comprises the maintenance costs of the FT plants and the storage tankers. It is expressed as a
function of the investment cost as shown:
Maintenance Cost = 0.0024 * Total Investment Cost 3.7
- Cost of Operating Supplies
This is the cost of procuring the supplies and extra materials for running the FT plant annually. It is estimated as
shown:
Cost of Operating Supplies = 0.53 * Maintenance Cost 3.8
- Labour Cost
Labour cost is the remuneration of the manpower that would operate service and maintain the FT plant and the
tankers annually.
- Cost of Direct Supervision
The cost of direct supervision refers to the payment to the supervisors monitoring the operations of the FT plant
and tankers operators. It is evaluated as 20% of the total labour cost. This is shown mathematically as:
Cost of Direct Supervision = 0.2 * Labour Cost 3.9
- Laboratory Charges
Laboratory charges are the cost incurred in the laboratories of chemical analyses. It is expressed as:
Laboratory charges = 0.15 * Labour Cost 3.10
- Royalty
The royalty is paid as percentage of the total investment cost. It is shown mathematically below:
Royalty = 0.0018 * Total Investment Cost 3.11
For ease of analysis, the whole of these Direct Production Costs can be compressed to a simple cost in $/bbl of
liquid product.
Comparative Economic Analysis of Using Natural Gas For Liquefied Natural Gas
www.ijres.org 16 | Page
3.1.1.2.1.2 Extra Fixed Charges and Tax, (Fc)
Extra fixed charges refer to the extra costs incurred in the course of running the project annually, this falls into
the extra charges, taxes, settlements or payments made to government and people during the project. It is
estimated as a function of the investment cost as shown below:
Extra Fixed Charges = 0.0026 * Total Investment Cost 3.12
3.1.1.2.1.3 Plant Overhead, (Op)
Plant overhead refers to miscellaneous expenses incurred in providing materials, supplies and labour during
the project. It is expressed as the function of both labour cost and investment cost as shown below:
Plant Overhead = [0.72 * Labour Cost] + [0.0021 * Investment Cost] 3.13
3.1.1.2.2 Cost of Natural Gas, (N)
The cost of natural gas is the amount of money spent in buying the gas that is fed into the FT plant. It is
expressed mathematically below as:
N = Gas Price * Feed Gas Volume 3.14
The price of natural gas as at July, 2014 is taken to be $4.06/Mscf
3.1.1.2.3 Shipping Cost, (S)
Shipping cost refer to the cost of transporting the liquid product produced from the FT plant from the site to
the sales or market point. This sales point in this work refers to overseas where the liquid product which include
diesel is used in great capacities. It is rather expensive to own and run a shipping facility for the sake of the
GTL project, so shipping facilities are booked on hire. The cost of hiring the ship is then termed the shipping
cost. It is advisable to maximize the shipping capacity by storing the liquid product manufactured over time till
the volume reaches the maximum capacity of the ship, and then the ship could be hired to carry the yielded
product to market points overseas. The annual shipping cost is expressed below:
S = [336 days / (Ship Capacity / Product Daily Production)] * Cost per hire 3.15
NB: 336 days is used as the working period of the FT plant, the remaining 4 weeks is used for maintenance and
services.
3.1.2 Revenue Analyses
The revenue realizable from the project is estimated as a function of the amount of product yielded and the
price of the product. The main product yielded by the GTL process which is considered in this work is diesel.
The Gross Revenue from the project annually is estimated as shown below:
Gross Revenue = Diesel price * Diesel Daily Production * 336 days 3.16
As at July, 2014, the price of diesel in Nigeria is N136 per litre which is $0.84 per litre. $0.84 per litre is the
same as $134 per bbl. So the gross revenue can also be estimated as a function of the diesel price as shown:
Gross Revenue = 134 * Diesel Daily Production * 336 3.17
Annual Net Revenue is expressed as a function of the gross revenue and the annual cost as shown:
Annual Net Revenue = Gross Revenue – Annual Cost 3.18
3.2 Economics of LNG Production
3.2.1 Costs Analyses
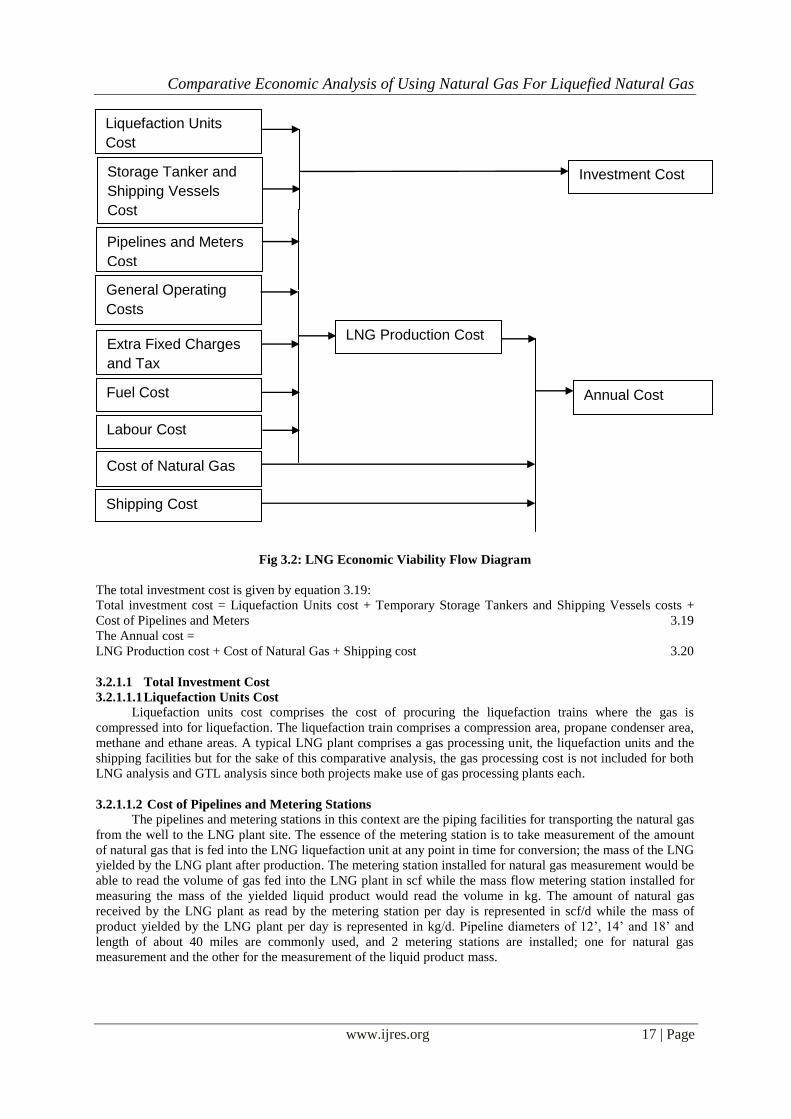
The flow chart for the economic evaluation of LNG production is shown in Fig 3.2. It consists of the
various costs at different stages: liquefaction units cost, cost of pipelines and metering stations and temporary
storage tanker and shipping vessels costs, which are summed up to get the total cost of investment. The general
operating cost, extra fixed charges, fuel cost, labour cost, cost of natural gas and shipping cost make up the
annual cost.
Comparative Economic Analysis of Using Natural Gas For Liquefied Natural Gas
www.ijres.org 17 | Page
Fig 3.2: LNG Economic Viability Flow Diagram
The total investment cost is given by equation 3.19:
Total investment cost = Liquefaction Units cost + Temporary Storage Tankers and Shipping Vessels costs +
Cost of Pipelines and Meters 3.19
The Annual cost =
LNG Production cost + Cost of Natural Gas + Shipping cost 3.20
3.2.1.1 Total Investment Cost
3.2.1.1.1 Liquefaction Units Cost
Liquefaction units cost comprises the cost of procuring the liquefaction trains where the gas is
compressed into for liquefaction. The liquefaction train comprises a compression area, propane condenser area,
methane and ethane areas. A typical LNG plant comprises a gas processing unit, the liquefaction units and the
shipping facilities but for the sake of this comparative analysis, the gas processing cost is not included for both
LNG analysis and GTL analysis since both projects make use of gas processing plants each.
3.2.1.1.2 Cost of Pipelines and Metering Stations
The pipelines and metering stations in this context are the piping facilities for transporting the natural gas
from the well to the LNG plant site. The essence of the metering station is to take measurement of the amount
of natural gas that is fed into the LNG liquefaction unit at any point in time for conversion; the mass of the LNG
yielded by the LNG plant after production. The metering station installed for natural gas measurement would be
able to read the volume of gas fed into the LNG plant in scf while the mass flow metering station installed for
measuring the mass of the yielded liquid product would read the volume in kg. The amount of natural gas
received by the LNG plant as read by the metering station per day is represented in scf/d while the mass of
product yielded by the LNG plant per day is represented in kg/d. Pipeline diameters of 12’, 14’ and 18’ and
length of about 40 miles are commonly used, and 2 metering stations are installed; one for natural gas
measurement and the other for the measurement of the liquid product mass.
Liquefaction Units
Cost
Storage Tanker and
Shipping Vessels
Cost
Pipelines and Meters
Cost
General Operating
Costs
Extra Fixed Charges
and Tax
Fuel Cost
Cost of Natural Gas
Shipping Cost
LNG Production Cost
Annual Cost
Investment Cost
Labour Cost

Comparative Economic Analysis of Using Natural Gas For Liquefied Natural Gas
www.ijres.org 18 | Page
3.2.1.1.3 Costs of Tankers and Shipping Vessels
The tankers are the temporary storage tankers procured for storing the liquid product manufactured
through the LNG process before pumping them into the shipping vessels for transport. Some operators do not
really require these storage tankers since they own their shipping vessels and the shipping vessels are always
available for use while some make use of these storage tankers since they book the shipping vessels on hire. As
their shipping facilities are booked on hire, they are advised to maximize the shipping capacity by storing the
liquid product manufactured over time till the volume reaches the maximum capacity of the shipping facility,
and then the facility is hired to carry the yielded product to market points overseas. The cost of buying the
tankers with the shipping vessels or buying the shipping vessels alone is termed Costs of Tankers and Shipping
Vessels.
3.2.1.2 Annual Cost
Annual cost is the amount of money spent in producing the liquid product and shipping it out for sales in
a year. It comprises the LNG production cost, natural gas cost and the shipping cost.
3.2.1.2.1 LNG Production Cost
This comprises the whole expenses incurred in running the LNG plant in a year apart from the cost of
buying the natural gas. LNG production cost comprises the general operating costs, extra fixed charges, fuel
cost and labour cost. The LNG Production Cost is expressed below:
LNG Production Cost = General Operating Cost + Extra Fixed Charges + Fuel Cost + Labour Cost 3.21
3.2.1.2.1.1 General Operating Cost
The General Operating cost = Utilities + Maintenance Cost + Cost of Operating Supplies + Extra Costs 3.22
- Maintenance Cost
This comprises the maintenance costs of the LNG plant and the storage tankers. It is expressed as a function of
the investment cost as shown:
- Cost of Operating Supplies
This is the cost of procuring the supplies and extra materials for running the LNG plant annually. It is estimated
as shown:
- Extra Costs
These extra costs refer to miscellaneous expenses incurred in running the project annually.
3.2.1.2.1.2 Extra Fixed Charges and Tax
Extra fixed charges and taxes refer to extra charges, taxes, settlements or payments made to government and
people during the project.
3.2.1.2.1.3 Fuel Cost
Fuel cost refers to the cost of procuring the fuel required to run the liquefaction unit, the compressor stations
and the pumps for pumping the LNG into the temporary storage tankers or shipping vessels. It is expressed as
shown below:
Fuel Cost =
Compression Power Cost + Liquefaction Power Cost + Pump Power Cost 3.23
3.2.1.2.1.4 Labour Cost
Labour cost = Direct Labour Cost + Cost of Direct Supervision 3.24
- Direct Labour Cost
Direct Labour cost is the remuneration of the direct manpower that would operate service and maintain the
LNG plant and the tankers annually.
- Cost of Direct Supervision
The cost of direct supervision refers to the payment to the supervisors monitoring the operations of the LNG
plant and tankers operators. It is evaluated as 20% of the total labour cost. This is shown mathematically as:
Cost of Direct Supervision = 0.2 * Labour Cost 3.25
For ease of analysis, the whole of these LNG Production Costs were compressed to simple costs in $/Mscf or
$/bbl of liquid product. The total LNG Production Cost is estimated as $1.15/Mscf of liquid product (Shively et
al, 2010)
3.2.1.2.2 Cost of Natural Gas
The cost of natural gas is the amount of money spent in buying the gas that is fed into the LNG plant. It is
expressed mathematically below as:
Cost of Natural Gas = Gas Price * Feed Gas Volume 3.26
The same price of natural gas of $4.06/Mscf is used for both LNG and GTL.
3.2.1.2.3 Shipping Cost

Comparative Economic Analysis of Using Natural Gas For Liquefied Natural Gas
www.ijres.org 19 | Page
Shipping cost refer to the cost of transporting the liquid product produced from the LNG plant from the
site to the sales or market point. This sales point in this work refers to overseas where the liquid product is re-
gasified for use in great capacities. This shipping cost are direct expenses which include fuel, manpower etc.
The annual shipping cost is expressed below:
Shipping Cost = Fuel and Manpower Cost per year + Maintenance Cost per year 3.27
Which is compressed as $3.56/Mscf of liquid product for transportation from Nigeria to Japan (Agbon, 2000).
Taking consideration of an inflation rate of 50% over the years, the new shipping cost would be $3.56/Mscf *
1.5 = $5.34/Mscf
3.2.2 Revenue Analyses
The revenue realizable from the project is estimated as a function of the amount of product yielded and
the price of the product. The Gross Revenue from the project annually is estimated as shown below:
Gross Revenue = LNG price * LNG Production Capacity per annum 3.28
The price of LNG fluctuates depending on the demands in the areas where the product is exported to. For
example, in July, 2012, LNG sold in Japan which is among the countries that import LNG from Nigeria at
73434 yen per tonne ie $719.14 per tonne (Dinakar, 2012). As at last June, 2014, Japan LNG imports rose
6percent at average price of 87397yen ie $856 per tonne (McKay, 2014). So we can decide to choose a base
value of $600 per tonne as the price of LNG taking consideration of the worst cases. So the gross revenue can
also be estimated as a function of the LNG price as shown:
Gross Revenue = $600/tonne * LNG Production, mmtpa * 1000000 3.29
Annual Net Revenue is expressed as a function of the gross revenue and the annual cost as shown:
Annual Net Revenue = Gross Revenue – Annual Cost 3.30
IV. GTL ECONOMIC ANALYSES RESULTS The particular case taken for study in this work is the Chevron Escravos GTL Project. The GTL plant is
expected to cost US$8.4 billion and to become operational by 2013 (Reddall, 2011). It will have an initial
capacity of 33,000 barrels per day of synfuel. Within ten years the capacity would be expanded to 120,000
barrels per day. The plant will use Sasol's Fischer-Tropsch process technology and Chevron's ISOCRACKING
technology (SPG Media Limited, 2009). The values of the essential factors and parameters for the FT plant
operation are presented in Table 4.1:
Table 4.1: Gas, Oil and Ship Parameters for the FT Plant Operation
Ship Capacity 900000 bbl
Tanker Capacity 900000 bbl
Diesel Price $134/bbl
Natural Gas Price $4.06/Mscf
Feed Gas Volume 325 MMscf/d
Plant Cost $8.4 billion
Present Capacity 33000 bbl/d
Capacity after 10 years 120000 bbl/d
4.1 Costs Analyses
4.1.1 Total Investment Cost, (I)
4.1.1.1 Plant Cost, (P)
The cost of procuring the Fischer-Tropsch plant and its installation is $8.4 billion (Chevron Corporation, 2013).
4.1.1.2 Plant Installation Cost, (Pi)
The cost of installing the FT plant and its accessories is included in the $8.4 billion in section 4.1.1.1.
4.1.1.3 Cost of Pipelines and Metering Stations, (Cpm)
The installation and execution of the pipeline installation and associated civil works is at a cost of $10.4 million
(Oil Serve Nigeria, 2012).
4.1.1.4 Cost of Tankers, (T)
The cost of buying and installing a liquid product storage tanker is set at $700000.
From eqn. 3.1, the Total Investment Cost = $8.4 billion + $10.4 million + $0.7 million = $8.411 billion
4.1.2 Annual Cost, (A)
4.1.2.1 GTL Product Manufacturing Cost, (Pc)
4.1.2.1.1 Direct Production Cost, (Pc)
The general operating cost is given as $4.44/bbl of diesel.
4.1.2.1.2 Extra Fixed Charges and Tax, (Fc)
Comparative Economic Analysis of Using Natural Gas For Liquefied Natural Gas
www.ijres.org 20 | Page
From eqn. 3.12, Extra Fixed Charges = 0.0026 * $8.4 billion = $22.5 million
4.1.2.1.3 Plant Overhead, (Op)
From eqn. 3.13, Plant Overhead = [0.72 * 918000] + [0.0021 * $8.4 billion] = $18.2 million
From eqn. 3.5, GTL Product Manufacturing Cost = ($4 * 33000 * 336) + $22.5 million + $18.2 million = $85
million
4.1.2.2 Cost of Natural Gas, (N)
From eqn. 3.14, Cost of Natural Gas = $4.06/1000 scf * 325 MMscf/d * 336 days = $443 million
4.1.2.3 Shipping Cost, (S)
Cost per hire = $3.15 million (Turton et al, 2003).
Ship capacity = 900000 bbl
Then, from eqn. 3.15, shipping cost for diesel transportation = [336 / (900000/33000)] * $3.15 million = $39
million
From eqn. 3.3, Annual cost = $85 million + $443 million + $39 million = $567 million.
NB: 336 days is used as the working period of the FT plant, the remaining 4 weeks is used for maintenance and
servicing.
4.2 Revenue Analyses
From eqn. 3.17, Gross Revenue = $134/bbl * 33000 bbl/d * 336 days = $1.48 billion.
Gross Revenue after 10 years = $134/bbl * 120000 bbl/d * 336 days = $5.4 billion.
From eqn. 3.18, Annual Net Revenue = $1.48 billion – $567 million = $918 million.
Assuming that the annual operating cost changes proportionately as feed gas volume and capacity change, then
the annual operating cost for producing 120000 bbl/d of diesel which starts in the 11th
year would be $2.06
billion
Annual Net Revenue after 10 years = $5.4 billion – $2.06 billion = $3.3 billion.
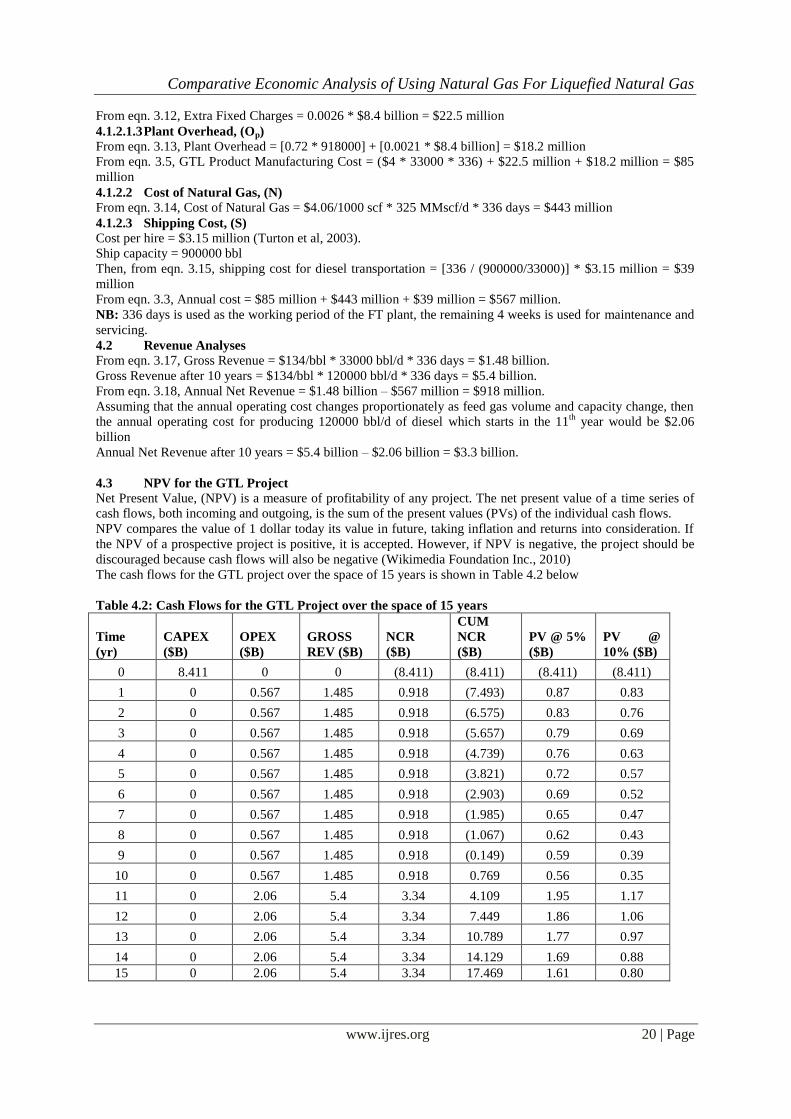
4.3 NPV for the GTL Project
Net Present Value, (NPV) is a measure of profitability of any project. The net present value of a time series of
cash flows, both incoming and outgoing, is the sum of the present values (PVs) of the individual cash flows.
NPV compares the value of 1 dollar today its value in future, taking inflation and returns into consideration. If
the NPV of a prospective project is positive, it is accepted. However, if NPV is negative, the project should be
discouraged because cash flows will also be negative (Wikimedia Foundation Inc., 2010)
The cash flows for the GTL project over the space of 15 years is shown in Table 4.2 below
Table 4.2: Cash Flows for the GTL Project over the space of 15 years
Time
(yr)
CAPEX
($B)
OPEX
($B)
GROSS
REV ($B)
NCR
($B)
CUM
NCR
($B)
PV @ 5%
($B)
PV @
10% ($B)
0 8.411 0 0 (8.411) (8.411) (8.411) (8.411)
1 0 0.567 1.485 0.918 (7.493) 0.87 0.83
2 0 0.567 1.485 0.918 (6.575) 0.83 0.76
3 0 0.567 1.485 0.918 (5.657) 0.79 0.69
4 0 0.567 1.485 0.918 (4.739) 0.76 0.63
5 0 0.567 1.485 0.918 (3.821) 0.72 0.57
6 0 0.567 1.485 0.918 (2.903) 0.69 0.52
7 0 0.567 1.485 0.918 (1.985) 0.65 0.47
8 0 0.567 1.485 0.918 (1.067) 0.62 0.43
9 0 0.567 1.485 0.918 (0.149) 0.59 0.39
10 0 0.567 1.485 0.918 0.769 0.56 0.35
11 0 2.06 5.4 3.34 4.109 1.95 1.17
12 0 2.06 5.4 3.34 7.449 1.86 1.06
13 0 2.06 5.4 3.34 10.789 1.77 0.97
14 0 2.06 5.4 3.34 14.129 1.69 0.88
15 0 2.06 5.4 3.34 17.469 1.61 0.80
Comparative Economic Analysis of Using Natural Gas For Liquefied Natural Gas
www.ijres.org 21 | Page
From Table 4.2, the Net Present Value at an expected rate of return/discount rate (the rate which the capital
needed for the project could return if invested in an alternative venture) of 5% is the sum of the present values
in that column for 5%. The sum of the PVs at 5% is $7.55 billion
The NPV at a discount rate of 10% = $2.11 billion
The project is worth investing on since the NPV in both cases is greater than zero.
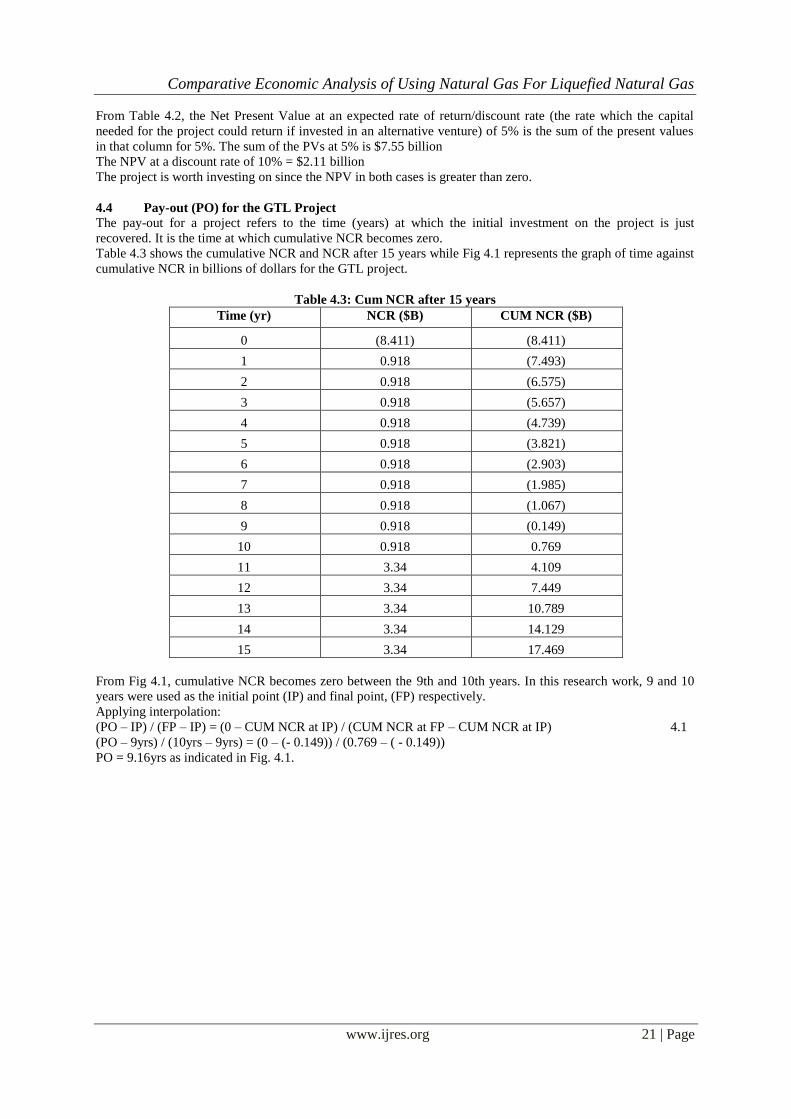
4.4 Pay-out (PO) for the GTL Project The pay-out for a project refers to the time (years) at which the initial investment on the project is just
recovered. It is the time at which cumulative NCR becomes zero.
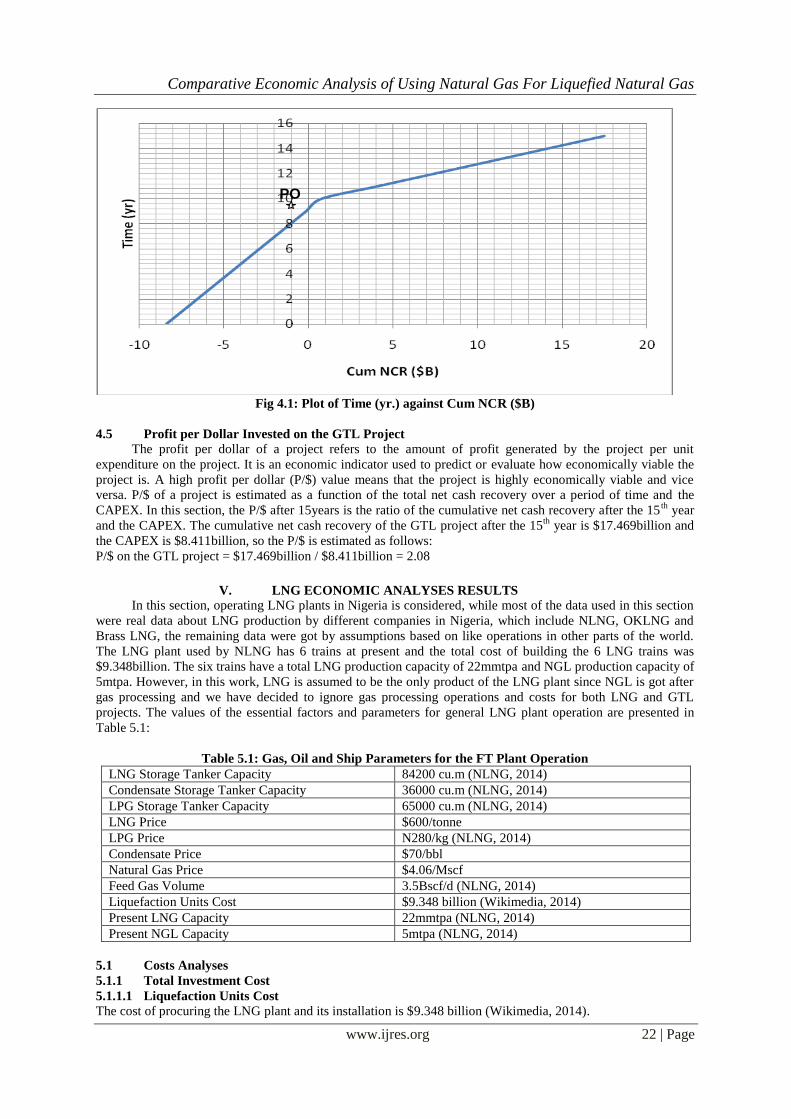
Table 4.3 shows the cumulative NCR and NCR after 15 years while Fig 4.1 represents the graph of time against
cumulative NCR in billions of dollars for the GTL project.
Table 4.3: Cum NCR after 15 years
Time (yr) NCR ($B) CUM NCR ($B)
0 (8.411) (8.411)
1 0.918 (7.493)
2 0.918 (6.575)
3 0.918 (5.657)
4 0.918 (4.739)
5 0.918 (3.821)
6 0.918 (2.903)
7 0.918 (1.985)
8 0.918 (1.067)
9 0.918 (0.149)
10 0.918 0.769
11 3.34 4.109
12 3.34 7.449
13 3.34 10.789
14 3.34 14.129
15 3.34 17.469
From Fig 4.1, cumulative NCR becomes zero between the 9th and 10th years. In this research work, 9 and 10
years were used as the initial point (IP) and final point, (FP) respectively.
Applying interpolation:
(PO – IP) / (FP – IP) = (0 – CUM NCR at IP) / (CUM NCR at FP – CUM NCR at IP) 4.1
(PO – 9yrs) / (10yrs – 9yrs) = (0 – (- 0.149)) / (0.769 – ( - 0.149))
PO = 9.16yrs as indicated in Fig. 4.1.
Comparative Economic Analysis of Using Natural Gas For Liquefied Natural Gas
www.ijres.org 22 | Page
Fig 4.1: Plot of Time (yr.) against Cum NCR ($B)
4.5 Profit per Dollar Invested on the GTL Project
The profit per dollar of a project refers to the amount of profit generated by the project per unit
expenditure on the project. It is an economic indicator used to predict or evaluate how economically viable the
project is. A high profit per dollar (P/$) value means that the project is highly economically viable and vice
versa. P/$ of a project is estimated as a function of the total net cash recovery over a period of time and the
CAPEX. In this section, the P/$ after 15years is the ratio of the cumulative net cash recovery after the 15th
year
and the CAPEX. The cumulative net cash recovery of the GTL project after the 15th
year is $17.469billion and
the CAPEX is $8.411billion, so the P/$ is estimated as follows:
P/$ on the GTL project = $17.469billion / $8.411billion = 2.08
V. LNG ECONOMIC ANALYSES RESULTS
In this section, operating LNG plants in Nigeria is considered, while most of the data used in this section
were real data about LNG production by different companies in Nigeria, which include NLNG, OKLNG and
Brass LNG, the remaining data were got by assumptions based on like operations in other parts of the world.
The LNG plant used by NLNG has 6 trains at present and the total cost of building the 6 LNG trains was
$9.348billion. The six trains have a total LNG production capacity of 22mmtpa and NGL production capacity of
5mtpa. However, in this work, LNG is assumed to be the only product of the LNG plant since NGL is got after
gas processing and we have decided to ignore gas processing operations and costs for both LNG and GTL
projects. The values of the essential factors and parameters for general LNG plant operation are presented in
Table 5.1:
Table 5.1: Gas, Oil and Ship Parameters for the FT Plant Operation
LNG Storage Tanker Capacity 84200 cu.m (NLNG, 2014)
Condensate Storage Tanker Capacity 36000 cu.m (NLNG, 2014)
LPG Storage Tanker Capacity 65000 cu.m (NLNG, 2014)
LNG Price $600/tonne
LPG Price N280/kg (NLNG, 2014)
Condensate Price $70/bbl
Natural Gas Price $4.06/Mscf
Feed Gas Volume 3.5Bscf/d (NLNG, 2014)
Liquefaction Units Cost $9.348 billion (Wikimedia, 2014)
Present LNG Capacity 22mmtpa (NLNG, 2014)
Present NGL Capacity 5mtpa (NLNG, 2014)
5.1 Costs Analyses
5.1.1 Total Investment Cost
5.1.1.1 Liquefaction Units Cost
The cost of procuring the LNG plant and its installation is $9.348 billion (Wikimedia, 2014).
PO

Comparative Economic Analysis of Using Natural Gas For Liquefied Natural Gas
www.ijres.org 23 | Page
5.1.1.2 Cost of Pipelines and Metering Stations
The installation and execution of the pipeline installation and associated civil works is at a cost of $10.4 million
(Oil Serve Nigeria, 2012).
5.1.1.3 Cost of Tankers and Shipping Vessels
The cost of buying and installing the liquid product storage tankers for temporary storage of the liquid products
is set at $700000.
Bonny Gas Transport ordered 6 new vessels at the cost of $1.6billion, this means that one vessel is at the
average cost of $267million. The present number of transport vessels that take care of the current 22mmtpa is
24. Then the cost of the 24 vessels based on the rate of $267million per vessel is $6.4billion.
The Total Investment Cost = $9.348 billion + $10.4 million + $6.4 billion + $0.7 million = $15.7491 billion
5.1.2 Annual Cost
5.1.2.1 LNG Production Cost
Note that 1tonne of liquid product corresponds to 70.62scf of liquid product using an average density of 0.5kg/l
for LNG. The LNG production cost is given as $1.15/Mscf of liquid product, therefore for 22mmtpa of LNG
which corresponds to 1553MMscf, the LNG production cost would be $1.786million.
5.1.2.2 Cost of Natural Gas
Cost of Natural Gas = $4.06/1000 scf * 3.5 Bscf/d * 365 days = $5.18billion
5.1.2.3 Shipping Cost
Total shipping cost for the whole product = $5.34/Mscf * 1553MMscf = $8.3million
Annual cost = $1.786million + $5.18billion + $8.3million = $5.19billion.
5.2 Revenue Analyses
Gross Revenue = $600/t * 22mmtpa * 1000000 = $13.2billion
Annual Net Revenue = $13.2billion – $5.19billion = $8.01billion.
5.3 NPV for the LNG Project
The cash flows for the LNG project over the space of 15 years is shown in Table 5.2 below
Table 5.2: Cash Flows for the LNG Project over the space of 15 years
Time (yr)
CAPEX
($B)
OPEX
($B)
GROSS
REV ($B) NCR ($B)
CUM
NCR ($B)
PV @ 5%
($B)
PV @
10% ($B)
0 15.75 0.00 0.00 (15.75) (15.75) (15.75) (15.75)
1 0.00 5.19 13.2 8.01 (7.74) 7.63 7.28
2 0.00 5.19 13.2 8.01 0.27 7.27 6.62
3 0.00 5.19 13.2 8.01 8.28 6.92 6.02
4 0.00 5.19 13.2 8.01 16.29 6.59 5.47
5 0.00 5.19 13.2 8.01 24.30 6.28 4.97
6 0.00 5.19 13.2 8.01 32.31 5.98 4.52
7 0.00 5.19 13.2 8.01 40.32 5.69 4.11
8 0.00 5.19 13.2 8.01 48.33 5.42 3.74
9 0.00 5.19 13.2 8.01 56.34 5.16 3.40
10 0.00 5.19 13.2 8.01 64.35 4.92 3.09
11 0.00 5.19 13.2 8.01 72.36 4.68 2.81
12 0.00 5.19 13.2 8.01 80.37 4.46 2.55
13 0.00 5.19 13.2 8.01 88.38 4.25 2.32
14 0.00 5.19 13.2 8.01 96.39 4.05 2.11
15 0.00 5.19 13.2 8.01 104.40 3.85 1.92
From Table 5.2, the Net Present Value at an expected rate of return/discount rate (the rate which the capital
needed for the project could return if invested in an alternative venture) of 5% is the sum of the present values
in that column for 5%. The sum of the PVs at 5% is $67.39 billion
The NPV at a discount rate of 10% = $45.17 billion

Comparative Economic Analysis of Using Natural Gas For Liquefied Natural Gas
www.ijres.org 24 | Page
The project is worth investing on since the NPV in both cases is greater than zero.
5.4 Pay-out (PO) for the LNG Project The pay-out for a project refers to the time (years) at which the initial investment on the project is just
recovered. It is the time at which cumulative NCR becomes zero.
Table 5.3 shows the cumulative NCR and NCR after 15 years while Fig 5.2 represents the graph of time against
cumulative NCR in billions of dollars for the LNG project.
Table 5.3: Cum NCR after 15 years
Time (yr) NCR ($B)
CUM NCR
($B)
0 (15.75) (15.75)
1 8.01 (7.74)
2 8.01 0.27
3 8.01 8.28
4 8.01 16.29
5 8.01 24.30
6 8.01 32.31
7 8.01 40.32
8 8.01 48.33
9 8.01 56.34
10 8.01 64.35
11 8.01 72.36
12 8.01 80.37
13 8.01 88.38
14 8.01 96.39
15 8.01 104.40
From Fig 5.2, cumulative NCR becomes zero between the 1st and 2nd years. In this research work, 1 and 2
years were used as the initial point (IP) and final point, (FP) respectively.
Applying interpolation:
(PO – IP) / (FP – IP) = (0 – CUM NCR at IP) / (CUM NCR at FP – CUM NCR at IP) 5.1
(PO – 1yr) / (2yr – 1yr) = (0 – (- 7.74)) / (0.27 – ( - 7.74))
PO = 1.97yr as indicated in Fig. 4.2
Fig 5.1: Plot of Time (yr) against Cum NCR ($B)
PO

Comparative Economic Analysis of Using Natural Gas For Liquefied Natural Gas
www.ijres.org 25 | Page
5.5 Profit per Dollar Invested on the LNG Project
The profit per dollar of a project refers to the amount of profit generated by the project per unit expenditure on
the project. It is an economic indicator used to predict or evaluate how economically viable the project is. A
high profit per dollar (P/$) value means that the project is highly economically viable and vice versa. P/$ of a
project is estimated as a function of the total net cash recovery over a period of time and the CAPEX. In this
section, the P/$ after 15years is the ratio of the cumulative net cash recovery after the 15th
year and the CAPEX.
The cumulative net cash recovery of the LNG project after the 15th
year is $104.40billion and the CAPEX is
$15.7491billion, so the P/$ is estimated as follows:
P/$ on the LNG project = $104.40billion / $15.7491billion = 6.62
VI. CONCLUSION
From the analysis made in this work, it is noted three major profit indicators where used which include
NPV, P/$ and Pay out.
The NPVs that were obtained from the analyses at different discount rates of 5% and 10% were both positive
indicating that the project are profitable and acceptable. However the LNG project has higher NPV than the
GTL project.
The P/$ which is an indicator of the amount of profit per unit CAPEX was got as 2.08 for the GTL project and
6.62 for the LNG project.
The LNG project has a much lower pay-out than the GTL project.
From all these economic analyses it is proven that converting natural gas to LNG in Nigeria is much more
economically viable and profitable than using the natural gas for diesel production through GTL technology.
REFERENCES [1.] Agbon I.S., (2000): A Cost Effective Analysis of Nigerian LNG; Technical Paper Presented at the SPE International Oil and Gas
Conference and Exhibition in Beijing, China, 7th – 10th November, 2000; SPE 64783.
[2.] Chevron Corporation, (2013): Gas-to-Liquids; Transforming Natural Gas into Superclean Fuels; Energy Sources; retrieved from http://www.chevron.com/deliveringenergy/gastoliquids/
[3.] Dinakar S., (2012): Japan Reduces Spot LNG Purchases as Prices Soar to Near a Record; retrieved,
http://mobile.bloomberg.com/news/2012-07-04. [4.] Douglas J.M., (1988): Conceptual Design of Chemical Processes, McGraw-Hill, New York.
[5.] Mattei S., (2005): GTL Technology and its Role in the World Energy Markets; Master Medea AA, 2004 – 2005; retrieved from
https://www.eni.com/en_IT/attachments/lavora-con-noi/pdf/GTL-technology.pdf [6.] McKay J., (2014): Japanese LNG Imports rose 6 Percent Last Month at Average Price of $856 per tonne; Daily LNG News, LNG
Journal; July 28, 2014.
[7.] NLNG, (2014): Facts and Figures on NLNG 2014; Nigeria LNG Limited, Intels Aba Road Estate, Port Harcourt, Rivers State, Nigeria.
[8.] Oilserve Nigeria Limited (Jan, 2012): Ongoing Power Plant Stations and Pipeline Projects Listing, Port-Harcourt, Nigeria.
[9.] Onaiwu E., (2008): How Much of a Future is there for Gas-to-Liquids (GTL) as a gas Monetization Option? CEPMLP, University of Dundee
[10.] Reddall, Braden (2011): Cost of delayed Chevron Nigeria plant now $8.4 bln; Reuters. Retrieved 2011-06-16.
[11.] Shively R., Ferrare J. and Petty B., (2010): Understanding Today’s Global LNG Business; Enerdynamics Corporation; 2.0 Edition; ISBN-10: 0974174424.
[12.] SPG Media Limited, (2009): Escravos Gas-to-Liquids Project, Niger Delta, Nigeria Hydrocarbons Technology. Retrieved 2009-
08-02. [13.] Turton, R.; Bailie, R. C.; Whiting, W. B.; Shaeiwitz, J. A., (2003): Analysis, Synthesis, and Design of Chemical Processes, 2nd
ed.; Prentice Hall: Upper Saddle River, NJ; pp. 143-186.
[14.] Wikimedia Foundation Inc., (2010): Net Present Value; Perth, Western Australia, Retrieved from http://en.wikipedia.org/wiki/netpresentvalue
[15.] Wikimedia Foundation Inc., (2013): Fischer Tropsch Process; Perth, Western Australia, Retrieved from
http://en.wikipedia.org/wiki/fischertropschprocess
[16.] Wikimedia Foundation Inc., (2014): Nigeria LNG; Perth, Western Australia, Retrieved from
http://en.wikipedia.org/wiki/nigerialng
NOMENCLATURE
A = Annual Cost
bbl/d = Barrel per day
CAPEX = Capital Expenditure
Cos = Cost of Operating Supplies
Cpm = Cost of Pipelines and Meters
CUM NCR = Cumulative Net Cash Recovery
DME = Dimethyl Ether
Dp = Direct Production Cost
Ds = Cost of Direct Supervision
Fc = Extra Fixed Charges

Comparative Economic Analysis of Using Natural Gas For Liquefied Natural Gas
www.ijres.org 26 | Page
FP = Final Point
FT = Fischer-Tropsch
GTL = Gas-to-Liquid
I = Total Investment Cost
IP = Initial Point
L = Labour Cost
Lc= Laboratory Charges
LNG = Liquefied Natural Gas
LPG = Liquefied Petroleum Gas
Mc = Maintenance Cost
MMscf/d = Million standard cubic feet per day
mmtpa = Million metric tonnes per annum
Mscf = Thousand standard cubic feet
N = Cost of Natural Gas
NCR = Net Cash Recovery
NGL = Natural Gas Liquid
NOx = Nitrogen oxides
NPV = Net Present Value
Op = Plant Overhead
OPEX = Operating Expenditure
P = Plant Cost
Pc = GTL Product Manufacturing Cost
Pi = Plant Installation Cost
PO = Pay-out
PV = Present Value
P/$ = Profit per Dollar Invested
R = Royalty
REV = Revenue
S = Shipping Cost
Scf = Standard cubic foot
SOx = Sulphur oxides
T = Cost of Storage Tanker
U = Utilities
$ = Dollars
$B = Billion dollars