comparative evaluation of gis-based landslide
TRANSCRIPT

RESEARCH Open Access
Comparative evaluation of GIS-basedlandslide susceptibility mapping usingstatistical and heuristic approach forDharamshala region of Kangra Valley, IndiaSwati Sharma1* and Ambrish Kumar Mahajan1,2
Abstract
Background: The Dharamshala region of Kangra valley, India is one of the fastest developing Himalayan city whichis prone to landslide events almost around the year. The development is going on a fast pace which calls for the needof landslide susceptibility zonation studies in order to generate maps that can be used by planners and engineers toimplement the projects at safer locations. A landslide inventory was developed for Dharamshala with help of the fieldobservations. Based on field investigations and satellite image studies eight casual factors viz. lithology, soil, slope,aspect, fault buffer, drainage buffer, road buffer and land cover were selected to represent the landslide problems ofthe study area. The research presents the comparative assessment of geographic information system based landslidesusceptibility maps using analytical hierarchy process and frequency ratio method. The maps generated have beenvalidated and evaluated for checking the consistency in spatial classification of susceptibility zones using predictionrate curve, landslide density and error matrix methods.
Results: The results of analytical hierarchy process (AHP) shows that maximum factor weightage results from lithologyand soil i.e. 0.35 and 0.25. The frequency ratios of the factor classes indicate a strong correlation of Dharamsala Group ofrock (value is 1.28) with the landslides which also agrees with the results from the AHP method where in the samelithology has the maximum weightage i.e. 0.71. The landslide susceptibility zonation maps from the statistical frequencyratio and heuristic analytical hierarchy process method were classified in to five classes: very low susceptibility, lowsusceptibility, medium susceptibility, high susceptibility and very high susceptibility. The landslide density distribution ineach susceptibility class shows agreement with the field conditions. The prediction rate curve was used for assessing thefuture landslide prediction efficiency of the susceptibility maps generated. The prediction curves resulted the area undercurve values which are 76.77% for analytical hierarchy process and 73.38% for frequency ratio method. The finalevaluation of the susceptibility maps was based on the error matrix approach to calculate the area distributed among thesusceptibility zones of each map. This technique resulted in assessing the spatial differences and agreement betweenboth the susceptibility maps. The evaluation results show 70% overall spatial similarity between the resultant landslidesusceptibility maps.(Continued on next page)
* Correspondence: [email protected] of Environment Science, School of Earth and EnvironmentalSciences, Central University of Himachal Pradesh, Shahpur, HP 176206, IndiaFull list of author information is available at the end of the article
Geoenvironmental Disasters
© The Author(s). 2018 Open Access This article is distributed under the terms of the Creative Commons Attribution 4.0International License (http://creativecommons.org/licenses/by/4.0/), which permits unrestricted use, distribution, andreproduction in any medium, provided you give appropriate credit to the original author(s) and the source, provide a link tothe Creative Commons license, and indicate if changes were made.
Sharma and Mahajan Geoenvironmental Disasters (2018) 5:4 https://doi.org/10.1186/s40677-018-0097-1

(Continued from previous page)
Conclusions: Hence it can be concluded that, the landslide susceptibility map (LSM) generated from the AHP andfrequency ratio method have yielded good results as the 100% landslide data falls in the high susceptibility and very highsusceptibility classes of both the maps. Also, the spatial agreement of almost 70% between the resultant maps increasesthe reliability on the results in the present study. Therefore, the LSM generated from AHP method with 76.77% landslideprediction efficiency can be used for planning future developmental sites by the area administration.
Keywords: Landslide susceptibility mapping, Heuristic and statistical model, Map evaluations
BackgroundLandslides are the down slope movement of debris, rocksor earth material under the force of gravity (Cruden,1991). Destructive mass movements such as landslides areconsidered as a major geological hazard around the globe.The Landslide activities in India are mostly associatedwith its the northern most states such as Uttarakhand,Himachal Pradesh, Sikkim and West-Bengal which are lo-cated in the Himalayan foothills with dynamic tectonicand climatic variations (Sarkar et al. 1995; Chauhan et al.2010) and also towards the southern India the Nilgirirange and the Western Ghats are prone to landslides in-stead of hard rocks and tectonic stability (Kaur et al.2017). According to the Geological survey of India almost15% of the land area in India is exposed to the landslideevents (Onagh et al. 2012) and is the worst affectedcountry by landslides in Asia after China (Guha-Sapir etal., 2012; Binh Thai et al. 2016). The tendency towards thelandslide is caused by various factors such as the steepnessof slopes, the tectonic conditions of the study area, pro-longed rainfall episodes with their return periods, topog-raphy and the inherent properties of the slope material,Anbalagan (1992). The mitigation measures for landslidesrequire the identification of existing landslides in an areafor spatial prediction of future events by studying the pre-vailing causal factors (Rai et al. 2014) for which a standardtool known as landslide susceptibility mapping is usedaround the world by various researchers (Guzzetti et al.,1999; Van Westen et al. 2008). Fell et al. 2008 consideredthe landslide susceptibility for identification of landslideprone sites and their relation to the set of causal factors inthat area. The landslide susceptibility mapping generallyinvolves two methods (I) qualitative which is based on ex-pert knowledge and the landslide inventory development(Saha et al., 2002) such as analytical hierarchy process(AHP) used by many researchers (Komac 2006; Ghosh etal. 2011; Kayastha et al. 2012; Wu et al. 2016; Kumar andAnabalgan 2016; Achour et al. 2017) (II) quantitativemethods including bivariate and multivariate modelingmethods for statistical evaluation of landslides occur-rences (Yin and Yan 1988; Kumar et al. 1993; Anbalaganand Singh 1996; Dai and Lee, 2002; Saha et al. 2005; Leeand Sambath 2006; Mathew et al. 2007; Dahal et al. 2008;Singh et al. 2008; Pradhan and Lee 2010; Rozos et al.
2011; Yalcin et al. 2011; Ghosh et al. 2011; Kayastha et al.2013; Bijukchhen et al. 2013; Anbalagan et al., 2015; Rawatet al. 2015; Sharma and Mahajan 2018; Chen et al. 2016).In India landslide susceptibility mapping for Gharwal andKumaun region of Uttarakhand has been carried out byPachauri and Pant 1992; Gupta et al. 1999; Anabalgan etal., 2008; Anbalagan et al., 2015; Kumar and Anabalgan,2016 whereas, Sarkar and Kanungo, 2004; Sarkar et al.2013; Ghosh et al. 2011 have mapped the landslides ofDarjeeling Himalaya for statistical correlation with thecausal factors. For dealing with the landslide hazard andits risk imposed on various elements, it is necessary toevaluate the correlation of probable causative factors withthe landslide location’s characteristics. The qualitativemethods such as AHP subjectively help to rank the causalfactors leading to classification of an area based on thepriority scale whereas, the quantitative methods (bivariateor multivariate statistical analysis) use the observed land-slide data for asserting the spatial relationship of the prob-lem with the prevailing geo-environmental parameters (J.Corominas et al. 2014). For generating a reliable spatial in-formation regarding a natural hazard, remote sensing dataand the geographic information system (GIS) are verypowerful tools (Tofani et al. 2013). The application of GISis useful in processing the digital elevation models forextracting information such as: slope angle, aspect, drain-age network etc. and to integrate the various thematiclayers for generating susceptibility, hazard or risk maps. Inthe state of Himachal Pradesh (H.P.) attempts have beenmade for landslide susceptibility zoning of the landslideprone areas such as district Chamba, Bilaspur and Parwa-noo (Sharma and Mehta 2012; Sharma and Kumar 2008)whereas studies related to the use of statistical modelingmethods for susceptibility mapping are lacking for import-ant areas of this hilly state such as Kangra Valley whichrests at the Himalayan foothills and experiences numberof landslide episodes in various parts every year. Someparts of district Kangra, Himachal Pradesh such as Dhar-amshala region is the fastest growing tourism hub whichhas been announced as one of the smart cities of India. TheDharamshala region is characterized by steeply dippingslopes with number of drainages cutting across its weakand weathered lithology. The district Kangra, H.P. is tec-tonically very active and has experienced number of
Sharma and Mahajan Geoenvironmental Disasters (2018) 5:4 Page 2 of 16

moderate and major earthquakes in past such as 1905 Kan-gra earthquake (Ms 7.8) which devastated this region badly(Ghosh and Mahajan 2011). Later on, from 1968 to 1986the Dharamshala region of district Kangra which is sand-wiched between longitudinal Main Boundary Thrust(MBT) in the north and Drini Thrust in the south, experi-enced three moderate earthquakes having magnitude vary-ing between Ms 4.9 to Ms 5.7 (Kumar and Mahajan 1991;Mahajan and Kumar 1994). The tectonic emplacement andthe northward movement of Indian landmass keep theDharamshala region of H.P. under continuous stress condi-tions making it tectonically and geomorphologically dy-namic. Mahajan and Virdi (2000) have studied the landslidesites of Dharamshala region using the field based mappingmethods and identified 25 major landslides for correlatingwith factors such as slope angle, relief, drainage networketc. Sharma et al. (2015) have documented a major land-slide event (Tirah lines Landslide) reported as a result ofvery high rainfall in the month of August 2013 whichdestroyed almost 10 multistoried buildings in army canton-ment area of Dharamshala. Looking at the past record ofthe landslide studies and the structural complexity in theDharamshala region it becomes important to statisticallyanalyze the factors playing major role in causing slope in-stability and in order to minimize their societal impacts bydeveloping landslide hazard or susceptibility zonation maps.This study involves the landslide susceptibility mapping(LSM) of Dharamshala region using heuristic judgmentbased analytical hierarchy process (AHP) and statistical fre-quency ratio (FR) method followed by the comparison of
susceptibility maps for prediction efficiency of future land-slide events. The resulting LSMs have been evaluated bythe use of landslide density analysis and error matrix tech-nique in order to check the concordance between the sus-ceptibility class area distributions from heuristic andstatistical methods. The evaluation of the LSMs has deter-mined the total agreement and the spatial difference be-tween the maps generated. The results can be useful forlandslide risk assessment studies and for planners in imple-menting developmental projects.
Study area and geological settingThe study area covers a rectangle of 39.7 sq. km (32°12′and 32° 15′ and N- 76°17′ and 76° 23′ E) as shown inFig. 1 with an elevation between 899 m to 2523 ma.m.s.l. The geomorphology of the study area is domi-nated with hills and mountains dissected by number ofdrainages which are locally known as khad. The mainkhad flowing are Charan khad at the southern edge,Banoi khad in the middle and the Gaj khad at the north-ern edge of the study area which are the main tributariesof river Beas in the district Kangra of Himachal Pradesh.Dharamshala region comes under wet temperate zonewith mean annual temperature remain between 19 ±0.5 °C and the annual precipitation 2900 ± 639 mm(Jaswal et al. 2014). Geologically the southern part of thearea falls in the Outer Himalaya comprising the Siwalik(boulder conglomerate exposures), Dharamsala groupand Murree formation (Sandstone, Claystone andmudstone) which is separated by Main Boundary Thrust
Fig. 1 Location map of the study area shown as hill shade view with local drainages and some of the major locations
Sharma and Mahajan Geoenvironmental Disasters (2018) 5:4 Page 3 of 16

(MBT) from the northern part of the study area com-prising of Lesser Himalayan rocks (Dharamkot Lime-stone and Chail Formation having low grademetamorphic such as slates) as shown in Fig. 2. Most ofthe settlements and the road excavation are in the OuterHimalayan rocks of the study area which are weak andhave led to many slope instability conditions in the past.Weak lithology such as weathered sandstone, claystonealong with unplanned construction activities or excava-tions of slopes for development projects and the heavyrainfall in this area often lead to landslides especially inthe monsoon season. The slopes of Dharamshala regionare steeply dipping up to > 41° with upper 5 m to 10 mcover of fluvial deposits or the debris cover which is eas-ily prone to sliding under adverse conditions.
MethodsThe present analysis was carried out in three steps: datacollection, database generation (thematic maps) andmodeling for landslide susceptibility mapping (LSM).Firstly, the study area has been investigated for the pre-vailing landslide conditions for which a landslide inven-tory (Fig. 3) was developed through field surveys andavailable satellite imageries. Thirty nine landslide loca-tions were mapped in the total study area of 39.7 km2.For the correlation of spatial distributions of the prevail-ing landslide with the chosen eight causal factors, vari-ous thematic maps were developed. With help ofASTERGDEM of 30 m resolution (source- USGS web-site) the drainage buffer, slope angle and the aspect mapshave been produced whereas the geology, soil and faultbuffer maps were prepared with the help of previouspublished maps (Mahajan and Virdi, 2000) and the landcover and road buffer maps were extracted with help of
Google earth imagery. All the prepared thematic mapswere rasterized at grid size of 30 × 30 with total pixelcount for the study area 44,165 for using in the GISbased modeling methods (AHP and FR). In the analyticalhierarchy process (AHP) method field survey basedjudgments and the data from previous literature havehelped in assigning weightage (heuristic) to the causalfactors and the factor classes whereas in the frequencyratio (FR) method, the ratio of landslide percentage in afactor class and the percentage area of that factor classgave the weightages (statistical). Both the modelingmethods (analytical hierarchy process and frequency ra-tio) have resulted in landslide susceptibility index (LSI)maps which were reclassed using fivefold classificationfor zoning the landslide prone area which is very lowsusceptibility (VLS), low susceptibility (LS), medium sus-ceptibility (MS), high susceptibility (HS) and very highsusceptibility (VHS). Both the landslide susceptibilityzonation maps (LSZM) were validated using the land-slide density distribution method and the predictioncurve success rates. The evaluations of the resultinglandslide susceptibility maps are based on spatial areadistribution match between the susceptibility classes forwhich the error matrix method has been used. The eval-uations represent the concordance and the disagreementof class area distribution from the use of heuristic judge-ments and the objective datasets.
Analytical hierarchy process (AHP)Analytical hierarchy process is the decision making for acomplex problem by arranging the elements of thatproblem in a hierarchy. It is a semi-qualitative process inwhich the weightages to the elements are assigned basedon the expert’s judgment and the weightage values vary
Fig. 2 Geological Map of Dharamshala region showing lithology and structure exposed (Source- Mahajan and Virdi 2000)
Sharma and Mahajan Geoenvironmental Disasters (2018) 5:4 Page 4 of 16

from 1 to 9 (Saaty, 1980, Saaty and Vargas 2001, Saaty,2005). The standard scale for using AHP method hasbeen given in Table 1, according to which factor classesand the factors are assigned rating with respect to eachother. Value 1 is assigned to the class with least influ-ence and value 9 is assigned to the class with maximuminfluence. After the weightage assignment the factormaps are reclassed and integrated in GIS.For checking the consistency of the comparison matrix
prepared by rating factors and factor classes against oneanother, consistency ratio (CR) is used and the CR valuebelow 0. 1 is considered acceptable (Ayalew et al. 2004).
CR ¼ CIRI
ð1Þ
Where CI is the consistency index calculated as:
CI ¼ Λ max−n=n−1 ð2Þ
Where n is the order of the matrix and max is themajor value of the matrix.
Random index (RI) is the consistency of the randomlygenerated pair wise matrix and is dependent on the sizeof the matrix as given in Table 2.
Frequency ratio (FR)Frequency ratio modeling is based on correlation oflandslides in an area with the natural and anthropogeniccausal factors in that area. Mathematically, it is the ratioof the percentage of the factor class (y) and the percent-age of the landslides (x) in that class (Lee and Talib,2005; Pradhan, 2010). The correlation factor for FR i.e.x/y (between the landslides and the factors) varybetween < 1 to > 1. If the FR value is > 1 then the thereexists a high correlation between landslide occurrenceand the factor class and if the FR is < 1 then the correl-ation is weak. All the thematic maps are reclassedaccording to the FR values for each factor class and thenintegrated in GIS for generating the landslide suscepti-bility index (LSI) map.
Landslide inventoryFor the preparation of landslide inventory field surveyshave been carried out to demarcate the GPS locationand the nature of landslides. The vector points of thenoted locations were verified using the Google earthimagery and then imported in GIS for applying the heur-istic and statistical models. The inventory data was splitinto training (75%) and testing (25%) groups as shown inFig. 3 for using in modeling and validation phase re-spectively. Thirty nine landslides with varying size weredemarcated out of which the largest landslide covers anarea of 0.103 km2. In total all the landslides cover1.1 km2 which is 2.7% of the total study area (39.7 km2)and the 75% training data of the total inventory landslide
Fig. 3 Landslide Inventory shown in the hill shade map of the study area prepared using the DEM data
Table 1 Scale for Pairwise comparison
Sr No. Scale Description
1. 1 Equally Preferred
2. 3 Moderately Preferred
3. 5 Strongly Preferred
4. 7 Very Strongly Preferred
5. 9 Extremely Important
6. Intermediate (2, 4, 6, 8) Preferences made halfwaybetween the main integers
Sharma and Mahajan Geoenvironmental Disasters (2018) 5:4 Page 5 of 16

area covers 0.81 km2. Table 3 shows the location and thetype of lithology the landslides belong to. Most of themapped landslides have got activated in the monsoonseason (July to September) in form of debris flowmostly. Some of the landslides show mudflow or earth
Table 2 Values of random index based on the size f the matrix
n 1 2 3 4 5 6 7 8 9 10
RI 0.0 0.0 0.58 0.90 1.12 1.24 1.32 1.41 1.45 1.51
Table 3 Landslide Inventory Locations
Landslide ID GPS Location Lithology Landslide Type
1. 32°13′50.48”N, 76°19′57.4″E Dharamsala Group of Rocks Debris Slide
2. 32°13′27.18”N, 76°19′32.9″E Dharamsala Group of Rocks Mud Flow
3. 32°13′45.2”N, 76°19′08.4″E Dharamsala Group of Rocks Earth Flow
4. 32°13′56.7”N, 76°19′01.60″E Dharamsala Group of Rocks Debris Slide
5. 32°13′9.5”N, 76°18′57.8″E Dharamsala Group of Rocks Mud Flow
6. 32°13′4.5”N, 76°18′29.7″E Dharamsala Group of Rocks Debris Slide
7. 32°14′07.9”N, 76°18′24.7″E Dharamsala Group of Rocks Earth Flow
8. 32°14′53.1”N, 76°19′02.5″E Dharamsala Group of Rocks Mud Flow
9. 32°15′42.5”N, 76°18′02.4″E Dharamsala Group of Rocks Debris Slide
10. 32°14′49.4”N, 76°18′4.05″E Dharamsala Group of Rocks Debris Slide
11. 32°14′48.7”N, 76°18′35.9″E Dharamsala Group of Rocks Debris Slide
12. 32°14′54.6”N, 76°18′29.2″E Dharamsala Group of Rocks Debris Slide
13 32°15′13.8”N, 76°18′10.4″E Dharamsala Group of Rocks Debris Slide
14. 32°15′8.5”N, 76°18′11.9″E, Dharamsala Group of Rocks Mud Flow
15. 32°15′8.4”N, 76°18′12.6″E Dharamsala Group of Rocks Debris Slide
16. 32°15′4.9”N, 76°19′22.3″E Dharamsala Group of Rocks Debris Slide
17. 32°13′16.5”N, 76°20′21.2″E Dharamsala Group of Rocks Debris Slide
18. 32°13′16.6”N, 76°20′22.9″E Dharamsala Group of Rocks Debris Slide
19. 32°13′46.9”N, 76°19′56.4″E Dharamsala Group of Rocks Debris Slide
20. 32°13′52.2”N, 76°19′45.3″E Dharamsala Group of Rocks Debris Slide
21. 32°13′56.8”N, 76°20′3.5″E Dharamsala Group of Rocks Debris Slide
22. 32°13′48.1”N, 76°19′56.4″E Dharamsala Group of Rocks Debris Slide
23. 32°14′5.9”N, 76°19′25.9″E Dharamsala Group of Rocks Debris Slide
24. 32°14′13.8”N, 76°19′25.6″E Dharamsala Group of Rocks Debris Slide
25. 32°14′0.3”N, 76°18′46.2″E Dharamsala Group of Rocks Debris Slide
26. 32°14′6.2”N, 76°18′53.3″E Dharamsala Group of Rocks Mud Flow
27. 32°13′43.4”N, 76°18′38.1″E Dharamsala Group of Rocks Earth Flow
28. 32°14′36.2”N, 76°18′21.6″E Dharamsala Group of Rocks Debris Slide
29. 32°13′43.7”N, 76°18′43.7″E Dharamsala Group of Rocks Debris Slide
30. 32°13′39.1”N, 76°18′37.5″E Dharamsala Group of Rocks Debris Slide
31. 32°13′42.8”N, 76°18′21.3″E Dharamsala Group of Rocks Debris Slide
32. 32°14′34.4”N, 76°18′4.3″E Dharamsala Group of Rocks Debris Slide
33. 32°14′33.5”N, 76°18′58.8″E Dharamsala Group of Rocks Debris Slide
34. 32°14′46.8”N 76°18′32.04″E Dharamsala Group of Rocks Debris Slide
35. 32°14′53.3”N, 76°18′29.06″E Dharamsala Group of Rocks Debris Slide
36. 32°14′2.3”N, 76°18′15.5″E Dharamsala Group of Rocks Debris Slide
37. 32°13′26.8”N, 76°19′6.4″E Dharamsala Group of Rocks Mud Flow
38. 32°13′23.6”N, 76°19′8.5″E Dharamsala Group of Rocks Debris Slide
39 32°13′17.0”N, 76°20′23.9″E Dharamsala Group of Rocks Debris Slide
Sharma and Mahajan Geoenvironmental Disasters (2018) 5:4 Page 6 of 16

flow type of mass movement which is due to lowstrength of material and water logging during the mon-soons. Figure 4 shows some of the past landslides of theDharamshala that have caused notable destruction.There exists no set rules for considering the trigger
factors in landslide susceptibility mapping, rather thestudy area characteristics and the data availability guidethe choice of thematic layers to be used (Ayalew andYamagishi, 2005). Based on the study area characteris-tics, eight parameters discussed below have been consid-ered as the major causal factors for landslides in theDharamshala region and their thematic maps as shownin Fig. 5 have been prepared at grid size of 30 × 30 withpixel count of 44,165 in each map for modeling in GIS.
1. Distance from drainage (Drainage buffer): TheDharamshala region has a dense drainage networkas shown in the location map (Fig. 1) and some ofthe landslides mapped during the field survey werefound in the vicinity of local drainages. To find thedistribution of landslides with respect to thedrainages flowing in the study area, a drainage buffermap or distance from the drainage map wasprepared at proximity of 100 m, 500 m and 1000 m.
2. Distance from fault (Fault buffer): The emplacementof faults in the study area has been found affectingthe slope stability as many landslides were found
near to the major faults in this region. To find theeffect of faults on the mass movement activity a faultbuffer map was prepared with three classes showingthe proximity of 1000 m, 2000 m and 3000 m.
3. Distance from road (Road buffer): In hilly areasslope excavation for road widening is a commonpractice which greatly influences the slope stabilityand similar has been found for the present studyarea where landslides associated with the slopeexcavation are common. Considering it one ofthe main causal factors a road buffer map wasprepared with buffer zones of 200 m, 800 m,1500 m and 2500 m.
4. Lithology: Lithology of an area is closely related tothe landslide occurrence as the strength of theemplaced lithology influences the slope stability. InDharamshala region the lithology is grouped in tofour classes which are Dharamsala Group(sandstone, claystone and mudstone), Siwalik Group(boulder conglomerates), Dharamkot Limestone andChail formation (Schist, Quartzite and Gneissic rocks).According to the landslide inventory data all thelandslides are located in the weak lithology ofDharamsala Group of rocks.
5. Soil: This parameter includes the overlying cover onthe lithology which has a varying thickness in thepresent study area and has been grouped into three
Fig. 4 Field photographs of few recent landslides in Dharamshala region a Vulnerable slope along Dharamshala - Mecleodganj main road bChhola landslide along the Charan Khad c Bypass road landslide near Kotwali bazaar d Naddi landslide near Dal lake
Sharma and Mahajan Geoenvironmental Disasters (2018) 5:4 Page 7 of 16
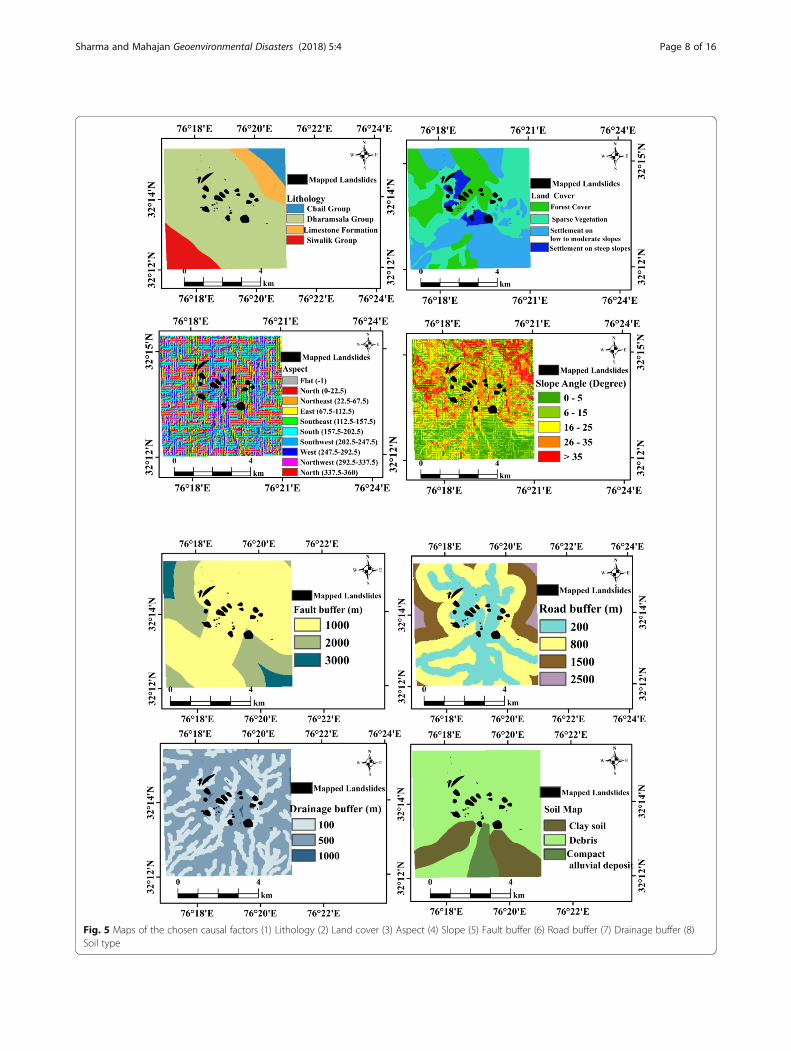
Fig. 5 Maps of the chosen causal factors (1) Lithology (2) Land cover (3) Aspect (4) Slope (5) Fault buffer (6) Road buffer (7) Drainage buffer (8)Soil type
Sharma and Mahajan Geoenvironmental Disasters (2018) 5:4 Page 8 of 16

classes: debris, clay soil and compact alluvialdeposits.
6. Land cover: The study area has been divided intofour classes: forest cover, settlement on low tomoderate slopes, sparsely vegetated area andsettlement on steep slopes.
7. Slope angle: The slope map was extracted from theDEM (30 m resolution) and classified into fiveclasses: 0° - 5°, 6° - 15°, 16° - 25°, 26° - 35° and ≥ 35°.These classes represent the slope inclinationsthroughout the Dharamshala area.
8. Aspect: After the slope extraction slope aspects wereextracted using GIS tool and was grouped into nineclasses: flat (− 1), N (0° – 22.5° and 337.5° - 360°), NE(22.5° – 67.5°), E (67.5° -112.5°), SE (112.5° – 157.5°), S(157.5° – 202.5°), SW (202.5° – 247.5°), W (247.5° –292.5°) and NW (292.5° – 337.5°).
As described in the section 2.1 and 2.2 analytical hier-archy process (AHP) and the frequency ratio (FR)methods were applied on the causal factors and thefactor classes for assigning weightages of influence andthe frequency ratio for finding correlation with the pre-vailing landslide conditions of the study area. The resultshave been presented in Table 4 (AHP) and Table 5 (FR)of section 3 respectively.
Results and discussionIn order to combine all the factor maps reclassed withtheir weightage values using AHP and frequency ratio(FR) values, the map algebra tool was used whichresulted the two-landslide susceptibility index (LSI)maps from both the models. The results of AHP com-parison matrix in the Table 4 show that maximum factorweightage results from lithology and soil i.e. 0.35 and0.25 respectively followed by the weightages of landcover (0.14), drainage (0.07) and slope (0.06) whereasfactors such as road, fault and aspect show a littleinfluence on the landslide occurrences. Figure 6b showsthe landslide susceptibility zonation (LSZ) map resultedfrom the heuristic analytical hierarchy process (AHP)method which has been classified using fivefoldclassification: very low, low, medium, high and very high.Table 5 showing the frequency ratios of the factor classesindicates a strong correlation of Dharamsala Group ofrock (FR value is 1.28) with the landslides which alsoagrees with the results from the AHP method where inthe lithology factor the maximum weightage has beengiven to the Dharamsala Group i.e. 0.71. Among theland cover classes, the settlements on steep angledslopes have the maximum FR value 6.51 indicatingmajor concentration of landslide sites in this class as32.7% of the landslide area alone falls in this class whichcovers only 5.04% of the total map area, which indicates an
impact of anthropogenic activities on and near steepsloping areas. Among the classes for the slope factor, classeswith 16° - 25° and 26° - 35° slope angles (moderate andsteep slopes) show maximum FR values 1.48 and 1.35respectively and collectively include more than 60% of thelandslide area. Among the aspects the north-east class with18.84% landslide area and the north aspect with 8.89%landslide area show maximum FR values 1.34 and 1.10which indicates more exploitation of north facing slopes orhigh subsurface moisture conditions due to less sun expos-ure of northern slopes which makes them unstable. None-theless the south facing slopes (SW aspect with 14.76%landslide area) have also shown a high correlation FR valuebut the maximum FR values for northern slopes are an in-teresting parameter showing high anthropogenic interfer-ence. The debris soil hosts all the inventory landslides(100%) and gives the maximum correlation value 1.33which is indicative of a shallow nature of maximum massmovements here on the steep slopes. The debris layer com-poses the weathered lithology from the Dharamsala Group(mudstone, sandstone, claystone) and the overlying fluvialdeposits. The drainages have shown a higher correlation(FR = 1.01) at 500 m proximity with 62.96% landslide areawhereas for the faults the proximity of 1000 m with 80.17%landslide area and 2000 m seem critical in term of FRvalues 1.16 and 0.75 respectively. The road buffer factorshows high landslide activity associated within 200 m prox-imity (FR = 1.51) with more than 50% of the landslide area,which indicated direct impact of slope excavation for roadwidening in the hilly areas. The resulting Fig. 6a showslandslide susceptibility zonation (LSZ) map from thestatistical frequency ratio (FR) method with classes: verylow susceptibility (VLS), low susceptibility (LS), mediumsusceptibility (MS), high susceptibility (HS) and very highsusceptibility (VHS). Therefore, a five-fold classificationscheme was followed based on natural break classifier op-tion in GIS, which maximizes the variance between the sus-ceptibility classes and represents a clear trend of class indexvalue distribution. The classifications of resulting landslidesusceptibility index maps were carried out in such a way sothat 20% of the LSZ map area using AHP and FR includes97% and 76% of the landslides respectively. Table 6 showsthe distribution of landslides in various susceptibility classesfrom heuristic and the statistical methods applied, whichshows 18.48 km2 area in high susceptibility class and4.31 km2 area in very high susceptibility class using AHPmethod whereas using the statistical method (FR) 9.3 km2
and 13.07 km2 falls under high and very high susceptibilityclass respectively.
Comparative assessments of LSZ maps from AHPand FRFor checking the reliability of the LSZ maps and com-paring their performance for future landslide prediction
Sharma and Mahajan Geoenvironmental Disasters (2018) 5:4 Page 9 of 16

Table 4 Comparison matrix of factor classes and the factors based on analytical hierarchy process (AHP)
Factors and Classes 1 2 3 4 5 6 7 8 9 Normalized Eigen Weight
Factor Classes Comparisons
Lithology
Dharamsala Group 1 0.71
Siwalik 0.14 1 0.16
Chail 0.13 0.33 1 0.07
Limestone Formation 0.13 0.33 1 1 0.07
CR = 0.043
Drainage Buffer
100 1 0.25
500 3 1 0.68
1000 0.25 0.11 1 0.07
CR = 0.009
Slope
0° - 5° 1 0.04
6° > 15° 2 1 0.07
16° - 25° 6 4 1 0.31
26° - 35° 6 4 1 1 0.36
> 35° 7 5 0.5 0.33 1 0.22
CR = 0.048
Land Cover
Forest 1 0.10
Sparsely vegetated area 2 1 0.16
Settlement on low to moderate slopes 0.33 0.25 1 0.05
Settlement on steep slopes 7 6 9 1 0.68
CR = 0.049
Fault Buffer
1000 1 0.72
2000 0.25 1 0.22
3000 0.11 0.25 1 0.07
CR = 0.038
Soil
Debris 1 0.76
Clay soil 0.11 1 0.08
Compact Alluvial deposits 0.2 2 1 0.16
CR = 0.001
Road Buffer
200 1 0.62
800 0.25 1 0.27
1500 0.13 0.17 1 0.07
2500 0.11 0.14 0.5 1 0.04
CR = 0.07
Aspect
Flat 1 0.04
North 6 1 0.20
Sharma and Mahajan Geoenvironmental Disasters (2018) 5:4 Page 10 of 16

spatially, various techniques have been proposed likeagreed area analysis, prediction rate curve, landslidedensity distribution etc. (Kayastha et al. 2013; Gupta etal. 2008). In the present study landslide density in thesusceptibility zones, prediction rate curves and the errormatrix method have been used for assessment and theevaluation of LSZ maps (heuristic and statistical) withrespect to each other. Table 6 shows the landslide dens-ity distribution among the susceptibility classes whichwas computed using the ratio of the landslide area in asusceptibility class to the area of that susceptibility class.The density should increase from the low to very highsusceptibility class (Gupta et al. 2008) which is true forthe present study. In case of AHP method the high (HS)and very high susceptibility (VHS) class have densityvalue 0.022 and 0.095 respectively whereas, for the FRmethod the HS and VHS class have density value 0.004and 0.059 respectively. Therefore, the susceptibility ofvarious zones in both the maps matched the inventorydata distribution noted from the field studies and alsoboth the LSZ maps show a reliable similarity withvarying values of landslide density distribution.The validation of the susceptibility maps from AHP
and FR technique was carried out using the predictionrate curve which computed the cumulative percentageof landslide occurrences (testing data) in both suscepti-bility zonation maps (Sarkar et al. 2013) which is shownin Fig. 7. The prediction curves were analyzed using area
under curve (AUC) values which indicate the modelfitness for landslide prediction in which value below 0.5refers low accuracy level whereas value from 0.5 to 1refers higher accuracy of the models used. In this studyboth the model heuristic (AHP) and statistical (FR) haveshown AUC value above 0.5, where AHP method gave76.77% (0.76) AUC and the FR method gave 73.38%(0.73) AUC. These results show that both the methodshave given a good prediction rate for estimating the fu-ture landslide probabilities spatially.
Evaluation of susceptibility zonation mapsBoth comparison method: landslide density distributionand prediction rate curve have shown that AHP and FRtechniques gave interpretations on a positive side butthere exists difference in the results of both the LSZmaps generated i.e. the area of each susceptibility classvaries in the maps from AHP and FR method. Thespatial differences between the susceptibility classes canhelp to evaluate the LSMs and can state that, how thechoices of subjective and objective judgements in heuris-tic and statistical methods respectively influence ourresults. To analyze the spatial difference among landslidesusceptibility classes an error matrix method was used(Gupta et al., 2008; Kayastha et al. 2012) which is pre-sented in Table 7. Using the combination of AHP-FRmaps error matrix was tabulated showing a high degreematch between areas of VLS, LS and MS zones of both
Table 4 Comparison matrix of factor classes and the factors based on analytical hierarchy process (AHP) (Continued)
Factors and Classes 1 2 3 4 5 6 7 8 9 Normalized Eigen Weight
North East 8 5 1 0.34
East 4 0.33 0.25 1 0.11
South East 0.25 0.25 0.17 0.17 1 0.03
South 1 0.33 0.2 0.2 3 1 0.04
South West 5 0.25 0.25 2 6 5 1 0.14
West 4 0.33 0.25 1 5 3 0.33 1 0.09
North West 0.5 0.2 0.17 0.17 0.5 0.5 0.2 0.33 1 0.02
CR = 0.09
Factor Comparison
Fault Buffer 1 0.04
Drainage buffer 2 1 0.07
Road Buffer 2 0.5 1 0.06
Land Cover 3 3 4 1 0.14
Lithology 7 6 5 5 1 0.35
Soil 7 6 5 3 0.5 1 0.25
Slope 2 0.5 0.5 0.33 0.2 0.33 1 0.06
Aspect 0.17 0.2 0.2 0.14 0.11 0.13 0.17 1 0.02
CR = 0.07
Sharma and Mahajan Geoenvironmental Disasters (2018) 5:4 Page 11 of 16

the LSZ maps which indicates a similarity of 16.95 km2
area in total which constitutes 42.6% of the total mapareas. In case of high susceptibility zone (HS) and veryhigh susceptibility (VHS) zone the difference in the areasis more i.e. for AHP 4.32 km2 area is covered in VHS
zone whereas for FR map 13.07 km2 area is covered inVHS zone but, in total more than 55% of both the map’ssusceptibility classes show spatial agreement. These dif-ferences in the areas of HS and VHS class can be due todifference of the methods used for susceptibility map-ping where in the AHP method subjective judgment ap-proach was used for determining the factor weightageswhereas in the FR method a bivariate statisticalapproach was used to compute weights of each classseparately. This evaluation has also helped to analyze theagreement of area distribution (pixels or km2) in theresulting LSMs which ascertains the consistency ofcausal factors used in the study whereas, the disagree-ment of area distribution refers to the difference oftechniques used. Nonetheless, 100% of the observedlandslide area falls in the high susceptibility and veryhigh susceptibility classes which shows good predictionrate of both LSZ maps.
ConclusionsThe findings in this study point out the followingconclusions:
1) The work shows a comparative study of GIS basedheuristic and statistical models for landslidesusceptibility zonation of Dharamshala region ofHimachal Pradesh, India. The lithology and the landcover factors have shown maximum contributiontoward landslide occurrence based on the computedweightage values using AHP and FR models. Theanthropogenic interferences in this hilly terrain havecaused huge impact on the slopes and the conditionis worsened as the internal properties of the lithologyand the overlying debris material are weak due towhich instability of slopes is triggered. Maximumlandslide locations were mapped in close proximityof the roads and the local drainages.
2) The landslide susceptibility zonation maps from both themethods have been classified into five zones: very lowsusceptibility (VLS), low susceptibility (LS), mediumsusceptibility (MS), high susceptibility (HS) and veryhigh susceptibility (VHS). Both the LSZ maps show agood model fitness for predicting future landslidelocations based on prediction rate curve method.Landslide density distribution increases from low to veryhigh susceptibility class of both the LSZ maps whichrepresents an agreement with the field conditionsof the study area. Such results have inferred a statisticalsimilarity between both the resultant susceptibility maps.
3) The LSMs prepared have been evaluated to checkthe consistency of area distribution among thesusceptibility classes from AHP and FR technique.The evaluation of the susceptibility maps was basedon the error matrix method which resulted into
Table 5 Frequency ratio values for the factor classes
Sr No. Factor Class Landslidegrid % (x)
Class% (y)
FrequencyRatio (x/y)
1 Lithology DharamshalaGroup
100 78.37 1.28
Siwalik Group 0 9.10 0
Chail 0 4.46 0
Limestone 0 8.08 0
2 Land Cover Forest 26.75 25.39 1.05
Sparsely VegetatedArea
40.13 35.58 1.12
Settlement on lowto moderate slopes
0.32 33.99 0.009
Settlement onsteep slopes
32.78 5.04 6.51
3 Slope 0° - 5° 17.05 24.40 0.69
6° - 15° 11.91 21.45 0.55
16° - 25° 36.54 24.58 1.48
26° - 35° 27.00 19.91 1.35
≥ 35° 7.50 9.66 0.77
4 Aspect Flat 10.20 11.07 0.92
North 8.89 8.06 1.10
North East 18.84 14.05 1.34
East 8.40 8.26 1.01
South East 13.70 16.51 0.82
South 7.91 8.64 0.91
South West 14.76 14.07 1.04
West 8.32 8.17 1.01
North West 8.97 11.16 0.80
5 Soil Type Debris 99.92 75.09 1.33
Clay soil 0.00 18.67 0
Compact AlluvialDeposits
0.08 6.24 0.01
6 DrainageBuffer
100 m 37.03 37.62 0.98
500 m 62.96 61.98 1.01
1000 m 0 0.38 0
7 Fault Buffer 1000 m 80.17 68.74 1.16
2000 m 19.82 26.20 0.75
3000 m 0 5.05 0
8 Road Buffer 200 m 55.70 36.78 1.51
800 m 44.29 43.42 1.01
1500 m 0 16.84 0
2500 m 0 2.95 0
Sharma and Mahajan Geoenvironmental Disasters (2018) 5:4 Page 12 of 16

Fig. 6 Landslide susceptibility zonation maps overlain with the mapped landslides in the study area: a LSM from Frequency Ratio model (b) LSMfrom Analytical Hierarchy Process model
Table 6 Shows the landslide area along with the landslide density distribution in the susceptibility classes of LSZ mapsS No. Analytical Hierarchy Process (AHP)
Class Pixel Count Class Area (km2) Landslide Area (km2) (training data) Landslide Density
I. VLS 1509 1.35 0 0
II. LS 8700 7.83 0 0
III. MS 8624 7.76 0 0
IV. HS 20,535 18.48 0.408 0.022
V. VHS 4797 4.31 0.41 0.095
Frequency Ratio (FR)
Class Pixel Count Class Area (km2) Landslide Area (km2) (training data) Landslide Density
I. VLS 1701 1.53 0 0
II. LS 9410 8.46 0 0
III. MS 8186 7.36 0 0
IV. HS 10,341 9.3 0.045 0.004
V. VHS 14,527 13.07 0.77 0.059
Sharma and Mahajan Geoenvironmental Disasters (2018) 5:4 Page 13 of 16

differences and the similarities of area (km2)assigned to each susceptibility zone. The resultshave shown a good consistency in the spatial areadistribution in very low, low and mediumsusceptibility classes of LSZ maps which count for42.6% of the susceptibility map areas. For the highand very high susceptibility classes the spatial areadistribution in both the LSZ maps varies to someextent but this difference factor is hindered as boththese classes HS and VHS include 100% landslideaffected area in each resulting LSZ map. The spatialdifference of susceptibility classes can be attributedto the variance of procedure [subjective (AHP) andobjective (FR)] in weighting the factors and theirclasses whereas, the spatial similarity of thesusceptibility zones may have occurred due tothe use of similar causal factors and the landslideinventory data for both the modeling methods.
4) The results from the final map evaluations indicatethat the 100% landslide data falls in the highsusceptibility (HS) and very high susceptibility
(VHS) classes and the spatial agreement betweenboth the resultant maps as evaluated from errormatrix method (Table 7) is more than 70%.Therefore, the maps landslide susceptibility mapsgenerated can prove to be reliable and helpful inthe landslide risk assessment for Dharamshala regionand can guide planners for implementingdevelopmental projects at safer locations.
AbbreviationsAsia-Pac: Pacific; Comput Geosci: Computers and geoscience; Comput IntelSys.: Computational intelligence research; Curr. Sci.: Current science; Eng.Geol.: Engineering geology; Environ: Environment; Environ: Environmental;Geoenviron: Geoenvironmental; Geol. Soc.: Geological society;Geophys.: Geophysical; Int J Appl Obs Geoinf.: International journal appliedobservation and Geoinformation; J Geosci: Journal of geoscience; J Sci IndRes: Journal of scientific and industrial research; J: Journal; Jour. Him.Geol.: Journal of Himalayan Geology; Jour.: Journal; Mt Res Dev: Mountainresearch development; Nat: natural; rem sens: Remote sensing; Sci.: Science;Spat. Inf. Res.: Spatial information research; Theor. Appl. Climatol: Theoretical
AcknowledgementsAuthors Prof. A.K. Mahajan and Mrs. Swati Sharma are thankful toDepartment of Science and Technology (DST) for all the research facilitiesprovided under the project no. NRDMS/11/3023/013(G) for carrying out thestudies. Department of Earth and Environmental sciences, Central universityof Himachal Pradesh is also acknowledged for providing all the resources.
FundingProject no. NRDMS/11/3023/013(G) funded by department of Science andTechnology (DST), India.
Availability of data and materialsEntire data prepared from this work is presented in the main manuscript.
Authors’ contributionsSS has carried out the field investigations and preparation of the thematicmaps with AKM for developing the landslide inventory. AKM has helpedto conceptualize the methodology and SS has drafted the entire manuscript.Both the authors have read and approved the manuscript.
Competing interestsThe authors declare that they have no competing interests.
Publisher’s NoteSpringer Nature remains neutral with regard to jurisdictional claims inpublished maps and institutional affiliations.
Author details1Department of Environment Science, School of Earth and EnvironmentalSciences, Central University of Himachal Pradesh, Shahpur, HP 176206, India.2Wadia Institute of Himalayan Geology, Dehradun, India.
Received: 25 October 2017 Accepted: 9 March 2018
ReferencesAchour, Y., A. Boumezbeur, R. Hadji, A. Chouabbi, V. Cavaleiro, and E.A. Bendaoud.
2017. Landslide susceptibility mapping using analytic hierarchy process andinformation value methods along a highway road section in Constantine,Algeria. Arabian Journal of Geosciences 10: 194. https://doi.org/10.1007/s12517-017-2980-6.
Anabalgan, R., D. Chakraborty, and A. Kohli. 2008. Landslide hazard zonationmapping on meso scale for systematic planning in mountainous terrain.Journal of Scientific and Industrial Research 67: 486–497.
Anbalagan, R. 1992. Landslide hazard evaluation and zonation mapping inmountainous terrain. Engineering Geology 32 (4): 269–277.
Fig. 7 Graph representing prediction rate curves of statistical modelFR (Red trend line) and AHP (Blue trend line) for interpretation ofmodel fitness for landslide susceptibility mapping and theirrespective AUC values
Table 7 Shows the error matrix for computing spatially agreedarea between the landslide susceptibility classes in AHP and FRLSZ maps
LandslideSusceptibility Class
VLS LS MS HS VHS Area (km2) FR
VLS 1.36 .78 .94 0 0 1.53
LS 0 5.33 3.13 0 0 8.47
MS 0 2.41 4.45 .49 0 7.37
HS 0 0 .07 9.21 .01 9.31
VHS 0 0 0 8.76 4.30 13.07
Area (km2) AHP 1.36 7.83 7.76 18.48 4.32
Sharma and Mahajan Geoenvironmental Disasters (2018) 5:4 Page 14 of 16

Anbalagan, R., R. Kumar, K. Lakshmanan, S. Parida, and S. Neethu. 2015. Landslidehazard zonation mapping using frequency ratio and fuzzy logic approach, acase study of Lachung Valley, Sikkim. Geoenvironmental Disasters 2 (1): 1–17.https://doi.org/10.1186/s40677-014-0009-y.
Anbalagan, R., and B. Singh. 1996. Landslide hazard and risk assessment mappingof mountainous terrains—A case study from Kumaun Himalaya, India.Engineering Geology 43 (4): 237–246.
Ayalew, L., and H. Yamagishi. 2005. The application of GIS based logisticregression for landslide susceptibility mapping in the Kakuda-Yahikomountains Central Japan. Geomorphology 65 (1): 15–31. https://doi.org/10.1016/j.geomorph.2004.06.010.
Ayalew, L., H. Yamagishi, and N. Ugawa. 2004. Landslide susceptibility mappingusing GIS based weighted linear combination, the case in Tsugawa area ofAgano river, Niigata Perfecture, Japan. Landslides 1: 73–81.
Bijukchhen, P., P. Kayastha, and M.R. Dhital. 2013. A comparative evaluation ofheuristic and bivariate statistical modelling for landslide susceptibilitymappings in Ghumri-Dhad Khola, East Nepal. Arabian Journal of Geosciences6: 2727–2743. https://doi.org/10.1007/s12517-0569-7.
Chauhan, S., M. Sharma, and M.K. Arora. 2010. Landslide susceptibility zonation ofthe Chamoli region, Gharwal Himalaya, using logistic regression model.Landslides 7: 411–423.
Chen, T., R. Niu, and X. Jia. 2016. A comparison of information value and logisticregression models in landslide susceptibility mapping by using GIS. Environmentand Earth Science 75: 867. https://doi.org/10.1007/s12665-016-5317-y.
Corominas, J., C. Van Westen, P. Frattini, L. Cascini, J.P. Malet, S. Fotopoulou, andK. Pitilakis. 2014. Recommendations for the quantitative analysis of landsliderisk. Bulletin of Engineering Geology and the Environment 73 (2): 209–263.
Cruden, D.M. 1991. A simple definition of a landslide. Bulletin of EngineeringGeology and the Environment 43 (1): 27–29.
Dahal, R.K., S. Hasegawa, S. Nonomura, M. Yamanaka, S. Dhakal, and P. Paudyal.2008. Predictive modelling of rainfall induced landslide hazard in thelesser Himalaya of Nepal based on weights of evidence. Geomorphology102: 496–510.
Dai, F., and C.F. Lee. 2002. Landslide characteristics and slope instabilitymodelling using GIS, Lantau Island, Hong Kong. Geomorphology42: 213–238.
Fell, R., J. Corominas, C. Bonnard, L. Cascini, E. Leroi, and W.Z. Savage. 2008.Guidelines for landslide susceptibility, hazard and risk zoning for land-useplanning. Engineering Geology 102 (3): 99–111. https://doi.org/10.1016/j.enggeo.2008.03.014.
Ghosh, G.K., and A.K. Mahajan. 2011. Interpretation of intensity attenuationrelation in 1905 Kangra earthquake with epicentral distance and magnitudein the northwest Himalayan region. Journal of the Geological Society of India77: 511–520.
Ghosh, S., E.J.M. Carranza, C.J. Van Westen, V. Jetten, and D.N. Bhattacharya. 2011.Selecting and weighting spatial predictors for empirical modeling of landslidesusceptibility in the Darjeeling Himalaya (India). Geomorphology 131: 35–56.
Guha-Sapir, D., F. Vos, R. Below, and S. Ponserre. 2012. Annual disaster statisticalreview 2011: The numbers and trends. Centre for Research on theEpidemiology of Disasters (CRED).
Gupta, R.P., D.P. Kanungo, M.K. Arora, and S. Sarkar. 2008. Approaches forcomparative evaluation of raster GIS-based landslide susceptibility zonationmaps. International Journal of Applied Earth Observation and Geoinformation10: 330–341. https://doi.org/10.1016/j.jag.2008.01.003.
Gupta, R.P., A.K. Saha, M.K. Arora, and A. Kumar. 1999. Landslide hazard zonationin a part of the Bhagirathi Valley. Garhwal Himalayas, using integratedremote sensing–GIS. Himalayan Geology 20: 71–85.
Guzzetti, F., A. Carrara, M. Cardinali, and P. Reichenbach. 1999. Landslide hazardevaluation: A review of current techniques and their application in a multi-scale study, Central Italy. Geomorphology 31 (1): 181–216.
Jaswal, A.K., N. Kumar, and P. Khare. 2014. Climate variability in Dharamsala-a hill stationin western Himalayas. Journal of Indian Geophysical Union 18 (3): 336–355.
Kaur, H., S. Gupta, and S. Parkash. 2017. Comparative evaluation of variousapproaches for landslide hazard zoning: A critical review in Indianperspectives. Spatial Information Research 25 (3): 389–398.
Kayastha, P., M. Dhital, and F. De Smedt. 2012. Landslide susceptibility using the weightof evidence method in the Tinau watershed, Nepal. Natural Hazards 63: 479–498.
Kayastha P, Dhital MR, De Smedt F (2013) Application of the analytical hierarchyprocess (AHP) for landslide susceptibility mapping: a case study from Tinauwatershed, west Nepal. Comput Geosci 52: 398–408. doihttps://doi.org/10.1016/j.cageo.2012.11.003.
Komac, M. 2006. A landslide susceptibility model using the analyticalhierarchy process method and multivariate statistics in perialpineSlovenia. Geomorphology 74: 17–28. https://doi.org/10.1016/j.geomorph.2005.07.005.
Kumar, K.V., R.R. Nair, and R.C. Lakhera. 1993. Digital image enhancement fordelineating active landslide areas. Asia-Pac Remote Sensing Journal 6 (1): 63–66.
Kumar, R., and R. Anabalgan. 2016. Landslide susceptibility mapping usinganalytical hierarchy process (AHP) in Tehri reservoir rim region, Uttarakhand.Journal of the Geological Society of India 87: 271–286.
Kumar, S., and A.K. Mahajan. 1991. Dharamsala seismotectonic zone–Neotectonicand state of stress in the area. Journal of Himalayan Geology 21: 53–57.
Lee, S., and T. Sambath. 2006. Landslide susceptibility mapping in the DamreiRomel area, Cambodia using frequency ratio and logistic regression models.Environmental Geology 50 (6): 847–855.
Lee, S., and J.A. Talib. 2005. Probabilistic landslide susceptibility and factor effectanalysis. Environmental Geology 47: 982–990. https://doi.org/10.1007/s00254-005-1228-z.
Mahajan, A.K., and S. Kumar. 1994. Linear features registered on the landsetimagery and seismic activity in Dharamsala Palampur region (NW Himalayas).Geofizika 11 (1): 15–25.
Mahajan, A.K., and N.S. Virdi. 2000. Preparation of landslides hazard zonation mapof Dharamshala town & adjoining areas. District Kangra (H.P.): technicalreport, 45. Dehradun: Wadia institute of Himalayan Geology. ref No. Endst/281/MA dt 27/2/99..
Mathew, J., V.K. Jha, and G.S. Rawat. 2007. Weights of evidence modelling forlandslide hazard zonation mapping in part of Bhagirathi valley, Uttarakhand.Current Science 92 (5): 628–638.
Onagh, M., V.K. Kumra, and P.K. Rai. 2012. Landslide susceptibility mapping in a partof Uttarkashi district (India) by multiple linear regression method. InternationalJournal of Geology, Earth and Environmental Sciences 4 (2): 102–120.
Pachauri, A.K., and M. Pant. 1992. Landslide hazard mapping based on thegeological attributes. Engineering Geology 32: 81–100.
Pradhan, B. 2010. Application of an advanced fuzzy logic model for landslidesusceptibility analysis. International Journal of Computational IntelligenceSystems 3 (3): 370–381.
Pham, B.T., Pradhan, B., Bui, D.T., Prakash, I. and Dholakia, M.B., 2016. Acomparative study of different machine learning methods for landslidesusceptibility assessment: a case study of Uttarakhand area (India).Environmental Modelling & Software 84:240-250. https://doi.org/10.1016/j.envsoft.2016.07.005.
Pradhan, B., and S. Lee. 2010. Regional landslide susceptibility analysis using back-propagation neural network model at Cameron highland, Malaysia.Landslides 7 (1): 13–30.
Rai, P.K., K. Mohan, and V.K. Kumra. 2014. Landslide hazard and its mapping usingremote sensing and GIS. Journal of Scientific Research 58: 1–13.
Rawat, M.S., D.P. Uniyal, R. Dobhal, V. Joshi, B.S. Rawat, A. Bartwal, and A.Aswal. 2015. Study of landslide hazard zonation in Mandakini Valley,Rudraprayag district, Uttarakhand using remote sensing and GIS. CurrentScience 109 (1): 158–170.
Rozos, D., G.D. Bathrellos, and H.D. Skilodimou. 2011. Comparison of theimplementation of rock engineering system and analytical hierarchy processmethods, based on landslide susceptibility maps, compiled in GISenvironment. A case study from eastern Achaia County of Peloponnesus,Greece. Environment and Earth Science 63 (1): 49–63.
Saaty, T.L. 1980. The analytical hierarchy process. Priority Setting. MacGraw-Hill:Resource Allocation, New York International Book Company 287.
Saaty, T.L. 2005. Theory and application of the analytic network process. Pittsburg: RWS.Saaty, T.L, L.G. Vargas. 2001. Models, methods, concepts and application of
analytical hierarchy process, 333. Kluwer, Boston.Saha, A.K., R.P. Gupta, and M.K. Arora. 2002. GIS-based landslide hazard zonation
in the Bhagirathi (ganga) valley, Himalayas. International Journal of remotesensing 23 (2): 357–369.
Saha, A.K., R.P. Gupta, I. Sarkar, M.K. Arora, and E. Csaplovics. 2005. An approachfor GIS based statistical landslide zonation with a case study in the Himalaya.Landslides 2: 61–69.
Sarkar, S., and D.P. Kanungo. 2004. An integrated approach for landslidesusceptibility mapping using remote sensing and GIS. PhotogrammetricEngineering and Remote Sensing 70 (5): 617–625.
Sarkar, S., D.P. Kanungo, and G.S. Mehrotra. 1995. Landslide hazard zonation: Acase study of Gharwal Himalaya, India. Mountain Research and Development15 (4): 301–309.
Sharma and Mahajan Geoenvironmental Disasters (2018) 5:4 Page 15 of 16

Sarkar, S., A. Roy, and T.R. Martha. 2013. Landslide susceptibility assessment usinginformation value method in parts of the Darjeeling Himalayas. Journal of theGeological Society of India 82 (4): 351–362.
Sharma, M., and R. Kumar. 2008. GIS based landslide hazard zonation: A casestudy from the Parwanoo area, lesser and outer Himalaya, H.P., India. Bulletinof Engineering Geology and the Environment 67: 129–137.
Sharma, S., and A.K. Mahajan. 2018. A comparative assessment of informationvalue, frequency ratio and analytical hierarchy process models for landslidesusceptibility mapping of a Himalayan watershed, India. Bulletin ofEngineering Geology and the Environment. 1–18. https://doi.org/10.1007/s10064-018-1259-9.
Sharma, R., U.K. Sharma, and A.K. Mahajan. 2015. Rainfall and anthropologicallyaccelerated mass movement in the outer Himalaya, north of Dharamshalatown, Kangra district, Himachal Pradesh: A cause of concern. Journal of theGeological Society of India 86 (5): 563–569.
Sharma, R.K., and B.S. Mehta. 2012. Macro-zonation of landslide susceptibility inGaramaura – Swarghat - Gambhar section of national highway-21, Bilaspurdistrict, Himachal Pradesh (India). Natural Hazards 60: 671–688. https://doi.org/10.1007/s11069-011-0041-0.
Singh, T.N., A. Gulati, I.K. Dontha, and V. Bhardwaj. 2008. Evaluating cut slopefailure by numerical analysis- a case study. Natural Hazards 47: 263–279.
Tofani, V., F. Raspini, F. Catani, and N. Casagli. 2013. Persistent Scattererinterferometry (PSI) technique for landslide characterization and monitoring.Remote Sensing 5 (3): 1045–1065.
Van Westen, C.J., E. Castellanos, and S.L. Kuriakose. 2008. Spatial data for landslidesusceptibility, hazard and vulnerability assessment: An overview. EngineeringGeology 102: 3–4.
Wu, Y.L., W.P. Li, P. Liu, H.Y. Bai, Q.Q. Wang, J.H. He, Y. Liu, and S.S. Sun. 2016.Application of analytic hierarchy process model for landslide susceptibilitymapping in the Gangu County, Gansu Province, China. Environment andEarth Science 75: 1–11.
Yalcin, A., S. Reis, A.C. Aydinoglu, and T. Yomralioglu. 2011. A GIS basedcomparative study of frequency ratio, analytical hierarchy process, bivariatestatistics and logistic regression methods for landslide susceptibility mappingin Trabzon, NE Turkey. Catena 85 (3): 274–287. https://doi.org/10.1016/j.catena.2011.01.014.
Yin, K.L., and T.Z. Yan. 1988. Statistical prediction model for slope instability ofmetamorphosed rocks. In proceedings of the 5th international symposium onlandslides, Lausanne, Switzerland. Vol. 2, 1269–1272. The Netherlands: AABalkema Rotterdam.
Sharma and Mahajan Geoenvironmental Disasters (2018) 5:4 Page 16 of 16