comparative fecal metagenomics unveils unique functional capacity … · 2012-09-12 · comparative...
TRANSCRIPT

RESEARCH ARTICLE Open Access
Comparative fecal metagenomics unveils uniquefunctional capacity of the swine gutRegina Lamendella1,4, Jorge W Santo Domingo2*, Shreya Ghosh1, John Martinson3 and Daniel B Oerther1,5
Abstract
Background: Uncovering the taxonomic composition and functional capacity within the swine gut microbialconsortia is of great importance to animal physiology and health as well as to food and water safety due to thepresence of human pathogens in pig feces. Nonetheless, limited information on the functional diversity of theswine gut microbiome is available.
Results: Analysis of 637, 722 pyrosequencing reads (130 megabases) generated from Yorkshire pig fecal DNAextracts was performed to help better understand the microbial diversity and largely unknown functional capacityof the swine gut microbiome. Swine fecal metagenomic sequences were annotated using both MG-RAST and JGIIMG/M-ER pipelines. Taxonomic analysis of metagenomic reads indicated that swine fecal microbiomes weredominated by Firmicutes and Bacteroidetes phyla. At a finer phylogenetic resolution, Prevotella spp. dominated theswine fecal metagenome, while some genes associated with Treponema and Anareovibrio species were found to beexclusively within the pig fecal metagenomic sequences analyzed. Functional analysis revealed that carbohydratemetabolism was the most abundant SEED subsystem, representing 13% of the swine metagenome. Genesassociated with stress, virulence, cell wall and cell capsule were also abundant. Virulence factors associated withantibiotic resistance genes with highest sequence homology to genes in Bacteroidetes, Clostridia, andMethanosarcina were numerous within the gene families unique to the swine fecal metagenomes. Other abundantproteins unique to the distal swine gut shared high sequence homology to putative carbohydrate membranetransporters.
Conclusions: The results from this metagenomic survey demonstrated the presence of genes associated withresistance to antibiotics and carbohydrate metabolism suggesting that the swine gut microbiome may be shapedby husbandry practices.
BackgroundThe animal gastrointestinal tract harbors a complexmicrobial network and its composition reflects the con-stant co-evolution of these microorganisms with theirhost environment [1]. Uncovering the taxonomic com-position and functional capacity within the animal gutmicrobial consortia is of great importance to under-standing the roles they play in the host physiology andhealth. Since animal feces can harbor human pathogens,understanding the genetic composition of fecal micro-bial communities also has important implications forfood and water safety. The structure and function of the
gut microbial community has received significant atten-tion for decades, although most of the work wasrestricted by the use of culture-based techniques.Recently, sequence analysis of the 16S rRNA gene hasshed new light on the diversity and composition ofmicrobial communities within several animal gut sys-tems [2]. While 16S rRNA gene-based techniques haverevealed impressive microbial diversity within gut envir-onments, this approach offers only limited informationon the physiological role of microbial consortia within agiven gut environment.Random sequencing of metagenomes has allowed
scientists to reveal significant differences in metabolicpotential within different environments [3], includingmicrobial populations associated with host-microbialpartnerships. Specifically, the publicly available database
* Correspondence: [email protected] Risk Management Research Laboratory, U. S. EnvironmentalProtection Agency, Cincinnati, OH 45268, USAFull list of author information is available at the end of the article
Lamendella et al. BMC Microbiology 2011, 11:103http://www.biomedcentral.com/1471-2180/11/103
© 2011 Lamendella et al; licensee BioMed Central Ltd. This is an Open Access article distributed under the terms of the CreativeCommons Attribution License (http://creativecommons.org/licenses/by/2.0), which permits unrestricted use, distribution, andreproduction in any medium, provided the original work is properly cited.
IMG/M [4] contains 596 Mb of sequencing data, repre-senting 1,424, 000 genes from 17 different gut micro-biomes. Studying gut metagenomes has particularlyhelped in uncovering several important biological char-acteristics of these microbiomes. For example, when 13human gut metagenomes were compared, Kurokawa etal [5] found that adult and infant type gut microbiomeshave enriched gene families sharing little overlap, sug-gesting different core functions within the adult andinfantile gut microbiota. This study also demonstratedthe presence of hundreds of gene families exclusivelyfound in the adult human gut, suggesting various strate-gies are employed by each type of microbiota to adaptto its intestinal environment [5]. Other gut microbiomestudies support these significant differences in core andvariable gene content from different animal hosts andenvironments [1,6-12]. Thus, comparing the gene con-tent of multiple gut microbiomes can help elucidate theecological underpinnings of gut systems.Thus far, the functional genetic potential of the pig
distal gut microbiota has not been studied using meta-genomics, although it is reasonable to assume that theswine gut supports similar genetic complexity to thehuman gut system, as they both prefer omnivorousfeeding behavior and harbor similar bacterial groups asdetermined by several phylogenetic studies [13-15]. Inthis study we used metagenomic data analyses to char-acterize the swine fecal microbiome with respect tospecies composition and functional content. In orderto search for the potential presence of unique genefunctions harbored by the swine gut microbiome, weperformed a comparative metagenomic approach, inthe context of phylogenetic and functionalcomposition.
ResultsTaxonomic distribution of swine fecal metagenomicsequencesApproximately 130 Mb of swine fecal metagenomesequence data were retrieved using two different pyrose-quencing platforms (454 GS20 and FLX), making thisstudy the first metagenomic survey of the swine gut(Table 1). The average read length for the GS20 andFLX runs were 156 bp and 230 bp, respectively. Taxo-nomic distribution of 16S rRNA gene sequences fromthe GS20 and FLX swine fecal metagenomes revealedsimilar taxonomic distributions (Figure 1). However,some differences in classification of 16S rRNA genesretrieved from the GS20 and FLX runs were noted.Most interestingly, fewer Firmicutes and more Bacteroi-detes were classified using the FLX 16S rRNA genes(using both RDP and Greengenes databases). This find-ing suggests shorter read lengths may lead to misclassifi-cation of these two divergent phyla. Additionally, more
unclassified sequences were retrieved from GS20 meta-genomic reads with e-values less than 0.01.Both GS20 and FLX metagenomic swine fecal datasets
were dominated by Firmicutes and Bacteroidetes phyla(Figure 1), which is consistent with several molecularphylogenetic studies of mammalian gut environments,including the swine gut [2,8,10,14]. Archaeal sequencesconstituted less than 1% of total rRNA gene sequencesretrieved in either swine metagenome, and were domi-nated by the Methanomicrobia and Thermococci, whichis consistent with previous molecular diversity studies ofpig manure [16]. While these populations are only avery small fraction of the total microbiota [17], metha-nogens contribute significantly to the metabolic poten-tial within in a gut environment [18]. The majority ofeukaryotic sequences derived from the swine metagen-omes are related to Chordata (i.e., host phylum), fungi,and the Viridiplantae (i.e., feed). Sequences sharing highsequence homology to Balantidium coli were obtainedin both swine metagenomes. The latter is a protozoanpathogen that causes balantadiasis in mammalian hosts,including human and swine. Since the samples were col-lected from healthy animals, these sequences might beassociated with non-pathogenic B. coli strains or withpathogenic strains in asymptomatic animals. Viralsequences were rare, comprising less than 1% of thetotal metagenomic sequences when compared to theSEED database (Additional File 1, Fig. S1). The lowabundance of viral sequences retrieved from the swinefecal metagenomes is consistent with viral proportionsretrieved in termite, chicken, and cattle gastrointestinalmetagenomes, and may be a direct result of limitedrepresentation of viral genetic information in currentlyavailable databases [8].A closer look at the taxonomic distribution of the
numerically abundant bacterial orders derived from theswine metagenomes revealed that Clostridiales, unclassi-fied Firmicutes, Bacteroidales, Spirochaetales, unclassi-fied gammaproteobacteria, and Lactobacillales were thetop six most abundant bacterial groups (Additional File1, Fig. S2). At the genus-level taxonomic resolution, Pre-votella species were the most abundant, comprising 19-22% of 16S rRNA gene sequences within both swinefecal metagenomes (Additional File 1, Fig. S3). Of theclassified Clostridiales, Sporobacter was the next mostabundant genus within both the swine fecal metage-nomic datasets. Anaerovibro, Clostridium, and Strepto-coccus genera encompassed at least 5% of rRNA genesequences in either the GS20 or FLX datasets.
Comparative gut metagenomics using 16S rRNA genesequencesWe performed comparative metagenomics on 16S rRNAgene sequences derived from publicly available gut
Lamendella et al. BMC Microbiology 2011, 11:103http://www.biomedcentral.com/1471-2180/11/103
Page 2 of 17

metagenomic datasets to reveal phylotype differencesbetween mammalian, avian, and invertebrate distal gutmicrobiomes. The distribution of bacterial phyla fromswine feces appeared closest to that of the cow rumenand chicken cecum, sharing more similar proportions ofBacteroidetes, Firmicutes, Proteobacteria, and Actino-bacteria (Figure 2). A statistical analysis comparing bac-terial distribution between hosts revealed severalsignificantly different bacterial groups. (Additional File2, Table S1 and S2). Human adult and infant distal gutmicrobiomes had significantly higher abundances ofActinobacteria (p < 0.05) than did the swine micro-biome (Additional File 2, Table S2). The fish gut micro-biome was comprised mostly of Proteobacteria andFirmicutes, while the termite gut was dominated bySpirochetes. Interestingly, the swine fecal metagenomealso harbored significantly more Spirochetes than manyother hosts. (Additional File 2, Table S3).Among the Bacteroidetes, Prevotella were significantly
more abundant in the swine fecal metagenome whencompared to all other gut metagenomes (p < 0.05), withthe exception of the cow rumen, while Bacteroides spe-cies were more abundant in chicken and human distalgut microbiomes (Figure 3). Additionally, Anaerovibrioand Treponema genera were exclusively found withinthe pig fecal metagenomes. Hierarchical clustering of
phylotype distribution (genus-level) from each gutmicrobiome revealed that community structure of theswine fecal microbiome was significantly different (p <0.05) from the other gut microbiomes (Figure 4A). Ofall the microbiomes used in the comparative analysis,the swine metagenomes exhibited the highest resem-blance to the cow rumen, displaying 59% similarity atthe genus level. Surprisingly, swine fecal communitystructure (genus-level) was less than 40% similar to anyof the human fecal microbiomes used in this study.
Diversity of swine gut microbiomeIn order to assess diversity of each gut metagenome,several statistical models were applied for measuringgenotype richness, evenness, and coverage of rRNA genehits against the RDP database. Overall, while coverage ofthe GS20 pig fecal metagenome was slightly lower thanthe FLX run (91% vs 97%), all diversity indices showedthat both swine metagenomes had similar genotypediversity (Table 2). Swine fecal microbiomes appeared tohave higher richness and lower evenness as compared tochicken, mouse, fish, and termite gut communities.This trend was further supported by a cumulative k-dominance plot, as both swine k-dominance curves areless elevated than all other gut microbiomes (AdditionalFile 1, Fig. S4). Rarefaction of the observed number of
Table 1 Summary of pyrosequencing data from Yorkshire swine fecal samples
Yorkshire Pig Fecal Metagenome GS20 Yorkshire Pig Fecal Metagenome FLX
Total no. of sequences 157,221 462,501
Total sequence size (bp) 24,518,676 106,193,719
Average sequence length (bp) 155.95 229.61
Genes* 42677 124684
CDS* 42349 (99.23%) 124050 (99.49%)
RNA* 328 (.77%) 634 (.51%)
rRNA* 328 634
5S 25 46
16S 114 248
18S 1 2
23S 181 325
28S 1 3
Ribosomal Database Project 16S rDNA hits 328 (0.21%) 1100 (.24%)
Greengenes 16S rDNA hits 295 (0.19%) 912 (0.20%)
w/Func Prediction* 33249 (77.9%) 93804 (75.2%)
COG* 33997 (79.7%) 97053 (77.8%)
Pfam* 34589 (81.0%) 99027 (79.4%)
TIGRfam* 16117 (37.8%) 44040 (35.3%)
Genome Properties* 3881 (9.1%) 10599 (8.5%)
Signalp* 11125 (26.1%) 35780 (28.7%)
TransMb* 8863 (20.8%) 26949 (21.6%)
MetaCyc* 3694 (8.7%) 10815 (8.7%)
* Indicates that these summary statistics were generated using the IMG/M-ER annotation system offered through the Joint Genome Institute [4] using theproxygene method [34].
Lamendella et al. BMC Microbiology 2011, 11:103http://www.biomedcentral.com/1471-2180/11/103
Page 3 of 17

OTUs (genus-level) indicated several of the individualhuman microbiomes were under-sampled (AdditionalFile 1, Fig. S5), thus, we combined individual pig fecal,human infant, and human adult rRNA gene hits, andalso performed diversity analyses on the total number ofrRNA gene hits (Table 2). While the number of rRNAgene sequences in metagenome projects is low, compari-son between available metagenomes showed that thehuman adult and pig microbiomes shared similar diver-sity patterns, and were more diverse than human infantmicrobiota.
Functional classification of the swine gut metagenomeTo predict the metabolic potential within the swine fecalmicrobiome, both the MG-RAST and the IMG/M-ERannotation pipelines were used. The broad functionalclassifications of the swine fecal metagenomic reads
were expected from previous metagenomic studies ofthe chicken cecum, cow rumen, human distal gut, andthe termite gut. Similar proportions of broad level SEEDsubsystem classification were retrieved for both theGS20 and FLX swine fecal metagenomes (AdditionalFile 1, Fig. S6). However, only 10% of sequencesretrieved from the GS20 pig fecal metagenome wereassigned to 574 subsystems, while more than 25% of allFLX reads were classified into 714 subsystems. This iscompatible with the longer reads produced by the latterinstrument, which allows for more robust gene predic-tions. When both pig fecal metagenomes were anno-tated using proxygenes within the JGI IMG/M ERpipeline, nearly one third of all GS20 and FLX pig fecalmetagenomes were assigned to Pfams, and over 20%were assigned to COGs. This finding suggests that theproxygene method for gene-centric approaches to
A. B.
C. D.
Figure 1 Taxonomic composition of bacterial phyla using 16S rRNA gene sequences retrieved from GS20 and FLX swine fecalmetagenomes. Using the “Phylogenetic Analysis” tool within MG-RAST, the GS20 and FLX sequencing runs were searched against the RDP andgreengenes databases using the BLASTn algorithm. The percent of sequences assigned to each of the bacterial phyla from the pig fecal GS20 (Aand B) and FLX (C and D) metagenomes is shown. The e-value cutoff for 16S rRNA gene hits to RDP and greengenes databases was 1×10⁻⁵ witha minimum alignment length of 50 bp.
Lamendella et al. BMC Microbiology 2011, 11:103http://www.biomedcentral.com/1471-2180/11/103
Page 4 of 17

80%
90%
100%
e co
mpo
sitio
n
40%
50%
60%
70%
eria
l 16S
rR
NA
gen
ActinobacteriaOther BacteriaProteobacteriaSpirochaetes
i i
0%
10%
20%
30%
rcen
t of T
otal
Bac
te FirmicutesBacteroidetes
0%
Per
Figure 2 Taxonomic distribution of bacterial phyla from swine and other currently available gut microbiomes within MG-RAST. Thepercent of sequences assigned to each bacterial order from swine and other gut metagenomes is shown. Using the “Phylogenetic Analysis” toolwithin MG-RAST, each gut metagenome was searched against the RDP and greengenes databases using the BLASTn algorithm. The percentageof each bacterial phlya from swine, human infant, and human adult metagenomes were each averaged since there was more than onemetagenome for each of these hosts within the MG-RAST database. The e-value cutoff for 16S rRNA gene hits to the RDP and greengenesdatabases was 1×10⁻⁵ with a minimum alignment length of 50 bp.
10
15
20
25
30
35
40
45
nt o
f cla
ssifi
ed b
acte
rial
gen
era
usin
g 16
S rD
NA
read
s
Cow Rumen
Chicken Cecum
Human Infant
Human Adult
Pig Feces
Termite Gut
Fish Gut
0
5
Perc
en
Figure 3 Taxonomic distribution of bacterial genera from swine and other currently available gut microbiomes within MG-RAST. Thepercent of sequences assigned to each bacterial order from swine and other gut metagenomes is shown. Using the “Phylogenetic Analysis” toolwithin MG-RAST, each gut metagenome was searched against the RDP and greengenes databases using the BLASTn algorithm. The percentageof each bacterial phlya from swine, human infant, and human adult metagenomes were each averaged since there was more than onemetagenome for each of these hosts within the MG-RAST database. The e-value cutoff for 16S rRNA gene hits to the RDP and greengenesdatabases was 1×10⁻⁵ with a minimum alignment length of 50 bp.
Lamendella et al. BMC Microbiology 2011, 11:103http://www.biomedcentral.com/1471-2180/11/103
Page 5 of 17

metagenomic studies is more robust than the directBLASTx assignment strategy. Diversity analyses of Sub-systems, COGs, and Pfams retrieved from swine meta-genomes and other gut metagenomes tested in thisstudy, revealed that larger sequencing efforts generatesignificantly more functional classes (Additional File 2,Tables S4 & S5). For example, an additional 150 Subsys-tems, 896 COGs, and 1271 Pfams were retrieved fromthe FLX run as compared to the GS20 metagenome,suggesting additional sequencing efforts for all gut
microbiomes are necessary to cover the high functionaldiversity in gut environments.Carbohydrate metabolism was the most abundant
SEED subsystem (MG-RAST annotation pipeline)representing 13% of both swine fecal metagenomes(Additional File 1, Fig. S6). Genes associated with cellwall and capsule, stress, and virulence were also veryabundant in both metagenomes. Approximately 16%of annotated reads from swine fecal metagenomeswere categorized within the clustering-based
Figure 4 Hierarchical clustering of gut metagenomes available within MG-RAST based on the taxonomic (A) and functional (B)composition. A matrix consisting of the number of reads assigned to the RDP database was generated using the “Phylogenetic Analysis” toolwithin MG-RAST, using the BLASTn algorithm. The e-value cutoff for 16S rRNA gene hits to the RDP database was 1×10⁻⁵ with a minimumalignment length of 50 bp. A matrix consisting of the number of reads assigned to SEED Subsytems from each gut metagenome was generatedusing the “Metabolic Analysis” tool within MG-RAST. The e-value cutoff for metagenomic sequence matches to this SEED Subsystem was 1×10⁻⁵
with a minimum alignment length of 30 bp. Resemblance matrices were calculated using Bray-Curtis dissimilarities within PRIMER v6 software[38]. Clustering was performed using the complete linkage algorithm. Dotted branches denote that no statistical difference in similarity profilescould be identified for these respective nodes, using the SIMPROF test within PRMERv6 software.
Lamendella et al. BMC Microbiology 2011, 11:103http://www.biomedcentral.com/1471-2180/11/103
Page 6 of 17

subsystems, most of which have unknown or putativefunctions. Additionally, 75% to 90% of metagenomicreads were not assigned to subsystems, suggestingthe need for improved binning and coding regionprediction algorithms to annotate these unknownsequences.To improve the meaning of metagenomic functional
analysis, we applied statistical methods to compare the29 broad level functional subsystems that are more or
less represented in the different microbiomes. As wasexpected, all gut metagenomes were dominated by car-bohydrate metabolism subsystems with amino acid, pro-tein, cell wall and capsule, and virulence subsystemsrepresented in relatively high abundance as well. Proteinmetabolism and amino acid subsystems were signifi-cantly more abundant in chicken, pig, and cow gutmetagenomes (Additional File 1, Fig. S7). Additionally,the termite, fish, and pig gut had a higher proportion of
Table 2 Diversity analyses of the gut microbiomes using 16S rRNA gene sequences
Metagenome Sobs Chao1 ACE Jackknife Shannon Shannon (non-parametric)
Simpson boneh coverage
Pig FecesGS20
52 77.09 (61.24-120.12)
116.05 (89.07-162.68)
76.88 (62.74-91.02)
3.17 (3.03-3.32)
3.36 0.07 (0.05-0.08)
10.34 0.91
Pig Feces FLX 71 113.86 (86.42-190.10)
125.60 (103.78-161.95)
119.78 (92.49-147.06)
3.19 (3.10-3.29)
3.27 0.08 (0.07-0.09)
5.84 0.97
Cow Rumen 40 63.00 (48.33-103.51)
168.17 (120.97-242.89)
63.63 (49.92-77.33)
2.56 (2.35-2.77)
2.86 0.15 (0.11-0.19)
10.58 0.88
ChickenCecum
37 47.11 (39.89-72.43)
68.02 (52.45-99.29)
51.00 (40.63-61.37)
2.25 (2.11-2.39)
2.36 0.20 (0.17-0.23)
5.58 0.97
Human In-A 20 33.75 (23.40-75.55)
62.23 (41.01-104.88)
32.94 (22.19-43.70)
2.52 (2.25-2.79)
2.84 0.10 (0.06-0.15)
5.05 0.81
Human In-B 10 20.50 (12.03-64.19)
27.79 (13.32-105.26)
23.03 (10.30-35.76)
0.84 (0.50-1.17)
1.15 0.68 (0.53-0.82)
3.02 0.90
Human In-D 26 32.00 (27.33-53.10)
34.06 (28.41-52.93)
35.00 (26.68-43.32)
2.97 (2.80-3.13)
3.16 0.05 (0.04-0.07)
4.95 0.90
Human In-E 18 22.20 (18.79-40.34)
26.41 (20.24-49.62)
25.00 (17.67-32.33)
1.11 (0.88-1.34)
1.26 0.60 (0.51-0.69)
3.72 0.96
Human In-M 26 46.00 (32.02-92.48)
80.76 (54.86-129.91)
43.95 (31.51-56.39)
2.97 (2.72-3.22)
3.42 0.05 (0.02-0.08)
7.34 0.69
Human In-R 21 23.50 (21.41-36.27)
26.77 (22.44-44.13)
27.00 (20.21-33.79)
2.57 (2.38-2.76)
2.72 0.10 (0.07-0.13)
2.83 0.87
Human F1-S 22 31.00 (24.00-62.45)
39.21 (29.33-62.40)
31.00 (22.68-39.32)
2.68 (2.49-2.87)
2.85 0.08 (0.06-0.10)
4.30 0.90
Human F1-T 37 64.14 (46.04-118.51)
109.84 (79.72-161.17)
66.22 (47.95-84.48)
3.05 (2.83-3.26)
3.36 0.07 (0.04-0.10)
9.39 0.82
Human F1-U 17 20.75 (17.64-39.02)
21.96 (18.14-38.53)
23.00 (16.21-29.79)
2.30 (2.04-2.56)
2.49 0.15 (0.08-0.21)
3.22 0.91
Human F2-V 37 46.10 (39.59-68.96)
48.59 (41.00-70.52)
51.00 (40.63-61.37)
3.07 (2.89-3.26)
3.29 0.07 (0.05-0.09)
7.64 0.87
Human F2-W 25 36.00 (27.88-66.94)
55.50 (39.11-90.92)
37.00 (27.40-46.60)
2.72 (2.50-2.93)
2.96 0.08 (0.06-0.11)
5.85 0.86
Human F2-X 19 21.00 (19.29-32.96)
22.80 (19.83-36.32)
24.00 (17.80-30.20)
2.57 (2.38-2.76)
2.72 0.09 (0.06-0.12)
3.06 0.94
Human F2-Y 27 40.20 (30.44-77.60)
41.54 (31.66-72.36)
39.78 (29.54-50.01)
2.87 (2.67-3.08)
3.10 0.07 (0.05-0.09)
5.82 0.87
Mouse Cecum 14 36.50 (19.23-110.77)
41.22 (20.35-130.67)
39.09 (19.22-58.95)
2.18 (1.78-2.58)
2.69 0.15 (0.04-0.25)
4.13 0.67
Termite Gut 13 27.00 (15.92-80.11)
30.75 (16.84-95.03)
29.19 (14.56-43.82)
2.05 (1.72-2.38)
2.38 0.16 (0.09-0.23)
3.39 0.79
Fish gut 14 19.00 (14.86-42.91)
20.45 (15.44-42.93)
20.00 (13.21-26.79)
2.29 (2.05-2.54)
2.50 0.11 (0.07-0.15)
3.71 0.87
Pig FecesTotal
91 127.25 (105.56-181.27)
184.42 (150.70-237.20)
127.57 (108.75-146.39)
3.15 (3.11-3.20)
3.19 0.06 (0.06-0.07)
0.34 0.99
Human InfantTotal
59 80.00 (66.47-118.05)
83.37 (69.43-115.92)
82.03 (68.30-95.75)
2.66 (2.52-2.79)
2.78 0.17 (0.14-0.20)
1.25 0.96
Human AdultTotal
72 89.00 (77.34-126.16)
85.74 (77.28-107.71)
89.60 (77.72-101.48)
3.35 (3.30-3.40)
3.39 0.05 (0.04-0.05)
0.37 0.99
Lamendella et al. BMC Microbiology 2011, 11:103http://www.biomedcentral.com/1471-2180/11/103
Page 7 of 17

reads classified to the chemotaxis and motility subsys-tems as compared to other gut metagenomes.
Comparative gut metagenomicsIn this study, we examined the functional similarity ofthe Yorkshire pig fecal metagenome by comparing it tocurrently available metagenomic projects. Hierarchicalclustering of functional profiles derived from gut meta-genomes available in the MG-RAST database revealedthat the GS20 and FLX swine fecal datasets sharedapproximately 70% similarity to other human metagen-omes (Figure 4B). This analysis also showed the swinegut metagenome clustered more closely with chickencecal and cow rumen metagenomes than to the humangut metagenomes (Figure 4B).We further investigated subsystems associated with
specialized cell wall and capsule enzymes, DNA recom-bination, and prophage genes since they were very abun-dant in the swine fecal metagenome (Additional File 1,Fig. S8). Within the DNA recombination and prophagesubsystem, the swine fecal metagenome was enrichedfor RstA phage-related replication proteins, terminases,and portal proteins. Additionally, more than 30 metage-nomic contigs (i.e., > 500 bp) shared high homology tounknown phage proteins. For proteins involved in thecell wall and capsule subsystem, unknown glycosyltransferases, a phosphoglucosamine mutase, and a phos-photransferase were over abundant in the swine meta-genome (Table 3). N-acetyl glucosamine-specific PTSsystem, proteins involved in mannose uptake, and novelcapsular polysaccharide synthesis enzymes were exclu-sively found within the swine fecal metagenome. Hier-archical clustering of all genes retrieved from the cell
wall and capsule functional subsystem for each gutmicrobiome revealed that swine fecal cell wall/capsuleprofiles were greater than 60% similar to those of thecow rumen. Additionally, cell wall and capsule profilesin the swine samples were more similar to termite gutthan the human gut (Additional File 1, Fig. S9). Whencarbohydrate subsystems were compared across gutmicrobiomes, maltose and maltodextrin utilization werethe most abundant carbohydrate subsystem in theswine, termite, and cow rumen. Analysis of carbohydratemetabolism using the SEED subsystem approach,revealed several proteins unique to the swine gut meta-genome such as an outer surface protein part of the cel-lobiose operon, a beta-glucoside-specific IIA componentand a cellobiose-specific IIC component of the PTS sys-tem, and a protein similar CDP-glucose 4,6-dehydratase.Two-way hierarchical clustering of COGs retrieved
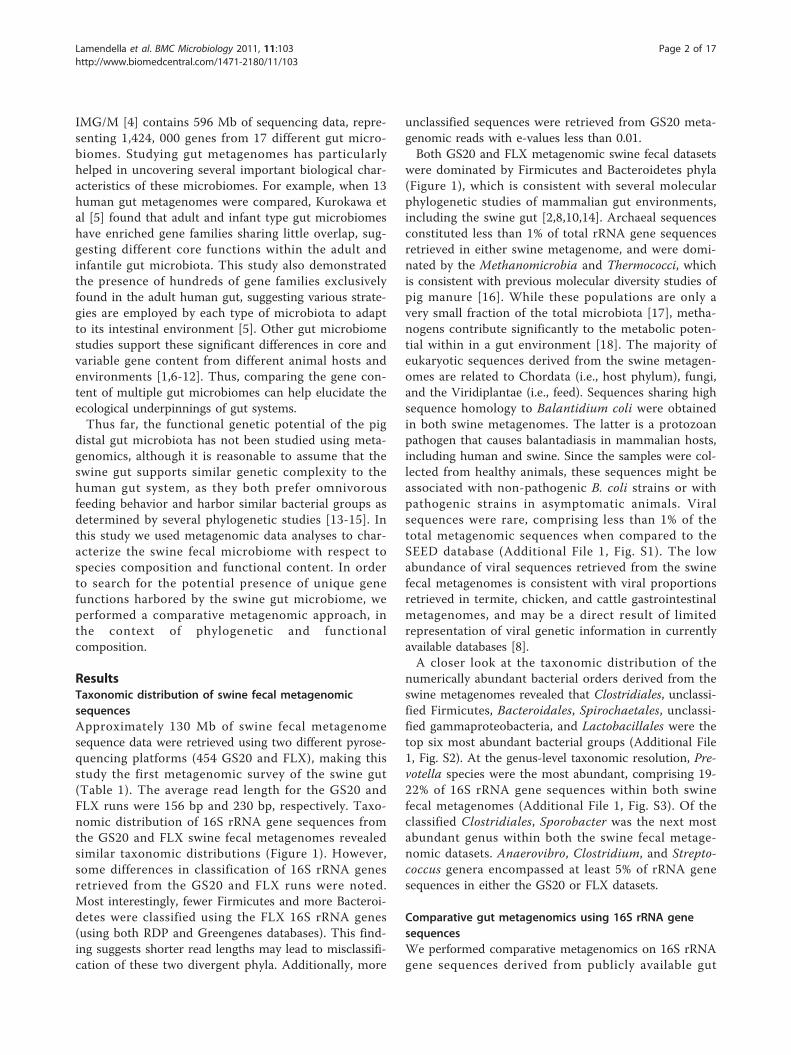
from swine, human, termite, and mouse gut micro-biomes revealed several suites of gene families unique tothe swine distal gut (Figure 5). Additionally, the swinefecal FLX run yielded a pool COGs unique to the FLXrun, suggesting the deeper level of sequencing uncov-ered a larger proportion of functional diversity. Interest-ingly, this analysis unveiled a large collection of COGsunique to the swine fecal metagenome.
DiscussionThe primary goal of this study was to characterize thefunctional content of the swine fecal microbiome. Wealso compared the pig distal gut samples to other cur-rently available gut metagenomes, as a method forrevealing potential differences in gut microbial systems.The comparative metagenomic approach used in this
Table 3 List of cell wall and capsule SEED subsystem functions overabundant in swine fecal metagenome
PigFeces
HumanAdult
HumanInfant
CowRumen
TermiteGut
MouseCecum
Fishgut
putative glycosyltransferase - possibly involved in cell wall localization andside chain formation of rhamnose-glucose polysaccharide
112 9 10 10 0 1 0
Phosphoglucosamine mutase (EC 5.4.2.10) 97 18 9 0 20 0 1
COG3178: Predicted phosphotransferase related to Ser/Thr protein kinases 66 10 6 4 5 2 1
3-deoxy-D-manno-octulosonate 8-phosphate phosphatase (EC 3.1.3.45) 27 10 9 2 0 1 3
O-antigen export system, permease protein 23 3 2 4 0 0 1
Glutamine synthetase, clostridia type (EC 6.3.1.2) 21 4 1 3 0 0 0
D-glycero-D-manno-heptose 1-phosphate guanosyltransferase 20 7 6 1 0 5 0
UDP-glucose 4-epimerase (EC 5.1.3.2) 14 1 2 0 9 1 1
Capsular polysaccharide synthesis enzyme Cap8D 9 0 1 1 0 0 0
D-alanine–D-alanine ligase B (EC 6.3.2.4) 8 0 0 0 0 0 0
PTS system, N-acetylglucosamine-specific IIB component (EC 2.7.1.69) 7 0 0 0 0 0 0
Mannose-1-phosphate guanylyltransferase (GDP) (EC 2.7.7.22) 5 0 0 0 0 0 0
2-Keto-3-deoxy-D-manno-octulosonate-8-phosphate synthase (EC 2.5.1.55) 3 0 0 0 0 0 0
capsular polysaccharide biosynthesis protein, putative 3 0 0 0 0 0 0
Capsular polysaccharide synthesis enzyme Cap8L 3 0 0 0 0 0 0
Lamendella et al. BMC Microbiology 2011, 11:103http://www.biomedcentral.com/1471-2180/11/103
Page 8 of 17
study identified unique and/or overabundant taxonomicand functional elements within the swine distal gut. Italso appears that the genes associated with the variableportion of gut microbiomes cluster by host environmentwith surprising hierarchical trends. Thus, our findingssuggest that while a majority of metagenomic readswere associated with a relatively conserved core micro-biome, the variable microbiome carries out many uniquefunctions [8]. The data also suggest that taxonomicallydiverse gut organisms maintain a conserved core set ofgenes, although it should be noted that the variablemicrobiome is more abundant than previously antici-pated. For example, of the 160 functional SEED Subsys-tems, DNA repair/recombination subsystems wereamongst the most abundant functions within all gutmicrobiomes. Since the frequency of a gene encoding aparticular metabolic function is usually related to itsrelative importance in an environment [8], transferable
elements are likely to be very important in shapingmicrobiome composition and diversity in gastrointest-inal environments. When comparing prophage andtransposon genes from each gut microbiome, the pigdistal microbiome examined in this study harbored anabundant and diverse array of horizontal gene transfermechanisms. When putative transposases for all avail-able gut metagenomes were retrieved using the IMG/Mannotation pipeline, the swine fecal metagenome har-bored the most diverse transposase profiles (i.e., 26 dif-ferent transposase families; Additional File 1, Fig. S10).The potential importance of transposable elements wasfurther supported by the fact that 42% of large contigs(> 500 bp) assembled from all pig fecal metagenomiccontained sequences that matched putative transposases(Table 4). Additionally, 24% of all large contigs matchedto proteins associated with antibiotic resistance mechan-isms. These results suggest that lateral gene transfer and
Figure 5 Two-way hierarchical clustering of functional gene groups from swine and other currently available gut metagenomeswithin JGI’s IMG/M database. Hierarchical clustering was performed using a matrix of the number of reads assigned to COGs from each gutmetagenome, which was generated using the “Compare Genomes” tool in IMG/M ER. COGs less abundant in a given metagenome are shown inblack/darkgreen, while more abundant COGs are shown in red.
Lamendella et al. BMC Microbiology 2011, 11:103http://www.biomedcentral.com/1471-2180/11/103
Page 9 of 17

Table 4 Summary of BLASTX results of pig fecal assembled contigs
ContigName
ContigLength
Number ofReads
Predicted Protein Organism AccessionNumber
E-value PercentIdentity
Contig09884 1444 159 hypothetical protein Bacteroides fragilis BAA95637 0 99%
Contig00095 646 22 tetracycline resistant proteinTetQ
Bacteroides sp. D1 ZP 04543830 2.00E-111 99%
Contig01271 812 22 tetracycline resistanceprotein
Prevotella intermedia AAB51122 3.00E-102 98%
Contig01956 731 17 macrolide-efflux protein Faecalibacterium prausnitzii A2-165 ZP 05613628 3.00E-85 99%
Contig01189 549 14 macrolide-efflux protein Bacteroides finegoldii DSM 17565 ZP 05859238 8.00E-83 98%
Contig00070 603 11 rRNA (guanine-N1-)-methyltransferase
Faecalibacterium prausnitzii A2-165 ZP 05614052 2.00E-81 100%
Contig07794 846 27 putative transposase Bacteroides fragilis AAA22911 4.00E-81 98%
Contig03360 671 10 ABC transporter, ATP-binding protein
Bacillus thuringiensis serovarpondicheriensis BGSC 4BA1
ZP 04090641 8.00E-77 77%
Contig09748 650 13 hypothetical proteinPRABACTJOHN 03572
Parabacteroides johnsonii DSM 18315 ZP 03477882 9.00E-71 77%
Contig00180 846 26 macrolide-efflux protein Faecalibacterium prausnitzii A2-165 ZP 05613628 6.00E-67 90%
Contig00608 527 7 ISPg3, transposase Prevotella tannerae ATCC 51259 ZP 05734821 1.00E-59 67%
Contig04843 578 7 hypothetical proteinCOPEUT 02459
Coprococcus eutactus ATCC 27759 ZP 02207638 2.00E-57 88%
Contig00340 847 24 conserved hypotheticalprotein
Bacteroides sp. 4 3 47FAA ZP 05257903 6.00E-56 72%
Contig02245 616 7 putative transposase Bacteroides thetaiotaomicron VPI-5482
NP 809147 3.00E-52 62%
Contig09776 531 9 resolvase, N domain protein Faecalibacterium prausnitzii A2-165 ZP 05613620 5.00E-41 100%
Contig02310 557 11 replication initiator proteinA
Faecalibacterium prausnitzii A2-165 ZP 05613624 1.00E-38 100%
Contig02075 524 9 Transposase Bacteroides fragilis 3 1 12 ZP 05284372 7.00E-38 92%
Contig02837 529 7 hypothetical proteinCLOSS21 01510
Clostridium sp. SS2/1 ZP 02439046 6.00E-37 67%
Contig09732 632 11 hypothetical proteinBACCOP 00975
Bacteroides coprocola DSM 17136 ZP 03009123 1.00E-35 62%
Contig09862 574 16 conserved hypotheticalprotein
Oxalobacter formigenes HOxBLS ZP 04576182 1.00E-34 100%
Contig00069 897 21 regulatory protein Sphingobacterium spiritivorum ATCC33300
ZP 03965851 4.00E-29 43%
Contig00129 529 9 transposase, putative Bacteroides sp. 2 1 7 ZP 05288481 8.00E-26 75%
Contig00130 674 11 hypothetical proteinBACCOP 00975
Bacteroides coprocola DSM 17136 ZP 03009123 6.00E-24 43%
Contig09924 1355 55 conserved hypotheticalprotein
Magnetospirillum gryphiswaldenseMSR-1
CAJ30045 2.00E-23 45%
Contig00140 552 13 ISPg7, transposase Cyanothece sp. PCC 8802 YP003135760
5.00E-23 44%
Contig00572 675 16 transposase, putative Bacteroides sp. 2 1 7 ZP 05288481 2.00E-21 57%
Contig09792 556 9 hypothetical protein ALIPUT01364
Alistipes putredinis DSM 17216 ZP 02425220 2.00E-16 67%
Contig09902 528 14 putative transposase Lentisphaera araneosa HTCC2155 ZP 01873850 2.00E-12 63%
Contig09796 867 17 hypothetical proteinCLONEX 03424
Clostridium nexile DSM 1787 ZP 03291203 3.00E-07 35%
Contig01049 548 5 No significant similarityfound
- - - -
Contig04775 565 4 No significant similarityfound
- - - -
Contig09740 531 7 No significant similarityfound
- - - -
Contig09927 656 29 No significant similarityfound
- - - -
Lamendella et al. BMC Microbiology 2011, 11:103http://www.biomedcentral.com/1471-2180/11/103
Page 10 of 17

mobile elements allow gut microbial populations to per-petually change their cell surface for sensing their envir-onment and collecting nutrient resources present in thedistal intestine [2].Interestingly, a majority of these transposable elements
belonged to the Bacteroidetes genomes. These geneticelements have been shown to aid in the adaptation ofthis diverse group of bacteria to the distal gut environ-ments [2]. Many of the genetic features unique to theswine fecal metagenome encoded cell surface features ofdifferent Bacteroidetes populations, suggesting the adap-tation of Bacteroidetes populations to distinct nicheswithin the swine distal gut microbiome. While the pre-cise role of diet, antibiotic usage, and genetics on shap-ing the ecology of the distal pig gut will require furtherstudy, it should be noted that industrialization of theswine industry has lead to the frequent use antibioticsto supplement the pig diet to maintain and increasemeat production.Studying the swine distal gut metagenome also shed
light on the diversity and high occurrence of antibioticresistance mechanisms employed by the microbiome(Additional File 1, Fig. S11). Antibiotics are widely usedas additives in food or water within swine feeding opera-tions to prevent and treat animal disease and to pro-mote animal growth [19]. Seepage and runoff of swinewaste into both surface and groundwater with antibio-tics and antibiotic-resistant bacteria poses a significantthreat to public health. Nearly 6% of all assigned meta-genomic reads retrieved from both swine fecal metagen-omes were involved in antibiotic resistance mechanisms.Interestingly, tetracycline resistance was the most abun-dant class of virulence subsystems within the swine fecalmetagenome, which may be explained by the fact thatthis antibiotic class was used in the diet supplied to theanimals associated with this study. This antibiotic classis reported as comprising nearly half of the total amountof antibiotics used in commercial swine operations [20].Resistance to fluoroquinolones was also well repre-
sented in the swine fecal metagenome, and may beexplained by the increase of its non-therapeutic usewithin pig feed. While early studies indicated there wasa low risk of fluoroquinolone resistance, recent studiesare showing the use of fluoroquinolones is among themost important factors associated with finding resistantE. coli and Campylobacter in animal operations [21].Interestingly, there was no history of fluoroquinoloneuse on the swine farm from which these samples werecollected. Fluoroquinolone resistance has been found onfarms with no history of fluoroquinolone use, suggestingthat resistant organisms, such as Campylobacter havethe ability to spread between pig farms. Genes with highsequence similarity to methicillin-resistant Staphylococ-cus subsystem were also retrieved in this study. This
finding is important considering MRSA carriage hasbeen elevated in swine and exposed farmers and veteri-narians [22], suggesting that MRSA infection is a signifi-cant risk in swine farm resident and worker cohorts.More than 12% of virulence subsystems identified in
the pig fecal metagenome were classified as multi-drugresistance mechanisms, suggesting the pig gut could bea hot-spot for multiple-antibiotic resistant bacteria. Onesubsystem, the MexA-MexB-OprM multiple drug effluxpump was found exclusively in the swine fecal metagen-ome. This antibiotic resistance mechanism has beendetected only in Pseudomonas aeruginosa strains knownto carry resistance in cystic fibrosis patients [23] andhas not been previously described in distal gut environ-ments. Additionally, more than 10% of virulence-asso-ciated sequences were assigned to yet-to-be-describedvirulence subsystems, suggesting that unknown viru-lence mechanisms are at work within the distal gut.Altogether, the high abundance of metagenomicsequences assigned to known and unknown antibioticresistance subsystems suggests that functional metage-nomics is an adequate tool for assessing the prevalenceof antibiotic resistance within high cell densityenvironments.Pair-wise comparisons of each gut metagenome (MG-
RAST SEED database) with the swine gut revealed 15SEED subsystems that were significantly different inabundance for the swine fecal metagenome (Figure 6and Additional File 1, Fig. S12). Two subsystems in par-ticular were statistically significantly overabundant inthe swine gut metagenome, as compared to all other gutmetagenomes: the UDP-N-acetylmuramate from fruc-tose-6-phosphate biosynthesis and folate biosynthesis.UDP-N-acetylmuramate is a peptidoglycan-derived mur-opeptide that as a group are considered to be potentialvirulence factors of several gut pathogens [24] specifi-cally involved in biofilm colonization. Higher abun-dances of genes related to folate biosynthesis may be adirect result of supplemental amounts of folic acid inswine feedstuff or an increased production by the swinemicrobial consortia [25]. The impacts of food additives,such as folic acid, on the microbial ecology of the swinegut warrants further study.Comparative metagenomics of proteins involved in the
cell wall and capsule subsystems revealed several uniqueglycosyl transferases and carbohydrate uptake systems.This unique pool of glycosyl transferases may provide acapacity for diversification of surface polysaccharidestructures helping shape the genetic functional potentialof this gut ecosystem. For example, the acquisition ofnew types of carbohydrate-binding proteins, transpor-ters, and degradation enzymes through horizontal genetransfer may allow for the utilization of a wider array ofsubstrates that may be utilized for energy harvesting [2].
Lamendella et al. BMC Microbiology 2011, 11:103http://www.biomedcentral.com/1471-2180/11/103
Page 11 of 17

Pfams and COGs related to virulence factors such asadhesions were numerous within the gene familiesunique to the swine fecal metagenomes (Additional File2, Table S6). Proteins involved in carbohydrate transportand attachment were both abundant and unique to thedistal swine gut with more than 50 metagenomic contigssharing high sequence homology to putative carbohy-drate membrane transporters. Other proteins involvedin carbohydrate metabolism were unique to the swinemetagenome including glycosyl hydrolases, cellobiohy-drolases, gluconolactonases, maltodextrin metabolism,and pectin lyases. The identification of unique genefamilies provides one line of evidence that the variablemicrobiome is a result of the microbial interaction withits surrounding environment. Because the environmentsurrounding gut microbes can vary among host species,a direct result of this level of functional diversity may bethe generation of swine-specific microbiomes. Manyproteins of unknown functions were also unique to theswine fecal metagenome, suggesting that some of them
may be engaged in novel functions that have importantbiological meaning.The high functional similarity between the pig and
human metagenome is not surprising in light of the factthat they are mammalian omnivores with similar diges-tive tract structures and functions. Results from 16SrRNA gene sequence analyses suggest that bacterial gutcommunities are similar among omnivorous mammals[2]. Similarities at the phylogenetic level between pigand human guts include the large presence of Firmi-cutes and members of the Bacteroidetes as the mostabundant Gram-negative bacteria in their gastrointest-inal tracts [14]. While differences in the relative abun-dance of Lactobacilli phylotypes have been noted, ourdata provides for the first time a functional perspectiveon how similar pigs and humans gut systems in spite ofthe differences in microbial community structure. Incontrast, the functional similarities shared between theswine fecal metagenome and the termite gut was sur-prising and suggestive of previously unknown shared
Figure 6 Pair-wise comparisons of functional gene groups from swine versus other gut metagenomes. Pair-wise comparisons werecalculated for the pig fecal metagenome versus (A) lean mouse cecum (B) cow rumen (C) human adult (D) termite gut (E) human infant (F) fishgut (G) and chicken cecal metagenomes is shown. Each point on this exploratory plot represents a different SEED Subsystem and it’s relativeabundance within the pig fecal metagenome compared to other available gut metagenomes within the MG-RAST database. Points closer to y-axis represent functions more abundant in the swine gut metagenome, while points closer to the x-axis are more abundant in other gutmetagenomes. Points laying on or near the dotted midline have equal or very similar abundances within both metagenomes. A matrix of theabundance of sequences assigned to each SEED Subsystem from each gut metagenome was generated using the “Metabolic Analysis” tool inMG-RAST. The number of reads from each individual pig, human infant, and human adult metagenomes were each combined since there wasmore than one metagenome for each of these hosts within the MG-RAST database. The e-value cutoff for metagenomic sequence matches toSEED Subsystems was 1×10⁻⁵ with a minimum alignment length of 30 bp. Fisher exact tests were used with the Benjamin-Hochberg FDRmultiple test correction to generate a list of significantly different SEED Subsystems using STAMP v1.0.2 software [39]. The Newcombe-Wilsonmethod was used to calculate the 95% confidence intervals.
Lamendella et al. BMC Microbiology 2011, 11:103http://www.biomedcentral.com/1471-2180/11/103
Page 12 of 17

metabolic capabilities between these gut environments.For example, the pig and termite were the only twohosts possessing a suite of functions involved in archaeallipid biosynthesis (Additional File 2, Fig. S13), suggestingan intimate relationship between the swine and archaealgut populations [26]. Swine-specific methanogenic popu-lations have been demonstrated in previous studies[17,27]. Similarities in cell wall and capsule profilesbetween the swine samples and termite gut may indicatethat these functions can endow the swine gut withdiversification of surface polysaccharide structures,allowing the host immune system to accommodate adiverse microbiota [2]. Presence of novel carbohydratebinding proteins and transporters also suggest the swinegut is capable of exploiting a diverse array of substrates.Similarities in functional gene profiles (SEED subsys-
tem abundance) among swine, chicken cecal and cowrumen metagenomes as compared to human gut meta-genomes were unexpected considering the similarityshared between pig and human gut anatomy and phy-siology. These results suggest that that some microbialfunctions within the swine gut are shared among otheragricultural animals, with arguably very different gastro-intestinal anatomy and physiologies. For example, theelevated abundance of genes associated with proteinturnover in pigs, chicken, and cow gut metagenomes isconsistent with an increased use of amino acids for pro-tein accretion in food production animals and is alsoconsistent with the high protein diet fed to the pigs inthis study. Additionally, the high abundance and diver-sity of carbohydrate utilization subsystems found in thisswine metagenome may be a result of the high level ofcomplex polysaccharides found in the diet. Altogetherthese data suggest that agricultural animal husbandrypractices can impose significant selective pressures onthe gut microbiota, regardless of gut type.Surprisingly, this pig fecal metagenome revealed the pre-
sence of motile Treponema and Anaerovibrio genera. Thepresence of sequences associated with Treponema in thisstudy (i.e., 3-4% of all sequences swine fecal metagenome)suggests an order of magnitude higher abundance than aprevious study in which swine gut microbiota revealed avery low abundance of Spirochetes using a culture inde-pendent method (i.e., 0.3% of all phylotypes) [14]. Thisgenus has been previously detected in swine colonic sam-ples but their presence in elevated levels is normally asso-ciated with swine dysentery. Discrepancies in communitycomposition between cloning-based methods and non-cloning based methods have been reported in the litera-ture, primarily attributed to PCR amplification biases[28,29]. While many mammalian gut microbial commu-nities are dominated by non-motile microbes, the termitehindgut and the fish gut harbor motile populations of bac-teria, which are known to possess complex social
behaviors [12,30,31]. This study revealed the pig gut mayharbor previously unknown social dynamics, which maybe relevant for maintaining compartmentalization andpromoting niche selection within monogastric systems.
ConclusionsHerein, we report the first shotgun metagenomic pyrose-quencing approach to study the microbiome of the swinedistal gut. The overall goal of this study was to character-ize the swine fecal microbiome with respect to speciescomposition and functional content. Comparative metage-nomic analyses identified unique and/or overabundanttaxonomic and functional elements within swine distal gutmicrobiomes. These genetic attributes may help us betterunderstand the microbial genetic factors that are relevantto swine health. Genes associated with the variable portionof gut microbiomes clustered by host environment withsurprising hierarchical trends, suggesting that the variablemicrobiome content of a given host species may be reflec-tive of the host ecology. While a larger metagenomic data-base that includes information on intra-host variation isneeded for swine and other gut systems, this study pro-vides a baseline for understanding the complexity of theswine gut microbial ecology, while also highlighting strik-ing similarities and differences when compared to otheranimal gastrointestinal environments.
MethodsFecal Sample CollectionFecal samples were collected from eight, six-month oldYorkshire pigs from a large swine operation located inNortheastern Ohio, which housed more than 1,000 headof swine at the time of collection. Swine were weanedeight weeks after birth. Their diets consisted of a high-energy corn-soybean meal diet containing 14.00% crudeprotein, 0.63% lysine, 3.00% crude fat, 4.00% crude fiber,0.55%- 0.70% calcium, 0.52% phosphorus, 0.35%-0.50%salt, 0.3 ppm selenium, 80 ppm zinc. (Kalmbach Feeds,OH). In addition, swine were supplemented with feedgrade antibiotics for improvement in growth perfor-mance. Antibiotics consisted of chlortetracycline andpenicillin at the concentration of 20 g per ton of feed.Fecal samples were transported to the laboratory on icewithin four hours of collection, and stored at -20°C untilfurther processing. Fecal DNA was extracted with theFastDNA SPIN Kit (MP Biomedicals, Inc., Solon, OH)according to the manufacturer’s instructions using 0.25g of each fecal sample. Total DNA was quantified usinga NanoDrop® ND-1000 UV spectrophotometer (Nano-Drop Technologies, Wilmington, DE).
Pyrosequencing and Gene AnnotationA total of 24 μg (3 μg of each fecal DNA extract, n = 8)were pooled and sent for pyrosequencing to 454 Life
Lamendella et al. BMC Microbiology 2011, 11:103http://www.biomedcentral.com/1471-2180/11/103
Page 13 of 17
Sciences, where two different sequencing runs were per-formed. The first run was performed using GenomeSequencer GS20 platform while the Genome SequencerFLX instrument was used for the second run. Each pigfecal metagenomic sequencing run was assembled denovo using the Newbler assembly software by 454 LifeSciences. The metagenomes used in this paper are freelyavailable from the SEED, JGI’s IMG/M, and NCBI ShortRead Archive. The NCBI genome project ID and GOLDID for swine fecal GS20 and FLX metagenomic sequen-cing runs generated in this project are 39267 andGm00197, respectively.Raw sequencing reads from both datasets were sub-
mitted to the Joint Genome Institute’s IMG/M-ERannotation pipeline using the proxygene method forgene annotation [4,32]. Additionally, both metagenomeruns were annotated using the “Phylogenetic Analysis”tool within the MG-RAST pipeline [33]. The BLASTnalgorithm (e-value less than1 × 10-5 and a sequencematch length greater than 50 nucleotides) was used toidentify small subunit rRNA genes from RDP [34],SILVA SSU [35], and Greengenes databases [36]. Withinthe MG-RAST pipeline, the “Metabolic Analysis” toolwas used to search sequences from pig fecal metagen-omes against the SEED database using the BLASTxalgorithm (e-value less than 1×10⁻⁵ and a sequencematch length greater than 30 nucleotides) [37].
Comparative Metagenomics and Statistical AnalysesComparative metagenomics was performed using boththe IMG/M and MG-RAST pipelines. GS20 and FLXpig metagenomic runs were compared to the currentpublicly available gut metagenomes within each of thesedatabases. Within the IMG/M pipeline, the two pigmetagenomic runs were compared against three leanmouse (Mus musculus strain C57BL/6J) cecal metagen-omes (Metagenome names: Mouse Gut Communitylean1-3), two healthy human fecal metagenomes (Meta-genome names: Human Gut Community Subject 7-8),and one termite (Nasutitermes sp) hindgut metagenome(Metagenome name: Termite hindgut). Descriptiveinformation about these mouse, human and termitemetagenomes can be found in the GOLD databaseunder Gm00071, Gm00052, Gm00013 GOLD IDs,respectively. Within IMG/M the “Compare Genomes”tool was chosen to extract COG and Pfam protein pro-files from the swine, mouse, human, and termite gutmicrobiomes. These profiles were then normalized forsequencing coverage by calculating the percent distribu-tion, prior to downstream statistical analysis. To findover-abundant or unique functions to a given metage-nomic dataset, a two-way hierarchical clustering of nor-malized COG and Pfam abundances was performedusing the Bioinformatics Toolbox with Matlab version
2009a. Additionally, to determine if unique or overabun-dant functions were statistically meaningful, the bino-mial test within the Shotgun FunctionalizeR programwas employed [38].The GS20 and FLX pig fecal datasets were also com-
pared against gut metagenomes available within theMG-RAST metagenomic annotation pipeline. The twopig fecal metagnonomic datasets were compared againstthe following MG-RAST metagenomic projects: cowrumen (Cow Rumen Project: 444168.3), chicken cecum(FS-CAP Project:4440285.3), human infant subjects In-A, In-B, In-D, In-E, In-M and In-R (Human Faeces Pro-jects: 4440946.3, 4440945.3, 4440948.3, 4440950.3,4440949.3, 4440951.3), human adult subjects F1-S, F1-T,F1-U, F2-V, F2-W, F2-X, and F2-Y (Human Faeces Pro-jects: 4440939.9, 4440941.3, 4440940.3, 4440942.3,4440943.3, 4440944.3, and 4440947.3), healthy fish gut(Fish Gut Project: 4441695.3), and lean mouse cecum(Human Faeces Project: 4440463.3). Within MG-RAST,phylogenetic information was extracted from these gutmetagenomes using RDP [31], SILVA SSU [32], andGreengenes[33] databases (e-value less than 1 × 10⁻⁵
and a sequence match length greater than 50 nucleo-tides). These taxonomic profiles were then normalizedfor differences in sequencing coverage by calculatingpercent distribution, prior to downstream statistical ana-lysis. A non-parametric Wilcoxon exact test was used tostatistically compare the taxonomic composition in anytwo metagenomes.Additionally, within MG-RAST, the functional annota-
tions (hits to SEED Subsystems) were extracted (e-valueless than 1 × 10⁻⁵ and a sequence match length greaterthan 50 nucleotides) to compare functional attributesacross these gut metagenomes. In order to identify sta-tistically significant and biologically meaningful differ-ences between the swine gut and other endiobioticmicrobiomes, we employed the two-way Fisher’s exacttest with a Benjamin-Hochberg FDR multiple test cor-rection within STAMP v1.0.2 [39].
Diversity IndicesObserved richness, Chao1 estimator, abundance-basedcoverage estimator (ACE), jackknife estimator, andbootstrap estimator were used to evaluate communityrichness. Community diversity was described usingShannon, non-parametric Shannon, and Simpsonindices within Mothur v 1.5.0 [40]. Sampling coveragewas calculated using Good’s coverage for the givenoperational taxonomic unit (OTU) definition, while theBoneh estimate was used to calculate the number ofadditional OTUs that would be observed for an addi-tional 500 SSU reads. The aforementioned rRNA diver-sity indices and rarefaction curves were calculatedusing Mothur v 1.5.0 program with default parameters
Lamendella et al. BMC Microbiology 2011, 11:103http://www.biomedcentral.com/1471-2180/11/103
Page 14 of 17

[40] and calculations for each index can found inthe Mothur manual (http://www.mothur.org/wiki/Mothur_manual). Functional diversity was assessedusing SEED Subsystems [41], COG, and Pfam abun-dances from all available gut metagenomes. Diversityestimators used included Shannon-Weiner, Simpson’slambda, and Pielou’s evenness analyses for measuringspecies richness and evenness. Functional diversityestimates, K- dominance plots, Principal ComponentsAnalysis, and clustering were performed using the PRI-MER-E ecological software package [42].
Additional material
Additional file 1: Figures S1-S13. Fig. S1. Taxonomic distribution ofviral sequences from swine feces. The percent of viral sequencesretrieved from swine fecal GS20 (A) and FLX (B) metagenomes. Using the“Phylogenetic Analysis” tool within MG-RAST, the GS20 and FLXsequencing runs were searched against the SEED database using theBLASTx algorithm. The e-value cutoff for a hit to the database was 1×10⁻⁵ with a minimum alignment length of 30 bp. Fig. S2. Taxonomicdistribution of bacterial orders from swine and other currently availablegut microbiomes within MG-RAST. The percent of sequences assigned toeach bacterial order from swine and other gut metagenomes is shown.Using the “Phylogenetic Analysis” tool within MG-RAST, each gutmetagenome was searched against the RDP and greengenes databasesusing the BLASTn algorithm. The percentage of each bacterial order fromswine, human infant, and human adult metagenomes were eachaveraged since there was more than one metagenome for each of thesehosts within the MG-RAST database. The e-value cutoff for 16S rRNAgene hits to the RDP and greengenes databases was 1×10⁻⁵ with aminimum alignment length of 50 bp. Fig. S3. Taxonomic composition ofbacterial genera using 16S rDNA sequences retrieved from swine fecalmetagenomes. The percent of sequences assigned to each of thebacterial genera from the pig fecal GS20 (A) and FLX (B) metagenomes isshown. Using the “Phylogenetic Analysis” tool within MG-RAST, the GS20and FLX pig fecal metagenomes were searched against the RDP andgreengenes databases using the BLASTn algorithm. The e-value cutoff for16S rRNA gene hits to the databases was 1×10⁻⁵ with a minimumalignment length of 50 bp. Fig. S4. Dominance profiles of swine andother gut metagenomes available within MG-RAST. K-dominance plotswere calculated based on the abundance of gut metagenomicsequences assigned at the RDP genus level taxonomy using the“Phylogenetic Analysis” tool within MG-RAST. The e-value cutoff for 16SrRNA gene hits to the RDP database was 1×10⁻⁵ with a minimumalignment length of 50 bp. K-dominance for each of the individual gutmetagenomes was calculated using PRIMER-E v6 software [42]. Fig. S5.Rarefaction curves for 16S rRNA gene sequences from swine and othergut metagenomes. Rarefaction curves were calculated based on theobserved abundance of gut metagenomic sequences assigned at theRDP genus level taxonomy using MG-RAST’s “Phylogenetic Analysis” tool.The e-value cutoff for 16S rRNA gene hits to the RDP database was1×10-5 with a minimum alignment length of 50 bp. Rarefaction curvesfor each gut metagenome were calculated within Mothur v 1.5.0software using default parameters [40]. Rarefaction curves provide a wayof comparing the richness observed in these different gut metagenomicsamples. Fig. S6. Functional composition of the swine fecal microbiome.The percent of GS20 (A) and FLX (B) swine fecal metagenomicsequences assigned to general SEED Subsystems is shown. Using the“Metabolic Analysis” tool within MG-RAST, the GS20 and FLX pig fecalsequencing runs were searched against the SEED database using theBLASTx algorithm. The e-value cutoff for metagenomics sequencematches to the SEED Subsystem database was 1×10⁻⁵ with a minimumalignment length of 30 bp. Fig. S7. Comparison of functionalcomposition of swine and other currently available gut metagenomeswithin the MG-RAST pipeline. Percentage of gut metagenomic sequences
assigned to general SEED Subsystems is shown. Using the “MetabolicAnalysis” tool within MG-RAST, gut metagenomes were searched againstthe SEED database using the BLASTx algorithm. The percentage of eachgeneral SEED Subsystem from swine, human infant, and human adultmetagenomes were each averaged since there was more than onemetagenome for each of these hosts within the MG-RAST database. Thee-value cutoff for metagenomic sequence matches to the SEEDSubsystem database was 1×10⁻⁵ with a minimum alignment length of 30bp. Fig. S8. Percent distribution of prophage and DNA recombinationgenes from gut metagenomes available within the MG-RAST pipeline.Using the “Metabolic Analysis” tool within MG-RAST, the available gutmetagenomes were searched against the SEED database using theBLASTx algorithm. Percentage contribution of each gut metagenomeassigned to functional classes within “Prophage/DNA recombination”SEED Subsystem is shown. The e-value cutoff for metagenomicsequences matches to this SEED Subsystem was 1×10⁻⁵ with a minimumalignment length of 30 bp. Fig. S9. Hierarchical clustering of gutmetagenomes available within MG-RAST based on the relativeabundance of cell wall and capsule genes. A matrix consisting of thenumber of reads assigned to genes within the “Cell wall and Capsule”SEED Subsystem from each gut metagenome was generated using the“Metabolic Analysis” tool within MG-RAST. The e-value cutoff formetagenomic sequences matches to this SEED Subsystem was 1×10⁻⁵
with a minimum alignment length of 30 bp. Resemblance matrices werecalculated using Bray- Curtis dissimilarities within PRIMER v6 software[41]. Clustering was performed using the complete linkage algorithm.Dotted branches denote that no statistical difference in similarity profilescould be identified for these respective nodes, using the SIMPROF testwithin PRMERv6 software. Fig. S10. Transposases derived from gutmetagenomes available within JGI’s IMG/M database. The percent oftotal annotated tranposase gene families from pig, mouse, human, andtermite gut metagenomes is shown. The percentage of each transposasefamily from swine, human, and mouse gut metagenomes were eachaveraged since there was more than one metagenome for each of thesehosts within the JGI’s IMG/M database. Metagenomic sequences wereassigned to transposase gene families using the IMG 2.8 pipeline. Fig.S11. Composition of resistance genes present with the swine fecalmetagenome. The percent of swine fecal metagenomic sequencesassigned to the “Resistance to Antibiotics and Toxic Compounds” SEEDSubsystem is shown. The number of GS20 and FLX assigned to geneswithin this SEED Subsystem were combined. The e-value cutoff formetagenomic sequence matches to this SEED Subsystem database was1×10-5 with a minimum alignment length of 30 bp. Fig. S12. Differentialfunctions within the swine fecal metagenome. A list of significantlydifferent SEED Subsystems and their relative abundance are shown forpair-wise comparisons of the pig fecal metagenome versus otheravailable gut metagenomes within the MG-RAST database. A matrix ofthe abundance of sequences assigned to each SEED Subsystem fromeach gut metagenome was generated using the “Metabolic Analysis”tool in MG-RAST. The number of reads from each individual pig, humaninfant, and human adult metagenomes were each combined since therewas more than one metagenome for each of these hosts within the MG-RAST database. The e-value cutoff for metagenomic sequence matchesto SEED Subsystems was 1×10⁻⁵ with a minimum alignment length of 30bp. Pair-wise comparisons of pig fecal metagenomes versus (A) LeanMouse cecum (B) Cow rumen (C) Fish gut (D) Termite gut (E) Chickencecum (F) Human adult (G) Human infant gut metagenomes are shown.Fisher exact tests were employed using the Benjamin-Hochberg FDRmultiple test correction to generate a list of significantly different SEEDSubsystems using STAMP v1.0.2 software [39]. Significantly different SEEDSubsystems with a q-value less than 1×10⁻⁵ are shown. Significantlydifferent SEED Subsystems from the pig fecal metagenome are shown inblue and all other gut metagenomes are shown in orange. Fig. S13.Comparison of lipid biosynthesis genes from gut metagenomes availablewithin the MG-RAST pipeline. Using the “Metabolic Analysis” tool withinMG-RAST, the gut metagenomes were searched against the SEEDdatabase using the BLASTx algorithm. Percentage of gut metagenomicreads assigned to genes in the “Fatty Acid and Lipid Biosynthesis” SEEDSubsystem is shown. The e-value cutoff for metagenomics sequencematches to this SEED Subsystem database was 1×10⁻⁵ with a minimumalignment length of 30 bp.
Lamendella et al. BMC Microbiology 2011, 11:103http://www.biomedcentral.com/1471-2180/11/103
Page 15 of 17

Additional file 2: Tables S1-S6. Table S1. The results of a Wilcoxon testto compare taxonomic distribution of bacterial orders from endobioticmicrobiomes. Table S2. Binomial test for comparing abundance ofbacteria phyla from distal gut metagenomes. Table S3. Binomial test forcomparing abundance of bacteria genera from distal gut metagenomes.Table S4. Diversity analyses for endobiotic metagenomes using SEEDSubsystem annotations. Table S5. Diversity analyses for endobioticmetagenomes using COG and Pfam annotations. Table S6. Pfams andCOGs unique to swine fecal metagenomes.
AcknowledgementsThe U.S. Environmental Protection Agency, through its Office of Researchand Development, funded and managed, or partially funded andcollaborated in, the research described herein. It has been subjected to theAgency’s administrative review and has been approved for externalpublication. Any opinions expressed in this paper are those of the author(s)and do not necessarily reflect the views of the Agency, therefore, no officialendorsement should be inferred. Any mention of trade names orcommercial products does not constitute endorsement or recommendationfor use. This work was also partly funded by the United StatesEnvironmental Protection Agency Traineeship and National ScienceFoundation grant to DBO.
Author details1University of Cincinnati, Department of Civil and EnvironmentalEngineering, Cincinnati, OH 45220, USA. 2National Risk ManagementResearch Laboratory, U. S. Environmental Protection Agency, Cincinnati, OH45268, USA. 3National Exposure Research Laboratory, U. S. EnvironmentalProtection Agency, Cincinnati, OH 45268, USA. 4Lawrence Berkeley NationalLaboratory, Earth Sciences Division, Berkeley, CA 94720, USA. 5Department ofCivil and Environmental Engineering, Missouri University of Science andTechnology, Rolla, MO 65409, USA.
Authors’ contributionsRL carried out sample collection, sample processing, bioinformatic analyses,and manuscript preparation. JSD conceived of the study, and participated inits design and coordination and helped to draft the manuscript. SGparticipated in bioinformatic and statistical analyses. JM participated inbioinformatic analyses. DBO participated in design and coordination of thestudy and helped revise the manuscript. All authors read and approved thefinal manuscript.
Received: 13 September 2010 Accepted: 15 May 2011Published: 15 May 2011
References1. Ley RE, Peterson DA, Gordon JI: Ecological and evolutionary forces
shaping microbial diversity in the human intestine. Cell 2006,124:837-848.
2. Ley RE, Hamady M, Lozupone C, Turnbaugh PJ, Ramey RR, Bircher JS,Schlegel ML, Tucker TA, Schrenzel MD, Knight R, Gordon JI: Evolution ofmammals and their gut microbes. Science 2008, 320:1647-1651.
3. Hugenholtz P, Tyson GW: Microbiology metagenomics. Nature 2008,455:481-483.
4. Markowitz VM, Ivanova N, Szeto E, Palaniappan K, Chu K, Dalevi D, Chen IM,Grechkin Y, Dubchak I, Anderson I, Lykidis A, Mavromatis K, Hugenholtz P,Kyrpides NC: IMG/M: a data management and analysis system formetagenomes. Nucleic Acids Res 2008, 36:D534-D538.
5. Kurokawa K, Itoh T, Kuwahara T, Oshima K, Toh H, Toyoda A, Takami H,Morita H, Sharma VK, Srivastava TP, Taylor TD, Noguchi H, Mori H, Ogura Y,Ehrlich DS, Itoh K, Takagi T, Sakaki Y, Hayashi T, Hattori M: Comparativemetagenomics revealed commonly enriched gene sets in human gutmicrobiomes. DNA Res 2007, 14:169-181.
6. Brulc JM, Antonopoulos DA, Miller ME, Wilson MK, Yannarell AC,Dinsdale EA, Edwards RE, Frank ED, Emerson JB, Wacklin P, Coutinho PM,Henrissat B, Nelson KE, White BA: Gene-centric metagenomics of thefiber-adherent bovine rumen microbiome reveals forage specificglycoside hydrolases. Proc Natl Acad Sci 2009, 106:1948-1953.
7. Dinsdale EA, Edwards RA, Hall D, Angly F, Breitbart M, Brulc JM, Furlan M,Desnues C, Haynes M, Li L, McDaniel L, Moran MA, Nelson KE, Nilsson C,Olson R, Paul J, Brito BR, Ruan Y, Swan BK, Stevens R, Valentine DL,Thurber RV, Wegley L, White BA, Rohwer F: Functional metagenomicprofiling of nine biomes. Nature 2008, 452:629-632.
8. Qu A, Brulc JM, Wilson MK, Law BF, Theoret JR, Joens LA, Konkel ME,Angly F, Dinsdale EA, Edwards RA, Nelson KE, White BA: Comparativemetagenomics reveals host specific metavirulomes and horizontal genetransfer elements in the chicken cecum microbiome. PLoS ONE 2008, 3:e2945.
9. Tringe SG, von Mering C, Kobayashi A, Salamov AA, Chen K, Chang HW,Podar M, Short JM, Mathur EJ, Detter JC, Bork P, Hugenholtz P, Rubin EM:Comparative metagenomics of microbial communities. Science 2005,308:554-557.
10. Turnbaugh PJ, Ley R, Mahowald M, Magrini V, Mardis E, Gordon J: Anobesity-associated gut microbiome with increased capacity for energyharvest. Nature 2006, 444:1027-1031.
11. Turnbaugh PJ, Ley RE, Hamady M, Fraser-Liggett CM,R, Knight R, Gordon JI:The Human Microbiome Project. Nature 2007, 449:804-810.
12. Warnecke F, Luginbuhl P, Ivanova N, Ghassemian M, Richardson TH,Stege JT, Cayouette M, McHardy AC, Djordjevic G, Aboushadi N, Sorek R,Tringe SG, Podar M, Martin HG, Kunin V, Dalevi D, Madejska J, Kirton E,Platt D, Szeto E, Salamov A, Barry K, Mikhailova N, Kyrpides NC, Matson EG,Ottesen EA, Zhang XN, Hernandez M, Murillo C, Acosta LG: Metagenomicand functional analysis of hindgut microbiota of a wood-feeding highertermite. Nature 2007, 450:560-565.
13. Castillo M, Skene G, Roca M, Anguita M, Badiola I, Duncan SH, Flint HJ,Martín-Orúe SM: Application of 16S rRNA gene-targetted fluorescence insitu hybridization and restriction fragment length polymorphism tostudy porcine microbiota along the gastrointestinal tract in response todifferent sources of dietary fibre. FEMS Microbiol Ecol 2007, 59:138-146.
14. Leser TD, Amenuvor JZ, Jensen TK, Lindecrona RH, Boye M, Moller K:Culture-independent analysis of gut bacteria: the pig gastrointestinaltract microbiota revisited. Appl Environ Microbiol 2002, 68:673-690.
15. Lin C, Markowitz LVM, Mavromatis K, Ivanova NN, Chen IM, Chu K,Kyrpides NC: IMG ER: a system for microbial genome annotation expertreview and curation. Bioinformatics 2009, 25:2271-2278.
16. Snell-Castro R, Godon JJ, Delgenès JP, Dabert P: Characterisation of themicrobial diversity in a pig manure storage pit using small subunit rDNAsequence analysis. FEMS Microbiol Ecol 2005, 52:229-242.
17. Lamendella R, Santo Domingo JW, Yannarell AC, Ghosh S, Di Giovanni G,Mackie RI, Oerther DB: Evaluation of swine-specific PCR assays used forfecal source tracking and analysis of molecular diversity of swine-specific “Bacteroidales” populations. Appl Environ Microbiol 2009,75:5787-5796.
18. Jensen BB: Methanogenesis in monogastric animals. Environ Monit Assess1996, 42:99-112.
19. Fangman TJ, Hardin LE, Grellner G, Carlson MS, Zulovich JM, Coleman JL:Performance and disease status of pigs grown in a wean-to-finishfacility compared to pigs grown in a conventional nursery and grower-finisher facility. J Swine Health Prod 2001, 9:71-76.
20. USDA National Animal Health Monitoring System: Part I. Reference of SwineHealth and Management in the United States United States; 2001.
21. Taylor NM, Clifton-Hadley FA, Wales AD, Ridley A, Davies RH: Farm-level riskfactors for fluoroquinolone resistance in E. coli and thermophilicCampylobacter spp. on finisher pig farms. Epidemiol Infect 2009,137:1121-1134.
22. van den Broek IV, van Cleef BA, Haenen A, Broens EM, van der Wolf PJ, vanden Broek MJ, Huijsdens XW, Kluytmans JA, Van de Giessen AW,Tiemersma EW: Methicillin-resistant Staphylococcus aureus in peopleliving and working in pig farms. Epidemiol Infect 2009, 137:700-708.
23. Li XZ, Nikaido H, Poole K: Role of mexA-mexB-oprM in antibiotic efflux inPseudomonas aeruginosa. Antimicrob Agents Chemother 1995,39:1948-1953.
24. Boneca IG: The role of peptidoglycan in pathogenesis. Curr OpinionMicrobiol 2005, 8:46-53.
25. Lindemann MD: Supplemental folic acid: a requirement for optimizingswine reproduction. Journal of Animal Science 1993, 71:239-246.
26. Ufnar JA, Ufnar DF, Wang SY, Ellender RD: Development of a swine-specific fecal pollution marker based on host differences in methanogenmcrA genes. Appl Environ Microbiol 2007, 73:5209-17.
Lamendella et al. BMC Microbiology 2011, 11:103http://www.biomedcentral.com/1471-2180/11/103
Page 16 of 17

27. Boucher Y, Kamekura M, Doolittle WF: Origins and evolution of isoprenoidlipid biosynthesis in archaea. Mol Microbiol 2004, 52:515-527.
28. Webster G, Newberry CJ, Fry JC, Weightman AJ: Assessment of bacterialcommunity structure in the deep sub-seafloor biosphere by 16S rDNA-based techniques: a cautionary tale. J Micro Methods 2003, 55:155-164.
29. Wilson KH, Wilson WJ, Radosevich JL, DeSantis TZ, Viswanathan VS,Kuczmarski TA, Andersen GL: High-density microarray of small-subunitribosomal DNA probes. Appl Environ Microbiol 2002, 68:2535-2541.
30. Ingham CJ, Ben-Jacob E: Swarming and complex pattern formation inPaenibacillus vortex studied by imagine and tracking cells. BMCMicrobiology 2008, 8:36.
31. Kirchhof G, Eckert BBM, Stoffels MJI, Baldani JI VM, Reis VM, Hartmann A:Herbaspirillum frisingense sp. nov., a new nitrogen-fixing bacterial speciesthat occurs in C4-fibre plants. Int J Syst Evol Microbiol 2001, 51:157-168.
32. Dalevi D, Ivanova NN, Mavromatis K, Hooper S, Szeto E, Hugenholtz P,Kyrpides NC, Markowitz VM: Annotation of metagenome short readsusing proxygenes. Bioinformatics 2008, 24:i7-13.
33. Meyer F, Paarmann D, D’Souza M, Olson R, Glass EM, Kubal M, Paczian T,Rodriguez A, Stevens R, Wilke A, Wilkening J, Edwards RA: TheMetagenomics RAST server - A public resource for the automaticphylogenetic and functional analysis of metagenomes. BMCBioinformatics 2008, 9:386.
34. Cole JR, Chai B, Farris RJ, Wang Q, Kulam-Syed-Mohidee AS, McGarrell DM,Bandela AM, Cardenas E, Garrity GM, Tiedje JM: The ribosomal databaseproject (RDP-II): introducing myRDP space and quality controlled publicdata. Nucleic Acids Res 2007, 35:169-172.
35. Pruess E, Quast C, Knittel K, Fuchs B, Ludwig W, Peplies J, Glöckner FO:SILVA: a comprehensive online resource for quality checked and alignedribosomal RNA sequence data compatible with ARB. Nuc Acids Res 2007,35:7188-7196.
36. DeSantis TZ, Hugenholtz P, Larsen N, Rojas M, Brodie EL, Keller K, Huber T,Dalevi D, Hu P, Andersen GL: Greengenes, a chimera-checked 16S rRNAgene database and workbench compatible with ARB. Appl EnvironMicrobiol 2006, 72:5069-5072.
37. Altschul SF, Gish W, Miller W, Myers EW, Lipman DJ: Basic local alignmentsearch tool. J Mol Biol 1990, 215:403-410.
38. Kristiansson E, Hugenholtz P, Dalevi D: ShotgunFunctionalizeR: An R-package for functional analysis of metagenomic data. Bioinformatics 2009,25:2737-2738.
39. Parks DH, Beiko RG: Identifying biologically relevant differences betweenmetagenomic communities. Bioinformatics 2010, 26:715-721.
40. Schloss PD, Westcott SL, Ryabin T, Hall JR, Hartmann M, Hollister EB,Lesniewski RA, Oakley BB, Parks DH, Robinson CJ, Sahl JW, Stres B,Thallinger GG, Van Horn DJ, Weber CF: Introducing mothur: open source,platform-independent, community-supported software for describingand comparing microbial communities. Appl Environ Microbiol 2009,75:7537-41.
41. Overbeek R, Begley T, Butler RM, Choudhuri JV, Chuang HY, Cohoon M, deCrécy-Lagard V, Diaz N, Disz T, Edward R, Fonstein M, Frank ED, Gerdes S,Glass EM, Goesmann A, Hanson A, Iwata-Reuyl D, Jensen R, Jamshidi N,Krause L, Kubal M, Larsen N, Linke B, McHardy AC, Meyer F, Neuweger H,Olsen G, Olson R, Osterman A, Portnoy V, Pusch GD, Rodionov DA,Rückert C, Steiner J, Stevens R, Thiele I, Vassieva O, Ye Y, Zagnitko O,Vonstein V: The subsystems approach to genome annotation and its usein the project to annotate 1000 genomes. Nucleic Acids Res 2005,33:5691-702.
42. Clarke KR, Gorley RN: PRIMER-E. PRIMER-E Ltd, Plymout, UK; 2001.
doi:10.1186/1471-2180-11-103Cite this article as: Lamendella et al.: Comparative fecal metagenomicsunveils unique functional capacity of the swine gut. BMC Microbiology2011 11:103.
Submit your next manuscript to BioMed Centraland take full advantage of:
• Convenient online submission
• Thorough peer review
• No space constraints or color figure charges
• Immediate publication on acceptance
• Inclusion in PubMed, CAS, Scopus and Google Scholar
• Research which is freely available for redistribution
Submit your manuscript at www.biomedcentral.com/submit
Lamendella et al. BMC Microbiology 2011, 11:103http://www.biomedcentral.com/1471-2180/11/103
Page 17 of 17