comparative genomics reveals long, evolutionarily
TRANSCRIPT
1
Comparative genomics reveals long, evolutionarily-conserved, low-complexity islands in yeast proteins
Philip A. Romov1, Fubin Li2, Peter N. Lipke2, Susan L. Epstein1, Wei-Gang Qiu2,*
1Department of Computer Science and 2Department of Biological Sciences, Hunter College of
the City University of New York, 695 Park Avenue, New York, New York 10021, USA
*Corresponding author:
Wei-Gang Qiu
Department of Biological Sciences
Hunter College, City University of New York
695 Park Avenue, New York, New York 10021
Tel. 212-772-5296
Fax 212-772-5225
Email [email protected]
Key words: simple sequences, Saccharomyces proteome, Ka/Ks ratio, Shannon entropy, protein
disorder, neutral evolution, protein clock
2
Abstract
Eukaryotic proteomes abound in low-complexity sequences, including tandem repeats and
regions with significantly biased amino-acid compositions. We assessed the functional
importance of compositionally-biased sequences in the yeast proteome using an evolutionary
analysis of 2,838 orthologous ORF families from three Saccharomyces species (S. cerevisiae, S.
bayanus, and S. paradoxus). Sequence conservation was measured by the amino-acid sequence
variability and by the ratio of nonsynonymous to synonymous nucleotide substitutions (Ka/Ks)
between pairs of orthologous ORFs. A total of 1,033 ORF families contained one or more long
(at least 45 residues) low-complexity islands as defined by a measure based on the Shannon
information index. Low-complexity islands were generally less conserved than ORFs as a
whole; on average they were 50% more variable in amino-acid sequences and 50% higher in
Ka/Ks ratios. Fast-evolving low-complexity sequences outnumbered conserved low-complexity
sequences by a ratio of 10 to 1. Sequence differences between orthologous ORFs fit well to a
selectively neutral Poisson model of sequence divergence. We therefore used the Poisson model
to identify conserved low-complexity sequences. ORFs containing the 33 most conserved low-
complexity sequences were overrepresented by those encoding nucleic-acid binding proteins,
cytoskeleton components, and intracellular transporters. While a few conserved low-complexity
islands were known functional domains (e.g., DNA/RNA-binding domains), most were
uncharacterized. We discuss how comparative genomics of closely-related species can be
employed further to distinguish functionally important, shorter, low-complexity sequences from
the vast majority of such sequences likely maintained by neutral processes.
Introduction
Low-complexity or simple sequences comprise a large part of the proteome, but their
evolutionary, structural, and functional roles are not well understood. (Here, a low-complexity
sequence is a protein segment with low Shannon entropy whose composition is significantly
different from the average amino-acid usage of a proteome (Wootton and Federhen 1996)).
Eukaryotic proteomes abound in low-complexity sequences and protein repeats (Huntley and
Golding 2000; Marcotte et al. 1999; Sim and Creamer 2002). For example, 21% of yeast
proteins contain homopolymers of serine (S), glutamate (E), glutamine (Q), aspartate (D) or
asparagine (N) (Golding 1999). By a less stringent definition of sequence complexity, 53% of
3
proteins in yeast contain stretches of 10 or more residues at least half of which are single residue
types (Sim and Creamer 2004). Since low-complexity sequences tend to be structurally
disordered (Huntley and Golding 2002; Romero et al. 2001; Ward et al. 2004), eukaryotic
proteomes include many disordered proteins. By a conservative computational estimate, long
(≥30 residues) disordered segments occur in 33% of eukaryotic proteins and 2.0-4.2% of
prokaryotic proteins (Ward et al. 2004). It has been suggested that the abundance of low-
complexity, structurally disordered proteins in eukaryotes may be attributed to the multidomain
nature of eukaryotic proteins as well as the increased complexity of transcriptional regulation of
gene expressions in eukaryotes (Brocchieri and Karlin 2005; Huang et al. 1999; Rubin et al.
2000). For instance, disordered regions of proteins can function as flexible linkers between
structured domains in modular proteins and can become folded on binding to their biological
targets (Dunker et al. 1998; Dyson and Wright 2005; Tompa 2002). Among proteins containing
long (at least 30 residues) disordered regions, nucleic-acid binding transcriptional regulatory
proteins are over-represented and catalytic proteins are under-represented (Liu et al. 2002; Ward
et al. 2004).
Nevertheless, it is unclear whether these significant functions for some disordered
proteins, many of which are low-complexity sequences, imply that other low-complexity and
disordered sequences play critical biological roles. The abundance of low-complexity sequences
in eukaryotes could be due to a strong bias towards sequence duplication in eukaryotes (Mar
Alba et al. 1999; Tompa 2003). The duplicated sequences underlying many low-complexity
protein sequences may be adaptively neutral or even deleterious rather than maintained by
natural selection (Huntley and Golding 2000; Lynch and Conery 2003). In fact, evolutionary
comparisons showed that the majority of low-complexity sequences evolve faster than high-
complexity sequences do (Huntley and Golding 2000; Sim and Creamer 2004). Similarly,
evolutionary analyses showed that disordered proteins have faster evolutionary rates than
ordered sequences (Brown et al. 2002). A small subset of low-complexity sequences, however,
showed high sequence identity among putative orthologs from divergent species (Sim and
Creamer 2004). Although there are evolutionarily conserved disordered regions with known
functions (e.g., nucleic-acid binding domains), the functions of most conserved disordered
regions are unknown (Brown et al. 2002; Liu et al. 2002).
Here, we extended these and other previous studies of the evolution of low-complexity
4
sequences with a direct measure of evolutionary rates for low-complexity sequences. We
estimated the evolutionary rates of low-complexity sequences (as the nonsynonymous to
synonymous substitutions, or Ka/Ks ratios) using open reading frames (ORFs) whose orthology
was verified by genome comparisons. This technique is more reliable than ortholog
identification with procedures based on BLAST (Altschul and Gish 1996), or than the use of
phylogenetically distant species (Huntley and Golding 2000; Sim and Creamer 2004). The
genome-wide Ka/Ks comparisons for low-complexity sequences in three closely-related
Saccharomyces species highlighted the functional importance of certain low-complexity
sequences in the yeast proteomes. Our results corroborated earlier findings (Brown et al. 2002;
Huntley and Golding 2000; Liu et al. 2002; Sim and Creamer 2004) that, on average, low-
complexity sequences evolve faster than the ORFs in which they are found. In comparison with
the evolutionary rates of the whole protein, about 24% of low-complexity sequences evolve
significantly faster, while the rest showed no significant differences. About 2.4% of low-
complexity sequences showed significant sequence conservation relative to the whole protein
sequences.
Materials and Methods
Orthologous gene familiesNucleotide sequences of ORFs from the genomes of three Saccharomyces sensu stricto species
(S. cerevisiae, S. bayanus, S. paradoxus) were downloaded from the Saccharomyces Genome
Database (SGD) (http://genome-www.stardford.edu/Saccharomyces, (Kellis et al. 2003). (Other
species listed in SGD were not used because of their low sequence identity to these three
species.) According to an ortholog table (based on genome synteny) from SGD (Kellis et al.
2003), ORFs were grouped into orthologous gene families. We removed from the orthologous
gene families any that contain more than one ORF from a single species (1-to-many orthology
due to species-specific duplication), or those that contain ORFs with multiple stop codons. The
protein sequences in each of the remaining orthologous gene families were aligned with
CLUSTALW (Thompson et al. 1994) using its default parameters. These CLUSTALW protein
alignments were the basis for nucleotide alignments and comparison of codon sequences.
Identification of low-complexity islandsConsensus sequences of the CLUSTALW protein alignments were used to calculate the
5
sequence complexity of orthologous gene families. For each consecutive window of 45 amino-
acid residues, a complexity score L was calculated as the Shannon information content (a
reduction in maximum entropy, with sampling-error correction):
L = −log2 20+ pi log2 pi −19
2n ln2∑ , (Equation 1)
where the pi’s are amino-acid residue frequencies and n is the number of residues in the window
(Schneider et al. 1986). (Low-complexity sequences have high L values.) We obtained the mean
and variance of complexity scores from the score distribution of 45-residue windows across all
orthologous gene families. A low-complexity window was defined as one whose complexity
score was at least two standard deviations above the mean complexity score of all windows in all
ORFs. A low-complexity island began with the first residue of a low-complexity window and
extended to the last residue of a low-complexity window. Some low-complexity islands
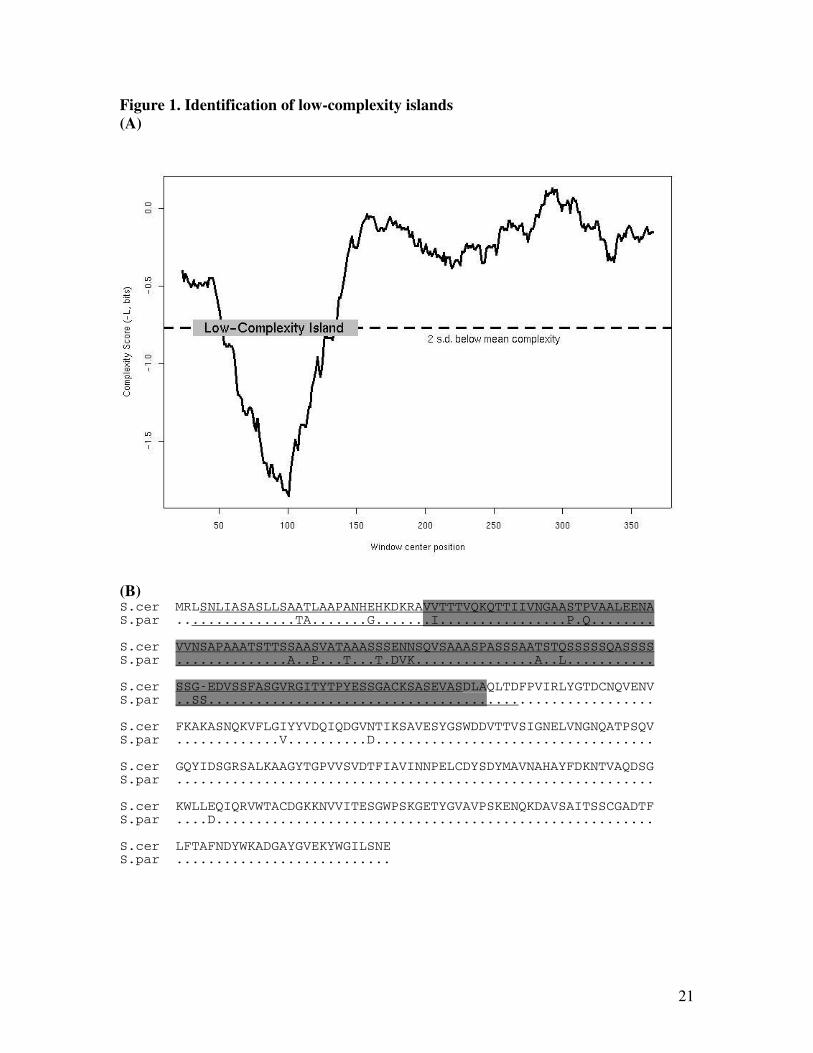
contained short (fewer than 45 residues) high-complexity segments. An example of a low-
complexity island in a cell-wall protein is shown in Figure 1; it illustrates that the identification
criterion is similar to the SEG filtering algorithm (Wootton 1994) with higher stringency.
Tests of sequence conservation
To identity which low-complexity islands were conserved, we compared amino-acid sequence
diversity with both the genome-wide ORF diversity and with the average diversity of the ORFs
containing the islands. To test for statistical significance, we assumed a selectively neutral
Poisson process of amino acid substitutions during the evolution of an orthologous ORF family:
P(k ≤ Dobs) =Dexp
k
k!e−Dexp
k= 0
Dobs
∑ , (Equation 2)
where k is the number of amino acid differences, Dobs is the observed number of substitutions of
an island, and Dexp is the expected number of substitutions of the island based on the substitution
rate of the entire ORF. When the probability of having less than or equal to the observed
differences is low (P<0.001), island sequences were considered to be maintained by purifying
selection, i.e., evolutionarily conserved. Note that this criterion, while allowing us to identity the
most conserved islands, does not meet rigorous standards for the statistical significance of
individual islands because adjustment for multiple tests was not applied. (For instance, to
identify conserved islands at a 5% significance level among 1,500 independent tests, the critical
6
P value is 3.3×10⁻⁵.) The Poisson test was applied to comparisons between pairs of orthologous
ORFs, as well as to the more independent comparisons among all ORFs in an orthologous family
at once based on phylogenetic reconstruction. For the tree-based test, the total numbers of
substitutions of islands and those of the whole ORFs were obtained based on parsimony
reconstruction using the PARS program of the PHYLIP package (Felsenstein 1989). (Because of
the low overall proteome sequence difference (7-16%), the number of observed pairwise
sequence differences as well as the number of substitutions based on parsimony reconstruction
were close to the numbers of substitutions, and did not require correction for multiple hits at the
same site.) The levels of evolutionary conservation of these islands were further verified using
the Ka/Ks, the ratio of synonymous to nonsynonymous nucleotide substitutions. Total tree
lengths of Ka and Ks were estimated based on maximum likelihoods using the CODEML
program of the PAML package (Yang 1997).
Results
Proteome divergence and sequence complexity
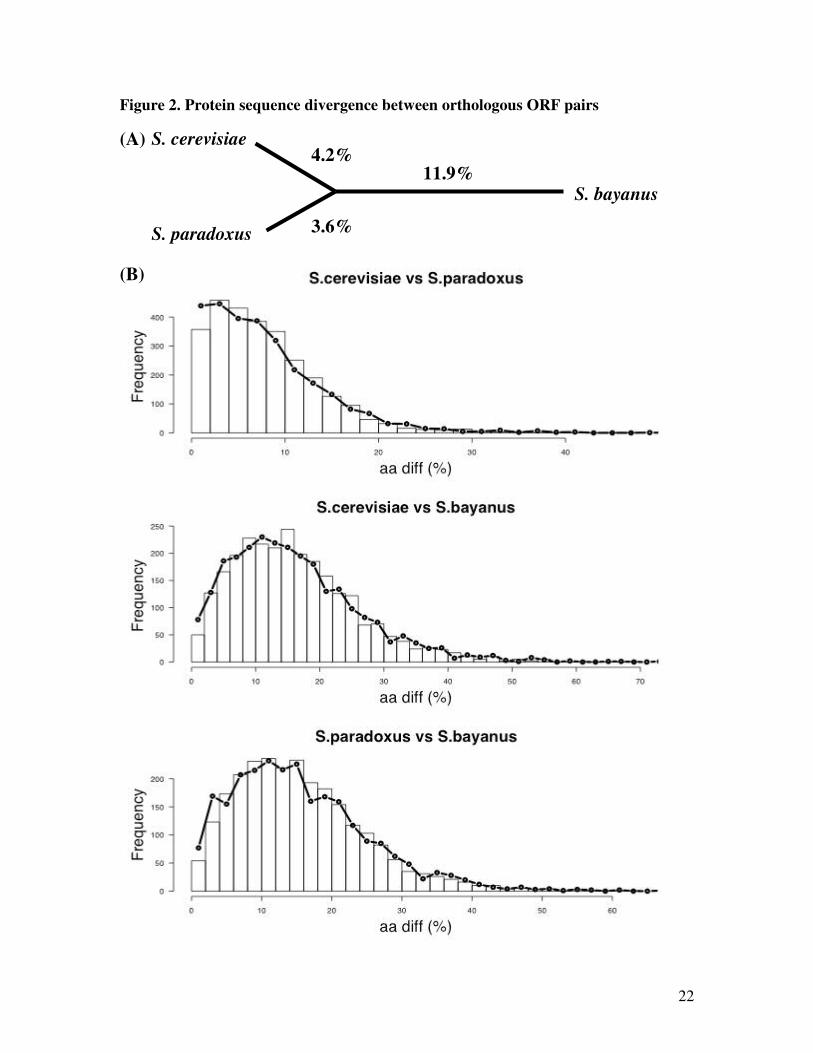
From the 5,306 orthologous ORF families obtained from SGD, we used 2,838 orthologous gene
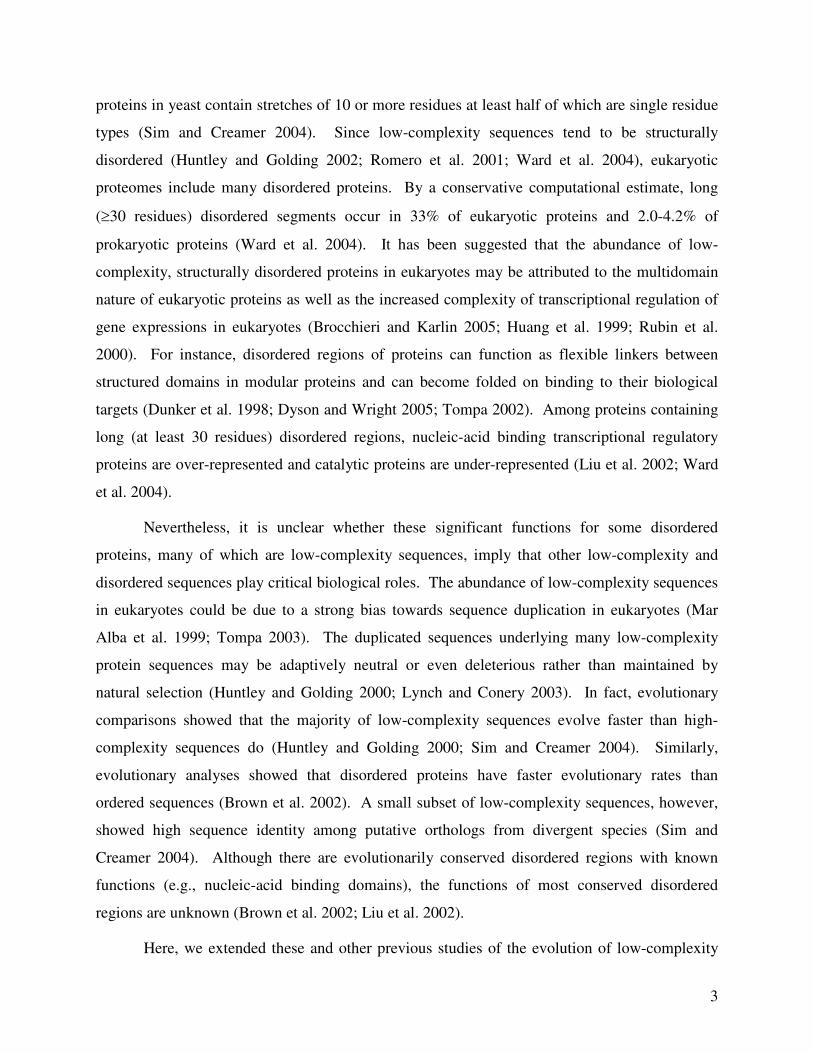
families that were validated for sequence quality and 1:1 orthology. An unrooted tree based on
the average protein sequence differences between orthologous ORFs from three pairs of species
is shown in Figure 2A. Based on sequence differences, S. cerevisiae and S. paradoxus are more
closely related to each other than either of them is to S. bayanus (Figure 2A). Protein sequence
differences between pairs of orthologous ORFs closely fit a Poisson model of neutral amino-acid
substitutions (Figure 2B).
Low-complexity sequences are less conserved than entire ORFs
The mean and standard deviation of the complexity scores (Equation 1) of 45-residue windows
of ORFs in the 2,838 orthologous families were 0.31 bits and 0.23 bits, respectively. A cutoff
value of L=0.77 (two standard deviations above the mean) was therefore used for delineating
low-complexity islands. 1,033 orthologous gene families (36.4%) contained at least one of the
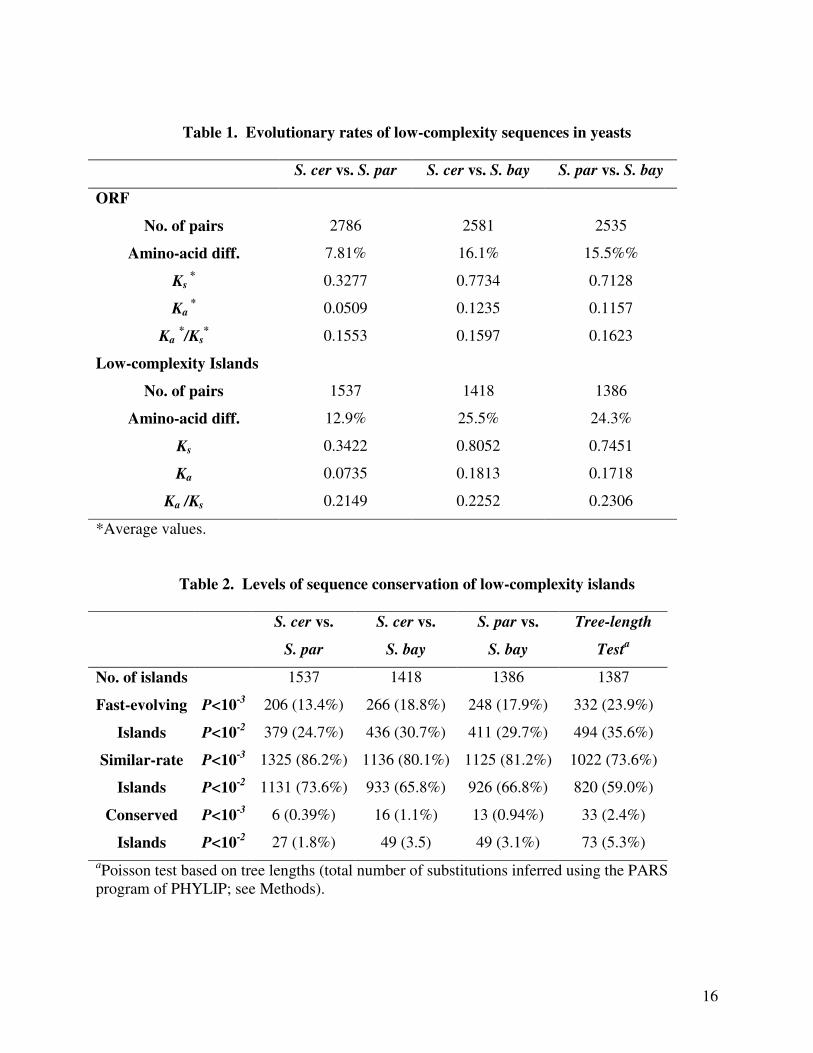
1,572 low-complexity islands of at least 45 residues. Evolutionary rates (including amino-acid
differences, Ka, and Ks) of the low-complexity islands and the ORFs containing them were
calculated for each pair of species. On average, amino-acid differences in the low-complexity
7
islands were 50-70% higher than the amino acid differences of corresponding ORFs (Table 1).
Ka of the low-complexity islands was on average 1.5-fold of that of the whole ORFs (Table 1;
one-tailed, paired t-test highly significant), whereas Ks was only slightly higher (1.04-fold, paired
t-test significant) in the low-complexity islands than in whole ORFs. At a significance level of
p<0.001, less than 3% of the low-complexity islands were more conserved than ORFs as a
whole, whereas close to 20% of the low-complexity islands evolved faster than the ORFs in
which they were located (Table 2). About 80% of islands showed no significant difference in
substitution rates to ORFs as a whole. Based on this evidence, we conclude that, for the most
part, low-complexity segments in yeast are more variable and less conserved in protein
sequences than the ORFs as a whole.
Conserved low-complexity sequences
We used the Poisson test (Equation 2) to identify conserved low-complexity islands. The
number of conserved low-complexity islands varied depending on significance level and
methods of comparison (Table 2). The power of this test increased with increased genome
distance. At P<0.001, comparing the most closely related species (S. cerevisiae/S. paradoxus)
yielded 0.39% conserved low-complexity islands. Comparison of more distantly related species
(S. cerevisiae/S. bayanus and S. paradoxus/S. bayanus) showed about 1% conserved islands.
Comparisons using the total tree lengths inferred by parsimony analysis resulted in 2.4%
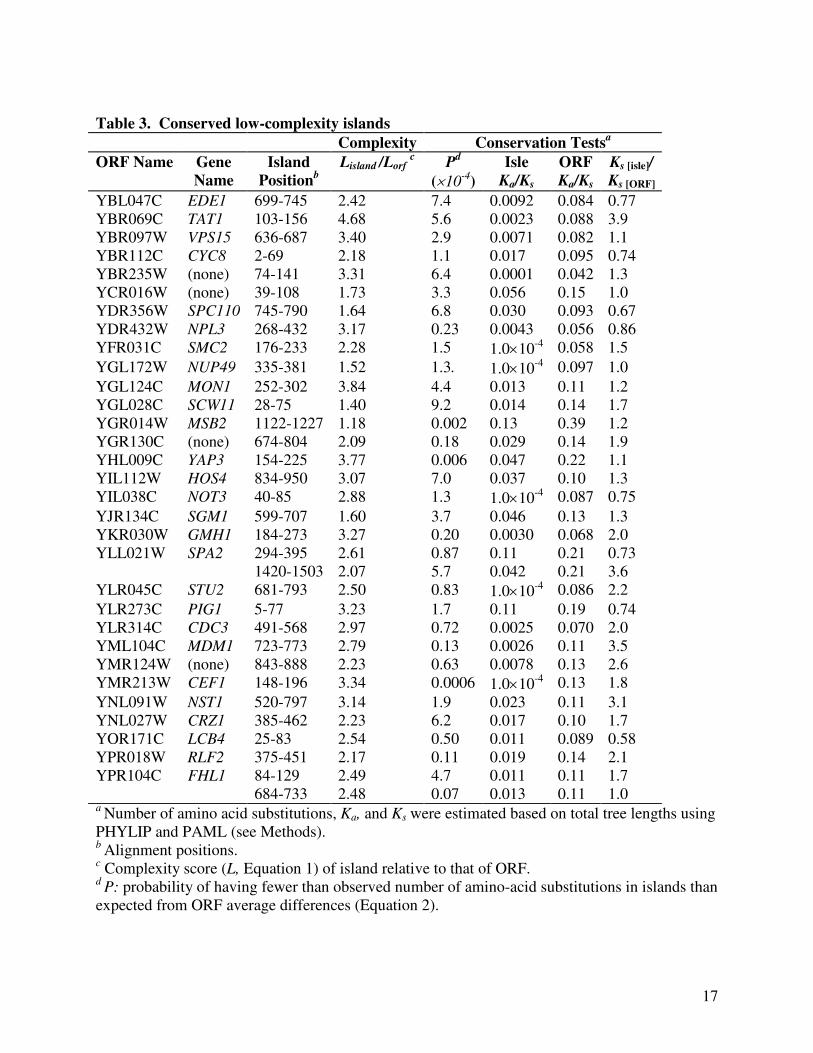
conserved low-complexity islands (Table 2). A total of 33 conserved (P<0.001) islands were
identified based on the total tree lengths. The much lower Ka/Ks ratios of these islands relative to
those of the whole ORFs further supported the amino-acid sequence conservation of these 33
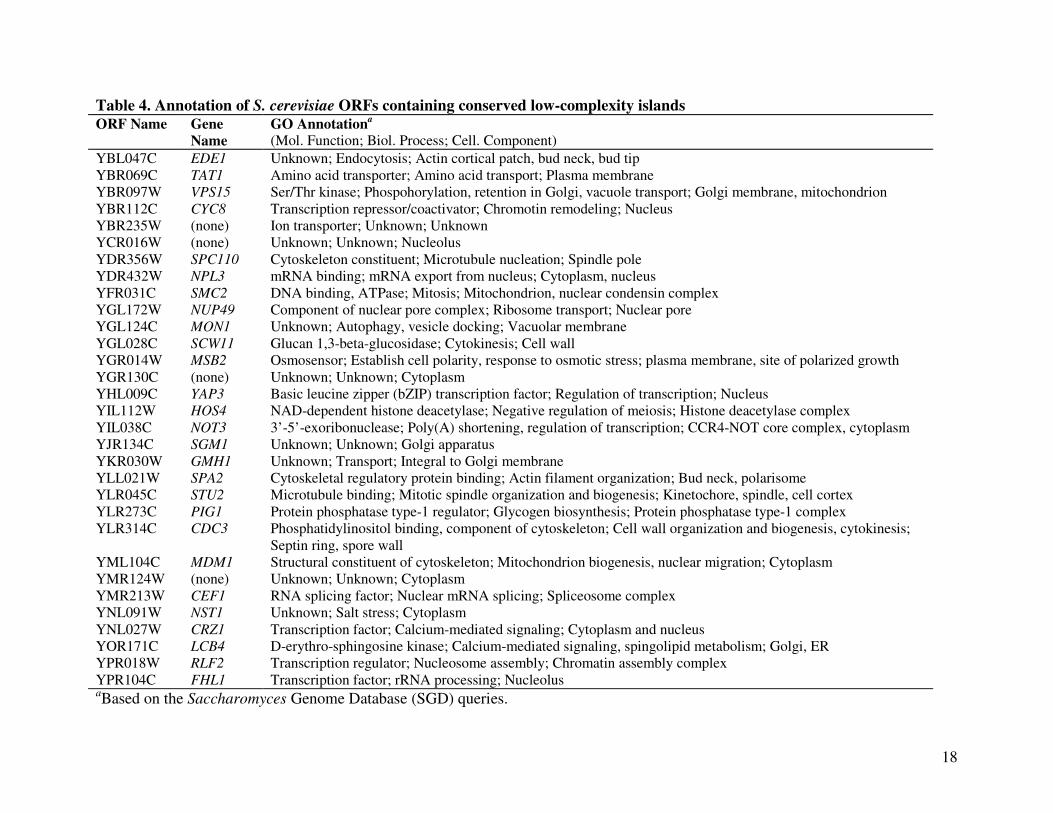
low-complexity islands (Table 3). Table 4 lists the SGD annotations of the 31 ORFs whose
product contain these conserved low-complexity islands. Ten genes (CYC8, NPL3, SMC2,
YAP3, HOS4, NOT3, CEF1, CRZ1, RLF2, FHL1) encode proteins involved in transcription
regulation or DNA/RNA-binding activities. Products of another eight ORFs (EDE1, TAT1,
VPS15, YBR235W, NUP49, MON1, SGM1, GMH1) function in intracellular transport. Yet
another seven genes (SPC110, SCW11, MSB2, SPA2, STU2, CDC3, MDM1) encode structural
components of the cytoskeleton. Eight of the 33 conserved, low-complexity islands
corresponded to known structural domains such as nucleic-acid binding folds (Figure 3; Table 5).
Most conserved islands, however, did not contain known domains or motifs identified in SGD.
8
Although these sequences were highly repetitive and replete with tandem repeats, we observed
only a few alignment gaps. The average gap density, defined as the percentage of alignment
columns containing gaps, was 0.067 in all low-complexity islands and only 0.021 in these 33
conserved low-complexity islands.
Discussion
Yeasts are at the forefront of comparative genomics of eukaryotes, and evolutionary events such
as ancient genome duplications and numerous gene duplications and losses have been identified
as a result of such efforts (reviewed in (Dujon 2005; Gianni and Edward 2005; Piskur and
Langkjaer 2004). Whole-genome sequencing of closely-related species allows more accurate
reconstruction of genome evolution than comparing genomes from phylogenetically distant
species. This is because fewer multiple events affect the same genomic regions or sites during
the relatively short time of divergence between closely-related species. Technically, sequences
from closely-related species can be more reliably aligned using unsupervised procedures than
sequences from distant species. This technical advantage is critical for the evolutionary study of
low-complexity sequences, since compositionally-biased sequences are prone to misalignment
when standard amino-acid substitution matrices are used (a problem known as “low-complexity
corruption”) (Schaffer et al. 2001) (Coronado et al., in press). Here we used the comparative
genomics resource available for multiple yeast species (Kellis et al. 2003) to systematically
examine the evolution and function of low-complexity sequences that make up a large portion of
the eukaryotic proteome (Golding 1999; Huntley and Golding 2000; Marcotte et al. 1999; Sim
and Creamer 2002).
Are low-complexity sequences adaptive?
It is controversial whether low-complexity sequences are maintained by natural selection or by
selectively neutral processes such as the birth-death process of DNA duplications (Malpertuy et
al. 2003; Nei 2005). In the three yeast proteomes studied here, we found that the evolutionary
rates of the low-complexity islands we identified were about 50% higher than those of the ORFs
in which they were found. In addition, there were about 10 times as many low-complexity
islands that evolve quickly rather than slowly at the tested significance levels (P<0.01 and
P<0.001, Table 2). These results extend previous studies of evolutionary conservation of low-
complexity sequences (Huntley and Golding 2000; Sim and Creamer 2004) that reported a
9
similar lack of sequence conservation in low-complexity sequences. Those previous studies
employed different criteria for low-complexity sequences, different measures of sequence
conservation, and phylogenetically distant sequences. Disordered regions of protein, many of
which are low-complexity sequences (Liu et al. 2002; Romero et al. 2001), evolve on average
with either equivalent or faster rates than the flanking regions (Brown et al. 2002; Liu et al.
2002). The lack of sequence conservation of low-complexity sequences suggests that repetitive
protein segments may be disposable parts of the proteome (Huntley and Golding 2000). It has
been suggested that the abundance of low-complexity sequences in eukaryotes could be due to
the smaller population sizes and, thereby, weaker selection in eukaryotes than in prokaryotes
(Lynch and Conery 2003).
Nevertheless, we found that higher than expected numbers of low-complexity islands are
conserved. These conserved low-complexity islands also showed fewer alignment gaps than
non-conserved low-complexity islands. Low-complexity sequences may also be conserved in
their amino-acid composition, sequence length, and higher-order structural propensities. Distinct
classes of repetitive sequences (e.g., those enriched in Gln, Asn, and Asp) appeared associated
with different functional classes of proteins (e.g., transcription factors) in yeast (Mar Alba et al.
1999). This suggests that certain amino acid compositions in proteins are selectively maintained.
Similarly, certain classes of tandem triplet repeats (e.g., CAA, coding for Gln) were
preferentially retained in coding regions, coding strands, and certain functional classes in the
yeast genome (e.g., transcriptional regulators) (Malpertuy et al. 2003; Mar Alba et al. 1999;
Young et al. 2000). Some amino acids (Gly, Gln, Ser, Asn, Pro, Asp, Glu, Lys) are over-
represented in low-complexity and disordered regions of proteins (Liu et al. 2002; Romero et al.
2001; Sim and Creamer 2004). It has been suggested that these amino acids might be selected
for forming functional yet natively disordered parts of proteins (Romero et al. 2001).
In this study we used 2,838 ortholgous ORF families from three Saccharomyces sensu
stricto genomes (Kellis et al. 2003) to estimate the evolutionary rates of low-complexity
sequences. For three reasons, we believe that our genome-verified, orthologous ORFs from
closely-related species produces more reliable and more precise estimates of sequence
conservation than previous studies of sequence conservation of low-complexity (Huntley and
Golding 2000; Sim and Creamer 2004) or disordered (Brown et al. 2002; Liu et al. 2002)
sequences. First, gene orthology among homologous ORFs identified from genome comparisons
10
is more reliable than the output of BLAST or other searches based on sequence similarity.
Evolutionary rates among orthologous genes are more uniform than among paralogous genes due
to frequent function shifts in the latter. Sequence comparisons among paralogous sequences may
underestimate (for recent duplications) or overestimate (for ancient duplications) evolutionary
rates (Zmasek and Eddy 2001). Second, the availability of complete proteomes allowed a
precise estimate of the overall rate of amino acid substitutions with an explicit model of neutral
evolution. The proteome-wide amino-acid sequence differences fit a neutral model of amino-
acid substitutions well (Figure 2). Conserved segments can thereby be identified as those that
with significantly fewer differences than expected from the average proteome or average ORF
differences. Finally, the availability of genome sequences offered an additional (although not
independent) test of sequence conservation based on the nonsynonymous to synonymous (Ka/Ks)
ratios (Hurst 2002). With the same level of amino acid variability (Ka), amino acid sequences
are more conserved when accompanied by a high rate of synonymous substitutions (high Ks).
Putative roles of conserved low-complexity sequences
Despite the generally low sequence conservation of low-complexity sequences in the yeast
proteome, the number of long, conserved low-complexity islands was greater than expected from
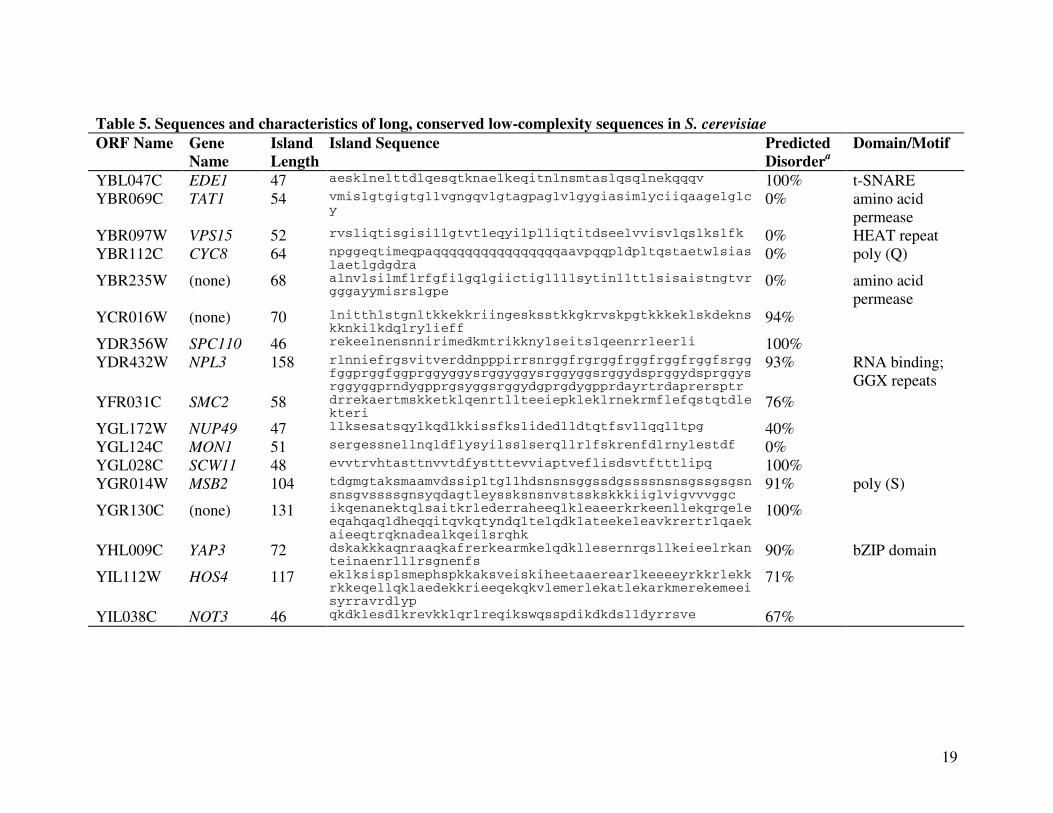
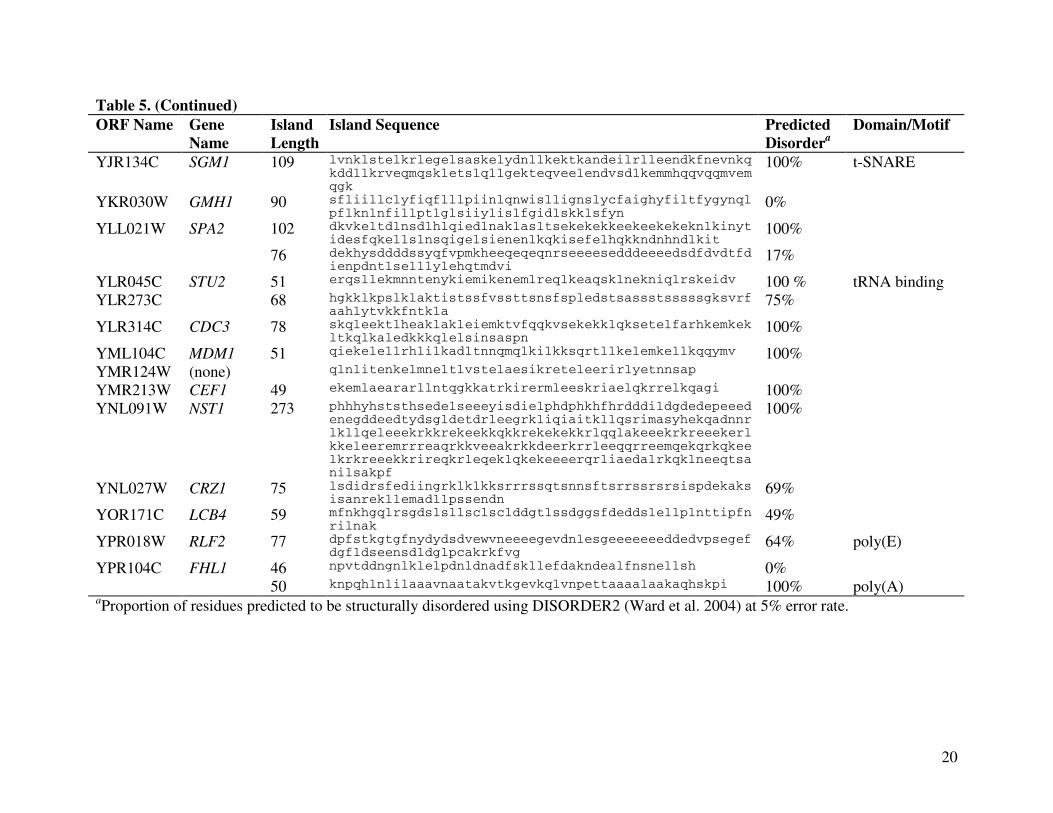
neutral Poisson processes, both at P<0.01 and P<0.001 (Table 2). The length of our 33 most
conserved low-complexity sequences identified in the present analysis ranged from 46 to 273
residues (Table 5). Conserved low-complexity sequences were previously identified in a survey
of protein families from the COG database (Tatusov et al. 2003), which primarily consists of
prokaryotic sequences (Sim and Creamer 2004). That work used an absolute measure of
sequence conservation (40% sequence identity). A more informative measure would be the
sequence identity of these low-complexity sequences relative to the identity of the full-length
proteins.
The sequence conservation observed in these long, low-complexity islands is unlikely to
be coincidental. At P<0.001 the expected number of false positives among 1,500 independent
comparisons was 1.5 while the possibility of having 4 or more false positives was not significant
(P=0.02 assuming a Poisson error rate). As expected, the sensitivity of the Poisson test
increased with increasing genome distances (Eddy 2005) and with the use of tree-based methods
(Table 2). Perhaps more convincingly, the Ka/Ks ratios provided further evidence of sequence
11
conservation of these islands by showing that their synonymous substitution rates were
comparable to, if not greater than, those of the ORFs (Table 3).
GO annotations showed that the ORFs containing these conserved low-complexity
sequences were over-represented by ORFs functioning in transcriptional regulation (10/31, or
32%; CYC8, NPL3, SMC2, YAP3, HOS4, NOT3, CEF1, CRZ1, RLF2, FHL1), consistent with
earlier findings that sequence repetitiveness and structural disorder are associated with
macromolecular binding activities (Liu et al. 2002; Malpertuy et al. 2003; Mar Alba et al. 1999;
Ward et al. 2004). The other two major functional classes of ORFs containing conserved low-
complexity sequences included eight genes (26%; EDE1, TAT1, VPS15, YBR235W, NUP49,
MON1, SGM1, GMH1) coding for proteins involved in intracellular transport and seven (23%;
SPC110, SCW11, MSB2, SPA2, STU2, CDC3, MDM1) coding for structural components of
cytoskeleton. Although it is unlikely that low-complexity islands correspond exactly to
biologically functional units, a conserved low-complexity island in Yap3p matches almost
precisely with a known structural domain, the DNA-binding bZIP domain (Figure 3). The
conserved island in Stu2p coincides with the tRNA-binding arm of the molecule. Six other low-
complexity islands do not coincide but overlap with known domains or motifs: an island in
Ede1p and another in Sgm1p each containing a t-SNARE domain important for membrane
fusion and endo- or exocytosis, an island in Tat1p and another in the unnamed YBR235W ORF
product each containing a amino-acid permease motif, an island in Vps15p forming a part of
HEAT repeats involved in intracellular transport, and an island in Npl3p associated with an RNA
binding domain. Computational prediction showed a high propensity for structural disorder in
these highly conserved low-complexity islands (Table 5). It would be intriguing to
experimentally test the structural and functional roles of these long, conserved low-complexity
islands.
Detecting short, conserved motifs using comparative genomics
Overall, we observed 10 times as many fast-evolving, low-complexity sequences than conserved
low-complexity sequences at every level of statistical significance (Table 2). Because we
targeted only long (at least 45 residues) low-complexity sequences, shorter conserved sequences,
such as mini- or micro-repeat units (Tompa 2003), may also exist. The statistical power of
sequence conservation detection with comparative genomics increases with the number of
12
genomes, the level of genome divergence and the length of conserved sites (Cooper et al. 2003;
Eddy 2005). To identify short conserved motifs within low-complexity sequences, one would
have to increase the number of genomes or to compare more divergent genomes (as long as
reliable alignments can be obtained). Assuming a Poisson model of neutral amino-acid
substitutions, the probability of observing no sequence difference (P0) in N (not necessarily
consecutive) amino acids between two proteomes differing by D (per site) is P0 = e−DN. By this
formula, the shortest conserved segments showing no sequence difference at P=0.001 in
comparisons between the S. cerevisiae and S. bayanus proteomes (D=0.16) is 43 amino acids
long. The identification of conserved segments 10 amino acids long at the same significance
level would require the comparison of two proteomes that differ by 69%, the use of more
genomes, or both. (At large distances sequence difference needs to be corrected for multiple
hits.)
In summary, we showed through comparative genomics in yeast proteomes that long (at
least 45 residues), conserved low-complexity sequences are rare but exist at a frequency greater
than chance would predict. If there are other highly conserved, low-complexity sequences, their
biological roles would rely predominantly upon shorter (fewer than 45 residues) conserved
motifs or upon features other than their primary sequences (e.g., amino-acid composition,
sequence length, and structural propensity). We expect the comparative genomics of closely-
related species to play an increasingly prominent role in revealing selectively-maintained and
functionally-important low-complexity sequence motifs and disordered proteins. Once sufficient
numbers of closely-related genomes become available, the functional importance of protein
sequences at the single residue level can be tested based upon their evolutionary conservation.
Adaptively-maintained low-complexity or disordered sequences could thereby be distinguished
from the (probably much more common) low-complexity and disordered sequences that are
maintained in the proteome by neutral processes.
Acknowledgements
We thank Anton Vysoiskiy for computer system administration. We thank two anonymous
reviewers for critical comments and valuable suggestions. This investigation was supported by
awards (RR-03037 and GM-60654) from the National Institutes of Health.
13
Literature Cited
Altschul SF, Gish W (1996) Local alignment statistics. Methods Enzymol 266:460-80Brocchieri L, Karlin S (2005) Protein length in eukaryotic and prokaryotic proteomes. Nucleic
Acids Res 33:3390-400Brown CJ, Takayama S, Campen AM, Vise P, Marshall TW, Oldfield CJ, Williams CJ, Dunker
AK (2002) Evolutionary rate heterogeneity in proteins with long disordered regions. J Mol Evol 55:104-10
Cooper GM, Brudno M, Green ED, Batzoglou S, Sidow A (2003) Quantitative estimates of sequence divergence for comparative analyses of mammalian genomes. Genome Res 13:813-20
Dujon B (2005) Hemiascomycetous yeasts at the forefront of comparative genomics. Curr Opin Genet Dev
Dunker AK, Garner E, Guilliot S, Romero P, Albrecht K, Hart J, Obradovic Z, Kissinger C, Villafranca JE (1998) Protein disorder and the evolution of molecular recognition: theory, predictions and observations. Pac Symp Biocomput:473-84
Dyson HJ, Wright PE (2005) Intrinsically unstructured proteins and their functions. Nat Rev Mol Cell Biol 6:197-208
Eddy SR (2005) A model of the statistical power of comparative genome sequence analysis. PLoS Biol 3:e10
Felsenstein J (1989) PHYLIP-Phylogeny Inference Package. Cladistics 5:164-166Gianni L, Edward JL (2005) Yeast evolution and comparative genomics. Annu Rev Microbiol
59:135-53Golding GB (1999) Simple sequence is abundant in eukaryotic proteins. Protein Sci 8:1358-61Huang L, Guan RJ, Pardee AB (1999) Evolution of transcriptional control from prokaryotic
beginnings to eukaryotic complexities. Crit Rev Eukaryot Gene Expr 9:175-82Huntley M, Golding GB (2000) Evolution of simple sequence in proteins. J Mol Evol 51:131-
40Huntley MA, Golding GB (2002) Simple sequences are rare in the Protein Data Bank. Proteins
48:134-40Hurst LD (2002) The Ka/Ks ratio: diagnosing the form of sequence evolution. Trends Genet
18:486-487Kellis M, Patterson N, Endrizzi M, Birren B, Lander ES (2003) Sequencing and comparison of
yeast species to identify genes and regulatory elements. Nature 423:241-54Liu J, Tan H, Rost B (2002) Loopy proteins appear conserved in evolution. J Mol Biol 322:53-
64Lynch M, Conery JS (2003) The origins of genome complexity. Science 302:1401-4 Malpertuy A, Dujon B, Richard GF (2003) Analysis of microsatellites in 13 hemiascomycetous
yeast species: mechanisms involved in genome dynamics. J Mol Evol 56:730-41Mar Alba M, Santibanez-Koref MF, Hancock JM (1999) Amino acid reiterations in yeast are
overrepresented in particular classes of proteins and show evidence of a slippage-like mutational process. J Mol Evol 49:789-97
Marcotte EM, Pellegrini M, Yeates TO, Eisenberg D (1999) A census of protein repeats. J Mol Biol 293:151-60
Nei M (2005) Selectionism and Neutralism in Molecular Evolution. Mol Biol EvolPiskur J, Langkjaer RB (2004) Yeast genome sequencing: the power of comparative genomics.

14
Mol Microbiol 53:381-9 Romero P, Obradovic Z, Li X, Garner EC, Brown CJ, Dunker AK (2001) Sequence complexity
of disordered protein. Proteins 42:38-48Rubin GM, Yandell MD, Wortman JR, Gabor Miklos GL, Nelson CR, Hariharan IK, Fortini
ME, Li PW, Apweiler R, Fleischmann W, Cherry JM, Henikoff S, Skupski MP, Misra S, Ashburner M, Birney E, Boguski MS, Brody T, Brokstein P, Celniker SE, Chervitz SA, Coates D, Cravchik A, Gabrielian A, Galle RF, Gelbart WM, George RA, Goldstein LS, Gong F, Guan P, Harris NL, Hay BA, Hoskins RA, Li J, Li Z, Hynes RO, Jones SJ, Kuehl PM, Lemaitre B, Littleton JT, Morrison DK, Mungall C, O'Farrell PH, Pickeral OK, Shue C, Vosshall LB, Zhang J, Zhao Q, Zheng XH, Lewis S (2000) Comparative genomics of the eukaryotes. Science 287:2204-15
Schaffer AA, Aravind L, Madden TL, Shavirin S, Spouge JL, Wolf YI, Koonin EV, Altschul SF (2001) Improving the accuracy of PSI-BLAST protein database searches with composition-based statistics and other refinements. Nucleic Acids Res 29:2994-3005
Schneider TD, Stormo GD, Gold L, Ehrenfeucht A (1986) Information content of binding sites on nucleotide sequences. J Mol Biol 188:415-31
Sim KL, Creamer TP (2002) Abundance and distributions of eukaryote protein simple sequences. Mol Cell Proteomics 1:983-95
Sim KL, Creamer TP (2004) Protein simple sequence conservation. Proteins 54:629-38Tatusov RL, Fedorova ND, Jackson JD, Jacobs AR, Kiryutin B, Koonin EV, Krylov DM,
Mazumder R, Mekhedov SL, Nikolskaya AN, Rao BS, Smirnov S, Sverdlov AV, Vasudevan S, Wolf YI, Yin JJ, Natale DA (2003) The COG database: an updated version includes eukaryotes. BMC Bioinformatics 4:41
Thompson JD, Higgins DG, Gibson TJ (1994) CLUSTAL W: improving the sensitivity of progressive multiple sequence alignment through sequence weighting, position-specific gap penalties and weight matrix choice. Nucleic Acids Res 22:4673-80
Tompa P (2002) Intrinsically unstructured proteins. Trends Biochem Sci 27:527-33Tompa P (2003) Intrinsically unstructured proteins evolve by repeat expansion. Bioessays
25:847-55Ward JJ, Sodhi JS, McGuffin LJ, Buxton BF, Jones DT (2004) Prediction and functional
analysis of native disorder in proteins from the three kingdoms of life. J Mol Biol 337:635-45
Wootton JC (1994) Non-globular domains in protein sequences: automated segmentation using complexity measures. Comput Chem 18:269-85
Wootton JC, Federhen S (1996) Analysis of compositionally biased regions in sequence databases. Methods in Enzymology 266:554-571
Yang Z (1997) PAML: a program package for phylogenetic analysis by maximum likelihood. Comput Appl Biosci 13:555-6
Young ET, Sloan JS, Van Riper K (2000) Trinucleotide repeats are clustered in regulatory genes in Saccharomyces cerevisiae. Genetics 154:1053-68
Zmasek CM, Eddy SR (2001) A simple algorithm to infer gene duplication and speciation events on a gene tree. Bioinformatics 17:821-8
15
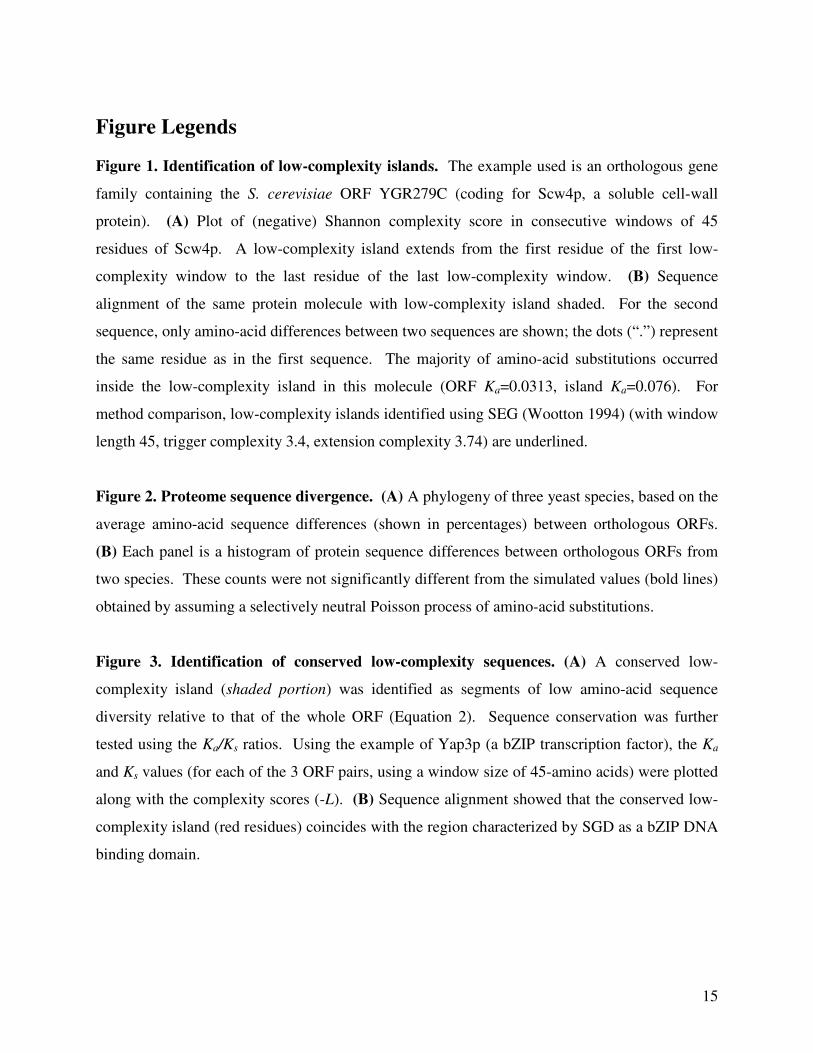
Figure Legends
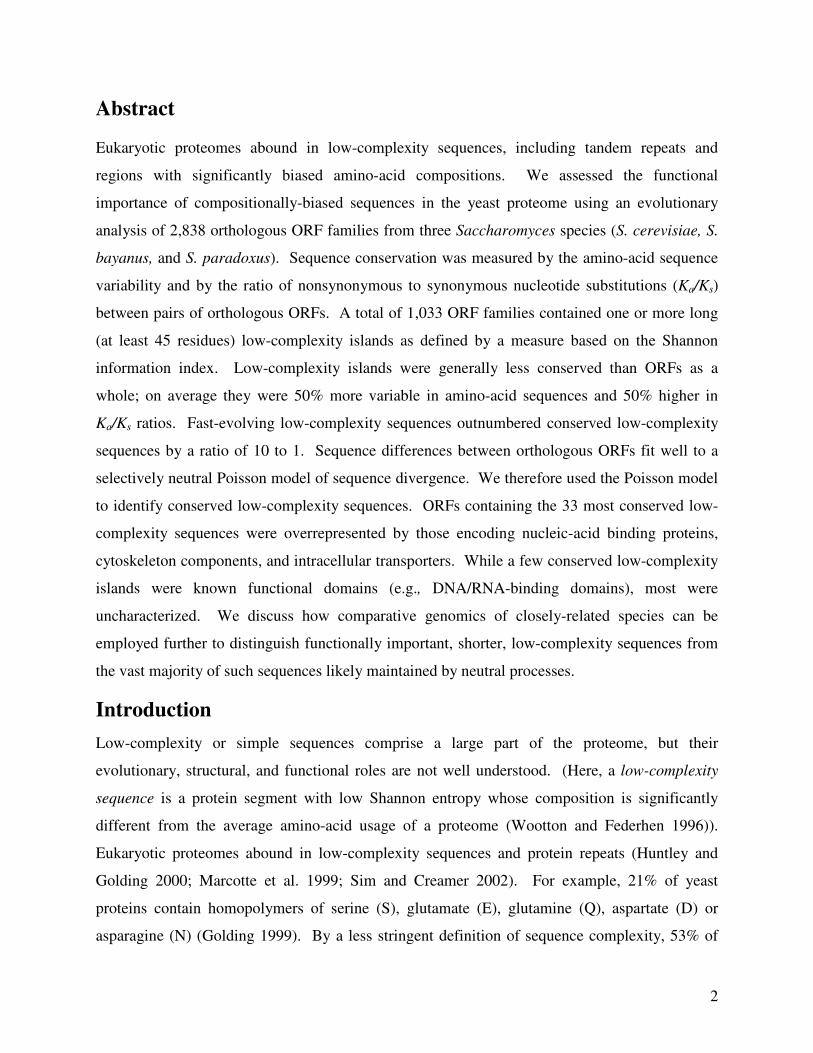
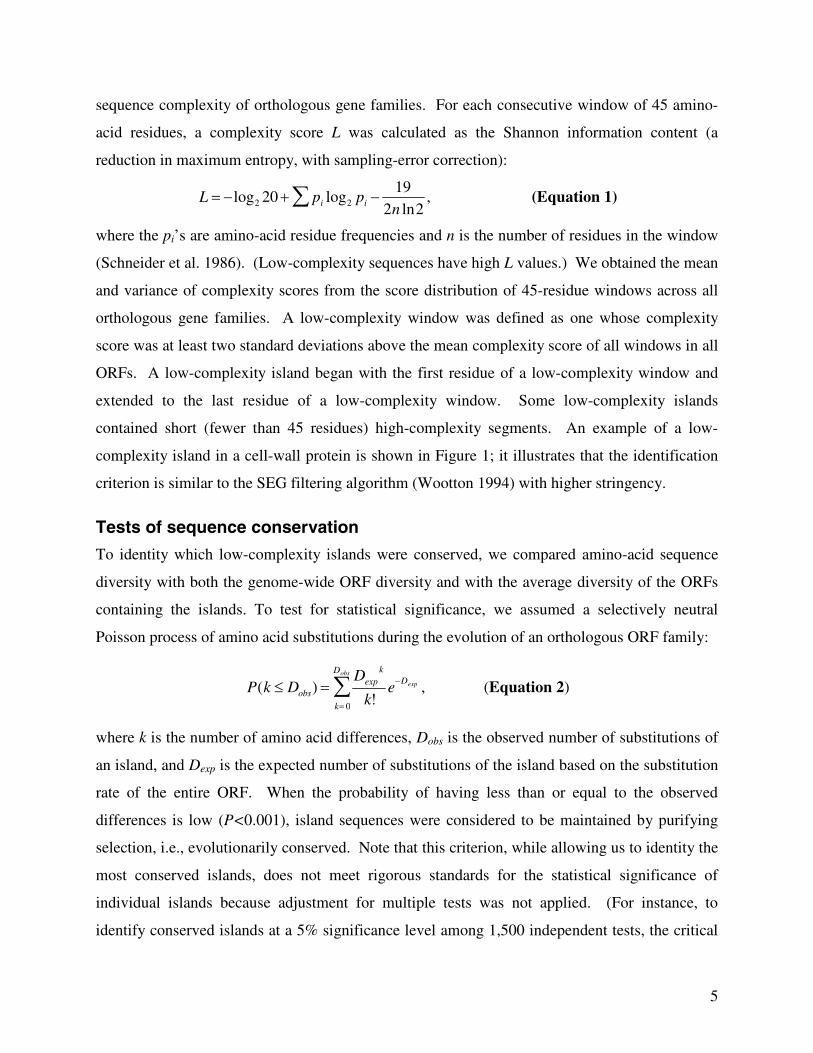
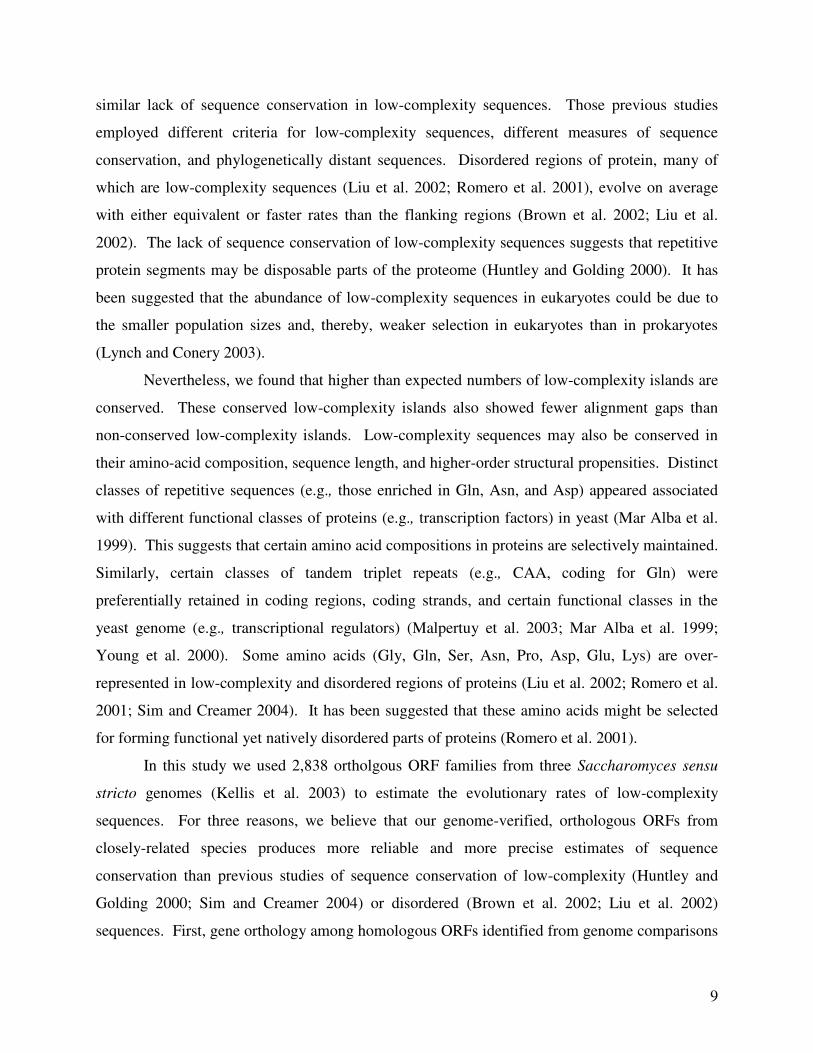
Figure 1. Identification of low-complexity islands. The example used is an orthologous gene
family containing the S. cerevisiae ORF YGR279C (coding for Scw4p, a soluble cell-wall
protein). (A) Plot of (negative) Shannon complexity score in consecutive windows of 45
residues of Scw4p. A low-complexity island extends from the first residue of the first low-
complexity window to the last residue of the last low-complexity window. (B) Sequence
alignment of the same protein molecule with low-complexity island shaded. For the second
sequence, only amino-acid differences between two sequences are shown; the dots (“.”) represent
the same residue as in the first sequence. The majority of amino-acid substitutions occurred
inside the low-complexity island in this molecule (ORF Ka=0.0313, island Ka=0.076). For
method comparison, low-complexity islands identified using SEG (Wootton 1994) (with window
length 45, trigger complexity 3.4, extension complexity 3.74) are underlined.
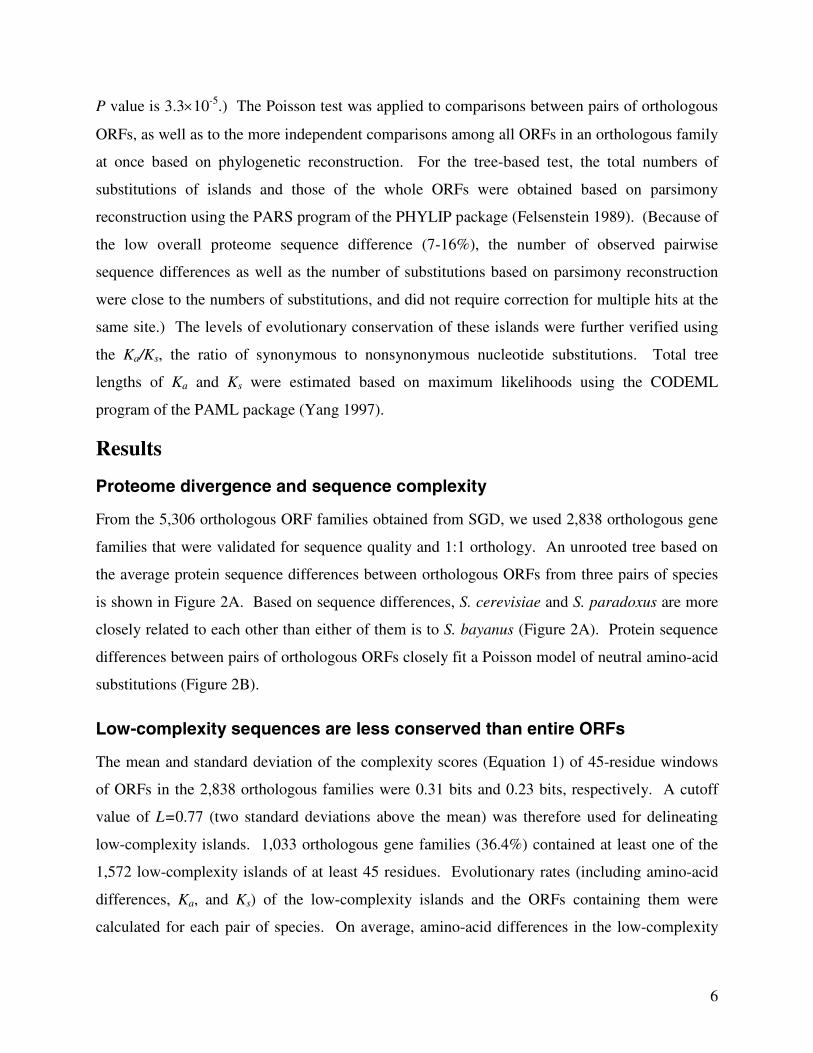
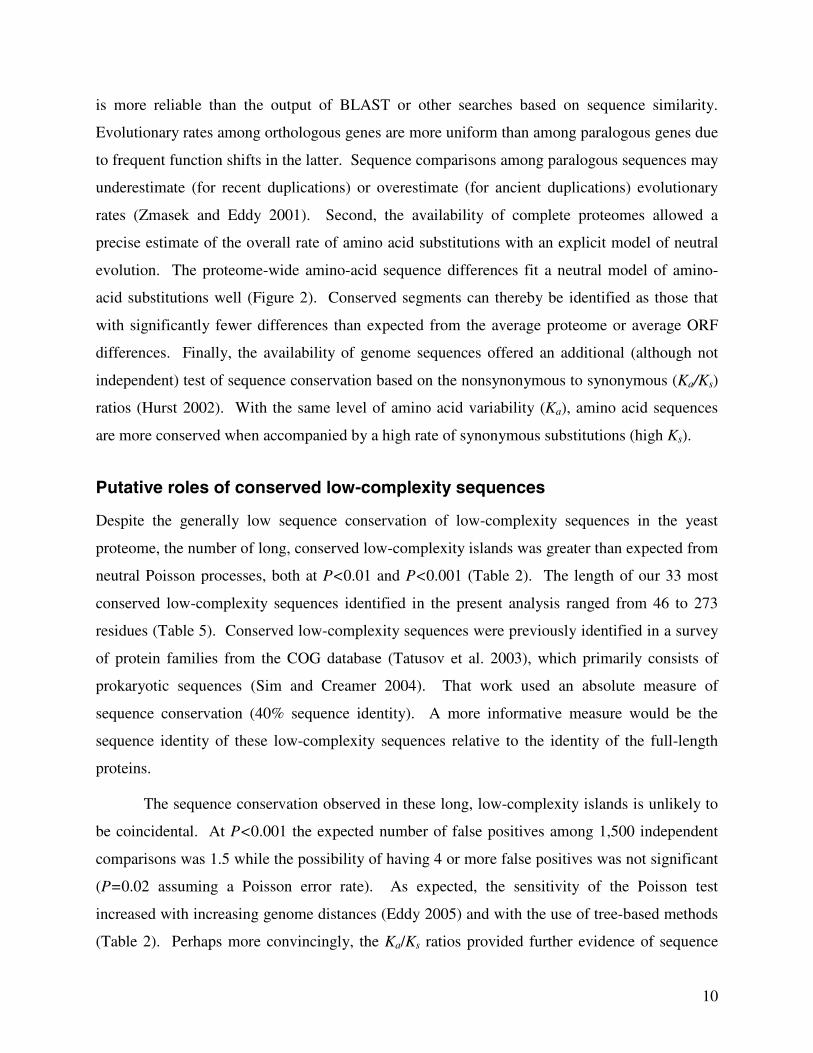
Figure 2. Proteome sequence divergence. (A) A phylogeny of three yeast species, based on the
average amino-acid sequence differences (shown in percentages) between orthologous ORFs.
(B) Each panel is a histogram of protein sequence differences between orthologous ORFs from
two species. These counts were not significantly different from the simulated values (bold lines)
obtained by assuming a selectively neutral Poisson process of amino-acid substitutions.
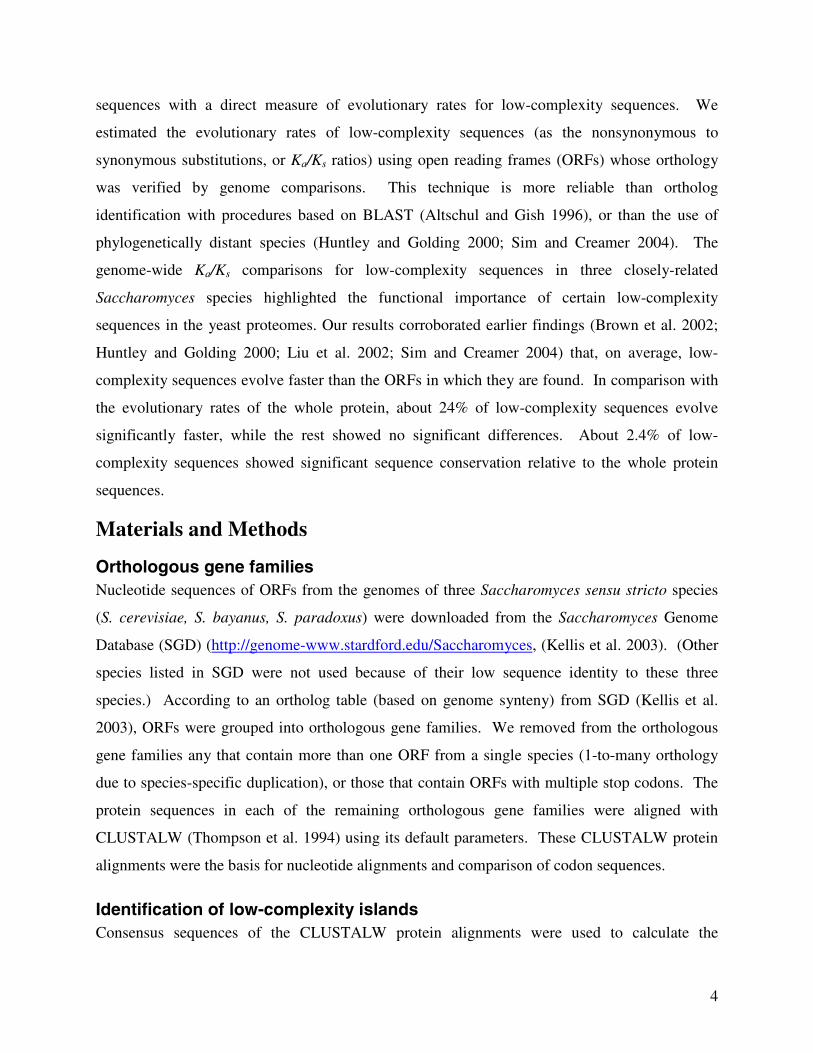
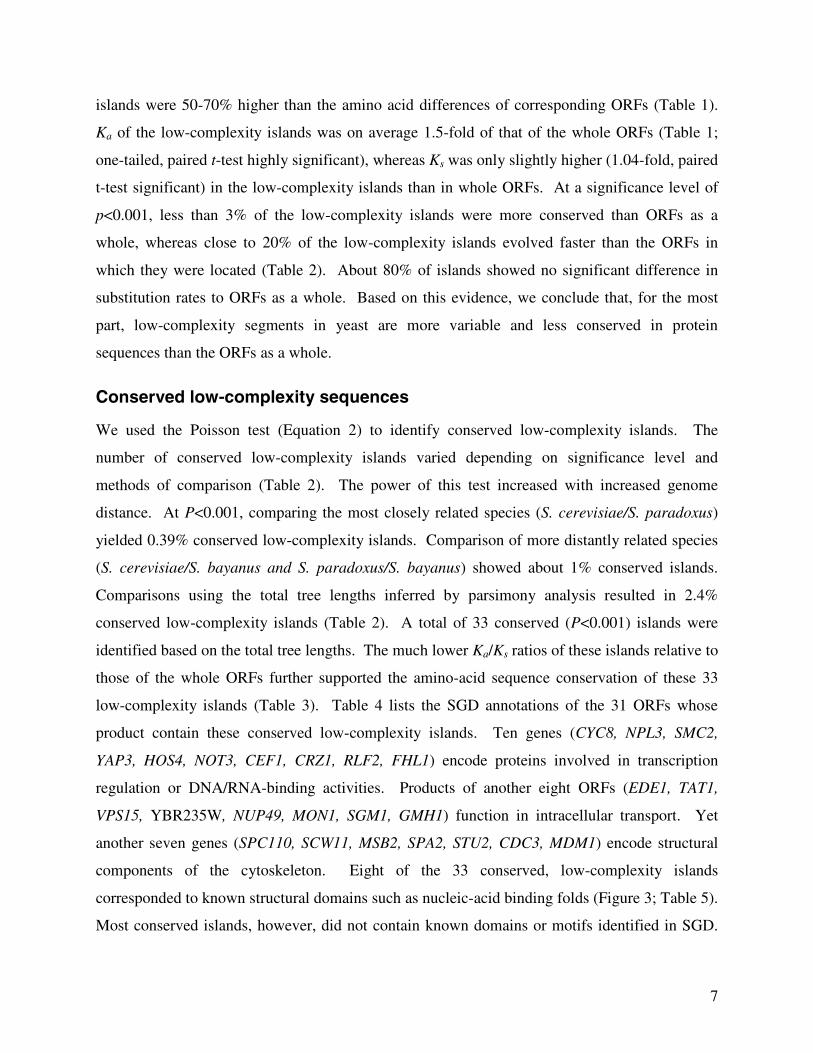
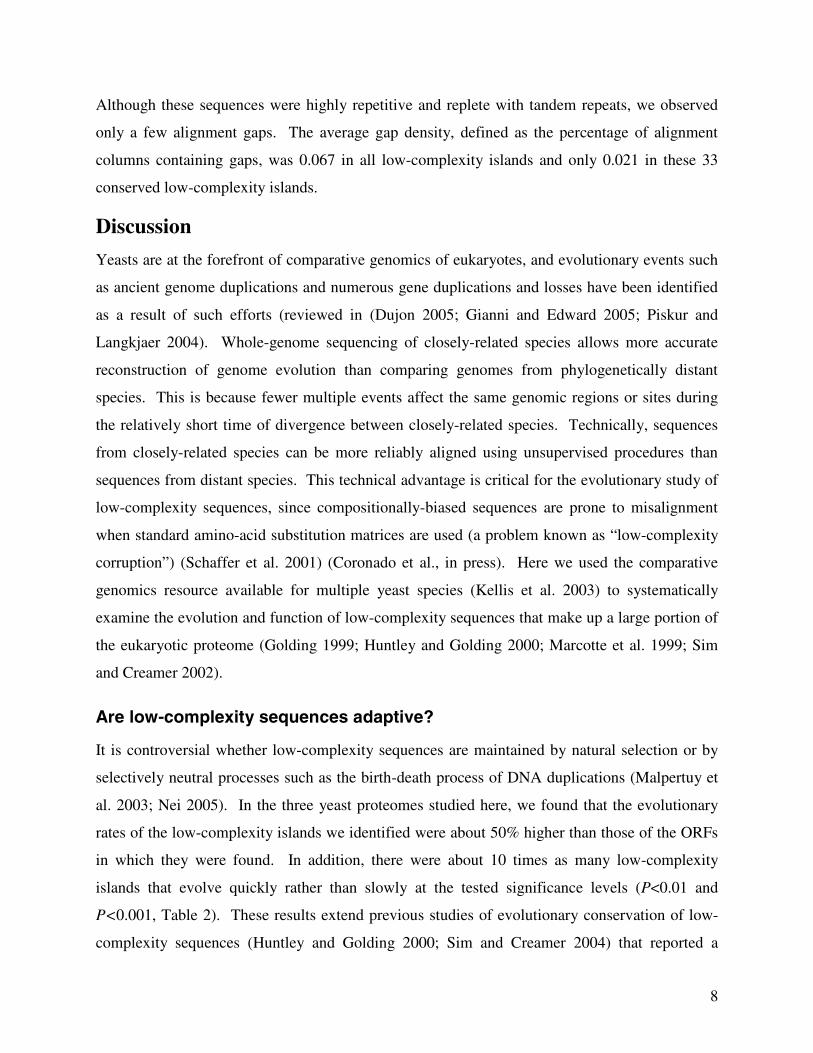
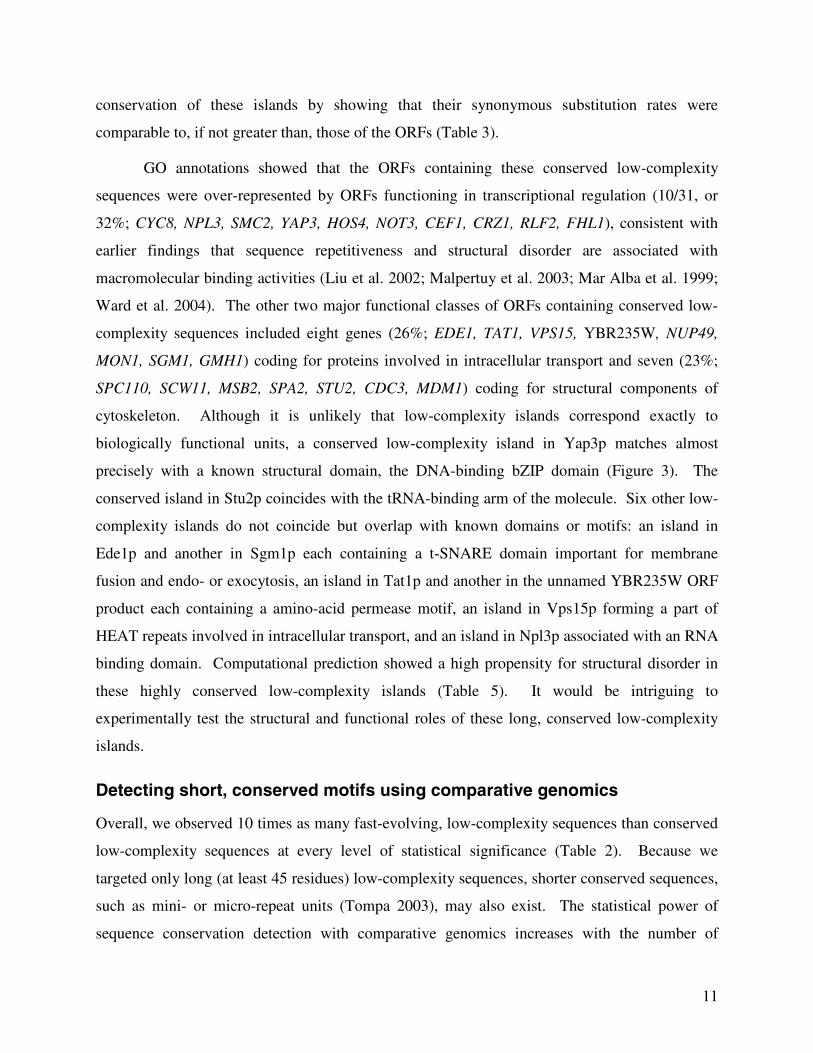
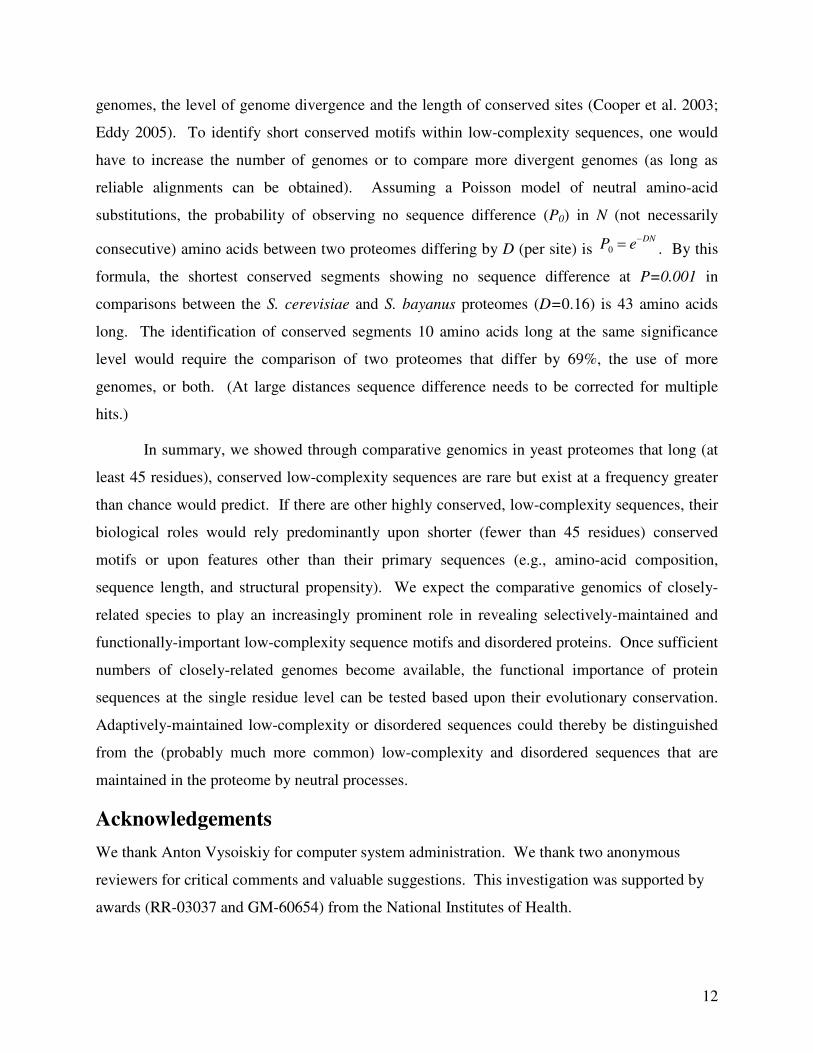
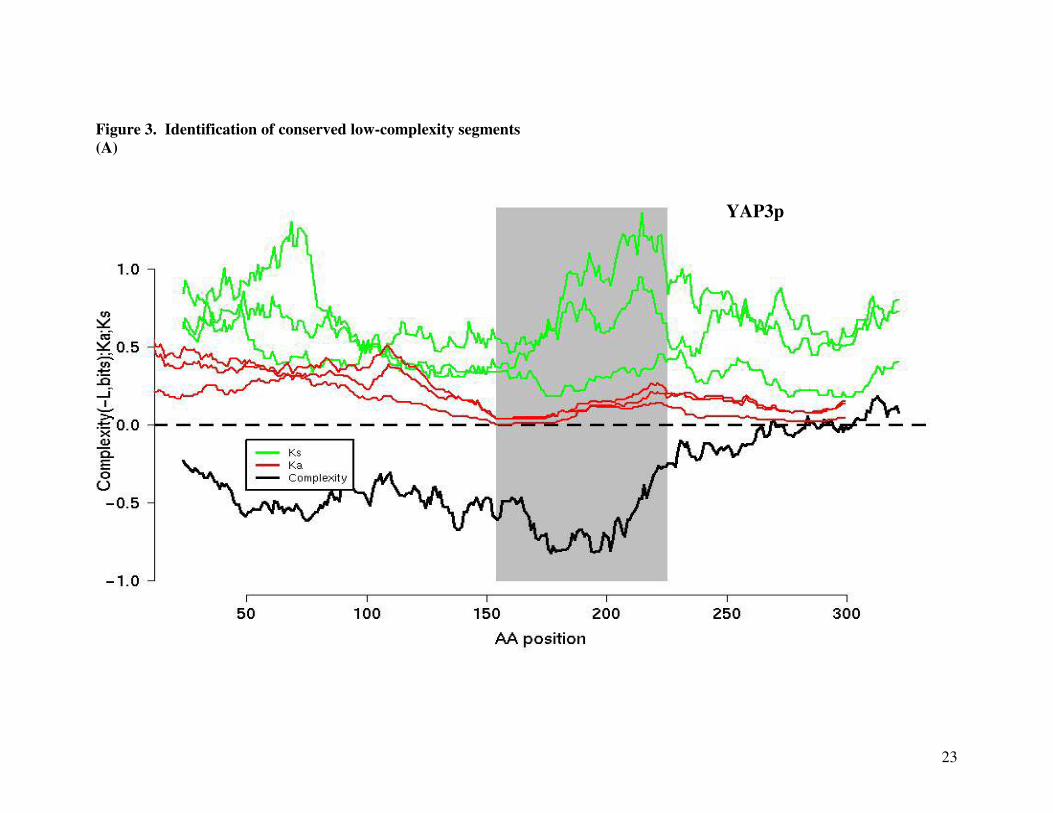
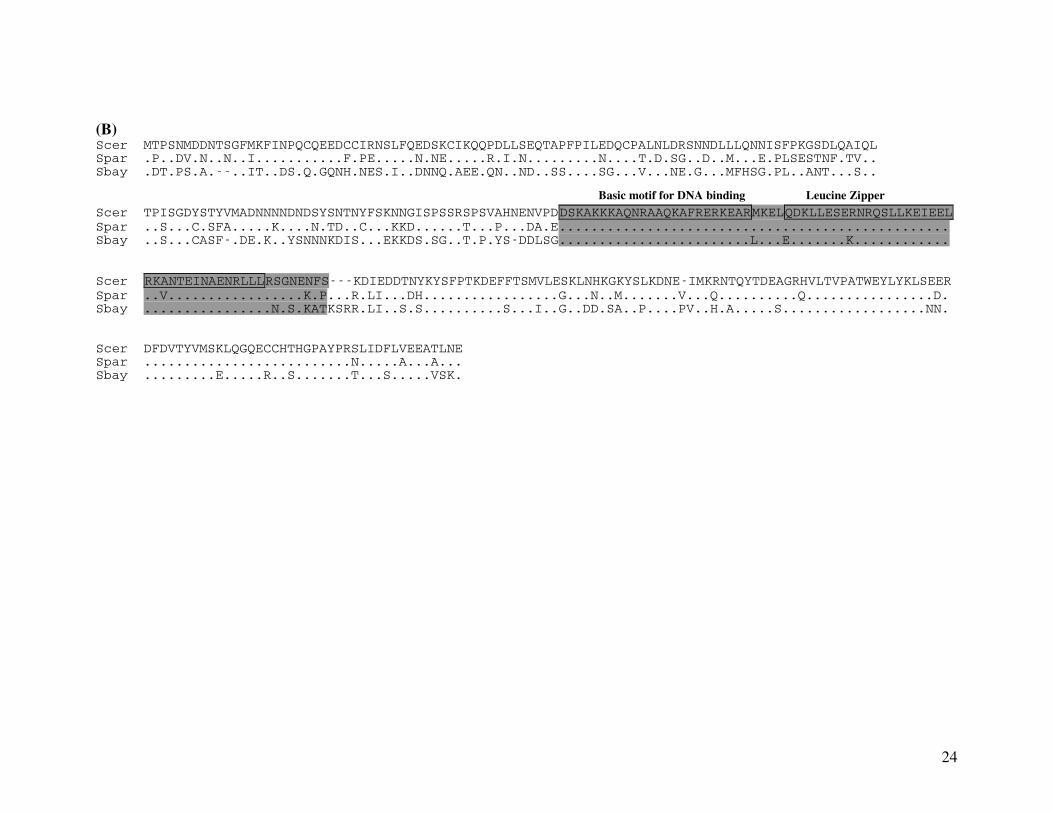
Figure 3. Identification of conserved low-complexity sequences. (A) A conserved low-
complexity island (shaded portion) was identified as segments of low amino-acid sequence
diversity relative to that of the whole ORF (Equation 2). Sequence conservation was further
tested using the Ka/Ks ratios. Using the example of Yap3p (a bZIP transcription factor), the Ka
and Ks values (for each of the 3 ORF pairs, using a window size of 45-amino acids) were plotted
along with the complexity scores (-L). (B) Sequence alignment showed that the conserved low-
complexity island (red residues) coincides with the region characterized by SGD as a bZIP DNA
binding domain.
16
Table 1. Evolutionary rates of low-complexity sequences in yeasts
S. cer vs. S. par S. cer vs. S. bay S. par vs. S. bay
ORF
No. of pairs 2786 2581 2535
Amino-acid diff. 7.81% 16.1% 15.5%%
Ks * 0.3277 0.7734 0.7128
Ka * 0.0509 0.1235 0.1157
Ka*/Ks
* 0.1553 0.1597 0.1623
Low-complexity Islands
No. of pairs 1537 1418 1386
Amino-acid diff. 12.9% 25.5% 24.3%
Ks 0.3422 0.8052 0.7451
Ka 0.0735 0.1813 0.1718
Ka /Ks 0.2149 0.2252 0.2306
*Average values.
Table 2. Levels of sequence conservation of low-complexity islands
S. cer vs.
S. par
S. cer vs.
S. bay
S. par vs.
S. bay
Tree-length
Testa
No. of islands 1537 1418 1386 1387
P<10-3 206 (13.4%) 266 (18.8%) 248 (17.9%) 332 (23.9%)Fast-evolving
Islands P<10-2 379 (24.7%) 436 (30.7%) 411 (29.7%) 494 (35.6%)
P<10-3 1325 (86.2%) 1136 (80.1%) 1125 (81.2%) 1022 (73.6%)Similar-rate
Islands P<10-2 1131 (73.6%) 933 (65.8%) 926 (66.8%) 820 (59.0%)
P<10-3 6 (0.39%) 16 (1.1%) 13 (0.94%) 33 (2.4%)Conserved
Islands P<10-2 27 (1.8%) 49 (3.5) 49 (3.1%) 73 (5.3%)aPoisson test based on tree lengths (total number of substitutions inferred using the PARS program of PHYLIP; see Methods).
17
Table 3. Conserved low-complexity islandsComplexity Conservation Testsa
ORF Name GeneName
IslandPositionb
Lisland /Lorfc Pd
(×10-4)Isle
Ka/Ks
ORF Ka/Ks
Ks [isle]/Ks [ORF]
YBL047C EDE1 699-745 2.42 7.4 0.0092 0.084 0.77YBR069C TAT1 103-156 4.68 5.6 0.0023 0.088 3.9YBR097W VPS15 636-687 3.40 2.9 0.0071 0.082 1.1YBR112C CYC8 2-69 2.18 1.1 0.017 0.095 0.74YBR235W (none) 74-141 3.31 6.4 0.0001 0.042 1.3YCR016W (none) 39-108 1.73 3.3 0.056 0.15 1.0YDR356W SPC110 745-790 1.64 6.8 0.030 0.093 0.67YDR432W NPL3 268-432 3.17 0.23 0.0043 0.056 0.86YFR031C SMC2 176-233 2.28 1.5 1.0×10⁻⁴ 0.058 1.5YGL172W NUP49 335-381 1.52 1.3. 1.0×10⁻⁴ 0.097 1.0YGL124C MON1 252-302 3.84 4.4 0.013 0.11 1.2YGL028C SCW11 28-75 1.40 9.2 0.014 0.14 1.7YGR014W MSB2 1122-1227 1.18 0.002 0.13 0.39 1.2YGR130C (none) 674-804 2.09 0.18 0.029 0.14 1.9YHL009C YAP3 154-225 3.77 0.006 0.047 0.22 1.1YIL112W HOS4 834-950 3.07 7.0 0.037 0.10 1.3YIL038C NOT3 40-85 2.88 1.3 1.0×10⁻⁴ 0.087 0.75YJR134C SGM1 599-707 1.60 3.7 0.046 0.13 1.3YKR030W GMH1 184-273 3.27 0.20 0.0030 0.068 2.0YLL021W SPA2 294-395 2.61 0.87 0.11 0.21 0.73
1420-1503 2.07 5.7 0.042 0.21 3.6YLR045C STU2 681-793 2.50 0.83 1.0×10⁻⁴ 0.086 2.2YLR273C PIG1 5-77 3.23 1.7 0.11 0.19 0.74YLR314C CDC3 491-568 2.97 0.72 0.0025 0.070 2.0YML104C MDM1 723-773 2.79 0.13 0.0026 0.11 3.5YMR124W (none) 843-888 2.23 0.63 0.0078 0.13 2.6YMR213W CEF1 148-196 3.34 0.0006 1.0×10⁻⁴ 0.13 1.8YNL091W NST1 520-797 3.14 1.9 0.023 0.11 3.1YNL027W CRZ1 385-462 2.23 6.2 0.017 0.10 1.7YOR171C LCB4 25-83 2.54 0.50 0.011 0.089 0.58YPR018W RLF2 375-451 2.17 0.11 0.019 0.14 2.1YPR104C FHL1 84-129 2.49 4.7 0.011 0.11 1.7
684-733 2.48 0.07 0.013 0.11 1.0a Number of amino acid substitutions, Ka, and Ks were estimated based on total tree lengths using PHYLIP and PAML (see Methods).b Alignment positions.c Complexity score (L, Equation 1) of island relative to that of ORF.d P: probability of having fewer than observed number of amino-acid substitutions in islands than expected from ORF average differences (Equation 2).
18
Table 4. Annotation of S. cerevisiae ORFs containing conserved low-complexity islands ORF Name Gene
NameGO Annotationa
(Mol. Function; Biol. Process; Cell. Component)YBL047C EDE1 Unknown; Endocytosis; Actin cortical patch, bud neck, bud tipYBR069C TAT1 Amino acid transporter; Amino acid transport; Plasma membraneYBR097W VPS15 Ser/Thr kinase; Phospohorylation, retention in Golgi, vacuole transport; Golgi membrane, mitochondrionYBR112C CYC8 Transcription repressor/coactivator; Chromotin remodeling; NucleusYBR235W (none) Ion transporter; Unknown; UnknownYCR016W (none) Unknown; Unknown; NucleolusYDR356W SPC110 Cytoskeleton constituent; Microtubule nucleation; Spindle poleYDR432W NPL3 mRNA binding; mRNA export from nucleus; Cytoplasm, nucleusYFR031C SMC2 DNA binding, ATPase; Mitosis; Mitochondrion, nuclear condensin complex YGL172W NUP49 Component of nuclear pore complex; Ribosome transport; Nuclear poreYGL124C MON1 Unknown; Autophagy, vesicle docking; Vacuolar membraneYGL028C SCW11 Glucan 1,3-beta-glucosidase; Cytokinesis; Cell wallYGR014W MSB2 Osmosensor; Establish cell polarity, response to osmotic stress; plasma membrane, site of polarized growthYGR130C (none) Unknown; Unknown; CytoplasmYHL009C YAP3 Basic leucine zipper (bZIP) transcription factor; Regulation of transcription; NucleusYIL112W HOS4 NAD-dependent histone deacetylase; Negative regulation of meiosis; Histone deacetylase complexYIL038C NOT3 3’-5’-exoribonuclease; Poly(A) shortening, regulation of transcription; CCR4-NOT core complex, cytoplasmYJR134C SGM1 Unknown; Unknown; Golgi apparatusYKR030W GMH1 Unknown; Transport; Integral to Golgi membraneYLL021W SPA2 Cytoskeletal regulatory protein binding; Actin filament organization; Bud neck, polarisomeYLR045C STU2 Microtubule binding; Mitotic spindle organization and biogenesis; Kinetochore, spindle, cell cortexYLR273C PIG1 Protein phosphatase type-1 regulator; Glycogen biosynthesis; Protein phosphatase type-1 complexYLR314C CDC3 Phosphatidylinositol binding, component of cytoskeleton; Cell wall organization and biogenesis, cytokinesis;
Septin ring, spore wallYML104C MDM1 Structural constituent of cytoskeleton; Mitochondrion biogenesis, nuclear migration; Cytoplasm YMR124W (none) Unknown; Unknown; CytoplasmYMR213W CEF1 RNA splicing factor; Nuclear mRNA splicing; Spliceosome complexYNL091W NST1 Unknown; Salt stress; CytoplasmYNL027W CRZ1 Transcription factor; Calcium-mediated signaling; Cytoplasm and nucleusYOR171C LCB4 D-erythro-sphingosine kinase; Calcium-mediated signaling, spingolipid metabolism; Golgi, ERYPR018W RLF2 Transcription regulator; Nucleosome assembly; Chromatin assembly complexYPR104C FHL1 Transcription factor; rRNA processing; NucleolusaBased on the Saccharomyces Genome Database (SGD) queries.
19
Table 5. Sequences and characteristics of long, conserved low-complexity sequences in S. cerevisiaeORF Name Gene
NameIsland Length
Island Sequence PredictedDisordera
Domain/Motif
YBL047C EDE1 47 aesklnelttdlqesqtknaelkeqitnlnsmtaslqsqlnekqqqv 100% t-SNAREYBR069C TAT1 54 vmislgtgigtgllvgngqvlgtagpaglvlgygiasimlyciiqaagelglc
y0% amino acid
permeaseYBR097W VPS15 52 rvsliqtisgisillgtvtleqyilplliqtitdseelvvisvlqslkslfk 0% HEAT repeatYBR112C CYC8 64 npggeqtimeqpaqqqqqqqqqqqqqqqqaavpqqpldpltqstaetwlsias
laetlgdgdra0% poly (Q)
YBR235W (none) 68 alnvlsilmflrfgfilgqlgiictigllllsytinllttlsisaistngtvrgggayymisrslgpe
0% amino acid permease
YCR016W (none) 70 lnitthlstgnltkkekkriingesksstkkgkrvskpgtkkkeklskdeknskknkilkdqlrylieff
94%
YDR356W SPC110 46 rekeelnensnnirimedkmtrikknylseitslqeenrrleerli 100%YDR432W NPL3 158 rlnniefrgsvitverddnpppirrsnrggfrgrggfrggfrggfrggfsrgg
fggprggfggprggyggysrggyggysrggyggsrggydsprggydsprggysrggyggprndygpprgsyggsrggydgprgdygpprdayrtrdaprersptr
93% RNA binding;GGX repeats
YFR031C SMC2 58 drrekaertmskketklqenrtllteeiepkleklrnekrmflefqstqtdlekteri
76%
YGL172W NUP49 47 llksesatsqylkqdlkkissfkslidedlldtqtfsvllqqlltpg 40%YGL124C MON1 51 sergessnellnqldflysyilsslserqllrlfskrenfdlrnylestdf 0%YGL028C SCW11 48 evvtrvhtasttnvvtdfystttevviaptveflisdsvtftttlipq 100%YGR014W MSB2 104 tdgmgtaksmaamvdssipltgllhdsnsnsggssdgssssnsnsgssgsgsn
snsgvssssgnsyqdagtleyssksnsnvstsskskkkiiglvigvvvggc91% poly (S)
YGR130C (none) 131 ikqenanektqlsaitkrlederraheeqlkleaeerkrkeenllekqrqeleeqahqaqldheqqitqvkqtyndqltelqdklateekeleavkrertrlqaekaieeqtrqknadealkqeilsrqhk
100%
YHL009C YAP3 72 dskakkkaqnraaqkafrerkearmkelqdkllesernrqsllkeieelrkanteinaenrlllrsgnenfs
90% bZIP domain
YIL112W HOS4 117 eklksisplsmephspkkaksveiskiheetaaerearlkeeeeyrkkrlekkrkkeqellqklaedekkrieeqekqkvlemerlekatlekarkmerekemeeisyrravrdlyp
71%
YIL038C NOT3 46 qkdklesdlkrevkklqrlreqikswqsspdikdkdslldyrrsve 67%
20
Table 5. (Continued)ORF Name Gene
NameIsland Length
Island Sequence PredictedDisordera
Domain/Motif
YJR134C SGM1 109 lvnklstelkrlegelsaskelydnllkektkandeilrlleendkfnevnkqkddllkrveqmqskletslqllgekteqveelendvsdlkemmhqqvqqmvemqgk
100% t-SNARE
YKR030W GMH1 90 sfliillclyfiqflllpiinlqnwisllignslycfaighyfiltfygynqlpflknlnfillptlglsiiylislfgidlskklsfyn
0%
YLL021W SPA2 102 dkvkeltdlnsdlhlqiedlnaklasltsekekekkeekeekekeknlkinytidesfqkellslnsqigelsienenlkqkisefelhqkkndnhndlkit
100%
76 dekhysddddssyqfvpmkheeqeqeqnrseeeesedddeeeedsdfdvdtfdienpdntlselllylehqtmdvi
17%
YLR045C STU2 51 erqsllekmnntenykiemikenemlreqlkeaqsklnekniqlrskeidv 100 % tRNA bindingYLR273C 68 hgkklkpslklaktistssfvssttsnsfspledstsassstsssssgksvrf
aahlytvkkfntkla75%
YLR314C CDC3 78 skqleektlheaklakleiemktvfqqkvsekekklqksetelfarhkemkekltkqlkaledkkkqlelsinsaspn
100%
YML104C MDM1 51 qiekelellrhlilkadltnnqmqlkilkksqrtllkelemkellkqqymv 100% YMR124W (none) qlnlitenkelmneltlvstelaesikreteleerirlyetnnsap
YMR213W CEF1 49 ekemlaeararllntqgkkatrkirermleeskriaelqkrrelkqagi 100%YNL091W NST1 273 phhhyhststhsedelseeeyisdielphdphkhfhrdddildgdedepeeed
enegddeedtydsgldetdrleegrkliqiaitkllqsrimasyhekqadnnrlkllqeleeekrkkrekeekkqkkrekekekkrlqqlakeeekrkreeekerlkkeleeremrrreaqrkkveeakrkkdeerkrrleeqqrreemqekqrkqkeelkrkreeekkrireqkrleqeklqkekeeeerqrliaedalrkqklneeqtsanilsakpf
100%
YNL027W CRZ1 75 lsdidrsfediingrklklkksrrrssqtsnnsftsrrssrsrsispdekaksisanrekllemadllpssendn
69%
YOR171C LCB4 59 mfnkhgqlrsgdslsllsclsclddgtlssdggsfdeddslellplnttipfnrilnak
49%
YPR018W RLF2 77 dpfstkgtgfnydydsdvewvneeeegevdnlesgeeeeeeeddedvpsegefdgfldseensdldglpcakrkfvg
64% poly(E)
YPR104C FHL1 46 npvtddngnlklelpdnldnadfskllefdakndealfnsnellsh 0%50 knpqhlnlilaaavnaatakvtkgevkqlvnpettaaaalaakaqhskpi 100% poly(A)
aProportion of residues predicted to be structurally disordered using DISORDER2 (Ward et al. 2004) at 5% error rate.
21
Figure 1. Identification of low-complexity islands(A)
(B)S.cer MRLSNLIASASLLSAATLAAPANHEHKDKRAVVTTTVQKQTTIIVNGAASTPVAALEENAS.par ...............TA.......G.......I................P.Q........
S.cer VVNSAPAAATSTTSSAASVATAAASSSENNSQVSAAASPASSSAATSTQSSSSSQASSSSS.par ..............A..P...T...T.DVK...............A..L...........
S.cer SSG-EDVSSFASGVRGITYTPYESSGACKSASEVASDLAQLTDFPVIRLYGTDCNQVENVS.par ..SS........................................................
S.cer FKAKASNQKVFLGIYYVDQIQDGVNTIKSAVESYGSWDDVTTVSIGNELVNGNQATPSQVS.par .............V..........D...................................
S.cer GQYIDSGRSALKAAGYTGPVVSVDTFIAVINNPELCDYSDYMAVNAHAYFDKNTVAQDSGS.par ............................................................
S.cer KWLLEQIQRVWTACDGKKNVVITESGWPSKGETYGVAVPSKENQKDAVSAITSSCGADTFS.par ....D.......................................................
S.cer LFTAFNDYWKADGAYGVEKYWGILSNES.par ...........................
22
Figure 2. Protein sequence divergence between orthologous ORF pairs
S. cerevisiae
S. bayanus
S. paradoxus
11.9%4.2%
3.6%
(A)
(B)
23
Figure 3. Identification of conserved low-complexity segments(A)
YAP3p
24
(B)Scer MTPSNMDDNTSGFMKFINPQCQEEDCCIRNSLFQEDSKCIKQQPDLLSEQTAPFPILEDQCPALNLDRSNNDLLLQNNISFPKGSDLQAIQLSpar .P..DV.N..N..I...........F.PE.....N.NE.....R.I.N.........N....T.D.SG..D..M...E.PLSESTNF.TV..Sbay .DT.PS.A.--..IT..DS.Q.GQNH.NES.I..DNNQ.AEE.QN..ND..SS....SG...V...NE.G...MFHSG.PL..ANT...S..
Scer TPISGDYSTYVMADNNNNDNDSYSNTNYFSKNNGISPSSRSPSVAHNENVPDDSKAKKKAQNRAAQKAFRERKEARMKELQDKLLESERNRQSLLKEIEELSpar ..S...C.SFA.....K....N.TD..C...KKD......T...P...DA.E.................................................Sbay ..S...CASF-.DE.K..YSNNNKDIS...EKKDS.SG..T.P.YS-DDLSG........................L...E.......K............
Scer RKANTEINAENRLLLRSGNENFS---KDIEDDTNYKYSFPTKDEFFTSMVLESKLNHKGKYSLKDNE-IMKRNTQYTDEAGRHVLTVPATWEYLYKLSEERSpar ..V.................K.P...R.LI...DH.................G...N..M.......V...Q..........Q................D.Sbay ................N.S.KATKSRR.LI..S.S..........S...I..G..DD.SA..P....PV..H.A.....S..................NN.
Scer DFDVTYVMSKLQGQECCHTHGPAYPRSLIDFLVEEATLNESpar ..........................N.....A...A...Sbay .........E.....R..S.......T...S.....VSK.
Basic motif for DNA binding Leucine Zipper