comparative investigation of pollution accumulation and
TRANSCRIPT

Engineering, Technology & Applied Science Research Vol. 5, No. 2, 2015, 764-774 764
www.etasr.com Dimitropoulou et al.: Comparative Investigation of Pollution Accumulation and Natural Cleaning…
Comparative Investigation of Pollution Accumulation and Natural Cleaning for Different HV Insulators
M. Dimitropoulou ECE Dpt, Democritus University of Thrace,
Xanthi, Greece marianadimitr@
gmail.com
D. Pylarinos Islands Network Operation Dpt,
HEDNO S.A., Greece dpylarinos@ yahoo.com
K. Siderakis EE Dpt, TEI of Crete,
Iraklion, Greece ksiderakis@
staff.teicrete.gr
E. Thalassinakis Islands Network Operation Dpt,
HEDNO S.A., Greece E.Thalassinakis@
deddie.gr
M. Danikas ECE Dpt, Democritus University of Thrace,
Xanthi, Greece mdanikas@ ee.duth.gr
Abstract—High Voltage insulators are scattered throughout any HV network and a single insulator fault may cause an excessive outage. Reliability is a key issue for electric power systems and fault-free performance of insulators greatly reflects on the reliability of the system. Environmental influence is rather important for the optimum selection of outdoor insulators and, therefore, field measurements provide valuable information. Utilities perform such measurements in order to decide upon the location/route of new HV installations (substations, lines etc) and also to optimize the selection, maintenance and replacement of already installed insulators. A rather interesting case in Greek territory is the island of Crete, due to the coastal development of the network and the local weather conditions. The Greek utility has employed a variety of remedies to cope with the pollution problem. Following the positive feedback after the installation on certain tower in the past, a large project to replace all ceramic insulators with new polymer ones of hydrophobic surface is now in progress. Polymer coatings have also been extensively applied on substations and also on certain areas/towers of the transmission network in the past. In order to investigate the pollution accumulation and the impact of natural washing on different insulator types, a series of periodical ESDD and NSDD pollution measurements were conducted in HEDNO’s TALOS High Voltage Test Station for a 3-months period. Multiple measurements were performed on each insulator every month in order to collect additional data. Five different insulators were selected based on the types historically used in the Cretan Network. Along with the standard glass disc profile, two strings of glass fog profile (the one coated with RTV) and two long-rod composite insulators of different shed profile and material were used. Results are presented and discussed in this paper.
Keywords-Outdoor insulators; pollution; field measurements; ESDD; NSDD
I. INTRODUCTION
The performance of outdoor insulators used in electric power transmission and distribution systems is a key reliability factor. Insulators should be able to withstand normal operating voltage, overvoltages up to a certain point and also mechanical stress. These factors however can easily be simulated in the lab. Therefore, the most complex issue is probably the pollution phenomenon [1-3]. Pollutants are deposited on the insulators’
surface and, usually under the presence of a wetting agent, form a conductive film on the surface allowing the flow of leakage current [1-5]. This may result to dry bands formation and discharges, which under favorable conditions eventually lead to a flashover [1-6]. Besides the obvious factor of the pollution quantity and quality present in the area, the interest is focused on the actual amount of pollutants that remains on the surface during long-term service condition. This is greatly related to the insulator design and certain profiles (e.g. open, fog, bell etc) have been proposed to offer superior performance under certain conditions (i.e. in certain areas) [1-3]. Another important factor is the interaction of the insulator’s surface with pollutants and wetting. Hydrophobic surfaces suppress the pollution phenomenon by retaining water in the form of droplets and thus not allowing the formation of a conductive film. High Temperature Vulcanized Silicone Rubber (HTV SIR) is commonly used for the fabrication of such insulators [7] whereas Room Temperature Vulcanized Silicone Rubber (RTV SIR) is mostly used to fabricate coatings to be placed on traditional ceramic insulators with hydrophilic surfaces such as glass and porcelain [8]. The selection of the optimum insulator profile and material is a complex issue for power utilities as a variety of conditions should be considered [2-3].
The power network of the Mediterranean island of Crete provides an exceptional case study as the majority of installations is coastal and subjected to severe pollution due to the accumulation of sea salt [9]. Strong winds and a prolonged dry season add significantly to the problem [9]. The Greek utility (initially the Public Power Corporation (PPC) and now the Hellenic Electricity Distribution Network Operator (HEDNO)) have employed several remedies to cope with the problem over the years [4, 8-9]. RTV SIR coatings have been extensively used in substations [9] whereas, as of 2014, HTV SIR have replaced the traditional glass and porcelain insulators in most transmission lines [10]. Special cases are Teflon insulators that had also been installed in previous times [11] and some ceramic RTV SIR coated insulators installed in certain transmission towers in order to combine the characteristics of the two [10, 12]. In order to gain an insight on the pollution accumulation on different insulators, a series of measurements were conducted in 2014. Results are
Engineering, Technology & Applied Science Research Vol. 5, No. 2, 2015, 764-774 765
www.etasr.com Dimitropoulou et al.: Comparative Investigation of Pollution Accumulation and Natural Cleaning…
presented and further discussed in this paper. A weather report is also provided in order to gain an insight in pollution accumulation and natural cleaning.
II. TEST SITE AND INSULATORS
A. TALOS High Voltage Test Station
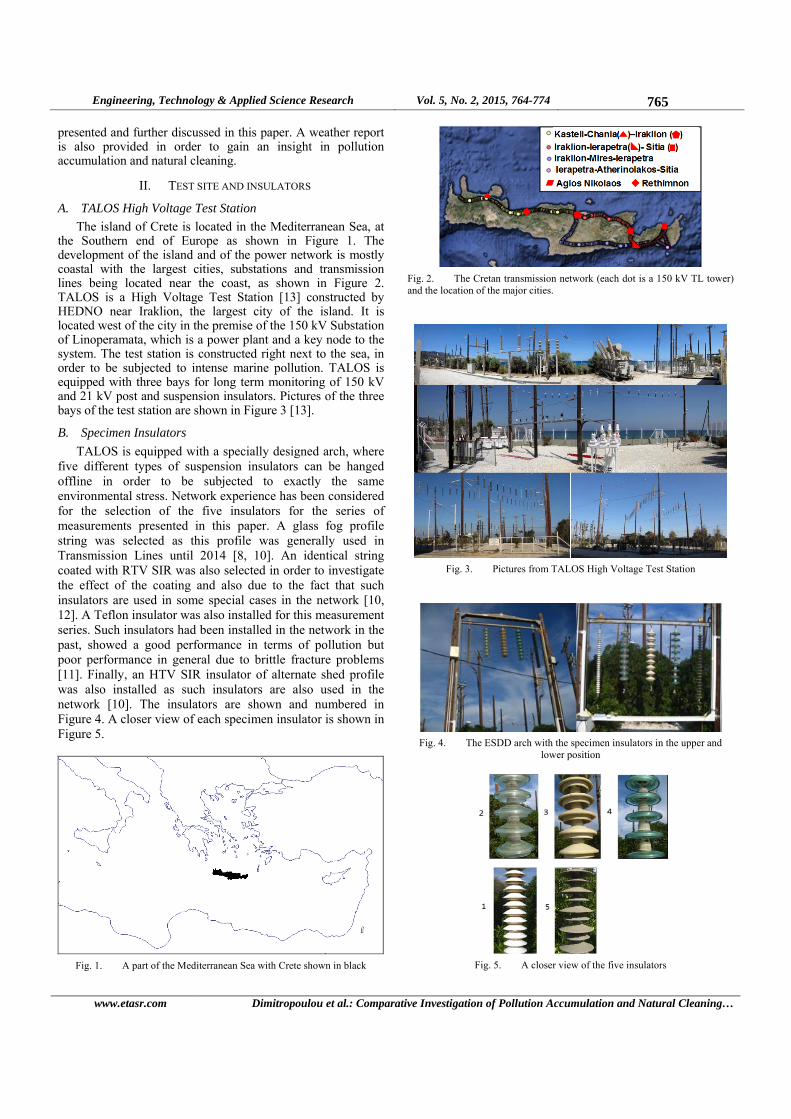
The island of Crete is located in the Mediterranean Sea, at the Southern end of Europe as shown in Figure 1. The development of the island and of the power network is mostly coastal with the largest cities, substations and transmission lines being located near the coast, as shown in Figure 2. TALOS is a High Voltage Test Station [13] constructed by HEDNO near Iraklion, the largest city of the island. It is located west of the city in the premise of the 150 kV Substation of Linoperamata, which is a power plant and a key node to the system. The test station is constructed right next to the sea, in order to be subjected to intense marine pollution. TALOS is equipped with three bays for long term monitoring of 150 kV and 21 kV post and suspension insulators. Pictures of the three bays of the test station are shown in Figure 3 [13].
B. Specimen Insulators
TALOS is equipped with a specially designed arch, where five different types of suspension insulators can be hanged offline in order to be subjected to exactly the same environmental stress. Network experience has been considered for the selection of the five insulators for the series of measurements presented in this paper. A glass fog profile string was selected as this profile was generally used in Transmission Lines until 2014 [8, 10]. An identical string coated with RTV SIR was also selected in order to investigate the effect of the coating and also due to the fact that such insulators are used in some special cases in the network [10, 12]. A Teflon insulator was also installed for this measurement series. Such insulators had been installed in the network in the past, showed a good performance in terms of pollution but poor performance in general due to brittle fracture problems [11]. Finally, an HTV SIR insulator of alternate shed profile was also installed as such insulators are also used in the network [10]. The insulators are shown and numbered in Figure 4. A closer view of each specimen insulator is shown in Figure 5.
Fig. 1. A part of the Mediterranean Sea with Crete shown in black
Fig. 2. The Cretan transmission network (each dot is a 150 kV TL tower) and the location of the major cities.
Fig. 3. Pictures from TALOS High Voltage Test Station
Fig. 4. The ESDD arch with the specimen insulators in the upper and
lower position
Fig. 5. A closer view of the five insulators
Engineering, Technology & Applied Science Research Vol. 5, No. 2, 2015, 764-774 766
www.etasr.com Dimitropoulou et al.: Comparative Investigation of Pollution Accumulation and Natural Cleaning…
III. EXPERIMENTAL METHODS
A. ESDD, NSDD measurements
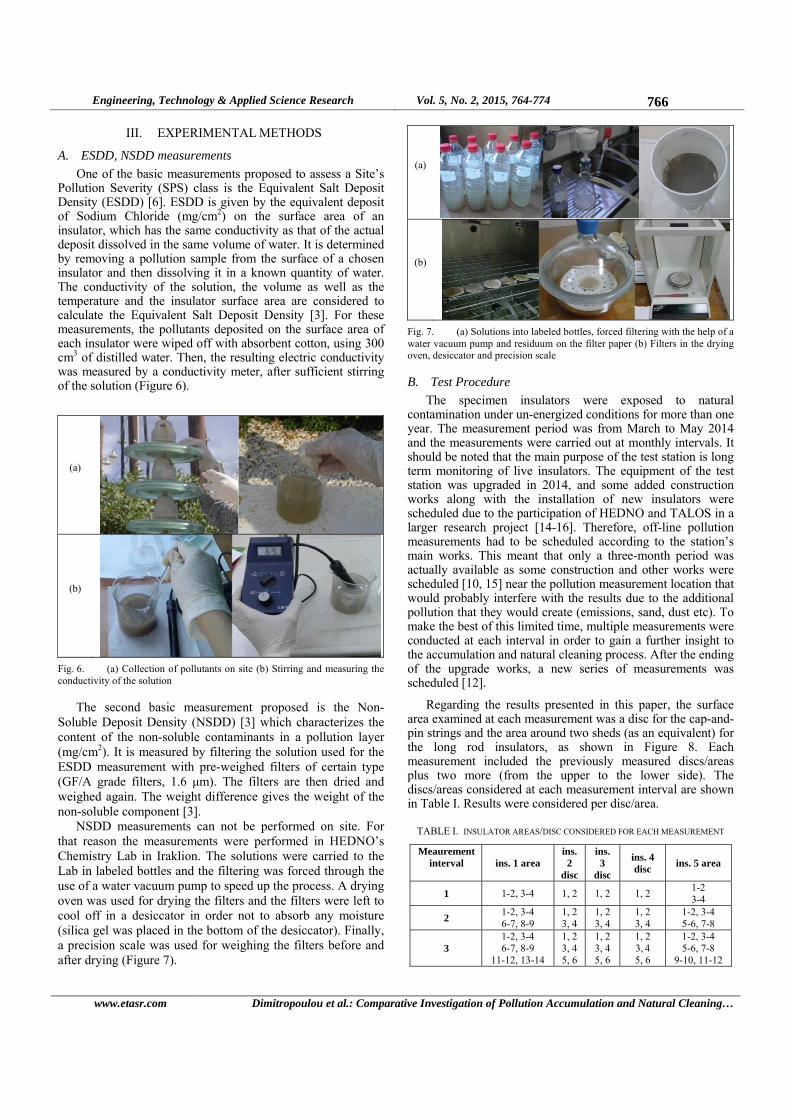
One of the basic measurements proposed to assess a Site’s Pollution Severity (SPS) class is the Equivalent Salt Deposit Density (ESDD) [6]. ESDD is given by the equivalent deposit of Sodium Chloride (mg/cm2) on the surface area of an insulator, which has the same conductivity as that of the actual deposit dissolved in the same volume of water. It is determined by removing a pollution sample from the surface of a chosen insulator and then dissolving it in a known quantity of water. The conductivity of the solution, the volume as well as the temperature and the insulator surface area are considered to calculate the Equivalent Salt Deposit Density [3]. For these measurements, the pollutants deposited on the surface area of each insulator were wiped off with absorbent cotton, using 300 cm3 of distilled water. Then, the resulting electric conductivity was measured by a conductivity meter, after sufficient stirring of the solution (Figure 6).
(a)
(b)
Fig. 6. (a) Collection of pollutants on site (b) Stirring and measuring the conductivity of the solution
The second basic measurement proposed is the Non-Soluble Deposit Density (NSDD) [3] which characterizes the content of the non-soluble contaminants in a pollution layer (mg/cm2). It is measured by filtering the solution used for the ESDD measurement with pre-weighed filters of certain type (GF/A grade filters, 1.6 μm). The filters are then dried and weighed again. The weight difference gives the weight of the non-soluble component [3].
NSDD measurements can not be performed on site. For that reason the measurements were performed in HEDNO’s Chemistry Lab in Iraklion. The solutions were carried to the Lab in labeled bottles and the filtering was forced through the use of a water vacuum pump to speed up the process. A drying oven was used for drying the filters and the filters were left to cool off in a desiccator in order not to absorb any moisture (silica gel was placed in the bottom of the desiccator). Finally, a precision scale was used for weighing the filters before and after drying (Figure 7).
(a)
(b)
Fig. 7. (a) Solutions into labeled bottles, forced filtering with the help of a water vacuum pump and residuum on the filter paper (b) Filters in the drying oven, desiccator and precision scale
B. Test Procedure
The specimen insulators were exposed to natural contamination under un-energized conditions for more than one year. The measurement period was from March to May 2014 and the measurements were carried out at monthly intervals. It should be noted that the main purpose of the test station is long term monitoring of live insulators. The equipment of the test station was upgraded in 2014, and some added construction works along with the installation of new insulators were scheduled due to the participation of HEDNO and TALOS in a larger research project [14-16]. Therefore, off-line pollution measurements had to be scheduled according to the station’s main works. This meant that only a three-month period was actually available as some construction and other works were scheduled [10, 15] near the pollution measurement location that would probably interfere with the results due to the additional pollution that they would create (emissions, sand, dust etc). To make the best of this limited time, multiple measurements were conducted at each interval in order to gain a further insight to the accumulation and natural cleaning process. After the ending of the upgrade works, a new series of measurements was scheduled [12].
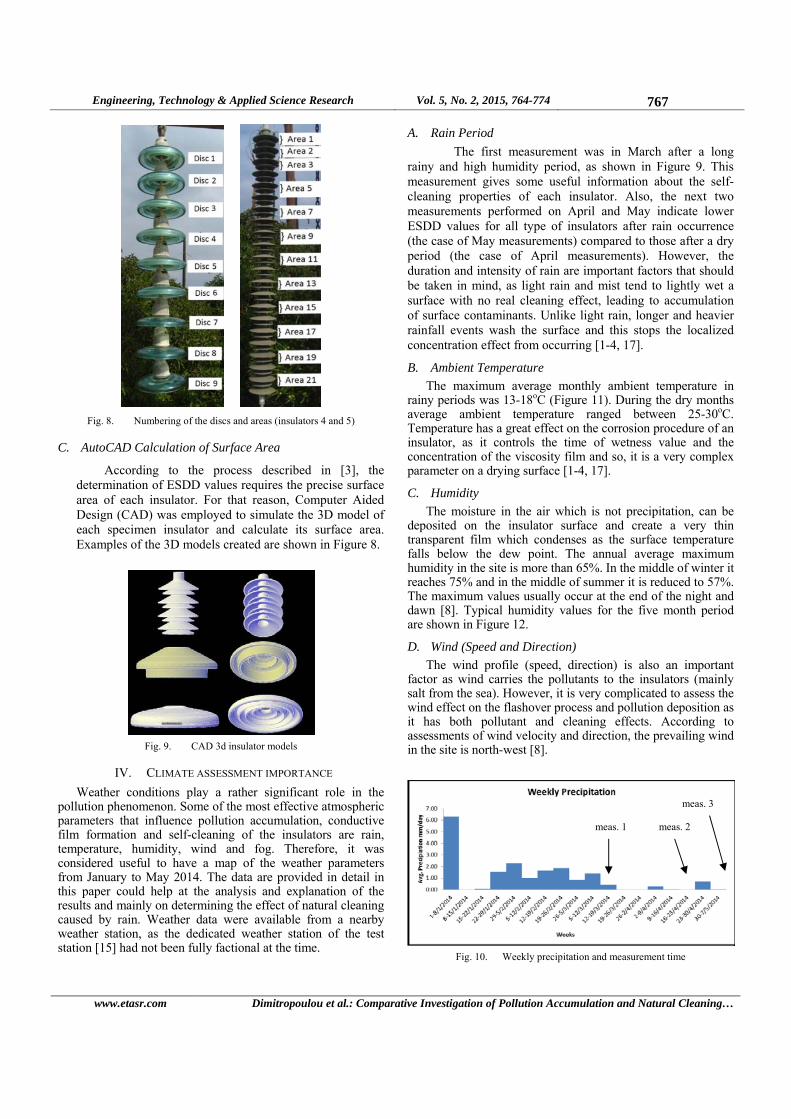
Regarding the results presented in this paper, the surface area examined at each measurement was a disc for the cap-and-pin strings and the area around two sheds (as an equivalent) for the long rod insulators, as shown in Figure 8. Each measurement included the previously measured discs/areas plus two more (from the upper to the lower side). The discs/areas considered at each measurement interval are shown in Table I. Results were considered per disc/area.
TABLE I. INSULATOR AREAS/DISC CONSIDERED FOR EACH MEASUREMENT
Meaurement interval ins. 1 area
ins. 2
disc
ins. 3
disc
ins. 4 disc
ins. 5 area
1 1-2, 3-4 1, 2 1, 2 1, 2 1-2 3-4
2 1-2, 3-4 6-7, 8-9
1, 2 3, 4
1, 2 3, 4
1, 2 3, 4
1-2, 3-4 5-6, 7-8
3 1-2, 3-4 6-7, 8-9
11-12, 13-14
1, 2 3, 4 5, 6
1, 2 3, 4 5, 6
1, 2 3, 4 5, 6
1-2, 3-4 5-6, 7-8
9-10, 11-12
Engineering, Technology & Applied Science Research Vol. 5, No. 2, 2015, 764-774 767
www.etasr.com Dimitropoulou et al.: Comparative Investigation of Pollution Accumulation and Natural Cleaning…
Fig. 8. Numbering of the discs and areas (insulators 4 and 5)
C. AutoCAD Calculation of Surface Area
According to the process described in [3], the determination of ESDD values requires the precise surface area of each insulator. For that reason, Computer Aided Design (CAD) was employed to simulate the 3D model of each specimen insulator and calculate its surface area. Examples of the 3D models created are shown in Figure 8.
Fig. 9. CAD 3d insulator models
IV. CLIMATE ASSESSMENT IMPORTANCE
Weather conditions play a rather significant role in the pollution phenomenon. Some of the most effective atmospheric parameters that influence pollution accumulation, conductive film formation and self-cleaning of the insulators are rain, temperature, humidity, wind and fog. Therefore, it was considered useful to have a map of the weather parameters from January to May 2014. The data are provided in detail in this paper could help at the analysis and explanation of the results and mainly on determining the effect of natural cleaning caused by rain. Weather data were available from a nearby weather station, as the dedicated weather station of the test station [15] had not been fully factional at the time.
A. Rain Period
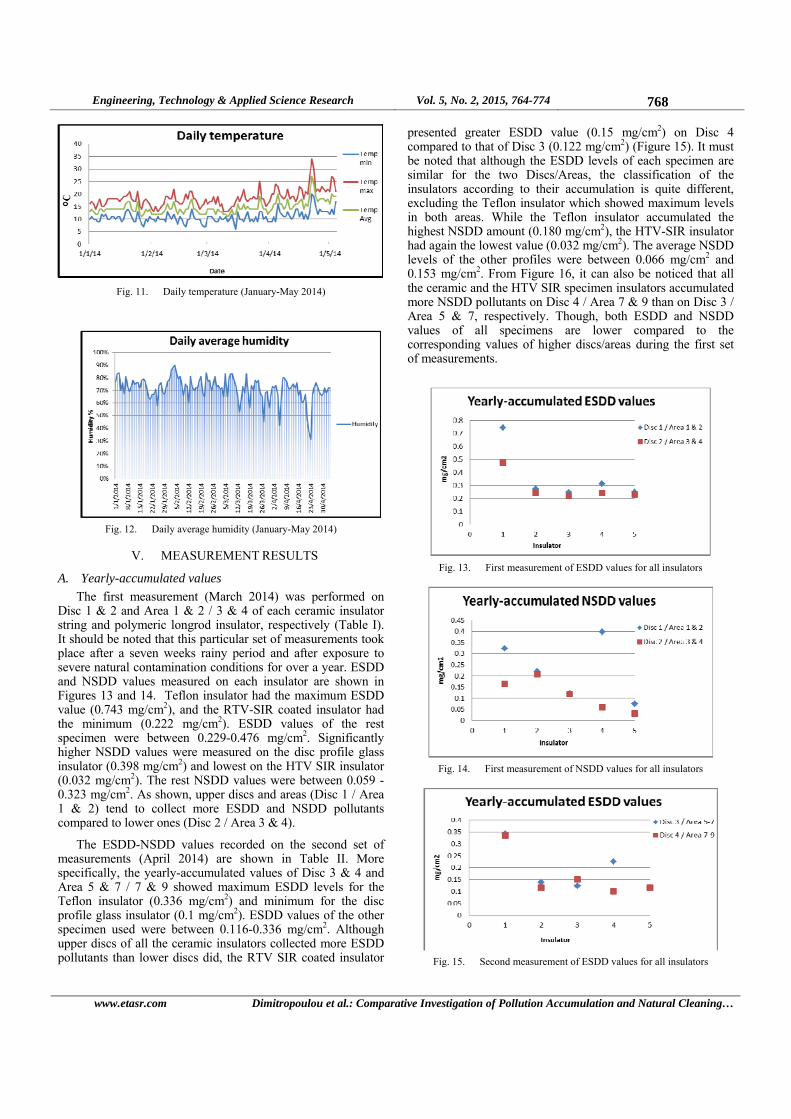
The first measurement was in March after a long rainy and high humidity period, as shown in Figure 9. This measurement gives some useful information about the self-cleaning properties of each insulator. Also, the next two measurements performed on April and May indicate lower ESDD values for all type of insulators after rain occurrence (the case of May measurements) compared to those after a dry period (the case of April measurements). However, the duration and intensity of rain are important factors that should be taken in mind, as light rain and mist tend to lightly wet a surface with no real cleaning effect, leading to accumulation of surface contaminants. Unlike light rain, longer and heavier rainfall events wash the surface and this stops the localized concentration effect from occurring [1-4, 17].
B. Ambient Temperature
The maximum average monthly ambient temperature in rainy periods was 13-18oC (Figure 11). During the dry months average ambient temperature ranged between 25-30oC. Temperature has a great effect on the corrosion procedure of an insulator, as it controls the time of wetness value and the concentration of the viscosity film and so, it is a very complex parameter on a drying surface [1-4, 17].
C. Humidity
The moisture in the air which is not precipitation, can be deposited on the insulator surface and create a very thin transparent film which condenses as the surface temperature falls below the dew point. The annual average maximum humidity in the site is more than 65%. In the middle of winter it reaches 75% and in the middle of summer it is reduced to 57%. The maximum values usually occur at the end of the night and dawn [8]. Typical humidity values for the five month period are shown in Figure 12.
D. Wind (Speed and Direction)
The wind profile (speed, direction) is also an important factor as wind carries the pollutants to the insulators (mainly salt from the sea). However, it is very complicated to assess the wind effect on the flashover process and pollution deposition as it has both pollutant and cleaning effects. According to assessments of wind velocity and direction, the prevailing wind in the site is north-west [8].
Fig. 10. Weekly precipitation and measurement time
meas. 1 meas. 2
meas. 3
Engineering, Technology & Applied Science Research Vol. 5, No. 2, 2015, 764-774 768
www.etasr.com Dimitropoulou et al.: Comparative Investigation of Pollution Accumulation and Natural Cleaning…
Fig. 11. Daily temperature (January-May 2014)
Fig. 12. Daily average humidity (January-May 2014)
V. MEASUREMENT RESULTS
A. Yearly-accumulated values
The first measurement (March 2014) was performed on Disc 1 & 2 and Area 1 & 2 / 3 & 4 of each ceramic insulator string and polymeric longrod insulator, respectively (Table I). It should be noted that this particular set of measurements took place after a seven weeks rainy period and after exposure to severe natural contamination conditions for over a year. ESDD and NSDD values measured on each insulator are shown in Figures 13 and 14. Teflon insulator had the maximum ESDD value (0.743 mg/cm2), and the RTV-SIR coated insulator had the minimum (0.222 mg/cm2). ESDD values of the rest specimen were between 0.229-0.476 mg/cm2. Significantly higher NSDD values were measured on the disc profile glass insulator (0.398 mg/cm2) and lowest on the HTV SIR insulator (0.032 mg/cm2). The rest NSDD values were between 0.059 -0.323 mg/cm2. As shown, upper discs and areas (Disc 1 / Area 1 & 2) tend to collect more ESDD and NSDD pollutants compared to lower ones (Disc 2 / Area 3 & 4).
The ESDD-NSDD values recorded on the second set of measurements (April 2014) are shown in Table II. More specifically, the yearly-accumulated values of Disc 3 & 4 and Area 5 & 7 / 7 & 9 showed maximum ESDD levels for the Teflon insulator (0.336 mg/cm2) and minimum for the disc profile glass insulator (0.1 mg/cm2). ESDD values of the other specimen used were between 0.116-0.336 mg/cm2. Although upper discs of all the ceramic insulators collected more ESDD pollutants than lower discs did, the RTV SIR coated insulator
presented greater ESDD value (0.15 mg/cm2) on Disc 4 compared to that of Disc 3 (0.122 mg/cm2) (Figure 15). It must be noted that although the ESDD levels of each specimen are similar for the two Discs/Areas, the classification of the insulators according to their accumulation is quite different, excluding the Teflon insulator which showed maximum levels in both areas. While the Teflon insulator accumulated the highest NSDD amount (0.180 mg/cm2), the HTV-SIR insulator had again the lowest value (0.032 mg/cm2). The average NSDD levels of the other profiles were between 0.066 mg/cm2 and 0.153 mg/cm2. From Figure 16, it can also be noticed that all the ceramic and the HTV SIR specimen insulators accumulated more NSDD pollutants on Disc 4 / Area 7 & 9 than on Disc 3 / Area 5 & 7, respectively. Though, both ESDD and NSDD values of all specimens are lower compared to the corresponding values of higher discs/areas during the first set of measurements.
Fig. 13. First measurement of ESDD values for all insulators
Fig. 14. First measurement of NSDD values for all insulators
Fig. 15. Second measurement of ESDD values for all insulators
Engineering, Technology & Applied Science Research Vol. 5, No. 2, 2015, 764-774 769
www.etasr.com Dimitropoulou et al.: Comparative Investigation of Pollution Accumulation and Natural Cleaning…
Fig. 16. Second measurement of NSDD values for all insulators
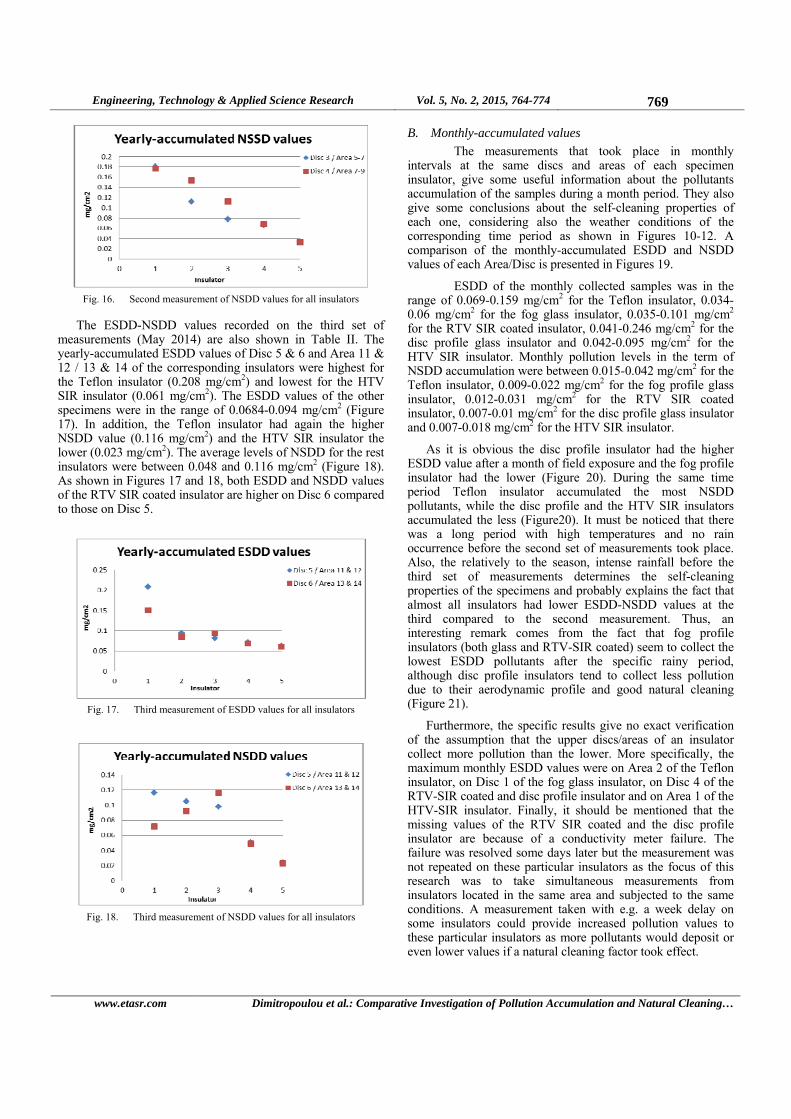
The ESDD-NSDD values recorded on the third set of measurements (May 2014) are also shown in Table II. The yearly-accumulated ESDD values of Disc 5 & 6 and Area 11 & 12 / 13 & 14 of the corresponding insulators were highest for the Teflon insulator (0.208 mg/cm2) and lowest for the HTV SIR insulator (0.061 mg/cm2). The ESDD values of the other specimens were in the range of 0.0684-0.094 mg/cm2 (Figure 17). In addition, the Teflon insulator had again the higher NSDD value (0.116 mg/cm2) and the HTV SIR insulator the lower (0.023 mg/cm2). The average levels of NSDD for the rest insulators were between 0.048 and 0.116 mg/cm2 (Figure 18). As shown in Figures 17 and 18, both ESDD and NSDD values of the RTV SIR coated insulator are higher on Disc 6 compared to those on Disc 5.
Fig. 17. Third measurement of ESDD values for all insulators
Fig. 18. Third measurement of NSDD values for all insulators
B. Monthly-accumulated values
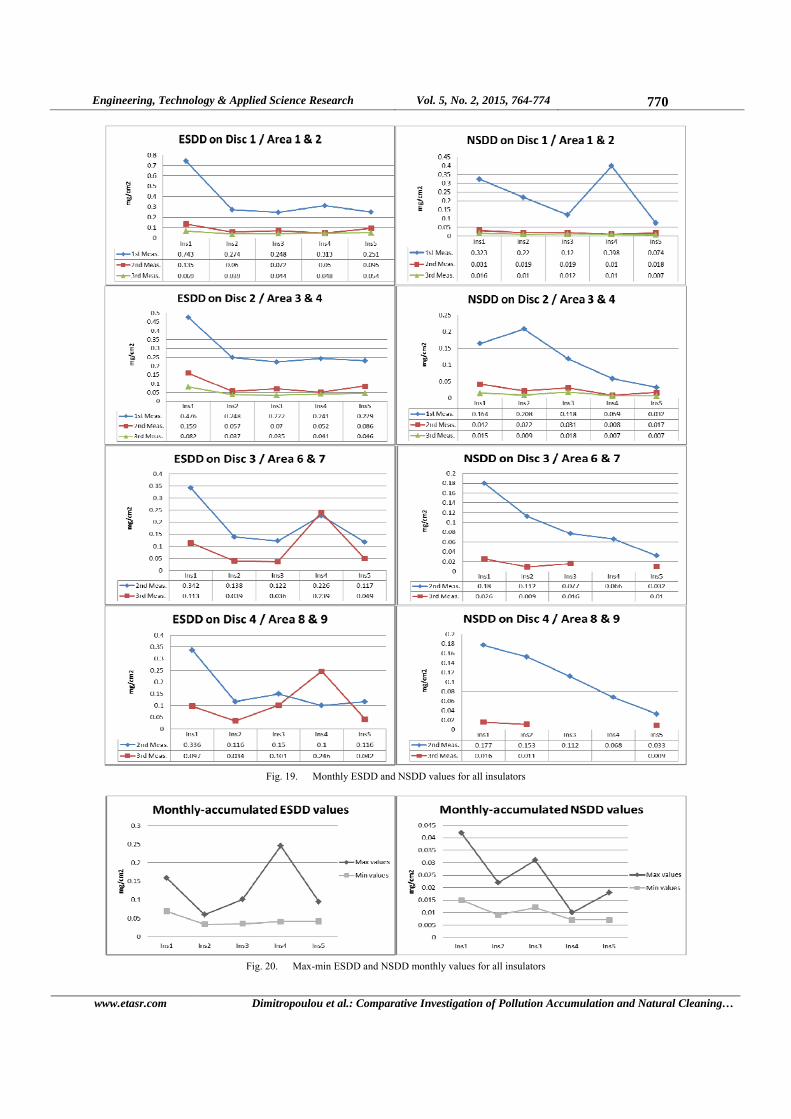
The measurements that took place in monthly intervals at the same discs and areas of each specimen insulator, give some useful information about the pollutants accumulation of the samples during a month period. They also give some conclusions about the self-cleaning properties of each one, considering also the weather conditions of the corresponding time period as shown in Figures 10-12. A comparison of the monthly-accumulated ESDD and NSDD values of each Area/Disc is presented in Figures 19.
ESDD of the monthly collected samples was in the range of 0.069-0.159 mg/cm2 for the Teflon insulator, 0.034-0.06 mg/cm2 for the fog glass insulator, 0.035-0.101 mg/cm2 for the RTV SIR coated insulator, 0.041-0.246 mg/cm2 for the disc profile glass insulator and 0.042-0.095 mg/cm2 for the HTV SIR insulator. Monthly pollution levels in the term of NSDD accumulation were between 0.015-0.042 mg/cm2 for the Teflon insulator, 0.009-0.022 mg/cm2 for the fog profile glass insulator, 0.012-0.031 mg/cm2 for the RTV SIR coated insulator, 0.007-0.01 mg/cm2 for the disc profile glass insulator and 0.007-0.018 mg/cm2 for the HTV SIR insulator.
As it is obvious the disc profile insulator had the higher ESDD value after a month of field exposure and the fog profile insulator had the lower (Figure 20). During the same time period Teflon insulator accumulated the most NSDD pollutants, while the disc profile and the HTV SIR insulators accumulated the less (Figure20). It must be noticed that there was a long period with high temperatures and no rain occurrence before the second set of measurements took place. Also, the relatively to the season, intense rainfall before the third set of measurements determines the self-cleaning properties of the specimens and probably explains the fact that almost all insulators had lower ESDD-NSDD values at the third compared to the second measurement. Thus, an interesting remark comes from the fact that fog profile insulators (both glass and RTV-SIR coated) seem to collect the lowest ESDD pollutants after the specific rainy period, although disc profile insulators tend to collect less pollution due to their aerodynamic profile and good natural cleaning (Figure 21).
Furthermore, the specific results give no exact verification of the assumption that the upper discs/areas of an insulator collect more pollution than the lower. More specifically, the maximum monthly ESDD values were on Area 2 of the Teflon insulator, on Disc 1 of the fog glass insulator, on Disc 4 of the RTV-SIR coated and disc profile insulator and on Area 1 of the HTV-SIR insulator. Finally, it should be mentioned that the missing values of the RTV SIR coated and the disc profile insulator are because of a conductivity meter failure. The failure was resolved some days later but the measurement was not repeated on these particular insulators as the focus of this research was to take simultaneous measurements from insulators located in the same area and subjected to the same conditions. A measurement taken with e.g. a week delay on some insulators could provide increased pollution values to these particular insulators as more pollutants would deposit or even lower values if a natural cleaning factor took effect.
Engineering, Technology & Applied Science Research Vol. 5, No. 2, 2015, 764-774 770
www.etasr.com Dimitropoulou et al.: Comparative Investigation of Pollution Accumulation and Natural Cleaning…
Fig. 19. Monthly ESDD and NSDD values for all insulators
Fig. 20. Max-min ESDD and NSDD monthly values for all insulators

Engineering, Technology & Applied Science Research Vol. 5, No. 2, 2015, 764-774 771
www.etasr.com Dimitropoulou et al.: Comparative Investigation of Pollution Accumulation and Natural Cleaning…
Fig. 21. ESDD and NSDD values of all the measurements (the red dashed lines indicate rain occurrence).
C. Maximum values
The maximum ESDD and NSDD values measured during the experimentation are presented in Figure 22. The values correspond to accumulated pollutants of same numbered discs/areas on each measurement. Teflon insulator seems to collect the highest amounts of ESDD deposition in all the measurement results, while the disc profile insulator seems to collect the second highest amounts. HTV-SIR insulator collected the lowest depositions before 2nd and 3rd measurement took place. As far as NSDD deposition is concerned, the classification of the specimen insulators based on their accumulation levels is almost the same. Teflon insulator collected also the highest amount of NSDD deposition, while HTV SIR insulator collected the lowest.
Fig. 22. Max ESDD and NSDD values for all insulators
The results of the specific experimentation may lead to the conclusion that the fog profile RTV SIR coated insulator collected less pollution than the uncoated one, in both terms of ESDD and NSDD. However, disc profile and HTV SIR
insulators collected the lowest ESDD and NSDD values, with exception of the unexpected high NSDD value of the open profile insulator during the 1st measurement. The comparative charts of Figure 23 give more information about each insulator’s behavior under natural contamination conditions.
VI. SITE POLLUTION SEVERITY ESTIMATION
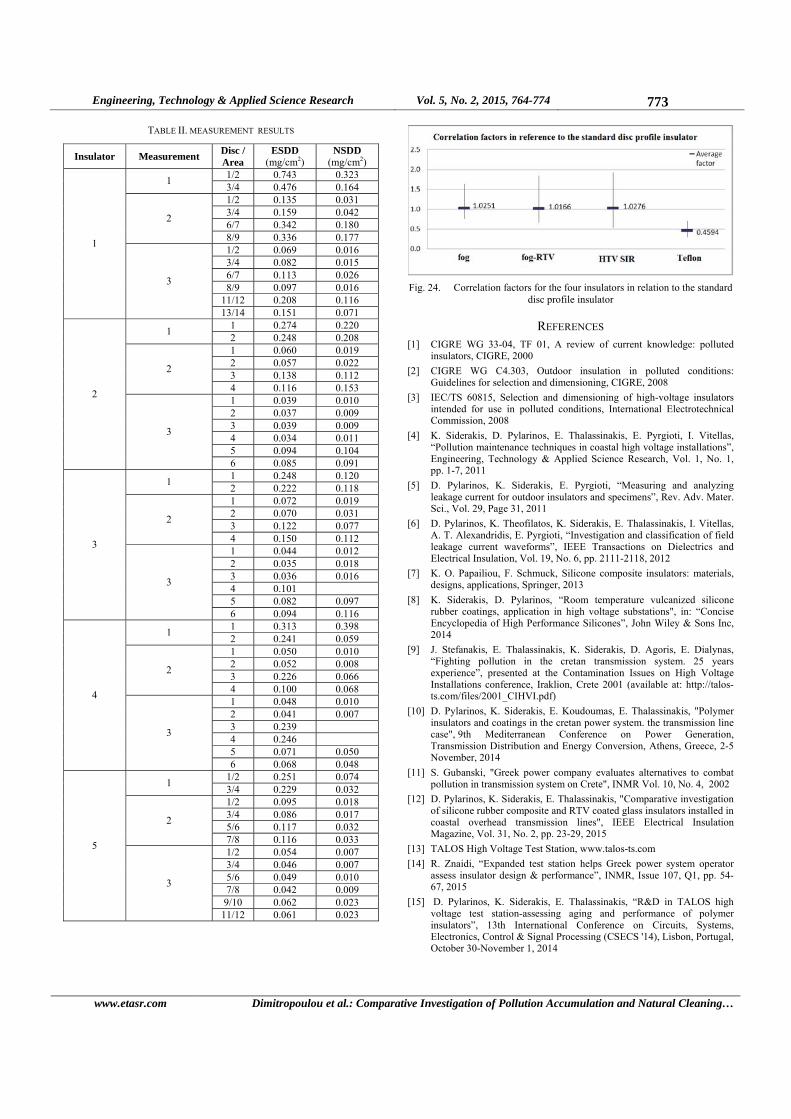
To evaluate the Site Pollution Severity (SPS), a correction factor was introduced to the measured data of all insulators, taking into account that the standards refer to typical Cap & Pin insulators [3]. Another reason was that previous pollution measurements had been conducted by HEDNO on various insulators and a correlation factor is needed in order to acquire a uniform pollution map [16]. For the determination of each correlation factor worst case scenario (that refers to maximum ESDD & NSDD values) was taken into account, considering the philosophy of the SPS classification, although the average correlation factor of each insulator was also calculated (Figure 24).
The selected factors are 1.1435 for the fog profile glass insulator, 1.2611 for the RTV SIR coated insulator, 1.2476 for the HTV SIR insulator and 0.4223 for the Teflon insulator. Finally, considering the maximum pollution (after the correction with the above factors) the site pollution severity of TALOS test station is considered to fall under ‘HEAVY’ class. It should be noted that the actual procedure [3] requires long term measurements (at least for one year) and that according to past experience and the island’s weather profile [8], maximum pollution is accumulated at the end of summer and before the first rains. This means that the actual SPS class of the site is probably even higher (i.e. VERY HEAVY), however this was not possible to define in detail due to the specific characteristics of this series of measurement. In any case however, the site should be considered as at least HEAVY and probably VERY HEAVY in terms of pollution class.
VII. CONCLUSIONS
Pollution is an important factor that influences the performance of outdoor high voltage insulators. The term refers to airborne pollutants that, under the influence of a wetting agent, may form a conductive film on the insulators’ surface that leads to the onset of electrical activity that may advance even to a full flashover. Several different remedies have been proposed in order to suppress the phenomenon. The most

Engineering, Technology & Applied Science Research Vol. 5, No. 2, 2015, 764-774 772
www.etasr.com Dimitropoulou et al.: Comparative Investigation of Pollution Accumulation and Natural Cleaning…
common is the use of specially designed profiles in case of ceramic insulators and the use of polymer materials to fabricate composite insulators. Another solution that gains a growing acceptance is the use of polymer coatings applied on ceramic insulators as a mean to combine the characteristics of the two. The actual pollution impact on different insulators is the result of various factors (weather conditions, surface material, insulators’ profile). In this paper, results from a series of measurement conducted on a high voltage test station in Iraklion, Crete are presented and discussed. Crete is a Greek Mediterranean island with an isolated power system that is subjected to severe pollution mainly due to sea influence. The
test station is located right next to the coast and near a power plant. Offline pollution measurements (ESDD and NSDD) were conducted on five different insulators for a three months period. The insulators were located in the same spot, hanged from a specially designed arch. Multiple measurements were conducted in each interval in order to acquire more data. Weather parameters were also considered in order to offer a further insight on the pollution accumulation and the natural cleaning process. Different behaviors are documented and a comparative analysis of the results is conducted. Finally, correlation factors are proposed in order to unify the pollution results measured on different insulators.
Fig. 23. Max ESDD and NSDD values comparison
Engineering, Technology & Applied Science Research Vol. 5, No. 2, 2015, 764-774 773
www.etasr.com Dimitropoulou et al.: Comparative Investigation of Pollution Accumulation and Natural Cleaning…
TABLE II. MEASUREMENT RESULTS
Insulator Measurement Disc / Area
ESDD (mg/cm2)
NSDD (mg/cm2)
1/2 0.743 0.323 1
3/4 0.476 0.164 1/2 0.135 0.031 3/4 0.159 0.042 6/7 0.342 0.180
2
8/9 0.336 0.177 1/2 0.069 0.016 3/4 0.082 0.015 6/7 0.113 0.026 8/9 0.097 0.016
11/12 0.208 0.116
1
3
13/14 0.151 0.071 1 0.274 0.220
1 2 0.248 0.208 1 0.060 0.019 2 0.057 0.022 3 0.138 0.112
2
4 0.116 0.153 1 0.039 0.010 2 0.037 0.009 3 0.039 0.009 4 0.034 0.011 5 0.094 0.104
2
3
6 0.085 0.091 1 0.248 0.120
1 2 0.222 0.118 1 0.072 0.019 2 0.070 0.031 3 0.122 0.077
2
4 0.150 0.112 1 0.044 0.012 2 0.035 0.018 3 0.036 0.016 4 0.101 5 0.082 0.097
3
3
6 0.094 0.116 1 0.313 0.398
1 2 0.241 0.059 1 0.050 0.010 2 0.052 0.008 3 0.226 0.066
2
4 0.100 0.068 1 0.048 0.010 2 0.041 0.007 3 0.239 4 0.246 5 0.071 0.050
4
3
6 0.068 0.048 1/2 0.251 0.074
1 3/4 0.229 0.032 1/2 0.095 0.018 3/4 0.086 0.017 5/6 0.117 0.032
2
7/8 0.116 0.033 1/2 0.054 0.007 3/4 0.046 0.007 5/6 0.049 0.010 7/8 0.042 0.009
9/10 0.062 0.023
5
3
11/12 0.061 0.023
Fig. 24. Correlation factors for the four insulators in relation to the standard
disc profile insulator
REFERENCES [1] CIGRE WG 33-04, TF 01, A review of current knowledge: polluted
insulators, CIGRE, 2000
[2] CIGRE WG C4.303, Outdoor insulation in polluted conditions: Guidelines for selection and dimensioning, CIGRE, 2008
[3] IEC/TS 60815, Selection and dimensioning of high-voltage insulators intended for use in polluted conditions, International Electrotechnical Commission, 2008
[4] K. Siderakis, D. Pylarinos, E. Thalassinakis, E. Pyrgioti, I. Vitellas, “Pollution maintenance techniques in coastal high voltage installations”, Engineering, Technology & Applied Science Research, Vol. 1, No. 1, pp. 1-7, 2011
[5] D. Pylarinos, K. Siderakis, E. Pyrgioti, “Measuring and analyzing leakage current for outdoor insulators and specimens”, Rev. Adv. Mater. Sci., Vol. 29, Page 31, 2011
[6] D. Pylarinos, K. Theofilatos, K. Siderakis, E. Thalassinakis, I. Vitellas, A. T. Alexandridis, E. Pyrgioti, “Investigation and classification of field leakage current waveforms”, IEEE Transactions on Dielectrics and Electrical Insulation, Vol. 19, No. 6, pp. 2111-2118, 2012
[7] K. O. Papailiou, F. Schmuck, Silicone composite insulators: materials, designs, applications, Springer, 2013
[8] K. Siderakis, D. Pylarinos, “Room temperature vulcanized silicone rubber coatings, application in high voltage substations", in: “Concise Encyclopedia of High Performance Silicones”, John Wiley & Sons Inc, 2014
[9] J. Stefanakis, E. Thalassinakis, K. Siderakis, D. Agoris, E. Dialynas, “Fighting pollution in the cretan transmission system. 25 years experience”, presented at the Contamination Issues on High Voltage Installations conference, Iraklion, Crete 2001 (available at: http://talos-ts.com/files/2001_CIHVI.pdf)
[10] D. Pylarinos, K. Siderakis, E. Koudoumas, E. Thalassinakis, "Polymer insulators and coatings in the cretan power system. the transmission line case", 9th Mediterranean Conference on Power Generation, Transmission Distribution and Energy Conversion, Athens, Greece, 2-5 November, 2014
[11] S. Gubanski, "Greek power company evaluates alternatives to combat pollution in transmission system on Crete", INMR Vol. 10, No. 4, 2002
[12] D. Pylarinos, K. Siderakis, E. Thalassinakis, "Comparative investigation of silicone rubber composite and RTV coated glass insulators installed in coastal overhead transmission lines", IEEE Electrical Insulation Magazine, Vol. 31, No. 2, pp. 23-29, 2015
[13] TALOS High Voltage Test Station, www.talos-ts.com
[14] R. Znaidi, “Expanded test station helps Greek power system operator assess insulator design & performance”, INMR, Issue 107, Q1, pp. 54-67, 2015
[15] D. Pylarinos, K. Siderakis, E. Thalassinakis, “R&D in TALOS high voltage test station-assessing aging and performance of polymer insulators”, 13th International Conference on Circuits, Systems, Electronics, Control & Signal Processing (CSECS '14), Lisbon, Portugal, October 30-November 1, 2014
Engineering, Technology & Applied Science Research Vol. 5, No. 2, 2015, 764-774 774
www.etasr.com Dimitropoulou et al.: Comparative Investigation of Pollution Accumulation and Natural Cleaning…
[16] D. Pylarinos, K. Siderakis, I. Pellas, E. Thalassinakis, “Assessing pollution of outdoor insulators in the cretan power system”, 18th International Conference on Circuits, Systems, Communications and Computers (CSCC 2014), Santorini, Greece, July 17-21, 2014
[17] P. W. Haberecht, Pollution deposition rates on insulator (HV) surfaces for use in atmospheric corrosivity estimation, The University of Newcastle, 2008
VIII. BIOGRAPHIES Mariana Dimitropoulou was born in Iraklion, Crete, Greece, in 1989. She received her Diploma degree in Electrical and Computer Engineering, from the Democritus University of Thrace, Xanthi, Greece, in 2014. Her current research interests include outdoor insulation, insulation coordination and pollution field measurements on high voltage insulators under un-energized conditions. Dionisios Pylarinos received a Diploma degree in Electrical and Computer Engineering in 2007 and the Ph.D. degree in the same field in 2012 from the University of Patras, Greece. He has been a researcher/consultant for the Public Power Corporation Greece and the Hellenic Electricity Distribution Network Operator, Greece since 2008, in the field of HV insulator testing and monitoring and he is a member of the team behind TALOS High Voltage Test Station. He is a lecturer on a contract since 2013 for the Technological Educational Institute of Crete. He is a member of the Technical Chamber of Greece and of the Greek National CIGRE Committee. His research interests include outdoor insulation, high voltage grids and equipment, signal processing & pattern recognition and power electronics.
Kiriakos Siderakis was born in Iraklion in 1976. He received a Diploma degree in Electrical and Computer Engineering in 2000 and the Ph.D. degree in 2006 from the University of Patras, Greece. Presently, he is an Assistant Professor at the Department of Electrical Engineering, at the Technological Educational Institute of Crete and he is a member of the team behind TALOS High Voltage Test Station. His research interests include outdoor insulation, electrical discharges, high voltage measurements and high voltage equipment diagnostics and reliability. He is a member of the Greek CIGRE and of the Technical Chamber of Greece. Emmanuel Thalassinakis received the Diploma in Electrical and Mechanical Engineering and also the Ph.D. degree from the National Technical University of Athens. After working for the Ministry of the Environment, in 1991 he joined the Public Power Corporation (PPC). He is the Assistant Director of the Islands Network Operations Department of the Hellenic Electricity Distribution Network Operator S.A., a former part of PPC and the leader of the team behind TALOS High Voltage Test Station Michael Danikas, born in 1957, Kavala, Greece, received his BSc and MSc degrees from the University of Newcastle-upon-Tyne (England), in electrical and electronic engineering, and his PhD Degree from Queen Mary College, University of London England, in 1980, 1982 and 1985 respectively. From 1993 he has been with Democritus University of Thrace, Department of Electrical and Computer Engineering, since 1998 as Associate Professor. His current research interests are breakdown in transformer oil, simulation of electrical tree propagation in polymers, study of partial discharge mechanisms in enclosed cavities, magnitude and surface phenomena in indoor and outdoor high voltage insulators.