comparative patent quality
TRANSCRIPT

Law in the Global Marketplace Conference Intellectual Property and Related Issues
Hosted by:
Comparative Patent QualityNovember 4, 2015 Keynote Address
Colleen V. ChienAssociate Professor, Santa Clara University School of LawFormer White House Office of Science and Technology PolicyContact: [email protected], @colleen_chien

Patent quality is an international priority
2
“Only high-quality patents and processes serve the needs of inventors, innovation and society alike”- EPO Annual Report 2014

"I know well the difficulty of drawing a line between the things which are worth to the public the embarrassment of an exclusive patent, and those which are not.“ – Thomas Jefferson, 1813
3
The difficulty in ensuring patent quality are not new

4
But recent developments highlight the cost of low-quality patents

5
And the question of when and how broadly quality filters should be applied
Stage of Patent Lifecycle
Quality Mechanisms
Pre-Application Legal requirements, fees, quality of submission, third-party submissions
Pre-Grant Prosecution levers
Post-Grant Post-Grant Procedures, Reissue, Reexam, Maintenance Fees

This presentation applies a comparative lens to patent quality
6

Bearing in mind that there are many differences between the European and US systems…
7
Factor US EuropeExaminer Pay US civil service grades Double US levels,
limited taxes
Examiner Turnover ~33% per year 5% per year
Bifurcation of Search & Examination
No Yes
Loser Pays No Yes
Sources: Drahos (2010), van Pottelsberghe de la Potterie (2011), Temmerman (2013), EPO, USPTO 2015
“And the wisdom to know the difference…”

This presentation considers US and EP ouctomesat aggregate and “matched pair” levels
8
- “Exact match” matched pair approach for prosecution outcomes (Graham & Harhoff, 2006). Filing date / priority date matches.
- Data sources: Innography, Lex Machina, PATSTAT, Google Patents, WIPO/Schmcoch, NSF, PTO/EPO
- Related work: Jensen, et al. (2005, 2007, 2008 2011, 2014), Graham & Harhoff (2006, 2009), Wright (2009), Sampat et al. (2015)
Exact Match

The quantity and quality of patents in force is the result of three sets of decisions
9
Patents in Force
Patent Applicationx
Patent Examination
xPatent Renewal
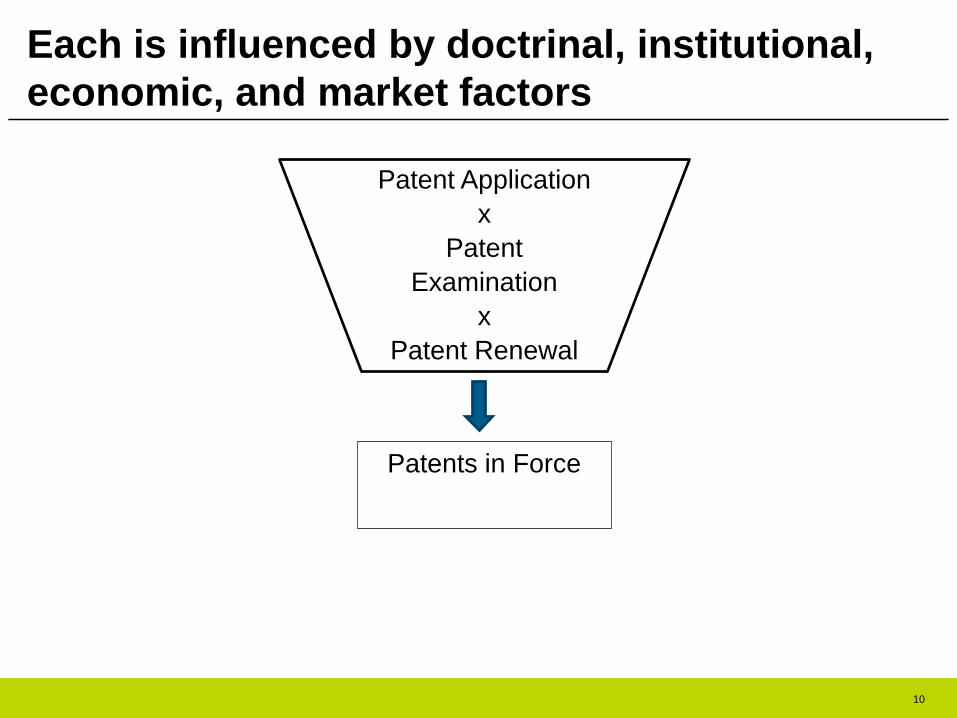
Each is influenced by doctrinal, institutional, economic, and market factors
10
Patents in Force
Patent Applicationx
Patent Examination
xPatent Renewal

Comparing the US and EP at each of these stages…
11

US PATENTS (FILED 2002)
EPO PATENTS (FILED 2002)
Sources: PATSTAT 2015 (application and grant numbers), Trilateral Statistics 2002 Report (projected renewal rates).
273K US applications
x74% grant rate
x37% projected*
Y20 renewal rate
75K US patents in
force in Y20
120K EPO applications
x50% grant rate
x12% projected*
Y20 renewal rate
6.9K EPO patents in
force in Y20
EPO v. US PATENTS (2002)
2.3 x applicationsx
1.5 x grant rate x
3x renewal rate
10x more US patents in
force than EPO
At each stage, the US tilts towards more quantity – ex: 2002

EPO v. US Patents(Tech* 2002)
3.0 x applications
x1.8 x grant rate
x3x renewal rate
17x more US tech patents in force than EPO
EPO v. US PATENTS (2013)
3.8 x applications
x1.8 x grant rate
x2x renewal rate
14x more US patents in force
than EPO
2.3 x applications
x1.5 x grant rate
x3x renewal rate
10x more US patents in force
than EPO
Sources: PATSTAT 2015 (application and grant numbers), Trilateral Statistics 2002 Report (projected renewal rates).*“Electrical Engineering” patents as defined by WIPO/Schmoch
EPO v. US PATENTS (2002)
The disparities are greatest in tech, and growing

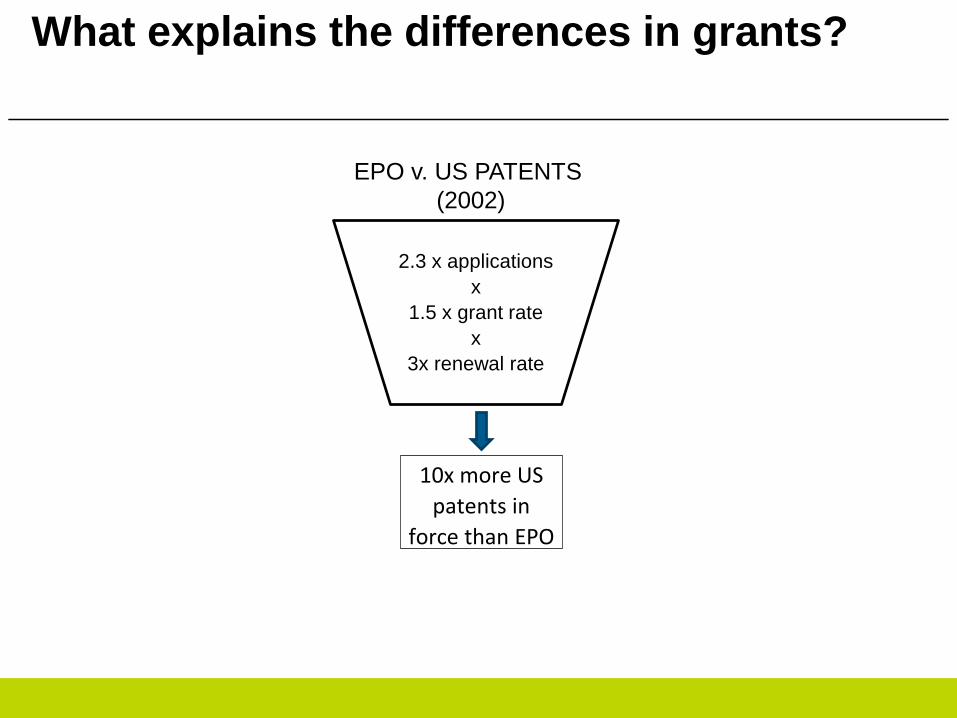
What explains the differences in applications?
EPO v. US PATENTS (2002)
2.3 x applicationsx
1.5 x grant rate x
3x renewal rate
10x more US patents in
force than EPO

The EPO did not experience the same surge in tech patenting that the US did

$5.73 $5.44 $5.00
$1.04 $-
$1.00 $2.00 $3.00 $4.00 $5.00 $6.00 $7.00
1980 1984 1988 1992 1996 2000 2004
FIG__: R&D (in $M) per US Origin Patent Application1980-2007 (inflation adjusted)
Chemicals Electrical Equipment and ComputersSource: NSF, USPTO via PATSTAT 2015, Lybbert and Zolas 2013
What has driven the surge in US tech patents? Defensive/FTO driven patenting is likely one factor

- Relative value of US v. EU patents- Scope of patentability - Size, importance of US v. EU markets - Loser pays in EU, overall enforcement climate
Other factors that contribute to the differences
What explains the differences in grants?
EPO v. US PATENTS (2002)
2.3 x applicationsx
1.5 x grant rate x
3x renewal rate
10x more US patents in
force than EPO
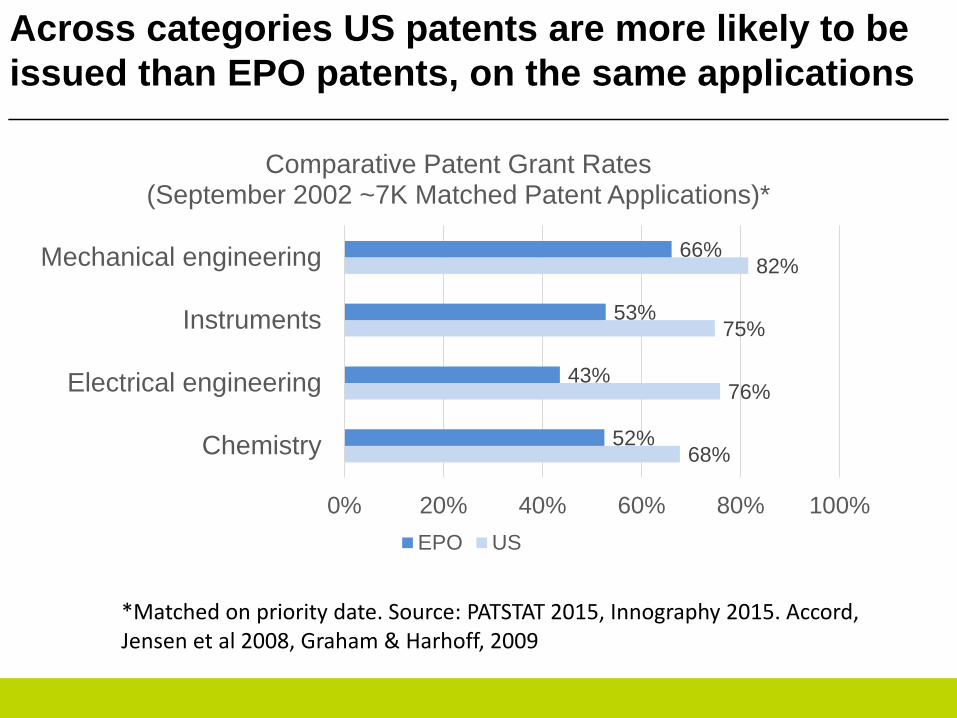
Across categories US patents are more likely to be issued than EPO patents, on the same applications
68%
76%
75%
82%
52%
43%
53%
66%
0% 20% 40% 60% 80% 100%
Chemistry
Electrical engineering
Instruments
Mechanical engineering
Comparative Patent Grant Rates(September 2002 ~7K Matched Patent Applications)*
EPO US
*Matched on priority date. Source: PATSTAT 2015, Innography 2015. Accord, Jensen et al 2008, Graham & Harhoff, 2009

The majorityof nongrantedapps in the EPO are withdrawn, not refused
13%
81%
6%
FIG ___The Resolution of Non-Granted European Patent Applications (N= 3,517
2002 Matched Pairs)
Pending Withdrawn Refused
EPO’s lower grant rate is due to higher applicant withdrawal rates (not refusals)

Less than half of IPRed US patents* that were filed for in Europe have actually been granted in Europe… with many of the remainder withdrawn…
100%
47%
20%
31%
0%
25%
50%
75%
100%
US EPO
Comparative Examination and IPR Outcomes N = 169 Matched US Patent-EPO Applications*
Granted Denied Withdrawn Pending
*IPRed patents that have been the subject of a final decision as of June 2015.Source: Lex Machina, Innography

22
The ‘137 DataTreasury patent was the subject of 7 EP Applications, none of which matured into a patent

44%20%
34%29%
50%59%
14%6%
11%6%
13%27%
0% 20% 40% 60% 80%
Average AllOther fieldsInstruments
Mechanical engineeringElectrical engineering
Chemistry
FIG___: US v. EPO Examiner Use of Non-Patent Literature (~7K 2002 Matched App Pairs)
US Examiner-cited NPL EPO Examiner-cited NPL
Source: EP Register 2015, USPTO PAIR 2015, Google Patents (Front Page information)
EPO examiners are more likely to cite non-patent literature (NPL)

Google Patents, 2015 Edition:
Sources of Data
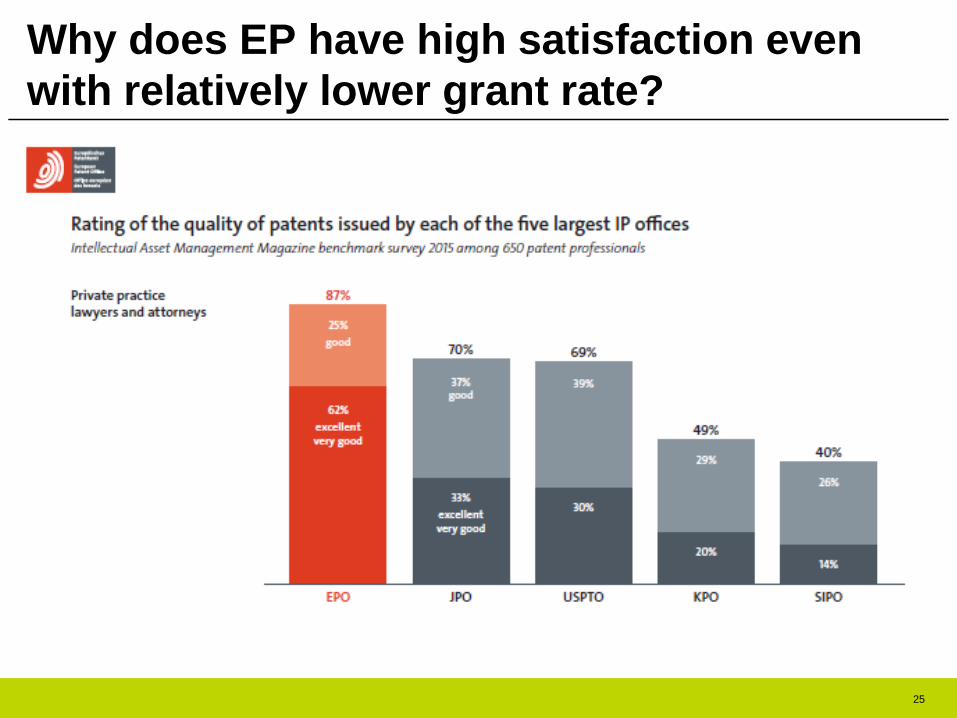
Why does EP have high satisfaction even with relatively lower grant rate?
25

The majorityof nongrantedapps in the EPO are withdrawn, not refused
13%
81%
6%
FIG ___The Resolution of Non-Granted European Patent Applications (N= 3,517
2002 Matched Pairs)
Pending Withdrawn Refused
EPO’s lower grant rate is due to higher applicant withdrawal rates (not refusals)

“In the EPO, patents are granted in 49% of total filings, with 22% of applications abandoned after the search report and 29% abandoned after examination.”
- EPO President Battistelli at the 30th Annual US Bar- EPO Liaison Council Meeting, 10/30/2014
What makes EPO applicants withdraw?

EPO conducts a single search, invests in quality upfront. PTO is more tolerant, allows refilings
Can refilethroughcontinuations
No continuations
While time for searching prior art varies, EP prior art searching take ~8-12 avg., vs. ~2 hours on average at the PTO (van Pottelsberghe de la Potterie (2011), EPO)

Jefferson was “quite favorable to the granting of patents, and granted them with great consideration, the other duties of members of this Board, in view of their high offices, made it impossible for them to devote much time to this work. As a result the law was changed in 1793 to make the granting of patents a clerical function.” – PJ Frederico, 1952
Time pressure during examination is nothing new

20%
48%
0%
10%
20%
30%
40%
50%
60%
70%
80%
90%
100%
1 2 3 4 5 6 7 8 9 10 11 12 13 14 15 16 17 18 19 20Per
cent
age
of P
aten
ts M
aint
aine
d
Years After Filing Date
EPO vs. USPTO Patent Maintenance
EPO
Source: IP5 2013 Report
What explains the difference in renewal rates?

US Patents may be more valuable – they are also cheaper and easier to renew
0 5 10 15 20 25 30 35 40
US
UK
France
Germany
Russia
India
Australia
Republic of Korea
Sweden
Patent Costs Relative to Market Size(Total Fees per $B GDP)
Source: Park, On Patenting Costs, 2010, updated to 2014 data

Stepping back…
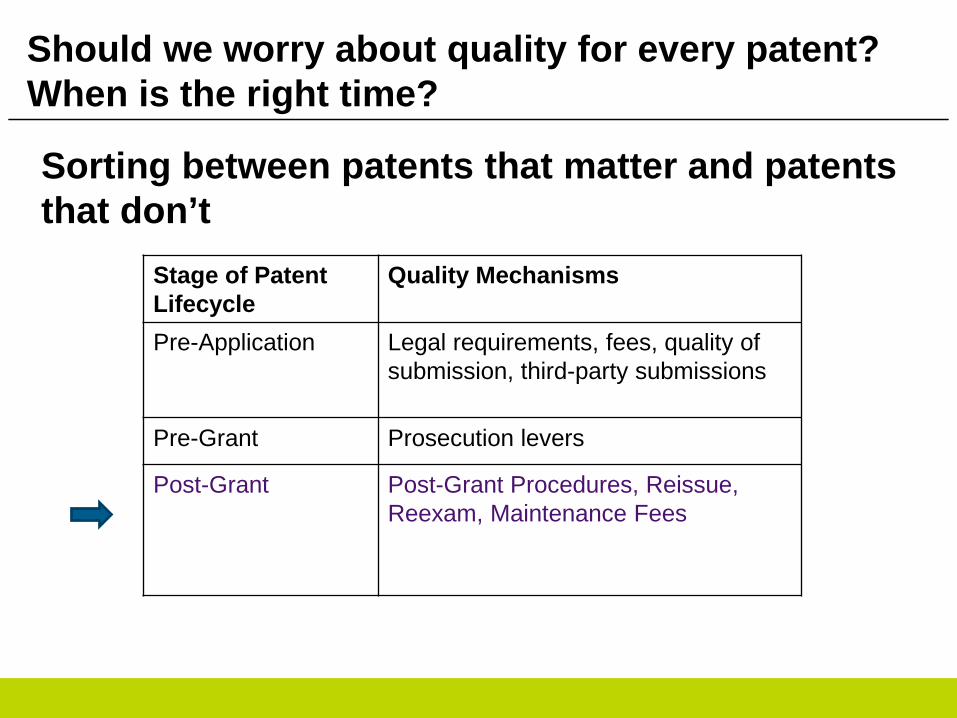
Should we worry about quality for every patent? When is the right time?
Sorting between patents that matter and patents that don’t
Stage of Patent Lifecycle
Quality Mechanisms
Pre-Application Legal requirements, fees, quality of submission, third-party submissions
Pre-Grant Prosecution levers
Post-Grant Post-Grant Procedures, Reissue, Reexam, Maintenance Fees

34
Who should decide?
QualityMechanisms
Third Parties Patentees?
Post Grant Post GrantProcedures
Sorting between patents that are likely to be enforced and those that aren’t

35
My proposal to enhance quality: reward patentees for designating patents as defensive only or available for FRAND-licensing
QualityMechanisms
Third Parties Patentees?
Post Grant Post GrantProcedures
Defensive only/FRAND-friendly patent option
Sorting between patents that are likely to be enforced and those that aren’t

Facilitating “Defensive Only” / “FRAND” friendly patent options
Sources: Chien, Exclusionary and Diffusionary Levers in Patent Law, 2015Chien, Why Its Time to Open the Patent System, 2015.
- Patentee can elect at any time to make patent “defensive” or available on FRAND and in return, get a 50% discount on fees- Once a patent becomes defensive, must remain defensive- Demand expressed in the marketplace through proliferation
of defensive pledges: OIN, DPL, LOT, Tesla, many others- Companies that go defensive will reduce their own costs
and costs of entry/patenting for startups - Akin to DE/UK License of Right

Thank you
Colleen ChienAssociate Professor, Santa Clara University School of [email protected], @colleen_chien