comparative studies of gene regulatory networks involved
TRANSCRIPT
Comparative studies of gene regulatory networks
involved in brain development
By
NAZIA PARVEEN
National Center for Bioinformatics
Faculty of Biological Sciences
Quaid-i-Azam University
Islamabad, Pakistan

Comparative studies of gene regulatory networks
involved in brain development
By
NAZIA PARVEEN
A thesis
In the partial fulfillment of the
requirements for the degree of
DOCTOR OF PHILOSOPHY
In
BIOINFORMATICS
National Center for Bioinformatics
Faculty of Biological Sciences
Quaid-i-Azam University
Islamabad, Pakistan

Certificate
This thesis submitted by Miss. Nazia Parveen is accepted in its present form by
the National Center for Bioinformatics, Faculty of Biological Sciences, Quaid-i-
Azam University, Islamabad as satisfying the thesis requirements for the degree
of Doctor of Philosophy (Ph.D) in Bioinformatics.
Internal Examiner: _____________________
Dr. Amir Ali Abbasi
External Examiner: _____________________
Chairman: ____________________________
Dated:_________________

To my parents, husband, siblings & my cute little angels,
Without whom I couldn’t have accomplished anything

ACKNOWLEDGEMENTS
I bow my head before Almighty Allah, the Lord of the worlds, The Omnipotent, The
Gracious and The Merciful, who blessed me with good health and conducive
environment and enabled me to work and complete my PhD work. Without Allah’s
divine help, I would not have been able to achieve anything in my life.
My special praise to Holy Prophet (SAW), the most perfect among all human beings
ever born on the surface of the earth, from the deepest core of my heart who is
forever a model of guidance and knowledge for the whole mankind and a source of
knowledge and blessings for the entire creation. He has guided his Ummah to seek
knowledge from cradle to grave and this has awakened in me the strong desire to
undertake this work and write up.
I owe my sincerest gratitude to my supervisor, Dr.Amir, who has supported me
throughout my thesis with his patience, valuable suggestions and expertise
knowledge. I attribute the level of my PhD degree to his encouragement, keen
interest, skillful guidance, effort and without his thesis, too, would not have been
completed or written. One simply could not wish for a better devoted, ideal
supervisor and scientist. I also take this opportunity to express my deepest gratitude
and sincere thanks to Prof. Dr. Wasim Ahmed, Dean, Faculty of Biological sciences.
I am also pleased to Higher Education Commission of Pakistan for supporting and
providing funds during my PhD work
I express gratitude my parents for their love and support throughout my life. They
sacrificed their own wishes to fulfill my dreams. No words in any dictionary of
world for my parents, sisters and brothers Imran Ahmad and Rizwan Ahmad for

their amazing love and support not only during my research work and studies but
also in every step of my life.
A heartiest and sincerest thanks to my loving and caring husband who supported and
guided me more than any one during my Ph.D. I have to mention here, how hard he
worked to pull me into the scientific community. He wanted to see me in the
scientific world, and consequently I worked hard to fulfill his wish. This thesis is
only the beginning of my scientific journey.
My special thanks to my fellow Noor us Sehar who worked side by side with me and
helped me to overcome technical challenges when needed.
In my daily work, I have been blessed with a friendly and cheerful group of fellow
students: Nashaiman, Shahid, Rabail, Rashid, Irum, Madiha hafeez, Madiha shabbir,
and others, during my stay in EVOGENO lab. I wish to express sincere thanks to
them for their utmost cooperation and their valuable company.
I am thankful to NCB staff: Mr.Talib, Mr.Ali, Mr.M.Naseer, Mr.Yasir and
Mr.Naseer Ahmed for their kind cooperation.
It would be very unjust if I do not mention my best friends: Asma and Saad for
lending help in times of need.
In the end I want to present my unbending thanks to all those hands who prayed for
my betterment and serenity.
Nazia Parveen

Table of Contents
Contents
List of Figures ...................................................................................................................... i
List of Tables ..................................................................................................................... iii
List of Abbreviations ......................................................................................................... iv
Summary ............................................................................................................................ vi
INTRODUCTION .............................................................................................................. 1
1.1. Brain ......................................................................................................................... 2
1.1.1. Evolution of brain .............................................................................................. 3
1.1.2. Anatomy of brain ............................................................................................... 4
1.1.3. Evolution of Forebrain ....................................................................................... 5
1.1.4. Anatomy and physiology of forebrain ............................................................... 6
1.2. Eukaryotic transcriptional overview ........................................................................ 8
1.3. Eukaryotic transcriptional machinery ...................................................................... 9
1.3.1. Promoter ............................................................................................................ 9
1.3.2. Core promoter .................................................................................................... 9
1.3.3. Proximal promoter elements ............................................................................ 11
1.3.4. Enhancer .......................................................................................................... 11
1.3.5. Silencer ............................................................................................................ 14
1.3.6. Insulators ......................................................................................................... 14
1.3.7. Locus Control Region ...................................................................................... 15
1.4. Methods to identify cis regulatory elements .......................................................... 15
1.4.1. Experimental approaches towards identifying regulatory elements ................ 16
1.4.2. Computational approaches towards identifying regulatory elements .............. 18
1.4.3. Comparative approaches to identify regulatory elements ............................... 18
1.5. TF-TF co-operativity and Cis-regulatory modules ................................................ 18
1.6. Early trends to study gene regulation ..................................................................... 19
1.7. Recent trends of epigenomic Approach to Study Gene Regulation ....................... 20

Table of Contents
1.8. DNAse I Hypersensitive sites ................................................................................ 21
1.9. Role of transcription factors in forebrain development ........................................ 21
1.10. Aim of study ......................................................................................................... 23
MATERIALS AND METHODS ...................................................................................... 27
2.1. Detection of synteny blocks between human and teleost fishes ............................ 28
2.2. Investigating endogenous expression patterns ....................................................... 29
2.3. Molecular function assignment to the CNE-enhancer flanking genes and putative
target genes .................................................................................................................... 30
2.4. Assigning the target gene to human CNE-enhancer .............................................. 30
2.5. Transcription factor analysis .................................................................................. 30
2.6. Genomic radius calculation .................................................................................... 31
2.7. CNE duplication and retention in human and teleost fishes .................................. 32
2.8. Defining Forebrain transcription factor code ......................................................... 33
2. 8.1. Invivo Data Sets.............................................................................................. 33
2.8.2. Pipeline Assembly ........................................................................................... 34
2.8.3. First strategy .................................................................................................... 34
2.8.4. Second strategy ................................................................................................ 36
2.8.5. PCA ................................................................................................................. 37
RESULTS ......................................................................................................................... 40
3.1. Comparitve Syntenic Analysis ............................................................................... 40
3.1.1. Assigning target gene to functionally defined CNEs ...................................... 40
3.1.2. Range of action of human cis-acting sites ....................................................... 50
3.1.3. Transcription factor analysis ........................................................................... 60
3.2. Human Forebrain specific Results ......................................................................... 62
3.2.1. Catalogue of functionally reported forebrain TFs ........................................... 63
3.2.2. Identification of Binding Motifs ...................................................................... 68
3.2.3. Shared Binding motifs predicted by both Clover and F-seq ........................... 69
3.2.4. Regular Expression Algorithm Results ........................................................... 70
3.2.5. PCA ................................................................................................................. 70
3.2.6. Intersection of All the four clusters ................................................................. 76
Conclusion and future prospects ....................................................................................... 90
Table of Contents
References ......................................................................................................................... 91
List of Publications ........................................................................................................... 97
Published Articles ......................................................................................................... 97
Articles in Pipeline. ....................................................................................................... 97
Note:
Supplementary data is attached herewith this thesis in CD.

List of Figures
i
List of Figures
Figure1. 1 Parts of brain depicting forebrain, midbrain and hindbrain ................. 5
Figure1. 2 A complex metazoan transcriptional unit .............................................. 8
Figure1. 3 RNA pol II core promoter motifs. ....................................................... 10
Figure1. 4 Three key characteristics of an enhancer element. .............................. 12
Figure1. 5 The spatial and temporal regulation of developmental genes is due to
modularity in gene Expression.............................................................................. 13
Figure1. 6 Functional assays that measure transcriptional regulatory element
activity................................................................................................................... 17
Figure1. 7 Flow-chart of combination of comparative and functional approach to
hunt for regulatory elements. ................................................................................ 25
Figure2. 1 Human-Mouse alignment highlighting TF, FP and FN motifs in
CNE_170............................................................................................................... 37
Figure2. 2 Flow chart for defining forebrain TF code. ......................................... 39
Figure 3. 1 Target gene identification of human CNE-enhancers through
orthology mapping………………………………………………………………. 44
Figure 3. 2 Human CNE-enhancers duplication history and their genomic range of
action……………………………………………………………………………. 45
Figure 3. 3 Analysis of genic environment of human CNE-enhancers in teleost
fish orthologous genomic intervals helps in identifying their target genes……... 47
Figure 3. 4 CNE-enhancer induced reporter expression was compared with the
reported endogenous expression of neighboring genes to find the target gene
bodies of human enhancers…………………………………………………….. 49

List of Figures
ii
Figure 3. 5 Human CNE-enhancers summary of genomic range of action and the
maximum range of action found is ~2Mb………………………………………. 51
Figure 3. 6 3D loading plots……………………………………………………. 62
Figure 3. 7 Examples of histogram and density estimation properties…………. 69
Figure 3. 8 3D Scatter plot for cerebrum data PCA…………………………….. 72
Figure 3. 9 3D Scatter plot for cortex data PCA……………………………….. 73
Figure 3. 10 3D Scatter plot for lymph data PCA………………………………..74
Figure 3. 11 3D Scatter plot for Regular expression data PCA………………… 75
Figure 3. 12 Intersection of four clusters from four data sets…………………… 78

List of Tables
iii
List of Tables
Table 3. 1 The association of the human CNE-enhancers with their target gene . 42
Table 3. 2 CNE-Target gene assosiation............................................................... 52
Table 3.3 List of transcription factors involved in forebrain specification and
development. ......................................................................................................... 63
Table 3. 4 Ranges of Eigen values for all data sets. ............................................ 71
Table 3. 5 Eigen values of 23 shared TFs from PCA of all the data sets. ........... 77

List of Abbreviations
iv
List of Abbreviations
AhR Aryl hydrocarbon receptor
ANP Anterior neural plate
bHLH Basic helix loop helix
bp Base pair
BRE TFIIB-Recognition Element
bZIP Basic leucine zipper domain
cAMP Cyclic adenosine monophosphate
CNEs Conserved non-coding elements
CNS Central Nervous system
CRM Cis regulatory module
DCE Downstream core element
DHSs DNAse Hypersensitive sites
DPE Downstream promoter element
FSH Follicle-stimulating hormone
FSHE Forebrain specific human enhancer
Gb Giga base
GnRH Gonadotrophin-releasing hormone
GRB Genomic regulatory block
GRE Gene Regulatory Element
HFH Fork-head homolog
HIF1 Hypoxia inducible factor 1
HLH Helix loop helix
HMG High mobility group
HMM Hidden Markov model
Inr Initiator
LCRs Locus control regions
LH Luteinizing hormone
Mb Mega base
MGI Mouse genome informatics

List of Abbreviations
v
MTE Motif ten element
NCNC Non-coding non conserved element
PAC PAS associated C-terminal
PAR Proline and acidic rich region
PAS Per, Arnt, Sim
PCR Polymerase chain reaction
PIC Pre initiation complex
RHD Rel homology domain
SRY Sex determining region Y
TAF Tata associated factor
TBP Tata binding protein
TFBS Transcription factor binding sites
TF Transcription factors
TSS Transcription start site
UTR Un-translated region

Summary
vi
Summary
Background: Human genome is enriched with thousands of conserved non-
coding elements (CNEs). Medium throughput strategies were employed to
analyze the ability of human CNEs to drive tissue specific expression during
mouse embryogenesis. These data led to the establishment of publicly available
genome wide catalog of functionally defined human enhancers. Scattering of
enhancers over larger regions in vertebrate genomes seriously impede attempts to
pinpoint their precise target genes. Such associations are prerequisite to explore
the significance of this in vivo characterized catalog of human enhancers in
development, disease and evolution. Recent high throughput strategies like next
generation sequencing and interpretation of epigenomic marks resulted in the
rapid expansion of tissue specific genome wide cis-regulatory repertoire. The next
step is to recruit for trans-regulatory elements for the development of specific
tissue on the basis of this cis-regulatory repertoire.
Results: This study is an attempt to systematically identify the target gene-bodies
for functionally defined human CNE-enhancers. For the purpose we adopted the
orthology/paralogy mapping approach and compared the CNE induced reporter
expression with reported endogenous expression pattern of neighboring genes.
This procedure pinpointed specific target gene-bodies for the total of 192 human
CNE-enhancers. This enables us to gauge the maximum genomic search space for
enhancer hunting: 4 Mb of genomic sequence around the gene of interest (2 Mb
on either side). Narrowing down of our research we opted for forebrain as it is
considered as a hub of evolution from non human primates to human because it is
responsible for all the unique humanly attributes like speech, memory, thinking,
intelligence etc. We devised a pipeline that uses computational and experimental
information (high throughput data) to pin down transcription factors (TFs) that

Summary
vii
interact and interplay with each other in the prototyping of forebrain. For this
purpose we used forebrain specific CNE-enhancers to infer that the forebrain
specific gene expression is closely associated with the cooperative interaction
among at least 23 distinct transcription factors.
Conclusion: In conclusion, the systematic wiring of cis-acting sites and their
target gene bodies is an important step to unravel the role of in vivo characterized
catalog of human enhancers in development, physiology and medicine.
Discovered forebrain specific TF code could be used as trained data set to hunt
for genome wide forebrain specific cis regulatory elements. This automated pipe
line could also be used to define any tissue specific TF code.

Chapter1 –Introduction
1
INTRODUCTION
Human genome is the string of genetic bits that holds long sought secrets of
human development, physiology and medicine. In practice, our ability to
transform such information into understanding remains woefully inadequate. The
Human Genome Project is the latest increment in a remarkable scientific program
whose origins stretch back a hundred years to the rediscovery of Mendel's laws
and whose end is nowhere in sight. In a sense, it provides a capstone for efforts in
the past century to discover genetic information and a foundation for efforts in the
coming century to understand it. Tough the working draft of human sequence
represents a major milestone; a vast amount of additional work is remained to be
done to understand its function. A detailed understanding of the human genome
will require the implementation of sophisticated methods for gene expression
analysis and gene discovery.
Human genome is among the largest genome sequenced, having a size 3.2 GB
(Peterson et al., 2009). Human genome architecture is complex, composed of
coding and non-coding sequences. After accomplishing Human Genome Project
scientist focused to develop the methods for identifying genes in anonymous
DNA sequence. Experimental methods are inadequate for characterizing such a
large size human genome, that’s why cannot be systematically used to ‘annotate’
multi-mega base-long anonymous sequences. If the human genome sequence
data is to be exploited, computational methods are the only alternative that can be
used to provide a minimal amount of characterization, either in an automated or
semi-automated way. Recognition of coding sequence has generally been
approached by examining the positional and compositional biases imposed on the
DNA sequence in protein-coding regions by the genetic code and by the
distribution of amino acids in proteins (Fickett, 1982). Many methods are
available to hunt for protein coding sequences in human genome, as coding
Chapter1 –Introduction
2
region contains a well characterized code which can easily be identified by
different algorithms such as Hidden Markov model (HMM), decision trees, and
dynamic-programming.
Even after the identification of genes scientists were unable to answer for the
puzzle that mere one-third increase in gene numbers could be enough to progress
from a rather unsophisticated nematode to humans. Then some scientists
hypothesized that neither the cellular DNA content nor its gene content appears
directly related to our intuitive perception of organismal complexity. Emerging
evidences suggest that organismal complexity arises from progressively more
elaborated regulation of gene expression (Levine & Tjian, 2003). Biological
sophistication evolves through the development of more individually and finely
regulated gene expression mechanisms, rather than a sheer increase in the number
of genes, then next step in human genome characterization is to hunt for gene
regulatory elements (GRE) which comes under the category of non coding DNA.
These elements, because of their crucial functionality, are under purifying
selection and that is why remained conserved through the process of evolution.
Gene regulatory elements are specific cis-acting DNA sequences that are
recognized by trans-acting transcription factors
Annotating the human genome for cis-acting regulatory elements is important,
firstly to precisely pinpoint the cis-regulatory underpinning of human gene
expression, secondly to understand the disease relevance of human non-coding
region, thirdly, to elucidate the cis-regulatory basis of organismal complexity.
1.1. Brain
Thinking is the premier mental activity present in man. Our conscious thoughts,
our emotions and many of our memories reside within the brain and it is the
region in our body that confers many distinctively human attributes. It has been

Chapter1 –Introduction
3
called as the most intricate and remarkable object in the universe and it is
considered as the ultimate frontier of science. There are billions of neurons in
brain which work together in coordinated fashion to form quadrillion
connections between them, for proper execution of brain‘s function (Wilson &
Houart, 2004).
The brain is the major portion of central nervous system (CNS) that acts as
central processing unit. From an evolutionary biological perception, the function
of the brain is to offer consistent control over the animal‘s behavior. Synapses
are the major components of the brain. The important task of the brain is cell-cell
interaction, and synapses are the sites where communication occurs.
1.1.1. Evolution of brain
During evolution, species specific variation and reorganization of the brain may
be a plausible clause to allow organisms to cope with environmental demands of
newly occupied niches. This pattern of brain evolution is indeed a phenomenon
observed among vertebrates (Hofman, 1989). The vertebrate brain is partitioned
into many functionally distinct interrelated structures. Even though precise roles
could not be entirely assigned to specific structures but there is a common
consensus that different types of cerebral information are mainly processed
within certain brain structures and that grown needs on cognitive abilities tends
to be related with an enlargement of size of the structure processing the
information. Thus, because of the higher requirement of metabolic costs of
certain brain tissue it is possible that selection may cause the enlargement of only
particular structures related with the behavior ability that are being favored,
resulting in brain evolution in a mosaic pattern i.e. changes in the size of certain
structures are autonomous than changes in other structures (Gonzalez-Voyer,
Winberg, & Kolm, 2009). In vertebrates, two main parameters have been related
to brain size variability i.e. body size and ecological factors. From evolutionary

Chapter1 –Introduction
4
point of view, it has been considered that brain growth is a unitary phenomenon
whose main effect is to enhance processing capacity (Aboitiz, 1994).
It may be expected that size changes in brain would have been caused by natural
selection on specific behavioral abilities. Likewise neo-cortex which is the chief
part of the cerebral cortex that has an important role in learning processes, sleep
and memory, shows about five fold difference in volume between primates and
insectivores in comparison with the rest of the brain. However, it has been
asserted that developmental constraints restrained such mosaic pattern, resulted
in coordinated size variation between individual brain components (Barton &
Harvey, 2000). Given the extensive information on brain variation, three notable
assumptions related to brain evolution in vertebrates can be deciphered: i) All
vertebrates (excluding agnathans) have the similar number of brain divisions, ii)
Size of brain has increased autonomously in various members of each vertebrate
clad and iii) Increases in size of brain has subsequently resulted in increase in the
number of neuronal cell and possibly, increases in behavioral complexity
(Northcutt, 2002).
1.1.2. Anatomy of brain
Based on embryonic development human brain can be divided anatomically into
three main regions: forebrain, midbrain and hind brain (Figure 1.1).
The forebrain (prosencephalon) consists of cerebrum, hypothalamus, thalamus,
and pineal gland. Cerebral area usually termed as the telencephalon while the
diencephalon (interbrain) is referred to the area where hypothalamus, thalamus
and pineal gland reside.
The midbrain (mesencephalon) is located between the interbrain and the
hindbrain and consists of a segment of the brainstem. The midbrain helps

Chapter1 –Introduction
5
coordinate sensory information with simple movements. Midbrain is involved in
motor function as well as in auditory and visual responses.
The hindbrain (rhombencephalon) consists of the remaining brainstem and
cerebellum and pons. From an evolutionary viewpoint, the hindbrain is the oldest
part of our brain and is positioned deep within our head and on top of our spinal
cord. Because this was our first and most basic brain, it controls many of our
basic functions i.e. it assists in movement coordination, conduction of sensory
information and maintaining balance.
Figure1. 1. Parts of brain depicting forebrain, midbrain and hindbrain
Forebrain, midbrain and hindbrain are three divisions of brain. Forebrain forms the
most anterior part of brain while hindbrain forms the most posterior part of brain.
(Adopted from (Kiernan & Rajakumar, 2013)
1.1.3. Evolution of Forebrain
During the course of evolution, one of the most prominent changes in body plan
that has been observed is the gradual elaboration of an increasingly complex
forebrain in chordates. To unravel the mechanism behind this complexity,
developmental biologists quest for the cellular and molecular mechanisms

Chapter1 –Introduction
6
underlying the complex forebrain pattering (Foley & Stern, 2001). Residing in
the most anterior of central nervous system (CNS), forebrain (prosencephalon)
gives rise to many different tissues like eyes, telencephalon and diencephalon
(Inoue, Nakamura, & Osumi, 2000).
Historically the major trend in comparative brain and behavior research has laid
emphasis on the differences in cognition and its neural basis among species. In
fact, the vertebrate forebrain shows an amazing range of diversity and
specialized adaptations. Possibly the major morphological variation is observed
in the telencephalon of the actinopterygian fish, which goes through a process of
eversion during embryonic development, in contrast with the telencephalon of
non-actinopterygians (like amniotes) which develops by a process of
evagination. These two different developmental processes produce remarkable
variation, where mainly two solid telencephalic hemispheres separated by a
unique ventricle in the actinopterygian radiation in comparison with the
hemispheres with internal ventricles in other groups. However, an increasing
amount of evidence sheds light that the vertebrate‘s forebrain presents a common
pattern of basic organization that supports highly conserved cognitive
functions(Salas, Broglio, & Rodriguez, 2003).
1.1.4. Anatomy and physiology of forebrain
Forebrain also called prosencephalon is the largest and the most anterior part of
brain. It can be divided into two main segments:
Diencephalon
Thalamus
Hypothalamus
Telencephalon which includes
Cerebral Cortex
Basal Ganglia
Limbic System (hippocampus and amygadala)

Chapter1 –Introduction
7
1.1.4.1. Diencephalon
Diencephalon forms the fundamental core of cerebrum.
Thalamus which is the largest component of diencephalon consists of several
regions or nuclei which take input from sensory systems and project to sensory
regions of cerebral cortex. Part of thalamus has connections with cortical areas
that are involved in intricate mental process. The thalamus plays a chief role in
regulating arousal, levels of consciousness and levels of activity. The main role
of the hypothalamus is mainly concerned with the overall regulation of the
Endocrine System. Neurosecretory cells in hypothalamus produce hormones that
enter into the blood stream. Some of which act on kidney while others control
the hormonal output of pituitary gland via a network of blood vessels. Some
neurons in hypothalamus secrete a special polypeptide called gonadotrophin-
releasing hormone (GnRH). GnRH releases the two gonadotropins; follicle
stimulating hormone (FSH) and luteinizing hormone (LH). Retina is a derivative
of diencephalon; hence the optic nerve and visual system are associated to this
part of brain(Kiernan & Rajakumar, 2013) .
1.1.4.2. Telencephalon
Telencephalon consists of cerebral cortex, corpus striatum and cerebral white
matter. The cerebral cortex is much convoluted part with folds separated by
grooves. Major groove separate the frontal, parietal, occipital and temporal lobes
of cerebral hemisphere. In various areas of cortex, different forms of sensation
and motor functions are represented. The cerebral cortex is essential for
attention, memory, awareness, language, thought and consciousness. Most
sensory information is routed to the cerebral cortex through thalamus.
At the base of each hemisphere, a large mass of grey matter called corpus
striatum is situated. It contains caudate and lentiform nuclei, that are the parts of

Chapter1 –Introduction
8
basal ganglia. Basal ganglia are strongly interrelated with the thalamus, cerebral
cortex and brainstem, as well as several other brain areas. The basal ganglia are
related with a variety of functions like control of voluntary motor movements,
routine behaviors or habits, eye movements, procedural learning, cognition and
emotion. The cerebral white matter includes fibers that are linked with the
cortical areas of same hemisphere. The Limbic system consists of structures that
reside on both sides of the thalamus. It includes the amygdala, the hypothalamus,
the hippocampus and many others nearby areas. It appears to be mainly
responsible for our emotions and formation of memories (Kiernan &
Rajakumar, 2013).
1.2. Eukaryotic transcriptional overview
Animal development is controlled by progression through a number of
transcriptional states that are orchestrated by spatial and temporal regulation of
transcriptional genes. Transcription initiation of housekeeping genes require the
binding of RNA polymerase II, transcription factors and cofactors binding to
regulatory element and expression is basically driven by core promoter element
whereas the tissue specific and developmentally regulated expression of complex
genes is achieved by the coordinated activities of regulatory elements located
upstream, intronic or downstream of a gene(Fig. 1.2).
Figure1. 2 A complex metazoan transcriptional unit
Arrangement of multiple enhancer elements along with silencer and insulator elements which may
be located upstream or downstream of a core promoter. An enhancer may be located upstream,

Chapter1 –Introduction
9
downstream, within introns or several base pairs away from the gene it is regulating. Gene
regulation is brought about by combinatorial activity of these regulatory regions and TFs.
1.3. Eukaryotic transcriptional machinery
Below is the brief description of the cis-acting regulatory elements governing the
gene expression.
1.3.1. Promoter
The “gene promoter” is loosely defined as the collection of cis-regulatory
elements that are required for initiation of transcription or that increase the
frequency of initiation only when positioned near the transcriptional start site. The
gene promoter region includes the core promoter and proximal promoter
elements.
1.3.2. Core promoter
The core promoter is an approximately 60 bp DNA sequence overlapping the
transcription start site that serves as the recognition site for RNA pol II and
general transcription factors. It is the region around the TSS (transcription start
site) of a gene and contains several DNA elements that serve as docking sites for
binding regulatory protein, resulting in the assembly of PIC (Pre initiation
complex). Some of the known core promoter elements are the TATA box, the
initiator element (Inr), the TFIIB recognition element (BRE), the downstream
promoter element (DPE), and the motif ten elements (MTE). Each of these
sequence motifs is found in only a subset of core promoters. A particular core
promoter may contain some, all, or none of these elements (Fig. 1.3).

Chapter1 –Introduction
10
Figure1. 3 RNA pol II core promoter motifs.
Sequence elements that can contribute to basal transcription from the core promoter. A particular
core promoter may contain some, all, or none of these motifs. The locations of the TFIIB
recognition element (BRE), TATA box (TATA), initiator (Inr), motif ten element (MTE), and
downstream promoter element (DPE) motifs are indicated relative to the start of transcription
(+1). ).(Adopted from(Kadonaga, 2004)
The TATA box is the binding site for the TATA-binding protein (TBP), which is
a major subunit of the TFIID complex. The TATA box can function in the
absence of BRE, Inr, and DPE motifs. The Inr element was defined as a discrete
core promoter element that is functionally similar to the TATA box. The Inr
element is recognized by two other subunits of TFIID, TBP-associated factor 1
(TAF1) and TAF2. Inr can function independently of the TATA box, but in
TATA-containing promoters, it acts synergistically to increase the efficiency of
transcription initiation. The DPE is a distinct seven nucleotide element that is
conserved from Drosophila to humans. It functions in TATA-less promoters and
is located about 30bp relative to the transcription start site. In contrast to the
TATA box, the DPE motif requires the presence of an Inr. The DPE is bound by
two specific subunits of the TFIID complex, TAF9 and TAF6. MTE is located at
positions 18bp to 27bp relative to the start of transcription. It promotes
transcriptional activity and binding of TFIID in conjunction with the Inr.
Although it can function independently of the TATA box or DPE, it exhibits
strong synergism with both of these elements. Other downstream promoter motifs
that contribute to transcriptional activity have been described that appear to be
distinct from DPE and MTE. For example, the downstream core element (DCE)
was first identified in the human β-globin promoter. It consists of three sub-

Chapter1 –Introduction
11
elements located at approximately +10, +20, and +30 of a subset of TATA-
containing promoters. The DCE is bound by TAF1 and contributes to
transcriptional activity of TATA-containing promoters.
1.3.3. Proximal promoter elements
Promoter proximal elements are located just 5′ of the core promoter and are
usually within 70–200 bp upstream of the start of transcription. Promoter
proximal elements increase the frequency of initiation of transcription, but only
when positioned near the transcriptional start site. The transcription factors that
bind promoter proximal elements do not always directly activate or repress
transcription. Instead, they might serve as “tethering elements” that recruit long-
range regulatory elements, such as enhancers, to the core promoter.
1.3.4. Enhancer
Enhancers are cis- regulatory elements that are known to regulate transcription in
a distance and orientation independent manner (Maston, Evans, & Green, 2006).
A typical protein-coding gene is likely to contain several enhancers which act at a
distance. These elements are usually 700–1000 bp or more away from the start of
transcription. The hallmark of enhancers is that, unlike promoter elements, they
can be downstream, upstream, or within an intron, and can function in either
orientation relative to the promoter. A typical enhancer is around 500 bp in length
and contains in the order of 10 binding sites for several different transcription
factors. Each enhancer is responsible for a subset of the total gene expression
pattern. Enhancers increase gene promoter activity either in all tissues or in a
regulated manner (i.e. spatio-temporal expression). Enhancers are able to act from
a distance; they may be located upstream or downstream of a gene, within introns,
in UTRs, in introns of any other unrelated genes or may be found at a distance of
~1Mb and still able to regulate the gene expression in tissue specific manner.
Moreover it has also been reported that an enhancer may regulate the expression
of its target gene located on different chromosome (Lomvardas et al., 2006).

Chapter1 –Introduction
12
Enhancers do not act on the promoter region itself, but are bound by activator
proteins. These activator proteins interact with the mediator complex, which
recruits polymerase II and the general transcription factors which then begin
transcribing the genes. Enhancers can also be found within introns. An enhancer's
orientation may even be reversed without affecting its function. Additionally, an
enhancer may be excised and inserted elsewhere in the chromosome, and still
affect gene transcription ( Fig. 1.4).
Figure1. 4 Three key characteristics of an enhancer element.
An enhancer element can activate a promoter at a distance (A), in either orientation (B) or when
positioned upstream, downstream, or within a transcription unit (C).(Adopted from(Kadonaga,
2004)
1.3.4.1. Modularity of enhancers
Human developmental enhancers are highly modular and functionally
autonomous(Visel et al., 2008). They regulate the spatial and temporal expression
of genes so precisely. It is due to modularity in gene regulation that the spatial

Chapter1 –Introduction
13
and temporal expression of a greater number of genes (>30,000) is achieved by a
surprisingly lesser number of regulatory elements (2000-3000)(Remenyi, Scholer,
& Wilmanns, 2004). Different sets of transcription factors interact with the same
enhancer and drive expression in different tissues in different developmental
stages. This modularity with respect to transcription factors is responsible for
diversity in gene expression in various cell types. Moreover different enhancers in
the neighborhood of any gene interact with the same gene and drive their
expression in different domains (Noonan, 2009) (Fig. 1.5). The modularity of the
enhancer can be explained by an example where a single HOXD11 regulatory
enhancer was deleted, as a result a delay was observed in the expression of
HOXD10 and HOXD11 during somitogenesis whereas these genes were normally
expressed in later developmental stages which may be due to presence of other
complementary regulatory elements. Thus deletion of any regulatory element may
lead to developmental defects in pattering but these are mostly less lethal than the
whole gene deletion (Visel, et al., 2008).
Figure1. 5 The spatial and temporal regulation of developmental genes is due to modularity in
gene Expression
The expression pattern of a gene is mediated by the combination of many redundant regulatory
DNAs. Enhancers precisely drive the expression of genes in specific developing structures.

Chapter1 –Introduction
14
Enhancer 1 and enhancer 2 regulate the expression of their target gene in their respective
developing regions. (Adapted from Noonan 2009)
1.3.5. Silencer
Silencers are sequence-specific elements that confer a negative (i.e., silencing or
repressing) effect on the transcription of a target gene. They generally share most
of the properties ascribed to enhancers. Typically, they function independently of
orientation and distance from the promoter, although some position-dependent
silencers have been encountered. They can be situated as as part of a proximal
promoter, as part of a distal enhancer, or as an independent distal regulatory
module; in this regard, silencers can be located far from their target gene, in its
intron, or in its 3´-untranslated region. Finally, silencers may cooperate in binding
to DNA, and they can act synergistically. Silencers are binding sites for negative
transcription factors called repressors.
1.3.6. Insulators
Insulators are DNA–protein complexes that are experimentally defined by their
ability to block enhancer–promoter interactions and/or serve as barriers against
the spreading of the silencing effects of heterochromatin. These boundary
elements functions with the association of CCCTC binding factor (CTCF) and
prevent the unwanted interaction of enhancer with promoter thereby preventing
the genes from being affected by the transcriptional activity of other genes
(Heintzman & Ren, 2009). There are two prescribed model for its functioning;
domain boundary model and transcriptional decoy model. In
the domain boundary model, the insulator putatively binds nucleoprotein
complexes along the chromatin strand and, by drawing together these boundary
complexes, simultaneously condenses the chromatin and physically separates
enhancer and promoter sequences, thus preventing activation of genes in this
region. In the transcriptional decoy model, the insulator is imagined to provides a

Chapter1 –Introduction
15
site for assembly of a decoy complex with which the enhancer will interact in
preference to, or in competition with, the true promoter (Geyer, 1997).
1.3.7. Locus Control Region
An LCR is defined as a set of elements sufficient to generate an autonomous
chromatin environment (Festenstein et al., 1996; Grosveld, van Assendelft,
Greaves, & Kollias, 1987). LCR organize and maintain a functional domain of
active chromatin and enhance the transcription of downstream genes. LCRs are
typically composed of multiple cis-acting elements, including enhancers,
silencers, insulators, and nuclear-matrix or chromosome scaffoldattachment
regions (MARs or SARs). These elements are bound by transcription factors
(both tissue-specific and ubiquitous), coactivators, repressors, and/or chromatin
modifiers. Each of the components differentially affects gene expression, and it is
their collective activity that functionally defines an LCR and confers proper
spatial/temporal gene expression. The most prominent property of LCRs,
however, is strong, specific enhancer activity. LCRs can regulate gene expression
from a distance and that they function in a position-independent manner.
Although LCRs are typically located upstream of their target gene(s), they can
also be found within an intron of the gene they regulate or downstream of the
gene.
1.4. Methods to identify cis regulatory elements
While most genes have been successfully annotated in the human genome, our
knowledge of regulatory elements controlling these genes in different cell types,
at various time-points and under different environmental stimuli is still limited.
After the discovery of the first long-range regulatory elements scientists are trying
to develop methods to identify cis regulatory elements. Basically there are two
types of approaches for the identification of cis regulatory elements; experimental
techniques and computational analysis.

Chapter1 –Introduction
16
1.4.1. Experimental approaches towards identifying regulatory
elements
One of the most effective ways of examining the regulatory activity of a DNA
region is with a reporter gene assay. In such assays, plasmids containing the
region of interest and a reporter gene whose expression level can be measured
accurately (e.g. green fluorescent protein) are introduced into cells of the
organism of interest. The structure of the plasmid depends largely on the kind of
role the element is expected to play in regulation. If the element is being tested for
promoter activity, it is placed immediately upstream of the reporter gene. If the
element is suspected of being an enhancer, a weak promoter that needs an
enhancer to drive expression is placed immediately upstream of the reporter gene
and the element to be tested is placed either upstream or downstream of the
promoter-gene construct. If the element is a silencer, the weak promoter is
replaced by a strong promoter that is sufficient to drive ubiquitous expression. If
the element to be tested is an insulator, it is placed between a well characterized
enhancer–promoter pair, upstream of the reporter gene (Fig. 1.6).
Assay based techniques are laborious, time consuming and expensive that is why
scientist devised high-throughput techniques like ChIP-seq, DNAse-seq,
epigenomics marks etc. These experiments are used to determine the genomic
sequences bound by a particular protein in vivo. The protein of interest is cross-
linked to the chromatin in the cells, which are then lysed and the DNA is sheared
into pieces of desired size. Using an antibody specific to the protein of interest,
protein–DNA complexes are precipitated from the mixture. The identity of DNA
regions that are part of the complex can be determined either by using
microarrays (ChIP-chip) or by high-throughput sequencing (ChIP-seq). After that
these sequence reads are aligned to respective reference genomes to draw genome
wide maps of binding regions for particular protein. A major advantage of this
technology is that the whole genome is tested for in vivo binding of the protein of

Chapter1 –Introduction
17
interest. Also, this method can detect different kinds of regulatory elements
depending on the function of the profiled protein.
Figure1. 6 Functional assays that measure transcriptional regulatory element activity.
(a) To assay core promoter activity, the genomic segment to be tested (light blue) is cloned into a
plasmid, immediately upstream of a reporter gene that lacks an endogenous promoter. (b–d)
Proximal promoters, enhancers, and silencers can be assayed by similar methods, when the
genomic segment is cloned upstream of a reporter gene driven by an appropriate promoter. (e)
Insulator enhancer-blocking activity can be measured using a plasmid-based assay that monitors
the ability of a cloned insulator to interfere with enhancer-promoter communication, whereas
methods that measure heterochromatin-barrier activity require a transgenic reporter assay to
determine the ability of the insulator to shield the transgene from repressive effects of
heterochromatin. ( f ) The ability of a locus control region to overcome position effects and confer
proper spatial and/or temporal expression is measured by transgenic reporter assay. (Adopted
from (Maston, et al., 2006)

Chapter1 –Introduction
18
1.4.2. Computational approaches towards identifying regulatory
elements
A number of bioinformatics approaches can be used for ab-initio identification of
previously unidentified upstream transcriptional regulatory elements. Classically,
an un-annotated sequence can be scanned for sequence motifs that match known
TFBSs, which have been experimentally identified from other
promoters/regulatory sites (Wang, Zhang, & Zhang, 2013).
1.4.3. Comparative approaches to identify regulatory elements
The availability of human and other vertebrate genomes has opened new horizon
for discovering the regulatory elements using comparative genomics approach.
Comparative genomics is an efficient approach for the identification of regulatory
elements based on the assumption that sequences of functional importance are
under negative selection pressure and evolve slowly compared to non-functional
elements (Woolfe & Elgar, 2008). Thus comparative genome analysis can be used
to identify conserved non-coding elements acting as transcriptional enhancers
during development(Visel, Bristow, & Pennacchio, 2007).
1.5. TF-TF co-operativity and Cis-regulatory modules
With advances in experimental approaches and diverse data resources, functional
genomics has begun to investigate the more complex, co-operative interactions
required by combinations of TFs to properly regulate spatiotemporal gene
expression.
Identifying the DNA sequences that are required for regulating gene expression
called cis-regulatory modules (CRMs) can expand our understanding about co-
operativity among different transcription factors to regulate tissue specific

Chapter1 –Introduction
19
expression. In core, CRMs provide a gallows for the congregation of specific
combinations of TFs, which in turn recruit various co-activators and co-
repressors in the development of certain tissue (Magdum, Banerjee, Murugan,
Doddabhimappa, & Ravikesavan, 2013)
1.6. Early trends to study gene regulation
Before the accessibility of the human and mouse reference genome sequences,
regulatory regions were normally found through trial and error, such as through
deconstructing BACs or functional assays as mentioned earlier. Then occurrence
of evolutionary sequence conservation (homology across species) or constraint
(relative local sequence conservation across evolution)(Cooper et al., 2005;
Frazer, Pachter, Poliakov, Rubin, & Dubchak, 2004; Ovcharenko, Nobrega,
Loots, & Stubbs, 2004; Prabhakar et al., 2006; Schwartz et al., 2000; Siepel et
al., 2005) along with the functional screening via reporter assays (Pennacchio et
al., 2006) was used for formulating first genome wide catalogue of regulatory
elements. The mixture of trial and error and comparative genomics-guided
technique, led to the discovery of regulatory elements with activity in the
developing forebrain near genes including Arx, Dach1, Dlx1/2, Dlx5/6, Emx2,
Fezf2, Meis1, Otx1/2, Pax6, and Sox2 (Royo et al., 2012; Shim, Kwan, Li,
Lefebvre, & Sestan, 2012). These studies are considered as pioneers in the field
of transcriptional regulation. However, there are some drawbacks associated with
these methods. They are exhaustive in terms of effort and resources. With respect
to genome coverage they cover very short proportion of it. They are expected to
miss additional regulatory elements, particularly those far from the genes of
interest or lacking strong cross-species conservation. Many additional embryonic
brain enhancers have been identified via large-scale unguided genome-wide
screens of extremely conserved non-coding regions for sequences that drive
reporter gene expression at specific embryonic time points, with the results
available in the VISTA enhancer database (Visel, et al., 2007). This database
contains over 2,100 tested human and mouse sequences, over 1,100 of which

Chapter1 –Introduction
20
function as enhancers in vivo in embryonic mouse tissues with whole-mount
staining images available. The VISTA enhancer set includes over 350 annotated
to drive expression in the forebrain at embryonic day 11.5 (E11.5), and 147 of
these enhancers additionally include high-resolution images of developmental
brain sections that can be used to map the spatial activity of forebrain enhancers
(Visel et al., 2013).
1.7. Recent trends of epigenomic Approach to Study
Gene Regulation
Rapid expansion is observed in the catalogue of regulatory elements in
mammalian genomes after the development of advance techniques like next
generation sequencing and understanding of epigenomic marks. In single
experiment cost effective genome wide enrichment map get available through
sufficient sequence coverage in next generation sequencing technique. The
functional evidences about epigenomic marks come into view from early studies
in the area of cellular and chromatin biology, with bonus input from ENCODE
pilot studies (Birney et al., 2007). Current proxy signatures of regulatory element
activity and chromatin state include coactivator binding (e.g. p300), histone
modifications, binding of TFs or other DNA-associated proteins e.g ChIP-seq,
chromatin accessibility DNAse-seq, DNA methylation, and nongenic RNA
transcription. These signal based assay are used to spot and differentiate classes
of regulatory elements and thus to identify enhancers that are active in particular
cell lines or tissues. There are evidences for sequential chromatin modifications
that are associated with repressed, poised, and active enhancers (Creyghton et al.,
2010; Rada-Iglesias et al., 2011). For example, the histone modification
H3K27me3, can be pinpointing the repressed region whereas H3K27ac can be
associated with active enhancers (Creyghton, et al., 2010; Rada-Iglesias, et al.,
2011).

Chapter1 –Introduction
21
1.8. DNAse I Hypersensitive sites
Mapping DNase I hypersensitive (DHSs) sites is a valuable tool for identifying all
different types of regulatory elements Promoters, Enhancers, insulators etc.
Through this assay we can identify most active regulatory regions from
potentially any cell type from any species with a sequenced genome. DNAse I
selectively digest nucleosome-depleted DNA (presumably by transcription
factors) but unable to digest DNA regions tightly wrapped in nucleosome. This
remodeled state is necessary for the binding of proteins such as transcription
factors. This technique identifies DNase I HS sites across the whole genome by
capturing DNase-digested fragments, sequencing them by high-throughput next
generation sequencing and aligning them to respective reference genome
assembly (Noonan, 2009)
1.9. Role of transcription factors in forebrain
development
Many signaling pathways serve to activate the specific TFs that mark the
molecular territory of different domains of forebrain within ANP. These TFs that
are implicated in specification and differentiation of various domains of forebrain
can be categorized in different groups based on their expression pattern, ranging
from genes expressed in neuroectoderm or to genes that have expression in
particular domains only. Thus at a given time, any particular forebrain domain
may be regulated by distinct set of TFs which offer differential competence in
order to respond to the different regulators. Sometimes extensively expressed
genes show a restricted distinct sub-domains pattern as development progress. For
example, TFs that belong to SoxB1 subfamily play an essential role in the
development of neural plate but the combined inactivation of Sox2, Sox3 and
Sox19 damages the forebrain development in zebrafish while knock-down of
Sox2 alone affects the secondary prosencephalon. Inactivations of TFs that show

Chapter1 –Introduction
22
regionally restricted expression pattern like Emx1/2, Nkx2.1and Rx affect their
specification domain like telencephalon, hypothalamus and eye respectively.
Similarly, inactivation of Otx2 or Six3 which are widely expressed in ANP,
results in loss of anterior brain structures (Beccari, Marco-Ferreres, & Bovolenta,
2013).
Hesx1, a homeobox gene which has been identified in many vertebrates
including human, chicken and zebrafish. Expression pattern of this gene has been
observed in embryo during gastrulation. RNA in situ hybridization analysis
showed that Hesx1 is essential for normal forebrain and pituitary formation
during mouse embryogenesis(Martinez-Barbera, Rodriguez, & Beddington,
2000). Similarly Fezf2 also called as Fezl, ZNF312, or Zfp312, is an
evolutionarily conserved zinc finger protein crucial for neuronal development in
zebrafish(Shimizu & Hibi, 2009). It has also been documented that Fezf2 is
important for the development of neurons in the ventral forebrain of
zebrafish(Yang, Dong, & Guo, 2012).
Similarly many members of Zic family of zinc finger TFs are involved in many
different developmental processes including skeletal patterning and
neurogenesis. In case of neural development, Zic1 and Zic3 are important TFs as
they are expressed in the dorsal and ventro medial telencephalon(Inoue, Ota,
Ogawa, Mikoshiba, & Aruga, 2007) . Foxg1 is the earliest TF to be expressed in
that region from where telencephalon originates. It has been proposed that
embryos lacking Foxg1 have lower telencephalic expression of two important
signaling molecules (Fgf8 and Shh) i.e. they are necessary for the specification
of ventral telencephalic cell types. It suggests that absence of these molecules
may be responsible for the absence of ventral telencephalon in Foxg1 null
embryos. However, it has been demonstrated that in the absence of Foxg1, many
components of the Shh and Fgf8 signaling pathways continue to function and
that Foxg1 acts independently in the telencephalon to make sure that cells adopt
the ventral telencephalic identities (Manuel et al., 2010).

Chapter1 –Introduction
23
These developmental changes which give rise to stereotypically patterns to
embryos are driven by precise spatiotemporal domains of gene expression. These
coordinated expression patterns are regulated mainly through the process of
transcription. But questions about how different genes function in well-organized
manner, as well as how their spatial/temporal expression patterns are achieved at
both the cellular and organismal level are yet to elucidate. In order to decipher
the molecular mechanism that is responsible for different expression patterns, it
is necessary to pinpoint the transcriptional regulatory elements related with each
predicted gene. Moreover, identification of such elements is a crucial step for
decoding the mechanism by which gene expression is altered in pathological
conditions. Therefore, one of the major task for genomics research is to find the
functional non-coding elements in the genome, including those that contribute
towards gene expression (Maston, et al., 2006).
Genome wide expression analysis help to identify the transcriptional regulatory
regions that serve as starting point for exploring the transcriptional regulation
mechanism of human genes and provide information regarding the
spatial/temporal expression patterns of genes.
1.10. Aim of study
Several high throughput studies have identified the regulatory potential of CNEs.
To analyze the ability of human enhancers to drive tissue specific expression
during embryogenesis Pennacchio and coworkers (2006 & 2008) carried out in
vivo enhancer analysis of computationally defined candidate elements in
transgenic mice assay to experimentally validate the regulatory potential of these
enhancers (Pennacchio, et al., 2006; Visel, et al., 2007)(Fig. 1.7).
The candidate elements were identified either by their conservation between
human and non mammal vertebrates across long (chicken or frog) or extremely

Chapter1 –Introduction
24
long (pufferfish and zebrafish) evolutionary distances (Visel, Alvarez-Bolado,
Thaller, & Eichele, 2006) or ultraconserved elements (elements that are ~200bp
in length and 100% identical between human and mouse) (Bejerano et al., 2004).
These elements are then experimentally tested for their regulatory potential in
mice assays. The results of enhancer screens are complied in the form of database
on Enhancer Browser(Visel, et al., 2006). After the identification of enhancer
next step to understand the process of transcriptional regulation is to associate
enhancer with the gene whose expression is regulated by this enhancer. Enhancers
may be located within the introns of the genes they are regulating, upstream of the
gene, downstream or may be located at a greater distance from the gene and
interact by looping out the intervening DNA. Pennachio and coworkers simply
associated these CNE-enhancers with the most closely positioned flanking genes
(intergenic CNE-enhancers) or the genes within which these CNE-enhancers
resides (intragenic) (Pennacchio, et al., 2006).
The intention behind this research is to verify the association of CNE-enhancers
with their target genes proposed by the Pennacchio we devised a systematic
procedure which is based on two types of analysis (i) comparative genic
architecher analysis of the othologous loci, harboring the CNE-enhancer, in
tetrapod-teleost lineages (ii) endogenous expression pattern analysis of both, the
putative target gene and the CNE-enhancer. We picked out 192 Human CNEs
from Vista Enhancer browser (http://enhancer.lbl.gov/) to associate them with
their target genes.
We tried to be more specific and precise in the next part of this study. We
focused on the 104 CNE-enhancer from vista enhancer browser which are
exclusively expressing in forebrain. By combining the computational and
experimental data we devised a pipeline to hunt for TF-TF co-operativity among
this forebrain specific enhancers.

Chapter1 –Introduction
25
Figure1. 7 Flow-chart of combination of comparative and functional approach to
hunt for regulatory elements.
Flow-chart of strategy that couples comparative genomic conservation to a moderate
throughput mouse transgenic enhancer screen. Conserved noncoding elements can be PCR
amplified, cloned, microinjected, and assayed for enhancer activity at e11.5 in less than 3
weeks.

Chapter1 –Introduction
26
To achieve above mentioned targets we performed following steps:
Assigning target genes to 192 CNE-enhancer through comparative
syntenic analysis among human and teleost fishes.
Transcription factor analysis of 159 CNE-enhancers out of 192 that are
expressing in CNS (central nervous system).
Approximating range of action of CNE-enhancers governing the
expression of their target genes.
Extent of CNE-enhancer duplication in vertebrate lineage.
Defining forebrain specificity of an CNE-enhancer
Formulating repertoire of 93 TFs involved in the prototyping of
forebrain through extensive literature survey.
Identified binding motifs in 104 forebrain specific human
enhancers(FSHEs) for 93 TFs by the use of Clover and F-seq
Short listed the binding motifs by selecting only those predicted by the
both software.
Performed PCA analysis to find cluster of interacting TFs involved in
prototyping of forebrain.
.

Chapter2 –Materials and Methods
27
MATERIALS AND METHODS
One of the major and important parts of the dark matter, which is under purifying
selection, is highly conserved non-coding elements (CNEs) in human genome.
Certain genomic region even contains arrays of highly conserved non-coding
regulatory elements (HCNEs) clustered around developmental regulatory genes
(Kikuta et al., 2007). Due to positive selection pressure these elements are
believed to regulate the spatial and temporal expression of target genes, thus
presumed to be cis-regulatory elements (CREs). To confirm their cis-regulatory
nature through studies have been conducted up till now. One of the contributions
is of Pennachio and coworkers. They first of all identified a set of 2,614 putative
gene regulatory elements, which also included 91% (234 out of 256) of non
exonic ultra-conserved elements, by the use of extreme evolutionary sequence
conservation. To test whether such apparent equivalence at the sequence level is
also associated with similar functional properties they executed total of
231(having 245 ultra-conserved and 206 extremely conserved elements) high
through put transgenic mice assay during embryonic development. Through this
they experimentally confirmed 115/245 ultra-conserved and 102/206 extremely
conserved elements as gene regulatory elements. After that they associated these
identified cis-regulatory elements with most closely located flanking genes
(intergenic CNE-enhancers) or the genes within which these CNE-enhancers
resides (intragenic) (Pennacchio, et al., 2006).
To verify the association of CNE-enhancers with target genes proposed by the
Pennacchio we investigated systematically the connection between the subset of
these CNE_enhancers and target genes. For this we at first step applied
comparative genic architecher analysis of the othologous loci, harboring the

Chapter2 –Materials and Methods
28
CNE-enhancer, in tetrapod-teleost lineages then performed the endogenous
expression pattern analysis of both, the putative target gene and the CNE-
enhancer. The candidate target genes fulfilling both criteria (i) extreme
evolutionary conservation along with the CNE-enhancer (ii) Co-localization of
expression pattern with that of CNE-enhancer. Most of our candidate regulatory
elements could be assigned to individual genes, even when analyzing a total of
2Mb of upstream and downstream genomic sequence. For some elements our
analysis reaffirms Pennacchio’s suggestion but many of the elements are proved
to regulate the expression pattern of the genes present not at the closest proximity
of CNE enhancer as prescribed by Pennacchio. We found target genes of few
CNE-enhancer elements are even positioned more than 1Mb away from these
elements and intervening genomic region between the CNE-enhancer elements
and target genes harbor many bystander genes, which are not specifically under
the control of regulatory elements that derive the target genes, forming genomic
regulatory blocks (GRBs).Loss of bystander genes in GRBs in human-teleost
genomes permits target gene identification and HCNE/target gene assignment.
Extending this research we also defined forebrain specificity of forebrain
enhancers in terms of co-occurring TFs. We devised a pipeline that make use of
computational (statistical overrepresentation of motif) as well as experimental
information (DNAse hypersensitive sites DHSs) to hunt for heterotypic clustering
of TFBS of TFs that play important role in prototyping of forebrain.
2.1. Detection of synteny blocks between human and
teleost fishes
Conserved synteny, the maintenance of gene linkage on chromosomes of different
species, is a prominent feature of vertebrate genome (Kikuta, et al., 2007).
Fundamental concept behind this approach is same as of Phylogenetic foot
printing (a technique used to dig out highly conserved genomic patches within a
Chapter2 –Materials and Methods
29
non-coding region of DNA of interest by comparing it to the orthologous
sequence in different species).
Vista Enhancer browser (http://enhancer.lbl.gov/) used for collecting raw data is
basically an enhancer browser database. There are two types of data found at this
site. They are (1) an "Experimental Dataset" of conserved noncoding human
sequences which have been tested for enhancer activity in transgenic mice and (2)
a "Computational Dataset" of whole human genome conserved noncoding
elements based on maximizing constraint in human-mouse-rat genome
comparisons (Prabhakar, et al., 2006).To carryout comparative syntenic analysis
we takeout a subset of 62 human CNE-enhancer elements from “Experimental
Dataset" To explore Human CNE-enhancer paralogues and orthologous in teleost
fishes genome, we practiced phylogenetic foot printing using Ensemble and
UCSC genome browsers. Paralogus of CNE-enhancer, if present in any one of the
above mentioned genome, are also taken into account and are considered as
duplication of loci harboring CNE-enhancer. Orthologous and paralogous loci,
upto 2Mb upstream and downstream of CNE-enhancer, are compared in human
and teleost fishes and are checked for the occurrence of gene/genes that is/are
present in all the compared loci. These genes are proposed as putative targets for
the CNE-enhancer element. Further analysis is then carried out on these genes.
2.2. Investigating endogenous expression patterns
MGI (http://www.informatics.jax.org/) includes Gene Expression Database
(GXD) Project. GXD integrates different types of gene expression information
from the mouse and provides a searchable index of published experiments on
endogenous gene expression during development. Random endogenous
expression pattern of the mouse ortholog of human putative target gene is
obtained from MGI. We preferred gene expression obtained by RNA in-situ
hybridization (technique that is used to identify the spatial pattern of expression
of a particular transcript). Reporter gene expression induced by the selected CNE-

Chapter2 –Materials and Methods
30
enhancer is captured from the vista enhancer browser database. Investigation is
then carried out to check the accordance in the expression pattern of both the
putative target gene and the CNE-enhancer element.
2.3. Molecular function assignment to the CNE-enhancer
flanking genes and putative target genes
Molecular function of flanking genes of the CNE-enhancer and putative target
genes are retrieved from MGI Gene Ontology (GO) Project which seeks to
provide controlled vocabularies for the description of the molecular functions and
biological processes.
2.4. Assigning the target gene to human CNE-enhancer
Two factors, on the basis of which we can identify the specific gene, regulated by
the particular CNE-enhnacer, are (1) Comparative syntenic analysis (2)
Endogenous expression pattern analysis. If expression pattern of putative target
gene (conserved throughout the vertebrate genome) is co localized with the
reporter gene expression of enhancer then the CNE-enhancer is the cis-regulatory
element for that gene. If there is more than one gene that shows extreme
evolutionary conservation in human-teleost lineages and having expression
pattern in accordance with reporter gene expression of enhancer then they all are
thought to be target genes of CNE-enhancer element
2.5. Transcription factor analysis
To investigate the brain specific transcription factors, we performed transcription
factor analysis. Transcription factors are basically proteins having DNA binding
domain and get append to DNA at transcription factor binding sites
(TFBS).Transcription factor binding site is basically a sequence of 6-12 base pairs
and is degenerate in nature i.e. considerable sequence variation between

Chapter2 –Materials and Methods
31
functional binding sites is tolerated by TFs. Enhancers are typically composed of
a relatively closely grouped cluster of TFBSs that work cooperatively to enhance
transcription (Maston, et al., 2006). On average four to eight different TFs bind
within an enhancer and each factor can bind to multiple sites within it (Bulyk,
2003).
ConSite is a user-friendly, web-based tool for finding cis-regulatory elements in
genomic sequences. Predictions are based on the integration of binding site
prediction generated with high-quality transcription factor models and cross-
species comparison filtering (phylogenetic footprinting)(Sandelin, Wasserman,
& Lenhard, 2004).Human CNE-enhancer sequence and its ortholog in mouse are
aligned to search out conserved TFBSs. ConSite employs ORCA aligner (a
progressive global alignment program optimized for non-coding genomic
sequences). The ‘degree of conservation’ is calculated by sliding a window of a
user-defined width over the alignment. In each window location, the percentage
of identical nucleotides is calculated, only those windows with Wi exceeding an
identity threshold I (typically 70–80%) are retained for further TFBS analysis
(Sandelin, et al., 2004). Profile compilation of the aligned sequences is drawn
from JSPAR, non redundant and open access database. To estimate possible
binding sites in an input sequence position weight matrices (PWMs) are
generated from these profiles. ConSite retains only those sites that (i) have a site
score S > c (a user-adjustable TFBS detection threshold), (ii) and are found in
window where Wi > I (as defined above), (iii) and have a predicted site in the
other input sequence in corresponding position, subjected to constraints (i) and
(ii)(Sandelin, et al., 2004).
2.6. Genomic radius calculation
The genomic radius for activity of cis-regulatory elements is an important aspect
of their mechanism and is vital for understanding eukaryotic transcription and
human genetic disorders (Vavouri, McEwen, Woolfe, Gilks, & Elgar, 2006). To

Chapter2 –Materials and Methods
32
estimate the percentage of CNE-enhancer elements whose target gene lies within
the ranges e.g. 0-200kb, 201-400kb, 401-600, 601-999 and even >1Mb, we have
calculated the distance between the CNE and its assigned gene. The more
appropriate genomic range to analyze would be up to ~0.5-1Mb upstream and
downstream of the gene, although there might still be a small fraction of
potential regulatory elements that are further away. This enables us to provide
systematic estimate of the genomic range for distal cis-regulatory interactions in
the human genome. Data is represented by the help of pi chart illustrating the
over all distribution of target genes around their regulatory elements.
2.7. CNE duplication and retention in human and teleost
fishes
If evolutionary constraint acted on an area through long-range regulatory
elements, resulting in an extended conserved domain including neighboring
genes, this constraint might be expected to be relaxed upon duplication, and
changes might be detected in both gene retention and the preservation of HCNEs
after GRB duplication(Kikuta, et al., 2007). Genomic loci bearing CNE-
enhancer element sometimes undergoes duplication. We analyzed whether
duplication occurred before the divergence of fishes from tetrapods and even it
is retained in human or not, or duplication event occurred after the divergence of
fishes from tetrapods. In this way we approximated the proportion of
unduplicated CNEs, CNEs duplicated only in fish, only in human, those that
contains two copies of enhancers in both fish and human lineages and CNEs
containing three copies in human and fish genomes. We than represented the
obtained data in pie chart to have a quick overview of rate of duplications in
both lineages.
Chapter2 –Materials and Methods
33
2.8. Defining Forebrain transcription factor code
Human brain is three times larger expected in a primate of comparable size. The
parts of the brain that have grown the most in human beings are in the neocortex,
and more specifically the prefrontal cortex. Human higher cognition is attributed
to the evolutionary expansion and elaboration of the human cerebral cortex.
Therefore, in second part of study we decided to narrow down our research to
forebrain instead of central nervous system. Spatiotemporal genic expression
defining the cell fate is driven by the cell-specific activation of DNA regulatory
elements. Forebrain development and function is regulated by transcriptional
circuitry. Cell type-specific TF networks control regionalization within the
embryonic brain. Capturing of epigenetic marks and high- throughput sequencing
resulted in the identification of regulatory elements through the genome.
Current proxy signatures of regulatory element activity and chromatin state
include co-activator binding (e.g. p300), histone modifications, binding of TFs or
other DNA-associated proteins (ChIP-seq), chromatin accessibility (DNAse-seq),
DNA methylation etc. We focused on human cortex specific epigenetic marks to
investigate cis-regulatory elements involved in forebrain development and tried to
draw a conclusive TF TF co-occupancy network involved in forebrain
development.
2. 8.1. Invivo Data Sets
To codify forebrain specific transcriptional factor (TF) code we compiled
Training sequences: an archive of empirically documented forebrain
specific human enhancers (FSHEs) from Vista Enhancer browser (a
catalog of experimental in vivo data of human and mouse tissue specific
enhancers) (Data File S1).
Mouse orthologs for FSHEs from UCSC.

Chapter2 –Materials and Methods
34
Control sequences: 100 human non coding non conserved
sequences(NCNCS) from UCSC.(Data File S2)
DNAse hyper sensitive sites (DHSs) map of human genome for 3 different
cell lines (i) GM12878 (ii) Frontal cortex-OC (iii) Cerebrum-frontal-OC.
An exhaustive list of 93 transcription factors, through extensive literature
survey, which enact imperatively in forebrain ontogeny during early
embryonic stages.
Binding profiles of these 93 forebrain TFs from JASPAR and Transfac.
2.8.2. Pipeline Assembly
In order to hunt for the heterotypic co-operation of those TFs that define distinct
domains of forebrain we employed two different strategies on FSHEs and
NCNCs concurrently. Each strategy incorporates execution script controlling the
input, output, format conversion and combination of results for a number of
distinct software units. A network of scripts and existing programs operate the
jobs required to accomplish each stage of analysis
2.8.3. First strategy
Many of the in-silico predicted binding sites are non functional due to their low
specificity (short and degenerate). In order to discriminate functional binding sites
from specious motifs our first approach was the integration of computational
information along with the experimental evidences for the prediction of
transcription factor binding sites (TFBSs).
2.8.3.1. Motif Discovery
The first and foremost step in this strategy is to predict candidate TFBS of these
93 TFs in FSHEs/NCNCs computationally. To perform this task we used two
different programs CLOVER, a method to screen a set of DNA sequences against
a precompiled library of motifs, and select the motifs which are statistically over-
represented in the sequences, and F-Seq, a software package that generates a

Chapter2 –Materials and Methods
35
continuous tag sequence density estimation to predict binding sites (Fig. 2.2).
CLOVER first calculate raw score (degree of motif’s presence in test sequences)
and then computes P-value for this raw score on the basis of background
sequences. If the P-value is very low (e.g. <0.01), the motif is significantly
overrepresented in the test sequences, suggesting that it is present for a reason,
such as to perform a biological function. If the P-value is very high (e.g. >0.99) it
is under-represented in the test sequences, suggesting that it is absent for some
good reason, perhaps because its presence in these sequences would be harmful to
the organism (Frith et al., 2004). Clover generated the list of TFBSs in each of
FSHEs /NCNCS.
In general biologically relevant features (binding sites) reside in the regions of
dense sequence reads(Boyle, Guinney, Crawford, & Furey, 2008), that’s why we
used F-seq for the prediction of binding sites on the basis of DNAse-seq (high
throughput sequence technology generating short sequence reads). For this
DNAse hyper sensitive sites (DHSs) map of human genome for 3 different cell
lines (i) GM12878 (ii) Frontal cortex-OC (iii) Cerebrum-frontal-OC were
downloaded from the ENCODE website
(http:/genome.ucsc.edu/ENCODE/downloads.html) in bam format. F-Seq (Boyle,
et al., 2008) accepts input in bed format therefore we converted bam format files
to bed format using bedTools. After that we extracted DHSs map for our FSHEs
/NCNCS from whole genome DHSs map of each of the three cell lines and fed
them to F-Seq one by one. F-Seq generated bed format output files having
discrete scored reads (binding sites) for FSHEs /NCNCs by employing kernel
density estimation for every single input files.
2.8.3.2. Filtering the two outputs
After having list of putative binding sites from two different programs we
preferred those ones which are predicted by both the programs in order to have an

Chapter2 –Materials and Methods
36
accurate prediction of binding sites (Fig. 2.2). We converted this list into the
matrix of frequency of occurrence of preferred TFBSs in all the FSHEs /NCNCs.
2.8.4. Second strategy
2.8.4.1. Sequence Alignment
Human and mouse ortholog sequences are aligned by EMBOSS Needle
(http://www.ebi.ac.uk/Tools/psa/emboss_needle/nucleotide.html) alignment tool,
a Needleman-Wunsch based global alignment program that finds the optimal
alignment along the entire length of given sequences (Fig. 2.2).
2.8.4.2. Algorithm design
On contrary to our CLOVER and F-Seq based approach, here putative TFBS are
identified on the basis of their consensus sequences that were retrieved from
TRANSFAC(Wingender, 2008) and a few were retrieved from literature research.
A regular expression based algorithm was developed that scans the given
sequences for the detection of putative forebrain specific TFBSs (Fig. 2.2).
2.8.4.3. Phylogenetic foot-printing between human-mouse sequences
Because of degeneracy and the short sequence length of TFBS, many TFBS have
been detected in large genomic sequences. But only few of them are really
functional while majority of predicted TFBSs are non-functional or give false
positive results. Thus, comparative genomics have proved to be an effective
attempt to identify putative functional elements in non-coding DNA. Therefore in
our designed algorithm only those TFBS are considered to be true positives that
are conserved between human-mouse sequences. A true positive (TP) motif is
defined as a human motif that matches the TRANSFAC consensus sequence and
that occur in a region that can be aligned on mouse instance. A false positive (FP)
is a human motif that matches the TRANSFAC consensus sequence but that is
detected in a region that does not align on mouse instance. In contrast, a false

Chapter2 –Materials and Methods
37
negative (FN) is a mouse motif that matches the TRANSFAC consensus sequence
but does not align on human instance (Fig2.1). Using this rigorous criterion, only
true positive matches are listed in the form data matri and are considered for
further analysis.
Figure2. 1 Human-Mouse alignment highlighting TF, FP and FN motifs in CNE_170
As depicted in figure, two true positives have been spotted i.e. Gata2 (NNNGATRNNN) and Sox5
(TTGTTTN) in human and mouse CNE_170. These true positives have been identified on the basis
of conservation between human-mouse CNE sequences. Similarly one false positive (CACNAG
(Hes5)) and one false negative (AATTAN (Dlx5)) have been detected in human and mouse CNEs
respectively.
2.8.5. PCA
This data matrix made the basis to identify heterotypic clustering (The co-
occurrence of distinct TFBSs) in human forebrain specific enhancers. To
categorize cluster of co-occurring TFBSs in human forebrain specific enhancers
we applied principal component analysis(Dien, 2012) a powerful multivariate
exploratory tool used to identify patterns in specifically high (P) dimension,

Chapter2 –Materials and Methods
38
interrelated data sets and express the data sets by highlighting their similarities
and differences (Parveen et al., 2013).
PCA generated 3D graphical representation of the first three PCs (capturing most
of the variation in the data set) identifies the cluster structure present in the
variables (the TFs), exhibiting the co-occurring pattern of TFs in the control and
training data sets. These PCs (loadings) are derived by the eigen analysis of
correlation matrix (R = [rij]). The magnitude of these loadings defines the
variables (TFs) fate, whether lying within the cluster’s territory or not.

Chapter2 –Materials and Methods
39
Figure2. 2 Flow chart for defining forebrain TF code.
This figure explain the flow of data among different softwares and databases for defining
forebrain TF code.

Chapter3-Results
40
RESULTS
3.1. Comparitve Syntenic Analysis
The sudden wealth of biological data has allowed whole genome alignments to
compare and contrast the evolution and content of vertebrate genomes, and has
identified pockets of DNA sequences conserved over evolutionary time and such
evolutionary conservation has been a powerful guide in sorting functional from
non-functional DNA(Duret & Bucher, 1997; Hardison, 2000; Hardison, Oeltjen,
& Miller, 1997; Loots et al., 2000). Comparison of human genome with other
multiple vertebrate genomes suggested that our genome is littered with
conserved non-coding regions located in vicinity of genes involved in early
development. Extensive sequence similarity implies functional significance of
these highly conserved non-coding elements. Sequence conservation proved to
be a guide for the identification of regulatory elements through “Phylogenetic
footprinting” and its experimental verification is achieved by reporter gene
assay.
3.1. 1. Assigning target gene to functionally defined CNEs
We devised a rule-based procedure to associate CNE-enhancers with their
respective target gene (see methods). The human CNE-enhancers opted for this
purpose are conserved down to teleost lineage and are confirmed for their
enhancer activity through transgenic mice assay by Pennachio and coworkers
(Pennacchio, et al., 2006). Combined employment of comparative genomics and
expression pattern analysis has led us to explicitly assign these enhancers to their
target genes.
We concentrate on deeply conserved human enhancers; by restricting to 192/893
cis-regulatory regions that show sequence conservation down to teleost fish
Chapter3-Results
41
lineage (Table 3.1 and Table 3.2).Assuming that syntenic relationship between
an enhancer and concerned target gene remains preserved subsequent to
speciation (orthologous loci) and duplication events (paralogous loci) (Vavouri,
et al., 2006). We associated explicitly 85/192 enhancers to single target gene
(Table 3.1 and Table 3.2). In most of the cases more than one gene maintained
conserved linkage (human-teleost fish orthologous loci) with single enhancer. In
such cases the pattern of reporter expression induced by an enhancer was
compared manually (via images) with the reported endogenous expression
pattern of syntenically conserved genes to establish the enhancer-gene
relationship. This strategy assisted further in assigning the activity of 57/192
enhancers to single gene, 43/192 enhancers to 2 target genes and 7/192
enhancers to 3 target genes (Table 3.1). Below is the detailed explanation of
assigning the CNE-enhancers to their target genes through comparative and
expression pattern analysis.

Chapter3-Results
42
Table 3. 1 The association of the human CNE-enhancers with their target gene
This table provides the following information about human CNE-enhancers.
(i) The number of target genes associated with each CNE-enhancer analyzed.
(ii) Whether they are duplicated or not.
(iii) Their association with target gene is supported by either syntenic analysis or by
endogenous expression analysis or by both.
* Expression pattern is not known.
MGI: Mouse Genome Informatics.
CNE: Conserved non-coding element.
Teleost fish are preferred for syntenic comparison because syntenic comparison
of human with closely related vertebrate species (mammals) depicts the
conservation of large number of genes in the vicinity of the CNE-enhancer of
No. of
enhancers
No. of target
genes
Technique used
Paralogy Ortrhology
mapping mapping
Minimal evidence for
association
synteny
Only synteny along with
expression
29 1 √ √
√ -
2 2 √ √
- √
1 1 √ √
- √
1 1 √ √
√ *
41 2 - √ - √
7 3 - √ - √
44 1 - √ √ -
56 1 - √ - √
1 1 - √ √ *

Chapter3-Results
43
interest which may hinders the association of an enhancer element with its
precise target gene. But when we increase the depth of synteny comparison down
till the teleost fish, it became evident that most of the time only a single gene is
conserved along with the CNE in fish thus proposing it as a target gene for the
CNE-enhancer (Figure 3.1). For instance, in case of human CNE_SP8-SP4 the
paralogous genes SP4 and SP8 revealed conserved syntenic association with this
CNE-enhancer down to amphibian lineage (Figure 3.1A). Furthermore, the
reported endogenous expression pattern of both of these genes showed
correspondence with that of the CNE-enhancer induced LacZ expression in
transgenic mice assay (Figure 3.1A). Thus tetrapod specific comparative
syntenic analysis of this human locus and reported endogenous expression
pattern comparison failed to assign clear-cut target gene to CNE_SP8-SP4.
However, when teleost fish are added in syntenic comparison, loss of SP4 from
the corresponding fish loci clearly advocate that SP8 gene is an evolutionarily
conserved target of this human CNE-enhancer (Figure 3.1B). By using this
systematic methodology we pinpointed specific target genes for the total of 192
human CNE-enhancer elements (Table 3.1, Table 3.2).

Chapter3-Results
44
Figure 3. 1 Target gene identification of human CNE-enhancers through orthology
mapping.
Extreme evolutionary conservation and spatio-temporal expression analysis of CNEs and their
neighboring genes lead to association of CNE enhancers to their respective genes. (A)
Comparative syntenic analysis of human and amphibian depicts the conservation of both the
paralogues SP4 (blue) and SP8 (purple) in the nearest vicinity of the CNE (green). Analogy in the
expression pattern of the CNE and both of these paralogues suggest the association of this CNE-
enhancer with both SP4 and SP8 gene. (B) When we increased the depth of our syntenic
comparison up till the fish it became evident that only SP8 is conserved along with the CNE-
enhancer in fish proposing it as a target gene for the human CNE-enhancer. Genes are color-
coded. Direction of arrow depicts the direction of gene transcription. Light green vertical line
depicts the position of CNE-enhancer. Horizontal black line depicts scale.
Gene duplication is thought to be a major driving force in evolutionary innovation
by providing material from which novel gene functions and expression patterns
may arise (Woolfe & Elgar, 2007). While estimating the duplication pattern of
examined CNE-enhancers we have found that 17/192 (8.85%) of our examined
subset of CNE-enhancers have duplicated copies in both teleost fish and tetrapod
representatives. 20/192 (10.42%) have duplicated copies only in teleost fish

Chapter3-Results
45
representatives whereas 6/192 (3.12%) CNE-enhancers have duplicated copies
only in human (Figure 3.2A). Duplicated CNEs provided us an opportunity to
unambiguously associate the total of 42/192 human enhancers to their respective
target gene only on the basis of synteny comparison (Table 3.1), because a gene
undergoes duplication with all of its cis-regulatory elements making genomic
regulatory blocks (GRBs) which also harbor some bystander genes which get
depleted from GRBs over evolutionary time. Thus only duplicated enhancers
retained with paralogous copies of their target genes.
Figure 3. 2 Human CNE-enhancers duplication history and their genomic range of
action.
(A) The above figure represents the extent of duplication of our selected subset of
enhancers (192 enhancers in total). The majority of our selected enhancers are
unduplicated. About 10% of the enhancers have duplicated copies only in teleost fishes,
9% are duplicated before teleost-tetrapod split and 3% enhancers have duplicated copies
Chapter3-Results
46
only in human/tetrapod. (B) This figure represents the distribution of distances between
CNE-enhancer and its associated target gene to estimate the optimal distance at which
enhancer can interact with its associated gene. About 19% of enhancers are within the
introns of their predicted target gene bodies, 24% are within a range of 0-200kb, 17%
are at a distance of 201-400bp, 10% lie in the range of 401-600kb 14% lie in the range of
601-999kb and 16% of the enhancers are located at >1Mb from their target genes.
For instance, in a BLAST search of a CNE-enhancer residing on Homo sapiens
autosome 5(Hsa5) (158,273,540-158,275,189) significant hits were found on two
other human chromosomal locations, i.e. Hsa10 and Hsa20. While comparing the
loci architecture, 2Mb on each side of the CNE, we found that three putative
paralogous CNEs are syntenically linked with three paralogous genes of EBF
family, i.e. EBF1, EBF3, and EBF4 (Figure 3.3A). Resuming the analysis we
searched out orthologous counterparts of these human triplicated CNE-enhancers
in teleost fish genome (zebrafish, fugu, medaka and stickleback). Intriguingly,
like human genome this enhancer element was found to occur in multiple copies
in each of the teleost genome analyzed (Figure 3.3A). For instance, from two
copies in medaka to maximum of four copies in zebrafish are syntenically linked
to paralogous genes of EBF family (Figure 3.3A). Differential loss of bystander
genes like MGMT, IL128 and RNF from the CNE-EBF enhancer containing
orthologous and paralogous loci explicitly leads to the conclusion that this human
CNE- enhancer is controlling the spatio-temporal expression of EBF gene family
members (Figure 3. 3A).
Among the unduplicated set of CNE-enhancers (149/192) 45 regions were
assigned to a single target gene only on the basis of synteny comparison (Table
3.1, Table 3.2). For example, BLAST based search of a CNE-enhancer residing
on Hsa9 (17,322,200-17,324,371) identified putative orthologs of this human
interval in zebrafish, medaka, fugu, stickleback and tetraodon genomes (Figure
3B). Syntenic comparison revealed the differential loss of BNC2, C9orf39 and
FOXE1 genes from the corresponding loci suggesting them as bystanders,
whereas the SH3GL2 gene maintained its physical linkage with the CNE-

Chapter3-Results
47
enhancer in all examined genomes confirming it as the target gene of this cis-
regulatory site (Figure 3.3B).
Figure 3. 3 Analysis of genic environment of human CNE-enhancers in teleost fish orthologous
genomic intervals helps in identifying their target genes.
Gene, controlled by specific regulatory elements, are identified through the systematic analysis of
orthologous genomic content, which harbors functionally identified CNE enhancers, of tetrapod-
teleost lineages. (A) Comparing the genic content of CNE-EBF containing paralogous loci in
human genome and their orthologous loci in multiple fish lineages unmistakably suggests that
duplicated copies of human CNE-EBF enhancer are associated with the regulation of paralogous
copies of EBF family members, i.e. EBF1, EBF3 and EBF4. (B) By tracing the genomic content
around the CNE in tetrapod and fish lineages it becomes evident that the CNE is regulatory
element of SH3GL2.Redundant expression pattern of the gene and CNE is also in accordance with
each other.

Chapter3-Results
48
Very often the situation arose when syntenic comparison alone was not sufficient
to pinpoint single target because more than one gene were showing conserved
syntenic association with the CNE-enhancer elements in all the evaluated
genomes (Figure S1). In this situation, reporter expression pattern induced by
CNE-enhancer was compared manually (via images) with the reported
endogenous expression pattern of candidate neighboring genes. Analogy in the
expression pattern of CNE-enhancer and one of the many conserved genes solved
the puzzle (Table 3.1, Table S1). This strategy assisted us to assign a single target
gene to 56/149 unduplicated CNE-enhancers (Table 3.1). For instance, during the
syntenic comparison of the orthologous loci of human CNE-enhancer on Hsa9
(30,747,057-30,748,648), two genes TSHZ3 and ZNF536 are considered as
putative target genes because both of them showed conserved syntenic association
with the CNE-enhancer (Figure 3.4A). However, when expression pattern of
TSHZ3 and ZNF536 was monitored only ZNF536 showed harmony in expression
with that of the CNE-enhancer (Figure 3.4A).
In 48/149 unduplicated CNE-enhancers we noticed that more than one
syntenically conserved gene (2 or 3) are showing analogy in their expression
pattern with that of the CNE-enhancer. In this case, two or more genes are
declared as target for the relevant CNE-enhancer (Table 3.1). For instance, a
human CNE-enhancer on Has8 (80,874,361-80,876,746), revealed conserved
syntenic association with HEY1 and STMN2 in all the compared orthologous loci
(Figure 4B). Furthermore, reported endogenous expression pattern of both of
these genes matches with the reporter expression pattern induced by the CNE-
enhancer (Table S1). Therefore, we assigned both HEY1 and STMN2 as target
genes for this human enhancer region (Figure 3. 4B).

Chapter3-Results
49
Figure 3. 4 CNE-enhancer induced reporter expression was compared with the
reported endogenous expression of neighboring genes to find the target gene bodies
of human enhancers.
In those cases where comparative syntenic analysis alone was not sufficient to build
unambiguous associations among CNE-enhancers and their target gene bodies we
carefully compared the CNE-enhancer induced reporter expression pattern with the
reported endogenous expression pattern of neighboring genes to establish such
associations. (A) Both TSHZ3 and ZNF536 genes depict conserved syntenic
associations with a human CNE-enhancer residing upstream interval of human
ZNF536, suggesting either or both of these genes are under the regulatory control of
this enhancer region. However comparing the reporter expression induced by this
CNE-enhancer with the reported endogenous expression pattern

Chapter3-Results
50
3.1.2. Range of action of human cis-acting sites
After confirming the linkage of scrutinized subset of CNEs with their target genes
we performed genomic radius analysis which permits us to gauge the distance
limit over which an enhancer can act on its putative target gene. Distance between
the enhancer and its target gene is of significant importance because it is an
important aspect to understand regulatory mechanism of CNEs and there are also
several human genetic disorders that are associated with the disruption in the
genomic distance between enhancer and its associated genes(Vavouri, et al.,
2006). We have estimated the percentage of CNE-enhancer elements whose target
gene lies within the ranges, e.g. 0-200kb, 201-400kb, 401-600, 601-999 and even
>1Mb (Figure 3.2B). We also counted the number of CNEs positioned within the
intronic intervals of their target genes. About 36/192 (18.75%) of enhancers are
situated within the intronic interval of genes they regulate, 47/192 (24.48%) are
within a range of 0-200kb, 32/192 (16.67%) are at a distance of 201-400bp,
19/192 (9.89%) positioned at 401-600kb from their target gene, 27/192 (14.06%)
separated by a distance of 601-999kb from their target gene body. Intriguingly,
31/192 (16.14%) enhancers were found to act on their concerned gene body at a
distance of >1Mb (Figure 3.2B and Table S2). Out of these 31 long-range CNE-
enhancers 9 are positioned >1.5 Mb away from their target genes (Table S2). For
instance, comparative syntenic analysis of a human CNE-enhancer residing on
Chr5q14.3 (91,036,888-91,038,899) and comparison of reported endogenous
expression pattern of neighboring genes revealed that this cis-acting site regulates
the hindbrain specific expression of human NR2F1 gene from a distance of 1.9
Mb (Figure 3.5).

Chapter3-Results
51
Figure 3. 5 Human CNE-enhancers summary of genomic range of action and the
maximum range of action found is ~2Mb.
(A) This figure represents the distribution of distances between CNE-enhancer and its associated
target gene to estimate the optimal distance at which enhancer can interact with its associated
gene. About 19% of enhancers are within the introns of their predicted target gene bodies, 24%
are within a range of 0-200kb, 17% are at a distance of 201-400bp, 10% lie in the range of 401-
600kb 14% lie in the range of 601-999kb and 16% of the enhancers are located at >1Mb from
their target genes. (B) Evolutionarily conserved syntenic association between a CNE-enhancer
and human NR2F1 and harmony in their expression pattern domains in mice infers the functional
association among them. The distance between the transcription start site of human NR2F1 and
concerned cis-acting site is ~2 MB. Genes are color-coded. Direction of arrow depicts the
direction of gene transcription. Light green vertical line depicts the position of CNE-enhancer.
Horizontal black line depicts scale.

Chapter3-Results
52
Table 3. 2. CNE-Target gene assosiation.
S.No Name of human
enhancer Location
Reporter
expression induced
in transgenic mice
assay
Target gene
Support
from inter
& intra
genomic
conserved
synteny
Support
from MGI
Expression
data
1 CNE_APG4C-
FOXD3 Intergenic Neural tube FOXD3 √ √
2 CNE_BNC2(Intrag
enic)(CNTLN) Intragenic Hindbrain CNTLN √ √
3 CNE_BUB3-
GPR26 Intergenic Neural tube GPR26 √ √
4 CNE_C3orf14-
ZNF312 Intergenic Forebrain ZNF312 √ √
5 CNE_CDCA1-
PBX1 Intergenic
Hindbrain,
Midbrain PBX1 √ √
6 CNE_CENTG2 Intergenic Neural tube CENTG2/GB
X2* √ √
7 CNE_CLINT1-
EBF1 Intergenic Limb EBF1 √ √
8 CNE_DACH1(Intra
genic) Intragenic Hindbrain
DACH1 &
DACH2 √ √
9 CNE_DMRT1-
DMRT3 Intergenic Forebrain DMRT3 √ √
10 CNE_EBF(Intragen
ic) Intragenic Neural tube EBF √ √
11 CNE_EBF1(Intrage
nic) (LSM11) Intragenic
Cranial nerve, dorsal
root ganglion, brain,
spinal cord
EBF1 √ √
12 CNE_ELP4
(Intragenic)(PAX6) Intragenic
Midbrain, ventral
spinal cord, eye PAX6 √ √
13 CNE_EN2-PRR8 Intergenic Hindbrain, midbrain EN2 √ √
14 CNE_FAF1(Intrage
nic) Intragenic
Midbrain, ventral
spinal cord FAF1 √ √
15 CNE_FANCL-
BCL11A Intergenic
Limb, dorsal root
ganglion
FANCL/
BCL11A* √ √
16 CNE_FOXP1(Intra
genic) Intragenic Forebrain
FOXP1 &
FOXP2 √ √
17 CNE_GPD2-
GALNT5(ACVR1) Intergenic Midbrain ACVR1 √ √
18 CNE_GPR154-
TBX20(DPY19L1) Intergenic Facial mesenchyme DPY19L1 √ √
19 CNE_GPR180-
SOX21 Intergenic
Brain and spinal
cord SOX21 √ √
20 CNE_GSH1-IPF1 Intergenic Forebrain, midbrain,
hindbrain GSH1 √ √
21 CNE_HDAC9-
TWIST1 Intergenic Brain and limbs TWIST1 √ √
22 CNE_INSC-SOX6 Intergenic Forebrain SOX6 √ √
23 CNE_IRF8-FOXF1 Intergenic
Neural tube,
hindbrain, limb,
cranial nerve
FOXF1 √ √

Chapter3-Results
53
24 CNE_IRX6-MMP2 Intergenic Hindbrain, spinal
cord IRX6 √ √
25 CNE_KCNH7-
FIGN Intergenic Forebrain
KCNH7/FIG
N* √ √
26 CNE_KCNJ3-
NR4A2 Intergenic Forebrain
KCNJ3/NR4
A2* √ √
27 CNE_LMO4-PKN2 Intergenic Forebrain, limb LMO4 √ √
28 CNE_MAF-
DNCL2B(WWOX) Intergenic
Neural tube,
hindbrain, midbrain
MAF/WWOX
* √ √
29 CNE_MEIS1-
ETAA1(MEIS2) Intergenic
Internal organs,
hindbrain
MEIS1 &
MEIS 2 √ √
30 CNE_MEIS2(Intrag
enic) Intragenic Midbrain MEIS2 √ √
31 CNE_MTX2-
HNRNPA3 Intergenic Nose HNRNPA3 √ √
32 CNE_NBEA(Intrag
enic) Intragenic
Neural tube,
hindbrain, midbrain NBEA √ √
33 CNE_PBX3
(Intragenic) Intragenic Forebrain PBX3 √ √
34 CNE_PMFBP1-
ATBF1 Intergenic Forebrain ATBF1 √ √
35 CNE_POLA(Intrag
enic) Intragenic Forebrain POLA √ √
36 CNE_POLA-ARX Intergenic Forebrain ARX/POLA* √ √
37 CNE_PRDM16(Int
ragenic) Intragenic Hindbrain PRDM16 √ √
38 CNE_PTD004(Intra
genic)(SP3/CIR1) Intragenic Forebrain SP3/CIR* √ √
39 CNE_RCN1-
WT1(PAX6) Intergenic Dorsal root ganglion WT1/PAX6* √ √
40
CNE_RSRC1
(Intragenic)(SHOX
2)
Intragenic Limb SHOX2 √ √
41 CNE_SLC26A7-
RUNX1T1 Intergenic Midbrain OTUD6B √ √
42 CNE_SOX21-
ABCC4 Intergenic Neural tube
SOX21&
SOX14 √ √
43 CNE_ST18(Intrage
nic)(RB1CC1) Intragenic
Neural tube,
hindbrain, midbrain,
forebrain, dorsal
root ganglion
RB1CC1 √ √
44 CNE_TACR3-
CXXC4(PPA2) Intergenic Midbrain
CXXC4/PPA
2* √ √
45 CNE_TBX3-
THRAP2 Intergenic Limb TBX3 √ √
46 CNE_TCF4(Intrage
nic)(TCF12) Intragenic
Neural tube,
hindbrain, midbrain
TCF4 &
TCF12 √ √
47 CNE_TIM14-
SOX2 Intergenic Forebrain
DNAJC19/SO
X2* √ √
48
CNE_UBE2V2-
EFCAB1 (SNAI1
& SNAI2)
Intragenic Limb, face SNAI 1 &
SNAI 2 √ √
49 CNE_WWOX(Intra
genic)(MAF) Intragenic Forebrain, hindbrain MAF √ √
50
CNE_ZAK(Intrage
nic)(CDCA7/PDK1
/RAPGEF4)
Intragenic Neural tube,
midbrain, forebrain
CDCA7/PDK
1/
RAPGEF4*
√ √
51 CNE_ZFPM2(Intra
genic) Intragenic Midbrain ZFPM2 √ √

Chapter3-Results
54
52 CNE_ZIC1-
AGTR1 Intergenic Midbrain, forebrain AGTR1 √ √
53 CNE_ZNF407(Intra
genic) (Tshz1) Intragenic Limb TSHZ1 √ √
54 CNE_RIC3-LMO1 Intergenic
Neural tube,
hindbrain, midbrain,
Forebrain,Liver
LMO1 √ √
55 CNE_AUTS2(Intra
genic) Intragenic Midbrain AUTS2 √ √
56 CNE_ SLC35B3-
OFCC1 (TFAP2A) Intergenic
Carnial nerve,
Forebrain,Midbrain,
Limb
TFAP2A √ √
57 CNE_IRX4-IRX2 Intergenic
Neural tube,
hindbrain, midbrain,
Forebrain
IRX4 √ √
58 CNE_CADPS(Intra
genic) Intragenic Forebrain CADPS √ √
59 CNE_ZFHX4(HNF
4G) Intragenic Midbrain,Forebrain
ZFHX4/HNF
4G* √ √
60 CNE_GALR1 -
SALL3 Intergenic
Neural tube,
hindbrain SALL3 √ √
61 CNE_ EMX2 -
RAB11FIP2 Intergenic Midbrain EMX2 √ √
62 CNE_
C15orf41(MEIS2) intragenic Hindbrain MEIS2 √ √
63 CNE_ C19orf2 -
ZNF536 Intergenic Limb,Branchial arch ZNF536 √ √
64 CNE_GYPA-HHIP Intergenic
Midbrain,
Hindbrain, genital
tubercle
HHIP √ √
65 CNE_CHIC2(intrag
enic)(GSX2) Intragenic
Neural
tube,Forebrain GSX2 √ √
66 CNE_EHBP1(intra
genic)(OTX1) Intragenic Midbrain OTX1 √ √
67 CNE_SP8 - SP4 Intergenic Midbrain SP8 √ √
68
CNE_ LPAAT-
THETA-NKX6-
1(FAM175A)
Intergenic Midbrain FAM175A √ √
69 CNE_
FOXP2(Intragenic) Intragenic Midbrain GPR85 √ √
70 CNE_ MKI67 -
MGMT Intergenic Hindbrain,Midbrain EBF3 √ √
71
CNE_PXMP3 -
PKIA(ZFHX4,HNF
4G)
Intergenic Forebrain,Hindbrain
,Eye
ZFHX4/HNF
4G* √ √
72
CNE_C10orf11 -
KCNMA1(ZNF503
)
Intergenic Forebrain KCNMA1/Z
NF503* √ √
73 CNE_ARL4A-
ETV1 Intergenic Hindbrain,Midbrain ETV1 √ √
74 CNE_CEI - IRX1 Intergenic Forebrain,Hindbrain IRX4 √ √
75 CNE_ GPR101 -
ZIC3 Intergenic Hindbrain,Midbrain
GPR101
/ZIC3* √ √
76 CNE_
ATP9B(intragenic) Intergenic Forebrain ATP9B √ √
77
CNE_ NXPH1 -
NDUFA4(THSD7
A)
Intergenic Midbrain NXPH1
/THSD7A* √ √

Chapter3-Results
55
78 CNE_DERA(intrag
enic)(MGST1) Intragenic
Forebrain,Neuraltub
e
DERA/
MGST1* √ √
79 CNE_ADK(intrage
nic) Intragenic
Midbrain,Forebrain,
Nose ADK √ √
80 CNE_ MGST1 -
LMO3 Intergenic
Hindbrain.Neuraltub
e
MGST1
/LMO3* √ √
81 CNE_BARHL2 -
ZNF644 Intergenic Forebrain
BARHL2
/LRRC8C* √ √
82 CNE_
ZNF423(intragenic) Intragenic Forebrain,Hindbrain ZNF423 √ √
83 CNE_FIGN(intrage
nic) Intragenic Hindbrain
FIGN/KCNH
7* √ √
84 CNE_XRN2-
NKX2-2 Intergenic Hindbrain,Midbrain
NKX2-
2/PAX-1* √ √
85
CNE_
MGMT(intragenic)(
PPP2R2D)
Intragenic Forebrain PPP2R2D √ √
86 CNE_LMO3 -
FLJ22655 Intergenic Midbrain LMO3 √ √
87 CNE_
DPYD(intragenic) Intragenic Forebrain DPYD √ √
88 CNE_C10orf84(intr
agenic)(EMX2) Intragenic Forebrain,Midbrain EMX2 √ √
89 CNE_ FUSSEL18 -
SMAD2 Intergenic Hindbrain SMAD2 √ √
90 CNE_
ZNF503(Intragenic) Intragenic
Midbrain,Limb,Nos
e,Eye,Branchial arch ZNF503 √ √
91
CNE_
C9orf39(intragenic)
(SH3GL2)
Intragenic Hindbrain SH3GL2 √ √
92 CNE_TSHZ3 -
ZNF507 Intergenic limb TSHZ3 √ √
93 CNE_KLHL1 -
DACH1 Intergenic Forebrain DACH1 √ √
94 CNE_C2orf34 -
SIX3(SIX2) Intergenic Forebrain SIX3/SIX2* √ √
95 CNE_ISL1 - PELO Intergenic Ear ISL1 √ √
96
CNE_MAP1D(intra
genic))(HAT1,DLX
)
Intragenic Forebrain,Carnial
nerve HAT1/DLX* √ √
97 CNE_PITX2 -
C4orf32 Intergenic Midbrain PITX2 √ √
98 CNE_ FOXG1B -
PRKD1 Intergenic Forebrain FOXG1B
√
99 CNE_ ZFHX1B -
ACVR2A Intergenic Hindbrain,Midbrain ZFHX1B √ √
100 CNE_
LMO3(intragenic) Intragenic Neuraltube
LMO3/DERA
* √ √
101 CNE_
TCF12(intragenic) Intragenic
Hindbrain,Midbrain,
Neural tube TCF12 √ √
102 CNE_
AATF(intragenic) Intragenic Hindbrain LHX1 √ √
103 CNE_ZNF521(intra
genic) Intragenic
Midbrain,Midbrain,
Heart ZNF521 √ √
104 CNE_FANCL-
BCL11A Intergenic Forebrain BCL11A √ √
105 CNE_ZFHX1B(intr
agenic) Intragenic
Hindbrain,Midbrain,
dorsal root ganglion ZFHX1B √ √
106 CNE_TANK - Intergenic Forebrain TBR1/RBMS √ √

Chapter3-Results
56
PSMD14 1*
107 CNE_ DLX1 -
DLX2 Intergenic
Forebrain,Midbrain,
Nose
DLX1/DLX2
* √ √
108 CNE_ ATP11C -
SOX3 (FGF13) Intergenic Forebrain,Hindbrain FGF13 √ √
109 CNE_ ZNF312
(Intragenic) Intragenic Forebrain,Midbrain
ZNF312 /
CADPS* √ √
110
CNE_
ZAK(intragenic)(S
P3)
Intragenic Forebrain,Midbrain,
Neuraltube SP3 √ √
111 CNE_OTP -
TBCA(CRHBP) Intergenic Forebrain CRHBP √ √
112
CNE_
FOXP4(intragenic)(
TFEB3)
Intragenic Forebrain,Midbrain TFEB3 √ √
113 CNE_POLA(intrag
enic) Intragenic Midbrain POLA √ √
114 CNE_
GLI3(intragenic) Intragenic Forebrain GLI3 √ √
115 CNE_SALL1 -
CHD9 (NKD1) Intergenic Midbrain,Neuraltube
SALL1
/NKD1* √ √
116 CNE_ATBF1(intra
genic) (DHX38) Intragenic
mesenchyme
derived from neural
crest
ATBF1/DHX
38* √ √
117 CNE_IRX5-
IRX6(IRX4-IRX2) Intergenic
eye,Midbrain,neural
tube
IRX5-IRX6
&IRX4-IRX2 √ √
118
CNE_C9orf28(intra
genic)
(PBX3/LMX1B)
Intragenic Midbrain C9orf28/PBX
3/LMX1B* √ √
119 CNE_ARRDC3-
NR2F1 Intergenic
hindbrain
(rhombencephalon) NR2F1 √ √
120 CNE_RPS6KC1 -
PROX1(SMYD2) Intergenic forebrain
PROX1/SMY
D2* √ √
121 CNE_PLSCR1-
ZIC4(PLOD2) Intergenic limb PLOD2 √ √
122 CNE_TFAP2B-
PKHD1 Intergenic
hindbrain
(rhombencephalon),
midbrain
(mesencephalon)
TFAP2B √ √
123
CNE_DKFZp667B
0210(intragenic)
(EBF3)
Intragenic hindbrain
(rhombencephalon)
EBF3 &
EBF1 √ √
124 CNE_SOX6(intrage
nic) (PLEKHA7) Intragenic melanocytes PLEKHA7 √ √
125 CNE_POU3F1-
RRAGC(UTP11L) Intergenic Neural tube
POU3F1/UTP
11L* √ √
126
CNE_TBC1D5-
SATB1(PLCL2/RA
B5A)
Intergenic heart SATB1/PLCL
2/RAB5A* √ √
127 CNE_TTC14-
FXR1(SOX2) Intergenic eye,limb SOX2 √ √
128
CNE_FLJ25680-
DKFZP564D172(N
R2F1))
Intragenic forebrain,midbrain NR2F1 √ √
129 CNE_C6orf167-
POU3F2 Intergenic hindbrain,midbrain POU3F2 √ √
130 CNE_LOC90637-
MICALL2(UNCX) Intergenic
branchial
arch,forebrain,midbr
ain
UNCX √ √

Chapter3-Results
57
131 CNE_NEUROD6 -
LOC223075 Intergenic melanocytes NEUROD6 √ √
132 CNE_SHFM1 -
DLX5(DLX6) Intergenic
midbrain
(mesencephalon)
DLX6/SHFM
1* √ √
133 CNE_C10orf11(intr
agenic) (ZNF503) Intragenic
eye, hindbrain,
neural tube ZNF503 √ √
134 CNE_ACADSB-
BUB3(HMX2) Intergenic limb HMX2 √ √
135
CNE_LPHN2 -
FLJ23033(PRKAC
B)
Intergenic mammary
tissue,eye,gut PRKACB √ √
136 CNE_MEIS2-
TMCO5 Intergenic
hindbrain, neural
tube MEIS2 √ √
137 CNE_PARP8 -
ISL1 Intergenic
Dorsal root
ganglion, cranial
nerve.
PARP8 √ √
138 CNE_C14orf177 -
BCL11B(BCL11A) Intergenic forebrain
BCL11B/BC
L11A* √ √
139 CNE_FKSG2-
ZNF703(ZNF503) Intergenic
cranial nerve,
forebrain
ZNF703 &
ZNF503 √ √
140 CNE_HAT1(intrag
enic) (CYBRD1) Intragenic midbrain, hindbrain
HAT1/CYBR
D1* √ √
141
CNE_CEI-
IRX1(IRX2/IRX5-
IRX3)
Intergenic Midbrain IRX2/IRX1/I
RX5/IRX3* √ √
142 CNE_SP8-SP4 Intergenic forebrain SP8 √ √
143 CNE_FOXP2(intra
genic) (FOXP1) Intragenic forebrain
FOXP2 &
FOXP1 √ √
144
CNE_EDNRB-
POU4F1(RNF219/
RBM26)
Intergenic Midbrain, Limb RNF219 &
RBM26 √ √
145 CNE_CENTG2(intr
agenic) (GBX2) Intragenic
branchial arch,
forebrain, limb GBX2 √ √
146 CNE_ARHGAP13(
intragenic) (ZEB2) Intragenic forebrain ZEB2 √ √
147 CNE_KIAA1900(in
tragenic) (POU3F2) Intragenic
branchial arch,
ear,forebrain,hindbr
ain
POU3F2 √ √
148 CNE_TRPS1(intrag
enic) Intragenic Limb TRPS1 √ √
149 CNE_ATG4C-
FOXD3(DOCK7) Intergenic
Hindbrain, neural
tube
FOXD3/DOC
K7* √ √
150 CNE_LMO4(intrag
enic) Intragenic
branchial arch,
cranial nerve LMO4 √ √
151 CNE_KIAA1598-
VAX1(HSPA12A) Intragenic Forebrain, midbrain
KIAA1598/H
SPA12A* √ √
152
CNE_GTPBP9-
FLJ46347(SP3/PD
K1)
Intergenic forebrain SP3/PDK1* √ √
153 CNE_MRPS9(POU
3F3/NCK2) Intragenic
Hindbrain, neural
tube
POU3F3/NC
K2* √ √
154
CNE_SORL1-
BRCC2(UBASH3B
)
Intergenic
Eye, forebrain,
hindbrain, midbrain,
neural tube
UBASH3B √ √
155 CNE_SMG6(intrag
enic) (HIC1) Intragenic limb HIC1 √ √
156 CNE_C20orf19(RA
LGAPA2/NKX2-2) Intergenic forebrain
RALGAPA2/
NKX2-2* √ √
157 CNE_ ZEB2- Intergenic Midbrain ZEB2 √ √

Chapter3-Results
58
PABPCP2
158 CNE_ MDFIC-
TFEC( FOXP2) Intergenic
Eye, Forebrain,
Hindbrain,
Midbrain, Neural
tube
FOXP2 √ √
159
CNE_OTX2EXOC
5(MUDENG/C14or
f)
Intergenic Midbrain MUDENG/C
14orf101* √ √
160 CNE_CEP135-
AASDH (EXOC1) Intergenic
Cranial nerve,
Hindbrain, Neural
tube
EXOC1 √ √
161
CNE_
ATOH8(intragenic)
( ST3GAL5)
intragenic Forebrain,Hindbrain
,Limb ST3GAL5 √ √
162
CNE_FZD8-
ANKRD30A(
GJD4/CCNY)
Intergenic
Branchial arch,
Genital tubercle,
hindbrain, Limb
FZD8/GJD4/
CCNY* √ √
163
CNE_SPRY1-
ANKRD50(
NUDT6/FGF2 )
Intergenic Heart, Limb SPRY1/NUD
T6/FGF2 * √ √
164 CNE_ADI1-SOX11 Intergenic
Forebrain,
Hindbrain,
Midbrain, Neural
tube
SOX11 √ √
165 CNE_TEAD1(intra
genic)(PTH/BTBD) intragenic
Branchial arch,
Dorsal root
ganglion, Forebrain,
Limb, Midbrain
TEAD1/PTH/
BTBD10* √ √
166 CNE_NFIA(intrage
nic) intragenic
Forebrain, Heart,
Limb, Midbrain,
Nose
NFIA √ √
167
CNE_MRPS28(intr
agenic)(
STMN2/HEY1)
intragenic
Cranial nerve,
Hindbrain,
Midbrain, Neural
tube
STMN2/HEY
1* √ √
168 CNE_NFIA-
TM2D1 Intergenic
Forebrain,
Hindbrain,
Midbrain, Neural
tube
NFIA √ √
169 CNE_SETBP1(intr
agenic)( SYT4) intragenic
Cranial nerve,
Forebrain,
Hindbrain,
Midbrain, Neural
tube, other
SYT4 √ √
170 CNE_POU2F1(intr
agenic) intragenic
Forebrain,
Hindbrain,
Midbrain, Neural
tube
POU2F1 √ √
171 CNE_SOX2-
ATP11B intergenic
Forebrain,
Hindbrain,
Midbrain, Neural
tube
SOX2 √ √
172
CNE_C10orf11(intr
agenic)( KCNMA1
)
intragenic Limb, Neural tube KCNMA1 √ √
173 CNE_NPVF-
NFE2L3( SNX10) intergenic
Forebrain,
Hindbrain,
Midbrain
SNX10 √ √
174 CNE_MALT1-
ZNF532 intergenic Ear, Nose ZNF532 √ √

Chapter3-Results
59
175
CNE_COMTD1-
LOC439985(
ZNF503)
intergenic Limb ZNF503 √ √
176
CNE_IGFBPL1-
FLJ35740(ANKRD
18A/ANKRD29)
intragenic Limb ANKRD18A
& ANKRD29 √ ×**
177 CNE_NEK7(intrag
enic) intragenic
Branchial arch,
Dorsal root
ganglion, Forebrain,
Hindbrain,
Midbrain
NEK7 √ √
178
CNE_MAB21L1-
DCAMKL1(NBEA
/DCLK1)
Intragenic Midbrain, Nose NBEA/DCLK
1 * √ √
179 CNE_OPA1-HES1 intergenic Forebrain OPA1 √ √
180 CNE_ROBO1(intra
genic) intragenic
Branchial arch,
Limb ROBO1 √ √
181 CNE_SLC6A9-
KLF17(B4GALT2) intergenic Midbrain B4GALT2 √ √
182 CNE_SLC4A3-
EPHA4(SLC24A3) intergenic Limb SLC4A3 √ ×**
183
CNE_C21orf34(intr
agenic)(USP25
/NRIP1)
intragenic
Forebrain,
Hindbrain,
Midbrain, Neural
tube
USP25
/NRIP1* √ √
184 CNE_SOX6-
C11orf58 intergenic Forebrain SOX6 √ √
185 CNE_JAG1-
BTBD3(MKKS) intergenic Limb, Nose
JAG1/BTBD3
/MKKS* √ √
186 CNE_OSR1-
TTC32 intergenic
Branchial arch,
Limb, Nose, Somite OSR1 √ √
187 CNE_RBM33(intra
genic)(SHH) intragenic Limb SHH √ √
188 CNE_PTCH1(intra
genic) intragenic
Forebrain,
Hindbrain,
Midbrain, Neural
tube
PTCH1 √ √
189 CNE_SPATA17-
CGI-115(ESRRG) intergenic
Hindbrain,
Trigeminal V ESRRG √ √
190 CNE_PTX3-
SHOX2( RSRC1) intergenic
Hindbrain,
Midbrain, Neural
tube
SHOX2/RSR
C1* √ √
191
CNE_
PBX1(intragenic)
(ALDH9A1)
intragenic Hindbrain PBX1/ALDH
9A1* √ √
192 CNE_ASCL1(intra
genic)(IGF1) intragenic Eye IGF1 √ √
*Represents the enhancers which are associated with more than one target genes.** Expression
pattern is not known.
Table 3.2: Describes the name of CNE enhancer, their location with respect to putative associated
gene, the reporter gene expression induced by human CNE enhancer in transgenic mice assay and the
associated gene of CNE enhancer with respect of conserved syntenic analysis and MGI expression
data.

Chapter3-Results
60
3.1.3. Transcription factor analysis
Transcription factors (TFs) are one of the groups of proteins that read and
interpret the genetic "blueprint" in the DNA. They bind DNA and help initiate a
program of increased or decreased gene transcription. A defining feature of
transcription factors is that they contain one or more DNA-binding
domains (DBDs), which attach to specific sequences of DNA adjacent to the
genes that they regulate.
Regulated spatial and temporal control of gene expression is a fundamental
process for all metazoans, and much of this regulation occurs through the
interaction of TFs with specific cis-regulatory DNA sequences. Large amount of
gene regulation is mediated by cis-regulatory elements that are distal to the gene
they regulate and organized in a modular fashion. Each module regulates a
particular temporal-spatial pattern of gene expression and contains a series of
binding sites for a specific complement of TFs. Often referred to as 'enhancers',
these elements can lie hundreds of kilobases away from the promoter and can be
located 5', 3', or within the intron of their own or a non-associated gene (Li et al.,
2007).
Here we seek to identify TFs that act cooperatively to define CNS (central
nervous system) specificity of an enhancer. For this purpose, among the selected
subset of distant acting developmental enhancers we choose the one for which
reproducible CNS-specific activity has been shown in vivo in E11.5 mouse
embryos (Pennacchio, et al., 2006). This data set consists of 159/192 elements,
majority (118/159) of which are explicitly associated with single target gene
(Table 3.2). Given the fact that a typical binding motif for TF can be as short as 5-
8bp, in silico matches to such short motifs occur frequently by chance alone, with
many of these predicted sites presumably non-functional. Therefore, a major
challenge in computational identification of such motifs that must be overcome is
distinguishing functional TFBSs from spurious motif matches. In order to better
define biologically relevant combinations of TFs, while analyzing each brain

Chapter3-Results
61
specific cis-regulatory module for an input set of known TFs we focused on: (i)
evolutionary conservation of each enhancer across human and mouse lineages; (ii)
conserved binding motifs that occurred more than once in an enhancer. This
stringent criterion combining the technique of phylogenetic foot printing and
possibilities of occurrence of homotypic interactions within typical metazoan
enhancers reveals that the brain specific cis-regulatory modules have
evolutionarily conserved binding site preferences for SOX5, HFH, SOX17, c-
FOS, HNF3β, c-REL, MEF2, nMYC, USF, FREAC, Tal1beta-E47s, NFKB,
AML1 and ARNT transcriptional factors.(Fig 3.6, Table S3)
We calculated 2[ ]ijR r
matrix of inter-correlation among the fourteen TFs.From
2[ ]ijR r (Table S4) three well defined groups of TFs with strong within and poor
or no correlation among the groups have materialized, apart from two
insignificant TFs: Tal1b-E47S and MEF. The two TFs do not correlate with any
other TF in the data matrix. Here the findings of 2[ ]ijR r
may be grouped into
three clusters configurations as
Cluster1: n-MYC, ARNT, USF (each 2
ijr higher than 69%) (Table S4)
Cluster2: c-REL, NF-Kappa (2r 30%) (Table S4)
Cluster3: FREAC, AML-1, c-FOS, HFN3- , SOX17, HFH, SOX5 (
212% 54%ijr ) (Table S4)
To validate our findings we performed the same TF analysis on control data set of
non-coding non- conserved elements. There is not any single obvious cluster for
the fourteen TFBSs that formed internally closely packed clusters in CNS specific
enhancers.
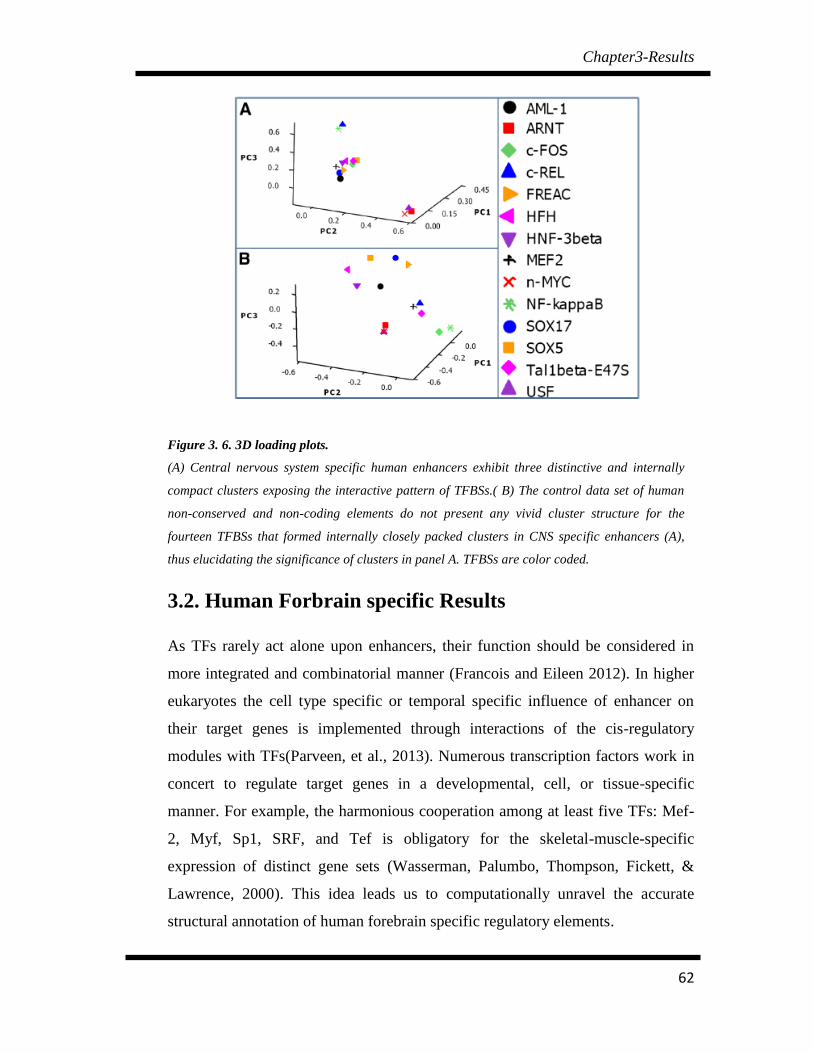
Chapter3-Results
62
Figure 3. 6. 3D loading plots.
(A) Central nervous system specific human enhancers exhibit three distinctive and internally
compact clusters exposing the interactive pattern of TFBSs.( B) The control data set of human
non-conserved and non-coding elements do not present any vivid cluster structure for the
fourteen TFBSs that formed internally closely packed clusters in CNS specific enhancers (A),
thus elucidating the significance of clusters in panel A. TFBSs are color coded.
3.2. Human Forbrain specific Results
As TFs rarely act alone upon enhancers, their function should be considered in
more integrated and combinatorial manner (Francois and Eileen 2012). In higher
eukaryotes the cell type specific or temporal specific influence of enhancer on
their target genes is implemented through interactions of the cis-regulatory
modules with TFs(Parveen, et al., 2013). Numerous transcription factors work in
concert to regulate target genes in a developmental, cell, or tissue-specific
manner. For example, the harmonious cooperation among at least five TFs: Mef-
2, Myf, Sp1, SRF, and Tef is obligatory for the skeletal-muscle-specific
expression of distinct gene sets (Wasserman, Palumbo, Thompson, Fickett, &
Lawrence, 2000). This idea leads us to computationally unravel the accurate
structural annotation of human forebrain specific regulatory elements.

Chapter3-Results
63
3.2.1. Catalogue of functionally reported forebrain TFs
Through extensive and elaborated literature survey we formatted the exhaustive
catalogue of 93 TFs that play crucial and important role in the specification,
physiology and anatomy of forebrain development at early embryonic
development (Table 3.3).
Table 3. 3. List of transcription factors involved in forebrain specification and
development.
Sr.No
Transcription factor
Protein-related Information
Known endogenous expression pattern
Source
1. Dlx1 Homeobox containing DNA Binding
diencephalon,telencephalon
(Bulfone, Puelles, et al., 1993)
2. Dlx2 Homeobox containing DNA Binding
diencephalon, telencephalon
(Bulfone, Kim, et al., 1993)
3. Gbx2 Homeobox containing DNA Binding
diencephalon (Bulfone, Kim, et al., 1993)
4. Emx1 Homeobox containing DNA Binding
telencephalon, cerebral cortex
(Yoshida et al., 1997)
5. Emx2 Homeobox containing DNA Binding
diencephalon roof plate
(Yoshida, et al., 1997)
6. Zic1 ZN C2H2 containing transcriptionfactor
telencephalon (Inoue, et al., 2007)
7. Smad3 MH1 DNA binding domain telencephalon ventricular layer
(Diez-Roux et al., 2011)
8. Lhx2 Homeobox containing DNA Binding
Telencephalon,thalamus
(Monuki, Porter, & Walsh, 2001)
9. Nkx2.1 Homeobox containing DNA Binding
telencephalon (Beccari, et al., 2013)
10. Six6 Homeobox containing DNA Binding
Future prosencephalon plate
(Jean, Bernier, & Gruss, 1999)
11. Sox2 High Mobility group (HMG) transcription factor
future prosencephalon (Gray et al., 2004)

Chapter3-Results
64
12. Sox3 High Mobility group (HMG) transcription factor
diencephalon ,telencephalon
(Visel, Thaller, & Eichele, 2004)
13. Vax1 Homeobox containing DNA Binding
telencephalon mantle layer
(Hallonet, Hollemann, Pieler, & Gruss, 1999)
14. Dlx5 Homeobox containing DNA Binding
Diencephalon (Sajan, Rubenstein, Warchol, & Lovett, 2011)
15. Arx Homeobox containing DNA Binding
Diencephalon (Miura, Yanazawa, Kato, & Kitamura, 1997)
16. Sp8 ZN C2H2 containing transcription factor
Prosencephalon (Zembrzycki, Griesel, Stoykova, & Mansouri, 2007)
17. Gsx1 Homeobox containing DNA Binding
diencephalon, telencephalon
(Yun, Garel, Fischman, & Rubenstein, 2003)
18. Gsx2 Homeobox containing DNA Binding
Diencepjlon lateral wall ventricular layer
(Yun, et al., 2003)
19. Foxg1 Forkhead transcription factor future prosencephalon (Manuel, et al., 2010)
20. Hesx1 Homeobox containing DNA Binding
Telencephalon (Gray, et al., 2004)
21. Gli3 ZN C2H2 containing transcription factor
Telencephalon (Grove, Tole, Limon, Yip, & Ragsdale, 1998)
22. Fezf2 ZN C2H2 containing transcription factor
diencephalon, telencephalon
(Yang, et al., 2012)
23. Six3 Homeobox containing DNA Binding
future prosencephalon
(Lagutin et al., 2003)
24. Tbr1 Tbox containing transcription telencephalon mantle (Bulfone

Chapter3-Results
65
factor layer et al., 1995)
25. Ngn2 bHLH transcriptionfactor diencephalon (Osorio, Mueller, Retaux, Vernier, & Wullimann, 2010)
26. Olig2 bHLH transcriptionfactor telencephalon (Furusho et al., 2006)
27. Gbx1 Homeobox containing DNA Binding
diencephalon,telencephalon
(Asbreuk et al., 2002)
28. Otx1 Homeobox containing DNA Binding
future prosencephalon (Gray, et al., 2004)
29. Otx2 Homeobox containing DNA Binding
future prosencephalon (Gray, et al., 2004)
30. Foxp2 Forkhead transcription factor diencephalon ventricular layer
(Gray, et al., 2004)
31. Meis2 Homeobox containing DNA Binding
telencephalon (Gray, et al., 2004)
32. Pbx1 Homeobox containing DNA Binding
hypothalamus (Gray, et al., 2004)
33. Pax6 Homeobox containing DNA Binding
Thalamus (Gray, et al., 2004)
34. Sox5 High Mobility group (HMG) transcription factor
cerebral cortex, thalamus
(Gray, et al., 2004)
35. Rax Homeobox containing DNA Binding
diencephalon (Gray, et al., 2004)
36. Barhl1 Homeobox containing DNA Binding
diencephalon (Gray, et al., 2004)
37. Foxb1 Forkhead transcription factor diencephalon (Gray, et al., 2004)
38. Foxj1 Forkhead transcription factor hypothalamus (Gray, et al., 2004)
39. Gata2 ZN GATA transcription factor diencephalon (Gray, et al., 2004)
40. Gata3 ZN GATA transcription factor diencephalon (Gray, et al., 2004)
41. Hes5 bHLH transcriptionfactor diencephalon, telencephalon
(Gray, et al., 2004)
42. Irx3 Homeobox containing DNA Binding
Thalamus (Gray, et al., 2004)
43. Irx5 Homeobox containing DNA Binding
diencephalon (Gray, et al., 2004)
44. Klf7 ZN C2H2 containing transcription factor
diencephalon (Gray, et al., 2004)
45. Lef1 High Mobility group (HMG) transcription factor
diencephalon,telencephalon
(Gray, et al., 2004)

Chapter3-Results
66
46. Lhx1 Homeobox containing DNA Binding
Diencephalon (Gray, et al., 2004)
47. Lhx4 Homeobox containing DNA Binding
Hypothalamus (Gray, et al., 2004)
48. Lhx5 Homeobox containing DNA Binding
diencephalon, telencephalon
(Gray, et al., 2004)
49. Nfib1 nuclear factor-1 DNA-binding domain
Telencephalon (Gray, et al., 2004)
50. Nkx2.2 Homeobox containing DNA Binding
Diencephalon (Gray, et al., 2004)
51. Pax3 Homeobox containing DNA Binding
Diencephalon (Gray, et al., 2004)
52. Pax7 Homeobox containing DNA Binding
Thalamus (Gray, et al., 2004)
53. Pea3 Ets containing transcription factor
Diencephalon (Gray, et al., 2004)
54. Pitx2 Homeobox containing DNA Binding
Diencephalon (Gray, et al., 2004)
55. Pou3f1 POU containing DNA binding Diencephalon (Gray, et al., 2004)
56. Pou3f2 POU containing DNA binding Diencephalon (Gray, et al., 2004)
57. Pou3f4 POU containing DNA binding diencephalon, telencephalon
(Gray, et al., 2004)
58. Pou4f3 POU containing DNA binding Diencephalon (Gray, et al., 2004)
59. Prox1 Homeobox containing DNA Binding
Diencephalon (Gray, et al., 2004)
60. Sox9 High Mobility group (HMG) transcription factor
diencephalon, telencephalon
(Gray, et al., 2004)
61. Zeb1 Zinc finger E-box-binding homeobox 1
Diencephalon,cerebral cortex,thalamus
(Magdaleno et al., 2006)
63. LHX8 Homeobox containing DNA Binding
Telencephalon (Zhao et al., 2003)
64. LHX6 Homeobox containing DNA Binding
Diencephalon, telencephalon
(Alifragis, Liapi, & Parnavelas, 2004)
65.
Sox6 DNA binding Telencephalon (Azim, Jabaudon, Fame, & Macklis, 2009)
66. Mafb bHLH-Zip transcription factor Diencephalon (Gray, et al., 2004)
67. Tbr2 Tbox containing transcription factor
telencephalon mantle layer
(Bulfone et al., 1999)
68. Coup-TF1 Zinc finger Diencephalon, telencephalon
(Qiu et al., 1994)
nuclear factor-1 DNA-binding domain

Chapter3-Results
67
69. Coup-TF2 Zinc finger Diencephalon, telencephalon
(Qiu, et al., 1994)
70. Cux1 CUT DNA-binding domains homeobox DNA-binding domain
telencephalon (Magdaleno, et al., 2006)
71. Cux2 CUT DNA-binding domains homeobox DNA-binding domain
Cerebral cortex, telencephalon mantle layer
(Hammock et al., 2010)
72. SOX10 HMG box DNA-binding domain. prosencephalon neural crest
(Soo et al., 2002)
73. Ascl1 bHLH (basic helix-loop-helix) future prosencephalon
(de la Pompa et al., 1997)
74. c-Maf bZIP (basic-leucine zipper) telencephalon ventricular layer
(Diez-Roux, et al., 2011)
75. Ctip1 C2H2-type zinc finger telencephalon (Gray, et al., 2004)
76. Ctip2 C2H2-type zinc finger Diencephalon, telencephalon
(Gray, et al., 2004)
77. Dlx3 homeobox DNA-binding domain Diencephalon, telencephalon
(Magdaleno, et al., 2006)
78. Dlx6 homeobox DNA-binding domain Diencephalon, telencephalon
(Gray, et al., 2004)
79. Etv1 ETS DNA-binding domain telencephalon (Gray, et al., 2004)
80. Etv5 ETS DNA-binding domain future prosencephalon (Chotteau-Lelievre et al., 2001)
81. Foxh1 fork-head DNA-binding domain telencephalon (Hoch, Rubenstein, & Pleasure, 2009)
82. MECP2 MBD (methyl-CpG-binding) domain,A.T hook DNA-binding domains
Diencephalon, telencephalon
(Magdaleno, et al., 2006)
83. Mef2a MADS-box domain Cecerebral cortexrebral cortex,
(Gray, et al., 2004)
84. Neurod1 bHLH (basic helix-loop-helix) domain
Diencephalon, telencephalon
(Gray, et al., 2004)
85. Nscl1 bHLH (basic helix-loop-helix) domain
Cerebral cortex,thalamus
(Gray, et al., 2004)
86. Pbx2 homeobox DNA-binding domain Cerebral cortex,thalamus
(Gray, et al., 2004)
87. Rfx4 RFX-type winged-helix DNA-binding domain
Telencephalon, Diencephalon,
(Gray, et al., 2004)
88. Sox1 HMG box DNA-binding domain Diencephalon,thalamus
(Visel, et al., 2004)
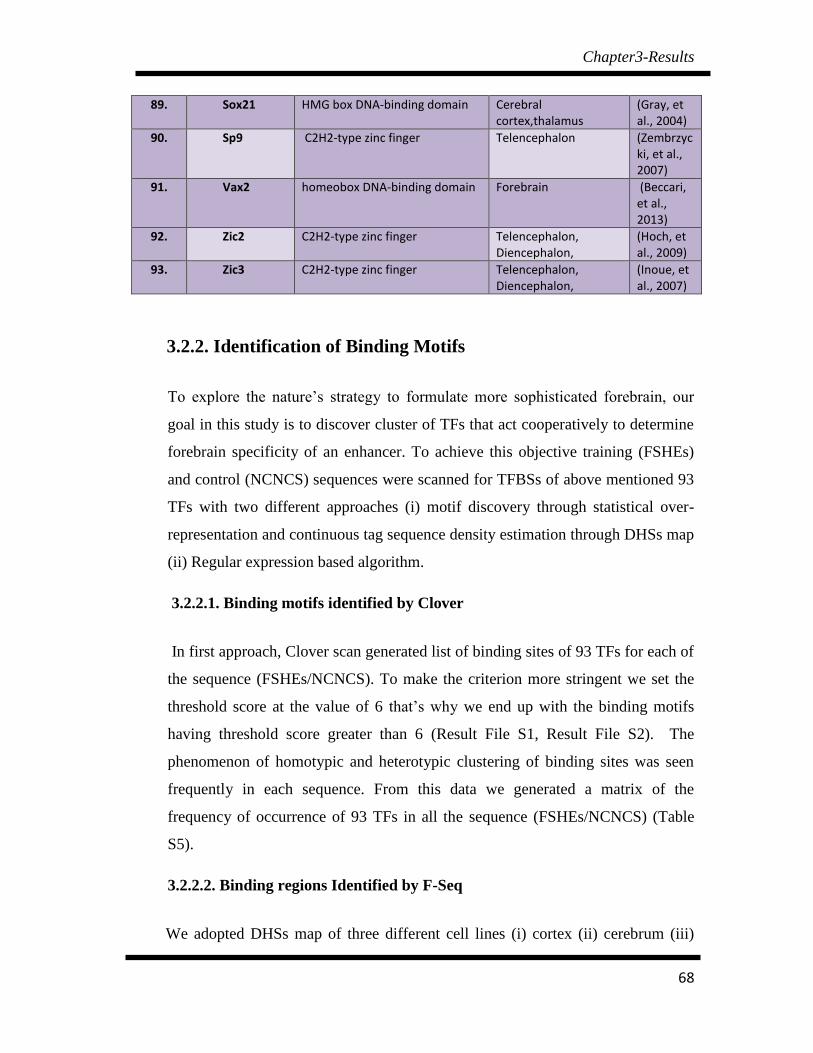
Chapter3-Results
68
3.2.2. Identification of Binding Motifs
To explore the nature’s strategy to formulate more sophisticated forebrain, our
goal in this study is to discover cluster of TFs that act cooperatively to determine
forebrain specificity of an enhancer. To achieve this objective training (FSHEs)
and control (NCNCS) sequences were scanned for TFBSs of above mentioned 93
TFs with two different approaches (i) motif discovery through statistical over-
representation and continuous tag sequence density estimation through DHSs map
(ii) Regular expression based algorithm.
3.2.2.1. Binding motifs identified by Clover
In first approach, Clover scan generated list of binding sites of 93 TFs for each of
the sequence (FSHEs/NCNCS). To make the criterion more stringent we set the
threshold score at the value of 6 that’s why we end up with the binding motifs
having threshold score greater than 6 (Result File S1, Result File S2). The
phenomenon of homotypic and heterotypic clustering of binding sites was seen
frequently in each sequence. From this data we generated a matrix of the
frequency of occurrence of 93 TFs in all the sequence (FSHEs/NCNCS) (Table
S5).
3.2.2.2. Binding regions Identified by F-Seq
We adopted DHSs map of three different cell lines (i) cortex (ii) cerebrum (iii)
89. Sox21 HMG box DNA-binding domain Cerebral cortex,thalamus
(Gray, et al., 2004)
90. Sp9 C2H2-type zinc finger Telencephalon (Zembrzycki, et al., 2007)
91. Vax2 homeobox DNA-binding domain Forebrain (Beccari, et al., 2013)
92.
Zic2 C2H2-type zinc finger Telencephalon, Diencephalon,
(Hoch, et al., 2009)
93. Zic3 C2H2-type zinc finger Telencephalon, Diencephalon,
(Inoue, et al., 2007)

Chapter3-Results
69
lymphocytes for each of the sequence (FSHEs/NCNCS) to capture binding sites
which dwell in the sequences (FSHEs/NCNCS) through F-seq. F-seq predicted
binding regions of ~100-150 bp in all the sequences (FSHEs/NCNCS) for all the
three cell lines on the basis of high tag sequence density at a point through
univariate kernel density estimation function.(Table S6) (Fig. 3.7)
Figure 3. 7. Examples of histogram and density estimation properties.
Blue dots represent sample positions being analyzed. (A, B) Locations of the bins used in
histograms can cause data to look unimodal (A) or bimodal (B) depending on their starting
positions (1.5 and 1.75, respectively). (C) Bandwidth affects the density generated in the same way
as changing the size of bins. Over (red, dashed line) and under (green, dotted line) smoothed data
can obscure the actual signal (black, solid line). (D) Example of how distributions over each point
are combined to create the final distribution. Each of the samples are represented by Gaussian
distributions which are summed to create the final density estimation. (Adapted from (Boyle, et al.,
2008)
3.2.3. Shared Binding motifs predicted by both Clover and F-seq
We opted for the binding sites predicted by both the programs Clover and F-Seq.
Using Perl as scripting language we generated a script to identify those clover

Chapter3-Results
70
predicted binding motifs, which reside within the binding region envisaged by F-
Seq for all the sequences of three cell lines. This reduced the false positive rate of
prediction to greater extent. For each cell line we formulated a matrix of the
frequency of occurrence of 93 TFs in each of the sequence for all the three cell
lines (Table S7). There is a clear cut decrease in the frequency of each TF
occurrence which was predicted by Clover before. This suggests that the false
positive prediction of TFBSs made only by computational analysis (Clover) of the
sequences has been removed now.
3.2.4. Regular Expression Algorithm Results
Conservation of a sequence among different species implies that a certain
sequence may have been maintained by evolution despite of speciation and that
these highly conserved DNA sequences have some functional significance. That‘s
why here in our designed tool we have applied human-mouse pairwise alignment,
to identify those conserved binding sites that have been retained over a distance of
75M years. TFBSs are degenerate in nature so we decided to track these variable
sites through regular expression approach. With the help of brute force algorithm
we are able to hunt for evolutionarily conserved TFBS consensus sequence on
the basis of regular expression strategy. Results are generated in the form of
matrices of the frequency of occurrence of conserved TFBSs for training (FSHEs)
and control (NCNCS) sequences (Table S8).
3.2.5. PCA
The 3D representation will identify the cluster structure present in TFs exhibiting
co-occurring pattern of TFs in the forebrain specific enhancers. Therefore all the
matrices from strategy 1 and strategies 2 were then subjected to PCA to identify
the cluster structures in the binding site preferences of the training (FSHEs) and
control (NCNCs) sequences. The 3D loading plot (Figure) of the first 3 PCs
derived from PCA on training and control data revealed the distinctive scenario of
interactive pattern of TFs across the FSHEs and non-interactive pattern of TFs

Chapter3-Results
71
across NCNCS in all the four matrices of frequency of occurrence. We observed
following number of members (TFs) in the clusters of FSHEs.
Cerebrum cell line:- 44 members(Fig. 3.8)
Cortex cell line:- 46 members(Fig. 3.9)
Lymphocytes:- 40 members(Fig. 3.10)
Regular Expression:- 39(Fig. 3.11)
Range of Eigen values for the first three PCs of cerebrum, cortex, lymph and
regular expression is mentioned in Table 3.4.
Table 3. 4. Ranges of Eigen values for all data sets.
Sr.No Data Type Ranges of Eigen Values No. of TFs in
Cluster
PC1 PC2 PC3
1. Cerebrum -0.00______0.02 -0.07______0.03 0.05______0.16 43
2. Cortex -0.09 ______ 0.01 -0.12______0.04 -0.14______0.12 45
3. Lymphocytes -0.02______ 0.05 -0.03______0.07 -0.15______0.02 40
4. Regular Expression
0.00______0.05 -0.11______0.05 -0.02______0.04 39
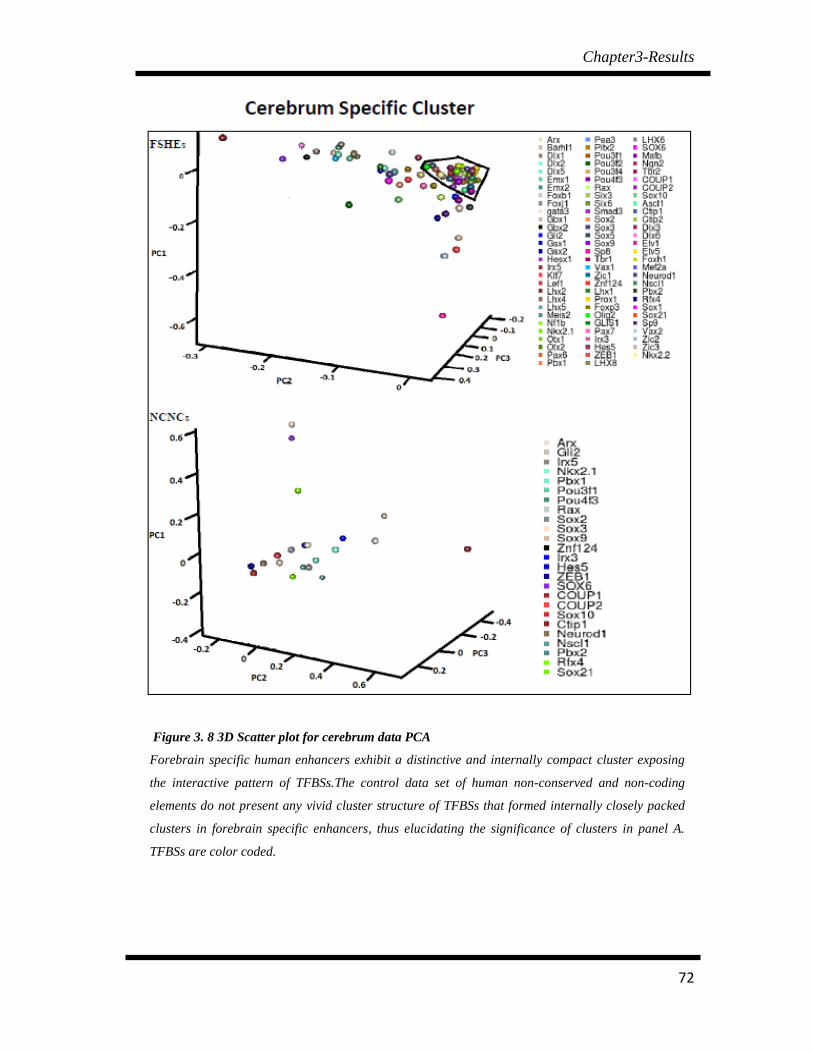
Chapter3-Results
72
Figure 3. 8 3D Scatter plot for cerebrum data PCA
Forebrain specific human enhancers exhibit a distinctive and internally compact cluster exposing
the interactive pattern of TFBSs.The control data set of human non-conserved and non-coding
elements do not present any vivid cluster structure of TFBSs that formed internally closely packed
clusters in forebrain specific enhancers, thus elucidating the significance of clusters in panel A.
TFBSs are color coded.

Chapter3-Results
73
Figure 3. 9. 3D Scatter plot for cortex data PCA
Forebrain specific human enhancers exhibit a distinctive and internally compact cluster exposing
the interactive pattern of TFBSs.The control data set of human non-conserved and non-coding
elements do not present any vivid cluster structure of TFBSs that formed internally closely packed
clusters in forebrain specific enhancers, thus elucidating the significance of clusters in panel A.
TFBSs are color coded.

Chapter3-Results
74
Figure 3. 10 3D Scatter plot for lymph data PCA
Forebrain specific human enhancers exhibit a distinctive and internally compact cluster exposing
the interactive pattern of TFBSs. The control data set of human non-conserved and non-coding
elements do not present any vivid cluster structure of TFBSs that formed internally closely packed
clusters in forebrain specific enhancers, thus elucidating the significance of clusters in panel A.
TFBSs are color coded.

Chapter3-Results
75
Figure 3. 11. 3D Scatter plot for Regular expression data PCA
Forebrain specific human enhancers exhibit a distinctive and internally compact cluster exposing
the interactive pattern of TFBSs.The control data set of human non-conserved and non-coding
elements do not present any vivid cluster structure of TFBSs that formed internally closely packed
clusters in forebrain specific enhancers, thus elucidating the significance of clusters in panel A.
TFBSs are color coded.

Chapter3-Results
76
3.2.6. Intersection of All the four clusters
We took the intersection of three clusters from the first strategy to dig out for
common members (TFs) from all three cell line specific clusters in FSHEs.
Cerebrum, cortex and lymphocytes specific clusters shared total of the 32 (69%)
members (TFs) which is in accordance with the findings that out of 2,890,742
distinct high-confidence DHSs, 1,920,642 (66%) are active in 2 or more cell types
(Thurman et al., 2012). We considered this common cluster as forebrain specific
cluster because our data set was confined to only forebrain (FSHEs and TFs), and
also we have DHSs map from two forebrain cell lines (cerebrum and cortex).We
assume that this particular signature pattern is present in GM12878 cell line but is
in dormant condition due to being irrelative to this cell line.
To be more precise and accurate we applied another filter on our results. The
common 32 TFs were then intersected with the regular expression specific cluster
to pick the shared results (TFs) from two different strategies. In total 23 TFs were
found common in all the four clusters (Fig 3.11). These 23 TFs are then
considered as mandatory for the activation of forebrain specific enhancers. Eigen
values for these 23 TFs in PCA of all four data sets are given in Table 3.5.

Chapter3-Results
77
Table 3. 5. Eigen values of 23 shared TFs from PCA of all the data sets.
Sr.No Cerebrum Cortex Lymph Regular
Expression
TFs PC1 PC2 PC3 PC1 PC2 PC3 PC1 PC2 PC3 PC1 PC2 PC3
1. Barhl1 -0.02 -0.01 0.05 0.00 0.03 0.07 0.01 0.01 0.03 0.00 0.00 0.00
2. Foxb1 0.00 -0.01 0.05 0.03 0.03 0.04 0.03 0.03 0.11 0.00 0.02 0.03
3. gata3 0.00 0.01 0.08 0.01 0.03 0.00 0.03 0.03 0.01 0.02 0.02 0.00
4. Irx5 -0.05 -0.02 -0.05 0.02 0.04 0.01 0.00 0.00 0.07 0.00 0.01 0.00
5. Nf1b -0.02 0.02 -0.03 0.00 0.00 0.01 0.00 0.01 0.00 0.00 0.00 0.00
6. Nkx2.1 0.00 0.03 0.16 0.05 0.03 0.01 0.02 0.03 0.12 0.00 0.00 0.00
7. Otx1 0.00 -0.02 0.01 0.03 0.01 0.07 0.01 0.01 0.02 0.00 0.01 0.00
8. Otx2 0.01 -0.03 0.01 0.00 0.00 0.02 0.00 0.01 0.01 0.01 0.01 0.01
9. Pbx1 -0.01 -0.03 0.05 0.01 0.02 0.01 0.00 0.02 0.04 0.00 0.01 0.01
10. Pea3 0.00 0.01 0.02 0.00 0.03 0.01 0.01 0.01 0.02 0.01 0.02 0.02
11. Pitx2 0.01 -0.03 -0.02 0.00 0.04 0.01 0.01 0.00 0.05 0.00 0.01 0.00
12. Smad3 -0.03 -0.07 -0.03 0.06 0.01 0.06 0.05 0.01 0.04 0.00 0.00 0.00
13. Tbr1 0.00 0.00 0.03 0.04 0.00 0.07 0.01 0.03 0.09 0.00 0.00 0.00
14. Zic1 0.01 -0.05 0.05 0.01 0.05 0.00 0.00 0.04 0.02 0.00 0.00 0.00
15. Foxp3 -0.05 -0.07 0.00 0.01 0.01 0.02 0.02 0.07 0.04 0.02 0.01 0.01
16. Irx3 -0.01 0.00 0.05 0.01 0.01 0.02 0.02 0.04 0.07 0.00 0.00 0.00
17. Hes5 0.02 0.02 0.08 0.01 0.06 0.03 0.02 0.04 0.02 0.00 0.03 0.02
18. Ngn2 -0.01 -0.01 0.07 0.02 0.09 0.04 0.01 0.02 0.09 0.02 0.02 0.04
19. Tbr2 -0.02 0.02 0.06 0.04 0.03 0.05 0.02 0.00 0.04 0.00 0.01 0.02
20. Foxh1 -0.02 0.02 -0.03 0.00 0.02 0.00 0.00 0.06 0.02 0.00 0.00 0.00
21. Nscl1 0.01 -0.02 0.02 0.01 0.01 0.04 0.01 0.01 0.01 0.00 0.00 0.00
22. Sox1 0.01 0.01 -0.02 0.01 0.01 0.02 0.01 0.02 0.03 0.00 0.00 0.00
23. Nkx2.2 -0.04 -0.01 0.04 0.02 0.03 0.12 0.01 0.02 0.02 0.01 0.03 0.02

Chapter3-Results
78
Figure 3. 12 Intersection of four clusters from four data sets.
(A)In total 32 TFs are shared among the TF clusters of three data sets (cerebrum, cortex,
lymph) used in first approach to find forebrain specific Transcriptional factor
code.(B)Then intersection between these 32 TFs and TF cluster of Regular expression
based algorithm data resulted in 23 TFs common in both.

Chapter4-Discussion
79
Discussion
Comparative genomic analysis indicate that increase in gene number do not
account for increases in morphological and behavioral complexity, e.g. nematode
worm, C.elegans possess nearly 20,000 genes but lack the full type of cells and
tissues seen in fruitfly Drosophila, which contains fewer than 14,000 genes.
Emerging evidence suggests that organismal complexity arises from progressively
more elaborated regulation of gene expression (Levine & Tjian, 2003). After the
availability of assembled metazoan genome sequences, scientists are trying to
understand the phenomenon of “transcriptional regulation” which is much more
dynamic process than once perceived. In eukaryotes, transcriptional regulation
tends to involve combinatorial interactions between several transcription factors,
which allow for a sophisticated response to multiple conditions in the
environment. This permits spatial and temporal differences in gene expression.
Eukaryotes also make use of enhancers, distant regions of DNA that can loop
back to the promoter, known as transcriptional regulatory elements (TREs).
x
To comprehend the molecular mechanism that governs specific expression
patterns, it is important to identify distant transcriptional regulatory elements
aaaaaaaaaaaaaaaassociated with predicted genes. That’s why scientists identified
cis-regulatory sequences that control the spatial and temporal patterns of gene’s
expression. This task remains difficult due to lack of knowledge of the vocabulary
controlling gene regulation and the vast genomic search space, with greater than
95% of our genome being noncoding. Comparative genomics based strategies are
now being employed to predict genomic regions harboring cis-regulatory
elements even in the absence of knowledge about the specific characteristics of
individual cis-regulatory element. These methods are influenced by sequence
conservation between orthologous genes implying that some sort of selection

Chapter4-Discussion
80
pressure prevented this sequence from evolving with the neutral rate that is why
these elements are known as highly conserved non-coding elements (CNEs). How
do CNEs regulate gene-expression? The simplest model is that CNEs contain
transcription factor binding sites (TFBS) and the transcription factors regulating
the target gene of CNE bind to these TFBS to regulate the expression of target
gene.
Genomic comparison of different vertebrates revealed many sequences that have
remained conserved throughout the vertebrate lineage. Some of these sequences
correspond to coding genes and non coding RNAs, however two thirds of them
are unlikely to produce a functional transcript. These sequences fall in the new
category of elements of currently unknown function, which we collectively call as
conserved non-genic sequences (CNGs). To explore the secret of such a high
level of conservation for such a long period of time Pennachio and coworkers
supposed the phenomenon of extreme evolutionary sequence conservation as a
filter to identify putative gene regulatory elements. To accomplish this task they
predicted all CNEs in human and mouse genome with the help of computational
technique known as Phylogenetic footprinting. After that they experimentally
validated the regulatory nature of computationally predicted sequences through
reporter gene assay. They tested these extremely conserved sequences in a
transgenic mouse enhancer assay and found that 45% of these tested CNEs
functioned reproducibly as tissue-specific enhancers of gene expression. At the
end they come up with the experimentally validated enhancer dataset in the form
of database known as Vista Enhancer browser (http://enhancer.lbl.gov/).
After the identification of enhancer next step to understand the process of
transcriptional regulation is to associate enhancer with the gene whose expression
is regulated by this enhancer. Enhancers reside in the vicinity of the genes they
are regulating (trans-dev genes). They are modular in nature and are known to act
in an orientation and distance independent manner i.e. they may be located within
the introns of the genes they are regulating, upstream of the gene, downstream or

Chapter4-Discussion
81
may be located at a greater distance from the gene and interact by looping out the
intervening DNA. Pennachio and coworkers simply associated these CNE-
enhancers with the most closely positioned flanking genes (intergenic CNE-
enhancers) or the genes within which these CNE-enhancers resides (intragenic)
(Pennacchio, et al., 2006). However the redundancy in the expression pattern of
CNE-enhancer and the expression of multiple flanking genes hinders the
unambiguous association of enhancer to its putative target genes.
To verify the association of CNE-enhancers with their target genes proposed by
the Pennacchio we devised a systematic procedure which is based on two types of
analysis (i) comparative genic architecher analysis of the othologous loci,
harboring the CNE-enhancer, in tetrapod-teleost lineages (ii) endogenous
expression pattern analysis of both, the putative target gene and the CNE-
enhancer. We picked out 192 Human CNEs from Vista Enhancer browser
(http://enhancer.lbl.gov/). Through comparative syntenic analysis we identified
syntenic blocks of these 192 CNEs in teleost fishes like zebrafish, medaka,
stickleback, fugu and tetradon. Then we hunted for the gene/genes which is/are
shared by syntenic blocks of all the examined genomes. These genes are
considered as putative targets for the respective CNEs. Further analysis is then
carried out on these genes. Endogenous expression pattern of putative target
genes are retrieved from MGI (http://www.informatics.jax.org/), a Gene
Expression Database (GXD). Analogy in the expression pattern of putative target
gene and CNE induced reporter gene expression pattern validate the association
between CNE and putative target gene.
For some CNEs our analysis reaffirms Pennacchio’s suggestion but many of the
elements are proved to regulate the expression pattern of the genes present not at
the closest proximity of CNE enhancer as prescribed by Pennacchio. We found
target genes of few CNE-enhancer elements are even positioned more than 1Mb
away from these elements and intervening genomic region between the CNE-
enhancer elements and target genes harbor many bystander genes, which are not

Chapter4-Discussion
82
specifically under the control of regulatory elements that derive the target genes,
forming genomic regulatory blocks (GRBs).
Based on evolutionarily conserved physical linkage and comparison of CNE
induced reporter expression with known endogenous expression pattern of
neighboring genes, approximately two third of our candidate CNEs (142/192) are
proved to be unambiguously associated with single target gene. However we were
unable to assign a single target gene for 50 CNEs due to conservation of many
genes in the neighborhood of enhancer and similarity in expression of enhancer
and more than one conserved genes. These enhancers were thought to regulate the
expression of any of the associated gene or they may be involved in the regulation
of each of the associated gene representing the example of enhancer sharing.
Assignment of CNEs to individual genes enables us to calculate the distances that
separate these elements from their predicted targets. It was the general assumption
that most of the CNEs have predicted targets within 250 kb but during our
analysis we found 50% of our selected CNEs are far away than 250kb from their
target genes. Such a high percentage suggest that their occurrence at a large
distance from their target gene is not by chance rather this distance might be
critical for their proper functioning. Among our selected subset of CNE-
enhancers, 18.75% of our selected subset of enhancers are located within the
intronic region of genes they are regulating, 24.48% are separated by distance of
0-200kb from their respective genes, 16.67%, 9.89% and 14.06% enhancers are at
a range of 201-400kb, 401-600 and 601-999kb from their target genes
respectively, whereas 16.14% of the enhancers are located at a distance greater
than 1MB from their associated genes. Previously estimated longest distance limit
between the experimentally verified enhancer and its target gene is ~1MB, e.g.
SHH(Lettice et al., 2003). Our analysis permits us to gauge the distance limit over
which an enhancer can act on its putative target gene.

Chapter4-Discussion
83
Gene duplication events are known to be responsible for the evolution of new
gene functions. It is an important mechanism for acquiring new genes and
creating genetic novelty in organisms. Many new gene functions have evolved
through gene duplication and it has contributed tremendously to the evolution of
developmental programes in various organisms(Magdum, et al., 2013). Single
gene does not undergo duplication rather the whole GRB get duplicated. Through
duplication degeneration complementation model duplicated GRBs get rid of
their bystander genes because evolutionary constraint might be expected to be
relaxed upon duplication, and changes might be detected in both gene retention
and the preservation of CNEs after GRB duplication. Syntenic blocks containing
developmental regulatory genes are kept together by essential regulatory
elements. Therefore we mapped selected CNEs and genes within areas in which
both copies of the presumed GRB target gene were retained after duplication in
human and teleost fishes. Such duplicated loci are assumed to share the
expression domains of the ancesteral single locus (Force A et al., 1999). The
likely fates of the duplicated copy of genes are pseudogenization: degeneration of
one of the pair to a pseudogene or neofunctionaliztion: acquisition of novel gene
functions as a result of alteration in coding or regulatory sequences. Another fate
of duplicated copy may be subfunctionalization in which duplicated copy undergo
complementary loss of function in coding regions or cis-regulatory modules so
that both duplicated copies are retained for normal gene functioning.
Among CNE-enhancers analyzed in this study, 9% shared duplicated copies in
human and fishes suggesting that these enhancers might have duplicated in the
ancestor of tetrapod-teleost lineages and duplicated copies are not only passed to
both of these lineages but are also retained by the most recent descendants of
these lineages. 10% CNEs suggests fish specific expansion of enhancers implying
the two possibilities (i) duplication event occurred in teleost fishes after the
divergence of tetrapods from fishes (ii) duplication event occurred before the
divergence of tetrapods from fishes but only fishes inherited both copies of CNE
while tetrapods received only one copy of CNE from their common ancestor. 3%

Chapter4-Discussion
84
of the enhancers are showing tetrapod specific expansion again suggesting two
possibilities (i) duplication event occurred in tetrapods after the divergence of
tetrapods from fishes (ii) duplication event occurred before the divergence of
tetrapods from fishes but only tetrapods inherited both copies of CNE while fishes
received only one copy of CNE from their common ancestor. 78% of examined
CNEs remained unduplicated.
Another important finding of our research that boosted up our idea of considering
CNEs as cis regulatory elements is that all the duplicated CNEs (dCNE) in our
selected subset of enhancers are associated with paralogous copies of genes which
indicate that dCNEs are regulatory elements retained after duplication along with
their target genes in both human and fish lineages and are held responsible for the
regulation of trans-dev genes. In several cases the dCNEs are found in the
intergenic environment of our genome but are found in the intronic region of
target genes in another genomes and vice versa (McEwen GK, Woolfe A, Goode
D, Callaway H, & Elgar G, 2006).
The interaction between transcription factor (TF) proteins and transcription factor
binding sites (TFBS) is an important mechanism in regulating gene expression.
Transcription regulation is mediated by combinatorial interactions between
diverse trans-acting proteins and arrays of cis-regulatory sequences. Transcription
factor binding sites are degenerate (Bulyk, 2003) and transcription factors tend to
interact with small DNA sequences usually less than 20bp in length. Most of our
recruited CNEs are directing expression in brain hence we decided to propose
transcriptional factor binding site code for these brain specific CNEs that might
be critical in defining the neural tube specific functional aspects of vertebrate cis-
regulatory repertoire. Human CNE-enhancer sequence and its ortholog in mouse
are aligned to identify human-mouse conserved putative transcription factor
binding sites. Typically four to eight different transcription factors bind within an
enhancer and each factor can bind to multiple sites within it (Bulyk, 2003) i.e.
homotypic clusters of transcription factor binding sites. Homotypic clusters of

Chapter4-Discussion
85
transcription factor binding sites are known to have an important role as a
component of developmental enhancers(Gotea V et al., 2010).
Our analysis highlights those set of transcription factors which bind frequently to
enhancers regulating the expression of brain and revealed homotypic clustering of
specific set of transcription factors within brain of specific CNE-enhancers.
SOX5, HFH, SOX17, C-FOS, nMyc are some TFs that are showing homotypic
clustering in our set of enhancers. Among these SOX5, HFH, SOX17 and c-FOS
are found to be most frequently showing homotypic clustering in enhancers
regulating the expression in brain.
The complex control systems underlying organism development have probably
been evolving for more than a billion years. They regulate the expression of
thousands of genes in any given developmental process. They are essentially
hardwired genomic regulatory codes, the role of which is to specify the sets of
genes that must be expressed in specific spatial and temporal patterns. In physical
terms, these control systems consist of many thousands of modular DNA
sequences. Each such module receives and integrates multiple inputs, in the form
of regulatory proteins that recognize specific sequences within them. The end
result is the precise transcriptional control of the associated genes.
The 159 CNE enhancers across the 14 TFs are arranged into a data matrix,
mathematically defined as 159 14X .Looking for the patterns and structures in TFs,
primarily the data matrix is subjected to a two step exploratory data analysis.
Computation of a probability table and a correlation matrix 2[ ]ijR r
complete the
two steps employed for the initial exploration of patterns of TFs in 159 14X . The
two step exploration was successful in revealing the interactive pattern of TFs
within enhancers.
Applying Principal Component Analysis on 159 14X using [ ]ijR r has validated
the heterotypic clustering pattern of TFs perceived so far, in a 3D loading plot of
Chapter4-Discussion
86
the first three principal components (PCs). The first three PCs explained 60% of
the total variation present in the patterned correlated data set. The 3D loading plot
exhibits clarity of three distinct sets of closely packed TFs, i.e three cluster
configurations of TFs. The cluster configuration presented coincides with the
cluster configuration perceived in R , in addition to merging the two insignificant
TFs: Tal1b-E47S and MEF in Cluster3. The two TFs with ( )i
P TF less than 0.36
have their presence in enhancers common with the TFs in cluster3 so are merged
in it. Thus Cluster3 takes the form
Cluster3: Talb-E47S, MEF, FREAC, AML-1, c-FOS, HFN3- ,
SOX17, HFH, SOX5.
Conclusively there are three distinct clusters of TF internally interactive and
showing brain specific cis-regulatory modules binding site preferences.
Human brain is three times larger expected in a primate of comparable size. The
parts of the brain that have grown the most in human beings are in the
neocortex, and more specifically the prefrontal cortex which is part of
developing forebrain. Human higher cognition is attributed to the evolutionary
expansion and elaboration of the human cerebral cortex. In accordance with this
fact our conscious thoughts, emotions and many of our memories reside within
the forebrain and indeed it is this region of our CNS that confers many uniquely
human attributes. The level of complexity of the human forebrain makes it a
challenging task to reveal that how the patterning of its organization gets
transcriptionally regulated during embryonic development. The sophistication
of vertebrate forebrain is orchestrated through the signaling cascade of cis
regulatory modules, consequently to decipher this signal co-ordination is
obligatory to comprehend prototyping of forebrain.
Capturing of epigenetic marks and high- throughput sequencing resulted in the
identification of regulatory elements through the genome. Current proxy

Chapter4-Discussion
87
signatures of regulatory element activity and chromatin state include co-
activator binding (e.g. p300), histone modifications, binding of TFs or other
DNA-associated proteins (DNAse), chromatin accessibility, DNA methylation
etc. We focused on human cortex specific epigenetic marks to investigate cis-
regulatory elements involved in forebrain development and tried to draw a
conclusive TF TF co-occupancy network involved in forebrain development.
Spatiotemporal genic expression defining the cell fate is driven by the cell-
specific activation of DNA regulatory elements. To explore the nature’s strategy
to formulate more sophisticated forebrain, our goal in this study is to discover
cluster of TFs that act cooperatively to determine forebrain specificity of an
enhancer. To achieve this objective training (FSHEs) and control (NCNCS)
sequences were scanned for TFBSs of 93 TFs, which play central role in
forebrain development, with two different approaches (i) motif discovery
through statistical over-representation and continuous tag sequence density
estimation through DHSs map (ii) Regular expression based algorithm.
Regulatory DNA is characterized by the cooperative binding of sequence-
specific transcriptional regulatory factors in place of a canonical nucleosome,
leading to a remodeled chromatin state characterized by markedly heightened
accessibility to nucleases (GARY FELSENFELD,1996). DNase I
hypersensitive sites (DHSs) are markers of regulatory DNA and have
underpinned the discovery of all classes of cis-regulatory elements including
enhancers, promoters, insulators, silencers and locus control regions(Robert E
2012 Nature). Therefore to be more precise and accurate in formulating the
forebrain enhancer specificity in first approach, after scanning the sequences
(FSHEs/NCNCS) through Clover to predict binding sites, we adopted DHSs
map of three different cell lines (i) cortex (ii) cerebrum (iii) lymphocytes to
capture binding sites which dwell in the sequences (FSHEs/NCNCS) through
Fseq. Both the programs generated catalogue of binding sites of 93 TFs
separately for each of the three cell lines. We opted for the binding sites

Chapter4-Discussion
88
predicted by both the programs and generated the matrices of the frequency of
occurrence of filtered TFBSs for all three cell lines’ training (FSHEs) and
control sequences (NCNCs) respectively. This reduced the false positive rate of
prediction to greater extent, and we end up with only true positive predictions of
binding motifs. Results are generated in the form of matrices of the frequency of
occurrence of conserved TFBSs for training (FSHEs) and control (NCNCS)
sequences.
Functional elements are considered to have more sequence constraint than non-
functional regions and therefore can tolerate a slower rate of sequence change
over time. Thus in second strategy, after scanning the aligned sequences through
regular expression based algorithm, phylogenetic footprinting technique has
been applied to human and mouse orthologous sequences to unravel those
conserved TFBS that have been retained over a long evolutionary distance.
Results are generated in the form of matrices of the frequency of occurrence of
conserved TFBSs for training (FSHEs) and control (NCNCS) sequences.
The matrices from both strategies were then subjected to PCA to identify the
cluster structures in the binding site preferences of the training (FSHEs) and
control (NCNCs) sequences.
The 3D loading plot of the first 3 PCs derived from PCA on training and control
data revealed the distinctive scenario of interactive pattern of TFs across the
FSHEs and non-interactive pattern of TFs across NCNCs in all the four datasets.
These findings are reinforcing the theory of cooperative binding of TFs for
enhancer activation. We observed 44, 46 and 40- members of cerebrum, cortex
and lymphocyte specific clusters respectively for training sequences (FSHEs)
and no cluster in any of the cell line for control sequences (NCNCs). Regular
expression based data generated cluster of 39 TFs in training data set and
absence of any cluster in control data set was reported. These findings clearly
depict the phenomenon of co-operative binding of TF on CRMs for their tissue

Chapter4-Discussion
89
specificity. Absence of binding motif clusters in control sequences (NCNCs)
authenticates our prediction as true positives.
Distal DHSs having certain functions e.g. enhancers exhibit stereotypic
patternining. Large majority of such elements (having similar stereotype
patterns) are present within the same cell type and is also shared among the
related cell types (sharing the recognition motifs for the same set of regulatory
factors), but show potent regulatory activity only in relevant cells (Robert E
2012 Nature). On the basis of this abstraction we accomplished major objective
"forebrain enhancer specificity" of this study by digging out for common
members (TFs) from all three cell line specific clusters in FSHEs. Cerebrum,
cortex and lymphocytes specific clusters shared total of the 32 (69%) members
(TFs) which is in accordance with the findings that out of 2,890,742 distinct
high-confidence DHSs, 1,920,642 (66%) are active in 2 or more cell types
(Thurman, et al., 2012). We considered this common cluster as forebrain
specific cluster because our data set was confined to only forebrain (FSHEs and
TFs), and also we have DHSs map from two forebrain cell lines (cerebrum and
cortex).We assume that this particular signature pattern is present in GM12878
cell line but is in dormant condition due to being irrelative to this cell line.
To be more precise and accurate we applied another filter on our results. The
common 32 TFs (from three cell lines) were then searched in regular expression
specific cluster of 39 TFs, and 23 TFs were found common in them. These 23
TFs are then considered as mandatory for the activation of forebrain specific
enhancers.

Chapter5-Conclusion
90
Conclusion and future prospects
In this study for the first time functionally identified and deeply conserved
CNE-enhancer was associated to their target genes through comparative
genomic analysis. Our results showed that majority of the regulatory elements
are controlling the expression pattern of their target genes from far away
distances (more than 1Mb). These CNE-target gene association can be helpful
understanding signaling networks during development and diagnosis for
diseases with altered expression pattern of gene without any mutation in gene
sequence. Defining forebrain specific transcription code through computational
and experimental information of cis-regulatory elements led us to the
identification of concessive 23 co occurring TFs in forebrain specific CNE-
enhancers. Therefore, forebrain specific expression of distinct gene sets has
been associated with the cooperative interactions among at least these 23 TFs.
This information can be taken as learned data to find out genome wide regions
having cluster of these 23 binding motifs within the defined window (e.g 1.5kb).
Then some of them could be experimentally tested to confirm these findings.
Chapter6-References
91
References
Aboitiz, F. (1994). The evolution of brain size and organization in vertebrates. A program for research. Biol Res, 27(1), 15-27.
Alifragis, P., Liapi, A., & Parnavelas, J. G. (2004). Lhx6 regulates the migration of cortical interneurons from the ventral telencephalon but does not specify their GABA phenotype. J Neurosci, 24(24), 5643-5648.
Asbreuk, C. H., van Schaick, H. S., Cox, J. J., Kromkamp, M., Smidt, M. P., & Burbach, J. P. (2002). The homeobox genes Lhx7 and Gbx1 are expressed in the basal forebrain cholinergic system. Neuroscience, 109(2), 287-298.
Azim, E., Jabaudon, D., Fame, R. M., & Macklis, J. D. (2009). SOX6 controls dorsal progenitor identity and interneuron diversity during neocortical development. Nat Neurosci, 12(10), 1238-1247.
Barton, R. A., & Harvey, P. H. (2000). Mosaic evolution of brain structure in mammals. Nature, 405(6790), 1055-1058.
Beccari, L., Marco-Ferreres, R., & Bovolenta, P. (2013). The logic of gene regulatory networks in early vertebrate forebrain patterning. Mech Dev, 130(2-3), 95-111.
Bejerano, G., Pheasant, M., Makunin, I., Stephen, S., Kent, W. J., Mattick, J. S., et al. (2004). Ultraconserved elements in the human genome. Science, 304(5675), 1321-1325.
Birney, E., Stamatoyannopoulos, J. A., Dutta, A., Guigo, R., Gingeras, T. R., Margulies, E. H., et al. (2007). Identification and analysis of functional elements in 1% of the human genome by the ENCODE pilot project. Nature, 447(7146), 799-816.
Boyle, A. P., Guinney, J., Crawford, G. E., & Furey, T. S. (2008). F-Seq: a feature density estimator for high-throughput sequence tags. Bioinformatics, 24(21), 2537-2538.
Bulfone, A., Kim, H. J., Puelles, L., Porteus, M. H., Grippo, J. F., & Rubenstein, J. L. (1993). The mouse Dlx-2 (Tes-1) gene is expressed in spatially restricted domains of the forebrain, face and limbs in midgestation mouse embryos. Mech Dev, 40(3), 129-140.
Bulfone, A., Martinez, S., Marigo, V., Campanella, M., Basile, A., Quaderi, N., et al. (1999). Expression pattern of the Tbr2 (Eomesodermin) gene during mouse and chick brain development. Mech Dev, 84(1-2), 133-138.
Bulfone, A., Puelles, L., Porteus, M. H., Frohman, M. A., Martin, G. R., & Rubenstein, J. L. (1993). Spatially restricted expression of Dlx-1, Dlx-2 (Tes-1), Gbx-2, and Wnt-3 in the embryonic day 12.5 mouse forebrain defines potential transverse and longitudinal segmental boundaries. J Neurosci, 13(7), 3155-3172.
Bulfone, A., Smiga, S. M., Shimamura, K., Peterson, A., Puelles, L., & Rubenstein, J. L. (1995). T-brain-1: a homolog of Brachyury whose expression defines molecularly distinct domains within the cerebral cortex. Neuron, 15(1), 63-78.
Bulyk, M. L. (2003). Computational prediction of transcription-factor binding site locations. Genome Biol, 5(1), 201.
Chotteau-Lelievre, A., Dolle, P., Peronne, V., Coutte, L., de Launoit, Y., & Desbiens, X. (2001). Expression patterns of the Ets transcription factors from the PEA3 group during early stages of mouse development. Mech Dev, 108(1-2), 191-195.

Chapter6-References
92
Cooper, G. M., Stone, E. A., Asimenos, G., Green, E. D., Batzoglou, S., & Sidow, A. (2005). Distribution and intensity of constraint in mammalian genomic sequence. Genome Res, 15(7), 901-913.
Creyghton, M. P., Cheng, A. W., Welstead, G. G., Kooistra, T., Carey, B. W., Steine, E. J., et al. (2010). Histone H3K27ac separates active from poised enhancers and predicts developmental state. Proc Natl Acad Sci U S A, 107(50), 21931-21936.
de la Pompa, J. L., Wakeham, A., Correia, K. M., Samper, E., Brown, S., Aguilera, R. J., et al. (1997). Conservation of the Notch signalling pathway in mammalian neurogenesis. Development, 124(6), 1139-1148.
Dien, J. (2012). Applying principal components analysis to event-related potentials: a tutorial. Dev Neuropsychol, 37(6), 497-517.
Diez-Roux, G., Banfi, S., Sultan, M., Geffers, L., Anand, S., Rozado, D., et al. (2011). A high-resolution anatomical atlas of the transcriptome in the mouse embryo. PLoS Biol, 9(1), e1000582.
Duret, L., & Bucher, P. (1997). Searching for regulatory elements in human noncoding sequences. Curr Opin Struct Biol, 7(3), 399-406.
Festenstein, R., Tolaini, M., Corbella, P., Mamalaki, C., Parrington, J., Fox, M., et al. (1996). Locus control region function and heterochromatin-induced position effect variegation. Science, 271(5252), 1123-1125.
Fickett, J. W. (1982). Recognition of protein coding regions in DNA sequences. Nucleic Acids Res, 10(17), 5303-5318.
Foley, A. C., & Stern, C. D. (2001). Evolution of vertebrate forebrain development: how many different mechanisms? J Anat, 199(Pt 1-2), 35-52.
Force A, Lynch M, Pickett FB, Amores A, Yan YL, & Postlethwait J. (1999). Preservation of duplicate genes by complementary, degenerative mutations. Genetics, 151, 1531-1545.
Frazer, K. A., Pachter, L., Poliakov, A., Rubin, E. M., & Dubchak, I. (2004). VISTA: computational tools for comparative genomics. Nucleic Acids Res, 32(Web Server issue), W273-279.
Frith, M. C., Fu, Y., Yu, L., Chen, J. F., Hansen, U., & Weng, Z. (2004). Detection of functional DNA motifs via statistical over-representation. Nucleic Acids Res, 32(4), 1372-1381.
Furusho, M., Ono, K., Takebayashi, H., Masahira, N., Kagawa, T., Ikeda, K., et al. (2006). Involvement of the Olig2 transcription factor in cholinergic neuron development of the basal forebrain. Dev Biol, 293(2), 348-357.
Geyer, P. K. (1997). The role of insulator elements in defining domains of gene expression. Curr Opin Genet Dev, 7(2), 242-248.
Gonzalez-Voyer, A., Winberg, S., & Kolm, N. (2009). Brain structure evolution in a basal vertebrate clade: evidence from phylogenetic comparative analysis of cichlid fishes. BMC Evol Biol, 9, 238.
Gotea V, Visel A, Westlund JM, Nobrega MA, Pennacchio LA, & ( 2010). Homotypic clusters of transcription factor binding sites are a key component of human promoters and enhancers. Genome Research, 20, 565-577.
Gray, P. A., Fu, H., Luo, P., Zhao, Q., Yu, J., Ferrari, A., et al. (2004). Mouse brain organization revealed through direct genome-scale TF expression analysis. Science, 306(5705), 2255-2257.
Grosveld, F., van Assendelft, G. B., Greaves, D. R., & Kollias, G. (1987). Position-independent, high-level expression of the human beta-globin gene in transgenic mice. Cell, 51(6), 975-985.

Chapter6-References
93
Grove, E. A., Tole, S., Limon, J., Yip, L., & Ragsdale, C. W. (1998). The hem of the embryonic cerebral cortex is defined by the expression of multiple Wnt genes and is compromised in Gli3-deficient mice. Development, 125(12), 2315-2325.
Hallonet, M., Hollemann, T., Pieler, T., & Gruss, P. (1999). Vax1, a novel homeobox-containing gene, directs development of the basal forebrain and visual system. Genes Dev, 13(23), 3106-3114.
Hammock, E. A., Eagleson, K. L., Barlow, S., Earls, L. R., Miller, D. M., 3rd, & Levitt, P. (2010). Homologs of genes expressed in Caenorhabditis elegans GABAergic neurons are also found in the developing mouse forebrain. Neural Dev, 5, 32.
Hardison, R. C. (2000). Conserved noncoding sequences are reliable guides to regulatory elements. Trends Genet, 16(9), 369-372.
Hardison, R. C., Oeltjen, J., & Miller, W. (1997). Long human-mouse sequence alignments reveal novel regulatory elements: a reason to sequence the mouse genome. Genome Res, 7(10), 959-966.
Heintzman, N. D., & Ren, B. (2009). Finding distal regulatory elements in the human genome. Curr Opin Genet Dev, 19(6), 541-549.
Hoch, R. V., Rubenstein, J. L., & Pleasure, S. (2009). Genes and signaling events that establish regional patterning of the mammalian forebrain. Semin Cell Dev Biol, 20(4), 378-386.
Hofman, M. A. (1989). On the evolution and geometry of the brain in mammals. Prog Neurobiol, 32(2), 137-158.
Inoue, T., Nakamura, S., & Osumi, N. (2000). Fate mapping of the mouse prosencephalic neural plate. Dev Biol, 219(2), 373-383.
Inoue, T., Ota, M., Ogawa, M., Mikoshiba, K., & Aruga, J. (2007). Zic1 and Zic3 regulate medial forebrain development through expansion of neuronal progenitors. J Neurosci, 27(20), 5461-5473.
Jean, D., Bernier, G., & Gruss, P. (1999). Six6 (Optx2) is a novel murine Six3-related homeobox gene that demarcates the presumptive pituitary/hypothalamic axis and the ventral optic stalk. Mech Dev, 84(1-2), 31-40.
Kadonaga, J. T. (2004). Regulation of RNA polymerase II transcription by sequence-specific DNA binding factors. Cell, 116(2), 247-257.
Kiernan, J., & Rajakumar, R. (2013). Barr's The human nervous system: an anatomical viewpoint. Kikuta, H., Laplante, M., Navratilova, P., Komisarczuk, A. Z., Engstrom, P. G., Fredman, D., et al.
(2007). Genomic regulatory blocks encompass multiple neighboring genes and maintain conserved synteny in vertebrates. Genome Res, 17(5), 545-555.
Lagutin, O. V., Zhu, C. C., Kobayashi, D., Topczewski, J., Shimamura, K., Puelles, L., et al. (2003). Six3 repression of Wnt signaling in the anterior neuroectoderm is essential for vertebrate forebrain development. Genes Dev, 17(3), 368-379.
Lettice, L. A., Heaney, S. J., Purdie, L. A., Li, L., de Beer, P., Oostra, B. A., et al. (2003). A long-range Shh enhancer regulates expression in the developing limb and fin and is associated with preaxial polydactyly. Hum Mol Genet, 12(14), 1725-1735.
Levine, M., & Tjian, R. (2003). Transcription regulation and animal diversity. Nature, 424(6945), 147-151.
Lomvardas, S., Barnea, G., Pisapia, D. J., Mendelsohn, M., Kirkland, J., & Axel, R. (2006). Interchromosomal interactions and olfactory receptor choice. Cell, 126(2), 403-413.
Loots, G. G., Locksley, R. M., Blankespoor, C. M., Wang, Z. E., Miller, W., Rubin, E. M., et al. (2000). Identification of a coordinate regulator of interleukins 4, 13, and 5 by cross-species sequence comparisons. Science, 288(5463), 136-140.

Chapter6-References
94
Magdaleno, S., Jensen, P., Brumwell, C. L., Seal, A., Lehman, K., Asbury, A., et al. (2006). BGEM: an in situ hybridization database of gene expression in the embryonic and adult mouse nervous system. PLoS Biol, 4(4), e86.
Magdum, S., Banerjee, U., Murugan, P., Doddabhimappa, & Ravikesavan, R. (2013). Gene duplication as a major force in evolution. Journal of Genetics, 92, 7.
Manuel, M., Martynoga, B., Yu, T., West, J. D., Mason, J. O., & Price, D. J. (2010). The transcription factor Foxg1 regulates the competence of telencephalic cells to adopt subpallial fates in mice. Development, 137(3), 487-497.
Martinez-Barbera, J. P., Rodriguez, T. A., & Beddington, R. S. (2000). The homeobox gene Hesx1 is required in the anterior neural ectoderm for normal forebrain formation. Dev Biol, 223(2), 422-430.
Maston, G. A., Evans, S. K., & Green, M. R. (2006). Transcriptional regulatory elements in the human genome. Annu Rev Genomics Hum Genet, 7, 29-59.
McEwen GK, Woolfe A, Goode D, V. T., Callaway H, & Elgar G. (2006). Ancient duplicated conserved non-coding elements in vertebrates: a genomic and functional analysis. Genome Research, 16, 451-465.
Miura, H., Yanazawa, M., Kato, K., & Kitamura, K. (1997). Expression of a novel aristaless related homeobox gene 'Arx' in the vertebrate telencephalon, diencephalon and floor plate. Mech Dev, 65(1-2), 99-109.
Monuki, E. S., Porter, F. D., & Walsh, C. A. (2001). Patterning of the dorsal telencephalon and cerebral cortex by a roof plate-Lhx2 pathway. Neuron, 32(4), 591-604.
Noonan, J. P. (2009). Regulatory DNAs and the evolution of human development. Curr Opin Genet Dev, 19(6), 557-564.
Northcutt, R. G. (2002). Understanding vertebrate brain evolution. Integr Comp Biol, 42(4), 743-756.
Osorio, J., Mueller, T., Retaux, S., Vernier, P., & Wullimann, M. F. (2010). Phylotypic expression of the bHLH genes Neurogenin2, Neurod, and Mash1 in the mouse embryonic forebrain. J Comp Neurol, 518(6), 851-871.
Ovcharenko, I., Nobrega, M. A., Loots, G. G., & Stubbs, L. (2004). ECR Browser: a tool for visualizing and accessing data from comparisons of multiple vertebrate genomes. Nucleic Acids Res, 32(Web Server issue), W280-286.
Parveen, N., Masood, A., Iftikhar, N., Minhas, B. F., Minhas, R., Nawaz, U., et al. (2013). Comparative genomics using teleost fish helps to systematically identify target gene bodies of functionally defined human enhancers. BMC Genomics, 14, 122.
Pennacchio, L. A., Ahituv, N., Moses, A. M., Prabhakar, S., Nobrega, M. A., Shoukry, M., et al. (2006). In vivo enhancer analysis of human conserved non-coding sequences. Nature, 444(7118), 499-502.
Peterson, B. K., Hare, E. E., Iyer, V. N., Storage, S., Conner, L., Papaj, D. R., et al. (2009). Big genomes facilitate the comparative identification of regulatory elements. PLoS One, 4(3), e4688.
Prabhakar, S., Poulin, F., Shoukry, M., Afzal, V., Rubin, E. M., Couronne, O., et al. (2006). Close sequence comparisons are sufficient to identify human cis-regulatory elements. Genome Res, 16(7), 855-863.
Qiu, Y., Cooney, A. J., Kuratani, S., DeMayo, F. J., Tsai, S. Y., & Tsai, M. J. (1994). Spatiotemporal expression patterns of chicken ovalbumin upstream promoter-transcription factors in the developing mouse central nervous system: evidence for a role in segmental patterning of the diencephalon. Proc Natl Acad Sci U S A, 91(10), 4451-4455.

Chapter6-References
95
Rada-Iglesias, A., Bajpai, R., Swigut, T., Brugmann, S. A., Flynn, R. A., & Wysocka, J. (2011). A unique chromatin signature uncovers early developmental enhancers in humans. Nature, 470(7333), 279-283.
Remenyi, A., Scholer, H. R., & Wilmanns, M. (2004). Combinatorial control of gene expression. Nat Struct Mol Biol, 11(9), 812-815.
Royo, J. L., Bessa, J., Hidalgo, C., Fernandez-Minan, A., Tena, J. J., Roncero, Y., et al. (2012). Identification and analysis of conserved cis-regulatory regions of the MEIS1 gene. PLoS One, 7(3), e33617.
Sajan, S. A., Rubenstein, J. L., Warchol, M. E., & Lovett, M. (2011). Identification of direct downstream targets of Dlx5 during early inner ear development. Hum Mol Genet, 20(7), 1262-1273.
Salas, C., Broglio, C., & Rodriguez, F. (2003). Evolution of forebrain and spatial cognition in vertebrates: conservation across diversity. Brain Behav Evol, 62(2), 72-82.
Sandelin, A., Wasserman, W. W., & Lenhard, B. (2004). ConSite: web-based prediction of regulatory elements using cross-species comparison. Nucleic Acids Res, 32(Web Server issue), W249-252.
Schwartz, S., Zhang, Z., Frazer, K. A., Smit, A., Riemer, C., Bouck, J., et al. (2000). PipMaker--a web server for aligning two genomic DNA sequences. Genome Res, 10(4), 577-586.
Shim, S., Kwan, K. Y., Li, M., Lefebvre, V., & Sestan, N. (2012). Cis-regulatory control of corticospinal system development and evolution. Nature, 486(7401), 74-79.
Shimizu, T., & Hibi, M. (2009). Formation and patterning of the forebrain and olfactory system by zinc-finger genes Fezf1 and Fezf2. Dev Growth Differ, 51(3), 221-231.
Siepel, A., Bejerano, G., Pedersen, J. S., Hinrichs, A. S., Hou, M., Rosenbloom, K., et al. (2005). Evolutionarily conserved elements in vertebrate, insect, worm, and yeast genomes. Genome Res, 15(8), 1034-1050.
Soo, K., O'Rourke, M. P., Khoo, P. L., Steiner, K. A., Wong, N., Behringer, R. R., et al. (2002). Twist function is required for the morphogenesis of the cephalic neural tube and the differentiation of the cranial neural crest cells in the mouse embryo. Dev Biol, 247(2), 251-270.
Thurman, R. E., Rynes, E., Humbert, R., Vierstra, J., Maurano, M. T., Haugen, E., et al. (2012). The accessible chromatin landscape of the human genome. Nature, 489(7414), 75-82.
Vavouri, T., McEwen, G. K., Woolfe, A., Gilks, W. R., & Elgar, G. (2006). Defining a genomic radius for long-range enhancer action: duplicated conserved non-coding elements hold the key. Trends Genet, 22(1), 5-10.
Visel, A., Alvarez-Bolado, G., Thaller, C., & Eichele, G. (2006). Comprehensive analysis of the expression patterns of the adenylate cyclase gene family in the developing and adult mouse brain. J Comp Neurol, 496(5), 684-697.
Visel, A., Bristow, J., & Pennacchio, L. A. (2007). Enhancer identification through comparative genomics. Semin Cell Dev Biol, 18(1), 140-152.
Visel, A., Prabhakar, S., Akiyama, J. A., Shoukry, M., Lewis, K. D., Holt, A., et al. (2008). Ultraconservation identifies a small subset of extremely constrained developmental enhancers. Nat Genet, 40(2), 158-160.
Visel, A., Taher, L., Girgis, H., May, D., Golonzhka, O., Hoch, R. V., et al. (2013). A high-resolution enhancer atlas of the developing telencephalon. Cell, 152(4), 895-908.
Visel, A., Thaller, C., & Eichele, G. (2004). GenePaint.org: an atlas of gene expression patterns in the mouse embryo. Nucleic Acids Res, 32(Database issue), D552-556.

Chapter6-References
96
Wang, C., Zhang, M. Q., & Zhang, Z. (2013). Computational identification of active enhancers in model organisms. Genomics Proteomics Bioinformatics, 11(3), 142-150.
Wasserman, W. W., Palumbo, M., Thompson, W., Fickett, J. W., & Lawrence, C. E. (2000). Human-mouse genome comparisons to locate regulatory sites. Nat Genet, 26(2), 225-228.
Wilson, S. W., & Houart, C. (2004). Early steps in the development of the forebrain. Dev Cell, 6(2), 167-181.
Wingender, E. (2008). The TRANSFAC project as an example of framework technology that supports the analysis of genomic regulation. Brief Bioinform, 9(4), 326-332.
Woolfe, A., & Elgar, G. (2007). Comparative genomics using Fugu reveals insights into regulatory subfunctionalization. Genome Biol, 8(4), R53.
Woolfe, A., & Elgar, G. (2008). Organization of conserved elements near key developmental regulators in vertebrate genomes. Adv Genet, 61, 307-338.
Yang, N., Dong, Z., & Guo, S. (2012). Fezf2 regulates multilineage neuronal differentiation through activating basic helix-loop-helix and homeodomain genes in the zebrafish ventral forebrain. J Neurosci, 32(32), 10940-10948.
Yoshida, M., Suda, Y., Matsuo, I., Miyamoto, N., Takeda, N., Kuratani, S., et al. (1997). Emx1 and Emx2 functions in development of dorsal telencephalon. Development, 124(1), 101-111.
Yun, K., Garel, S., Fischman, S., & Rubenstein, J. L. (2003). Patterning of the lateral ganglionic eminence by the Gsh1 and Gsh2 homeobox genes regulates striatal and olfactory bulb histogenesis and the growth of axons through the basal ganglia. J Comp Neurol, 461(2), 151-165.
Zembrzycki, A., Griesel, G., Stoykova, A., & Mansouri, A. (2007). Genetic interplay between the transcription factors Sp8 and Emx2 in the patterning of the forebrain. Neural Dev, 2, 8.
Zhao, Y., Marin, O., Hermesz, E., Powell, A., Flames, N., Palkovits, M., et al. (2003). The LIM-homeobox gene Lhx8 is required for the development of many cholinergic neurons in the mouse forebrain. Proc Natl Acad Sci U S A, 100(15), 9005-9010.

List of Publications
97
List of Publication
Published Articles
Parveen, N., Masood, A., Iftikhar, N., Minhas, B. F., Minhas, R., Nawaz, U., et
al. (2013). Comparative genomics using teleost fish helps to systematically
identify target gene bodies of functionally defined human enhancers. BMC
Genomics, 14, 122
Ali S., Bibi A., Anwar S., Minhas R., Parveen N., Azam S.S., Nawaz U and
Abbasi A A(2016) Genomic features of human limb specific
enhancers.Genomics.
Articles in Pipeline.
Defining TF binding code for forebrain