comparative studies of lightweight deflectometer and ... · comparative studies of lightweight...
TRANSCRIPT
ww.sciencedirect.com
j o u r n a l o f t r a ffi c and t r an s p o r t a t i o n e n g i n e e r i n g ( e n g l i s h e d i t i o n ) 2 0 1 6 ; 3 ( 5 ) : 4 3 8e4 4 7
Available online at w
ScienceDirect
journal homepage: www.elsevier .com/locate/ j t te
Original Research Paper
Comparative studies of lightweight deflectometerand Benkelman beam deflectometer in lowvolume roads
Sunny Deol Guzzarlapudi*, Vinod Kumar Adigopula, Rakesh Kumar
Department of Civil Engineering, Sardar Vallabhbhai National Institute of Technology, Surat 395007, India
a r t i c l e i n f o
Article history:
Available online 25 September 2016
Keywords:
Low volume road
Lightweight deflectometer
Backcalculated subgrade moduli
Composite moduli of subgrade
Static moduli of subgrade
* Corresponding author. Tel.: þ91 958910316E-mail addresses: [email protected]
com (R. Kumar).
Peer review under responsibility of Periodichttp://dx.doi.org/10.1016/j.jtte.2016.09.0052095-7564/© 2016 Periodical Offices of Chanaccess article under the CC BY-NC-ND licen
a b s t r a c t
A comparative subgrade moduli study is carried out by static and dynamic deflection
methods using lightweight deflectometer and conventional Benkelman beam deflec-
tometer on low volume road. Field and laboratory tests are performed at 40 test locations
on in-service road of 2 km stretch that contains three common types of cohesive soils (CH,
CI, and CL). Pavement static and dynamic responses are estimated to ascertain static,
backcalculated, and composite moduli of subgrade. The backcalculated and composite
moduli of subgrade is validated at given moisture content using repeated triaxial test.
Static moduli values are on lower side as compared with dynamic moduli values whereas
the composite, and laboratory moduli of subgrade are approximately consistent with 2% to
7% variation, respectively. Correlation analyses between static and dynamic moduli of
different types of subgrade soils depict good correlation of determination (R2) varies be-
tween 0.75 and 0.91. Subsequently, validation of static moduli with California bearing ratio
(CBR) related subgrade moduli shows moderate correlation of 0.67 to 0.74 whereas dynamic
moduli shows good correlation of 0.74 to 0.93 for different types of soils, respectively.
Therefore, the comparative analysis shows that lightweight deflectometer provides reliable
subgrade moduli values, and it can be used as a quick subgrade strength evaluating tool for
low volume roads.
© 2016 Periodical Offices of Chang'an University. Publishing services by Elsevier B.V. on
behalf of Owner. This is an open access article under the CC BY-NC-ND license (http://
creativecommons.org/licenses/by-nc-nd/4.0/).
1. Introduction
The current method of structural evaluation system largely
depends upon static deflection techniques for Indian low
volume roads (Reddy and Veeraragavan, 1997). Recently,
6.(S. D. Guzzarlapudi), vin
al Offices of Chang'an Un
g'an University. Publishinse (http://creativecommo
government of India estimated that, approximately for low
volume roads (LVRs), the 5-year routine maintenance cost
was in the range of 6%e13% of construction cost during the
base year 2013 (Barodiya and Pateriya, 2014). The non-
destructive testing techniques are recommended in road
construction and evaluation practices for Indian highways to
[email protected] (V. K. Adigopula), rakesh1999@gmail.
iversity.
g services by Elsevier B.V. on behalf of Owner. This is an openns.org/licenses/by-nc-nd/4.0/).
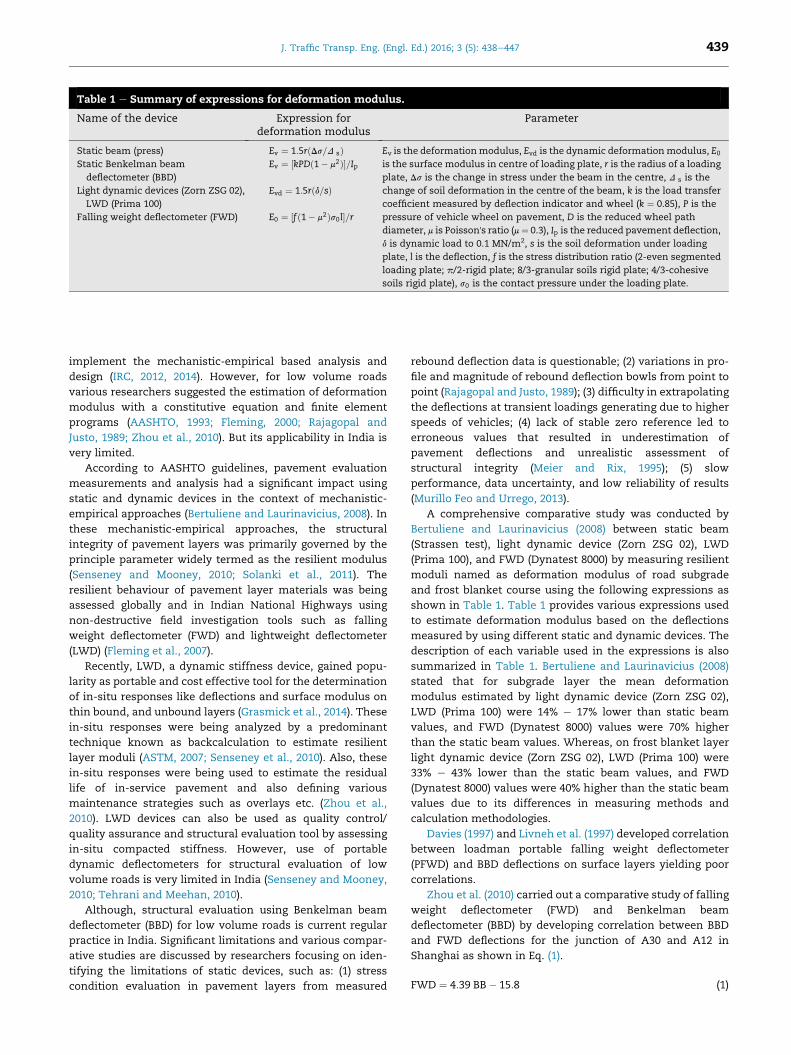
Table 1 e Summary of expressions for deformation modulus.
Name of the device Expression fordeformation modulus
Parameter
Static beam (press) Ev ¼ 1:5rðDs=D sÞ Ev is the deformationmodulus, Evd is the dynamic deformationmodulus, E0
is the surface modulus in centre of loading plate, r is the radius of a loading
plate, Ds is the change in stress under the beam in the centre, D s is the
change of soil deformation in the centre of the beam, k is the load transfer
coefficient measured by deflection indicator and wheel (k ¼ 0.85), P is the
pressure of vehicle wheel on pavement, D is the reduced wheel path
diameter, m is Poisson's ratio (m¼ 0.3), Ip is the reduced pavement deflection,
d is dynamic load to 0.1 MN/m2, s is the soil deformation under loading
plate, l is the deflection, f is the stress distribution ratio (2-even segmented
loading plate; p/2-rigid plate; 8/3-granular soils rigid plate; 4/3-cohesive
soils rigid plate), s0 is the contact pressure under the loading plate.
Static Benkelman beam
deflectometer (BBD)
Ev ¼ ½kPDð1� m2Þ�=Ip
Light dynamic devices (Zorn ZSG 02),
LWD (Prima 100)
Evd ¼ 1:5rðd=sÞ
Falling weight deflectometer (FWD) E0 ¼ ½fð1� m2Þs0l�=r
J. Traffic Transp. Eng. (Engl. Ed.) 2016; 3 (5): 438e447 439
implement the mechanistic-empirical based analysis and
design (IRC, 2012, 2014). However, for low volume roads
various researchers suggested the estimation of deformation
modulus with a constitutive equation and finite element
programs (AASHTO, 1993; Fleming, 2000; Rajagopal and
Justo, 1989; Zhou et al., 2010). But its applicability in India is
very limited.
According to AASHTO guidelines, pavement evaluation
measurements and analysis had a significant impact using
static and dynamic devices in the context of mechanistic-
empirical approaches (Bertuliene and Laurinavicius, 2008). In
these mechanistic-empirical approaches, the structural
integrity of pavement layers was primarily governed by the
principle parameter widely termed as the resilient modulus
(Senseney and Mooney, 2010; Solanki et al., 2011). The
resilient behaviour of pavement layer materials was being
assessed globally and in Indian National Highways using
non-destructive field investigation tools such as falling
weight deflectometer (FWD) and lightweight deflectometer
(LWD) (Fleming et al., 2007).
Recently, LWD, a dynamic stiffness device, gained popu-
larity as portable and cost effective tool for the determination
of in-situ responses like deflections and surface modulus on
thin bound, and unbound layers (Grasmick et al., 2014). These
in-situ responses were being analyzed by a predominant
technique known as backcalculation to estimate resilient
layer moduli (ASTM, 2007; Senseney et al., 2010). Also, these
in-situ responses were being used to estimate the residual
life of in-service pavement and also defining various
maintenance strategies such as overlays etc. (Zhou et al.,
2010). LWD devices can also be used as quality control/
quality assurance and structural evaluation tool by assessing
in-situ compacted stiffness. However, use of portable
dynamic deflectometers for structural evaluation of low
volume roads is very limited in India (Senseney and Mooney,
2010; Tehrani and Meehan, 2010).
Although, structural evaluation using Benkelman beam
deflectometer (BBD) for low volume roads is current regular
practice in India. Significant limitations and various compar-
ative studies are discussed by researchers focusing on iden-
tifying the limitations of static devices, such as: (1) stress
condition evaluation in pavement layers from measured
rebound deflection data is questionable; (2) variations in pro-
file and magnitude of rebound deflection bowls from point to
point (Rajagopal and Justo, 1989); (3) difficulty in extrapolating
the deflections at transient loadings generating due to higher
speeds of vehicles; (4) lack of stable zero reference led to
erroneous values that resulted in underestimation of
pavement deflections and unrealistic assessment of
structural integrity (Meier and Rix, 1995); (5) slow
performance, data uncertainty, and low reliability of results
(Murillo Feo and Urrego, 2013).
A comprehensive comparative study was conducted by
Bertuliene and Laurinavicius (2008) between static beam
(Strassen test), light dynamic device (Zorn ZSG 02), LWD
(Prima 100), and FWD (Dynatest 8000) by measuring resilient
moduli named as deformation modulus of road subgrade
and frost blanket course using the following expressions as
shown in Table 1. Table 1 provides various expressions used
to estimate deformation modulus based on the deflections
measured by using different static and dynamic devices. The
description of each variable used in the expressions is also
summarized in Table 1. Bertuliene and Laurinavicius (2008)
stated that for subgrade layer the mean deformation
modulus estimated by light dynamic device (Zorn ZSG 02),
LWD (Prima 100) were 14% e 17% lower than static beam
values, and FWD (Dynatest 8000) values were 70% higher
than the static beam values. Whereas, on frost blanket layer
light dynamic device (Zorn ZSG 02), LWD (Prima 100) were
33% e 43% lower than the static beam values, and FWD
(Dynatest 8000) values were 40% higher than the static beam
values due to its differences in measuring methods and
calculation methodologies.
Davies (1997) and Livneh et al. (1997) developed correlation
between loadman portable falling weight deflectometer
(PFWD) and BBD deflections on surface layers yielding poor
correlations.
Zhou et al. (2010) carried out a comparative study of falling
weight deflectometer (FWD) and Benkelman beam
deflectometer (BBD) by developing correlation between BBD
and FWD deflections for the junction of A30 and A12 in
Shanghai as shown in Eq. (1).
FWD ¼ 4:39 BB� 15:8 (1)

Fig. 1 e Condition of tested flexible pavement. (a) Test locations of LWD and BBD testing. (b) Average crust thickness and
composition of project stretch.
J. Traffic Transp. Eng. (Engl. Ed.) 2016; 3 (5): 438e447440
where FWD is the deflection induced by FWD, BB is the
deflection induced by Benkelman beam.
According to the study, the static modulus values were on
lowerside as compared with dynamic modulus values. The
tests results were interpreted, and the corresponding ratios
were determined between static and dynamic modulus
values. Thus, the previous studies mainly focussed on the use
of FWD and PFWD/LWD as a replacement to BBD for subgrade
strength evaluation on highways.
Considering the limitations of static BBD, there was a need
for the prerequisite to carryout comparative studies of both
regular dependency methods with new methods in order to
eliminate the ambiguity in selection of resilient moduli and to
establish as a reliable subgrade structural evaluation tool for
low volume roads.
Thus the objective of this study is to carryout a compara-
tive study between LWD and BBD as an in-situ subgrade
strength evaluating tool by estimating static and dynamic
moduli for low volume roads in India. The following tasks will
be performed: (1) field investigations for estimating de-
flections using LWD and BBD, laboratory investigations for
estimating basic soil properties and resilient modulus using
conventional tests and repeated triaxial apparatus, (2) esti-
mation of backcalculated composite and static moduli of
subgrade, (3) development and validation of correlations be-
tween static and dynamic moduli of subgrade.
Table 2 e Section crust composition.
Crust composition Average layer thickness (mm)
CH soil CI soil CL soil
Bituminous layer 150 152 149
Granular layer 289 294 293
Total 439 446 440
2. Experimental program and testingprotocol
2.1. Study area
An experimental investigationwas carried out on selected low
volume flexible pavement stretch of 2000 m long and 7 m
carriageway width during pre-monsoon season. The selected
stretch carries average daily traffic volume of 1500 passenger
car unit per day (PCU/d) in which commercial vehicles per day
(CVP/d) are about 275 in the state of Gujarat, India. The entire
project stretch was divided into 40 test sections of 50m length
in a staggered pattern as shown in Fig. 1(a). This figure
emphasized test point indicated on each test section along
the outer wheel path in both directions for BBD and LWD
tests. The pavement was constructed in the year 2013, and
the average existing crust thickness composition as per site
conditions comprised of 150 mm bituminous layer, 300 mm
base/subbase upon cohesive subgrade soil as shown in
Fig. 1(b). Pilot pavement condition survey on the selected
stretch was carried out, and ravelling, hungry surface,
Hairline cracks on few sections was diagnosed.
2.2. Field investigations
Detailed field investigations were performed during the pre-
monsoon season on the selected stretch using conventional
BBD and LWD as Indian Road Congress (IRC) and American
Society for Testing andMaterials (ASTM) standards. Pavement
responses such as deflections were collected using LWD and
BBD followed by pavement core sample from test pits on 40
test sections for identifying in-situ crust composition which
acted as seed values for backcalculation algorithms to esti-
mate in-situ layermoduli. Pavement crust thickness along the
study stretch was also explored from test pits as shown in
Table 2.
2.2.1. Static deflection tests (Benkelman beam deflectometer)Static pavement responses in terms of rebound deflections
were measured on 40 test sections using conventional BBD as
per IRC testing standards. Rebound deflections were
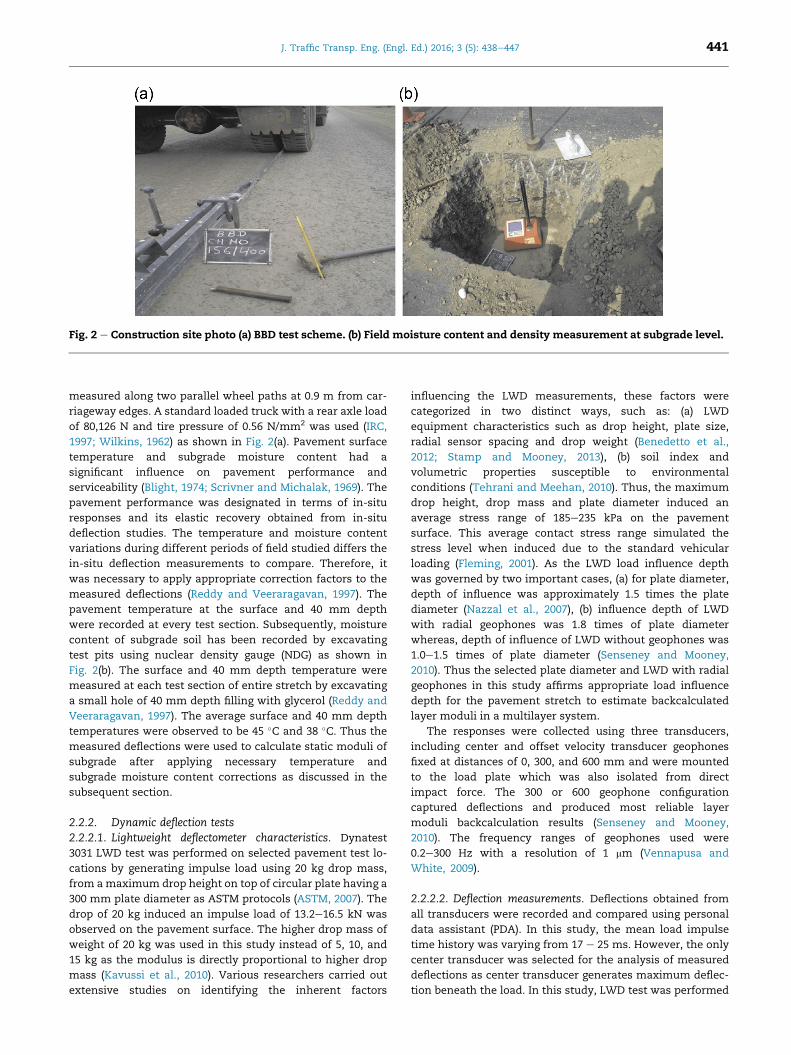
Fig. 2 e Construction site photo (a) BBD test scheme. (b) Field moisture content and density measurement at subgrade level.
J. Traffic Transp. Eng. (Engl. Ed.) 2016; 3 (5): 438e447 441
measured along two parallel wheel paths at 0.9 m from car-
riageway edges. A standard loaded truck with a rear axle load
of 80,126 N and tire pressure of 0.56 N/mm2 was used (IRC,
1997; Wilkins, 1962) as shown in Fig. 2(a). Pavement surface
temperature and subgrade moisture content had a
significant influence on pavement performance and
serviceability (Blight, 1974; Scrivner and Michalak, 1969). The
pavement performance was designated in terms of in-situ
responses and its elastic recovery obtained from in-situ
deflection studies. The temperature and moisture content
variations during different periods of field studied differs the
in-situ deflection measurements to compare. Therefore, it
was necessary to apply appropriate correction factors to the
measured deflections (Reddy and Veeraragavan, 1997). The
pavement temperature at the surface and 40 mm depth
were recorded at every test section. Subsequently, moisture
content of subgrade soil has been recorded by excavating
test pits using nuclear density gauge (NDG) as shown in
Fig. 2(b). The surface and 40 mm depth temperature were
measured at each test section of entire stretch by excavating
a small hole of 40 mm depth filling with glycerol (Reddy and
Veeraragavan, 1997). The average surface and 40 mm depth
temperatures were observed to be 45 �C and 38 �C. Thus the
measured deflections were used to calculate static moduli of
subgrade after applying necessary temperature and
subgrade moisture content corrections as discussed in the
subsequent section.
2.2.2. Dynamic deflection tests2.2.2.1. Lightweight deflectometer characteristics. Dynatest
3031 LWD test was performed on selected pavement test lo-
cations by generating impulse load using 20 kg drop mass,
from amaximum drop height on top of circular plate having a
300 mm plate diameter as ASTM protocols (ASTM, 2007). The
drop of 20 kg induced an impulse load of 13.2e16.5 kN was
observed on the pavement surface. The higher drop mass of
weight of 20 kg was used in this study instead of 5, 10, and
15 kg as the modulus is directly proportional to higher drop
mass (Kavussi et al., 2010). Various researchers carried out
extensive studies on identifying the inherent factors
influencing the LWD measurements, these factors were
categorized in two distinct ways, such as: (a) LWD
equipment characteristics such as drop height, plate size,
radial sensor spacing and drop weight (Benedetto et al.,
2012; Stamp and Mooney, 2013), (b) soil index and
volumetric properties susceptible to environmental
conditions (Tehrani and Meehan, 2010). Thus, the maximum
drop height, drop mass and plate diameter induced an
average stress range of 185e235 kPa on the pavement
surface. This average contact stress range simulated the
stress level when induced due to the standard vehicular
loading (Fleming, 2001). As the LWD load influence depth
was governed by two important cases, (a) for plate diameter,
depth of influence was approximately 1.5 times the plate
diameter (Nazzal et al., 2007), (b) influence depth of LWD
with radial geophones was 1.8 times of plate diameter
whereas, depth of influence of LWD without geophones was
1.0e1.5 times of plate diameter (Senseney and Mooney,
2010). Thus the selected plate diameter and LWD with radial
geophones in this study affirms appropriate load influence
depth for the pavement stretch to estimate backcalculated
layer moduli in a multilayer system.
The responses were collected using three transducers,
including center and offset velocity transducer geophones
fixed at distances of 0, 300, and 600 mm and were mounted
to the load plate which was also isolated from direct
impact force. The 300 or 600 geophone configuration
captured deflections and produced most reliable layer
moduli backcalculation results (Senseney and Mooney,
2010). The frequency ranges of geophones used were
0.2e300 Hz with a resolution of 1 mm (Vennapusa and
White, 2009).
2.2.2.2. Deflection measurements. Deflections obtained from
all transducers were recorded and compared using personal
data assistant (PDA). In this study, the mean load impulse
time history was varying from 17 e 25 ms. However, the only
center transducer was selected for the analysis of measured
deflections as center transducer generates maximum deflec-
tion beneath the load. In this study, LWD test was performed
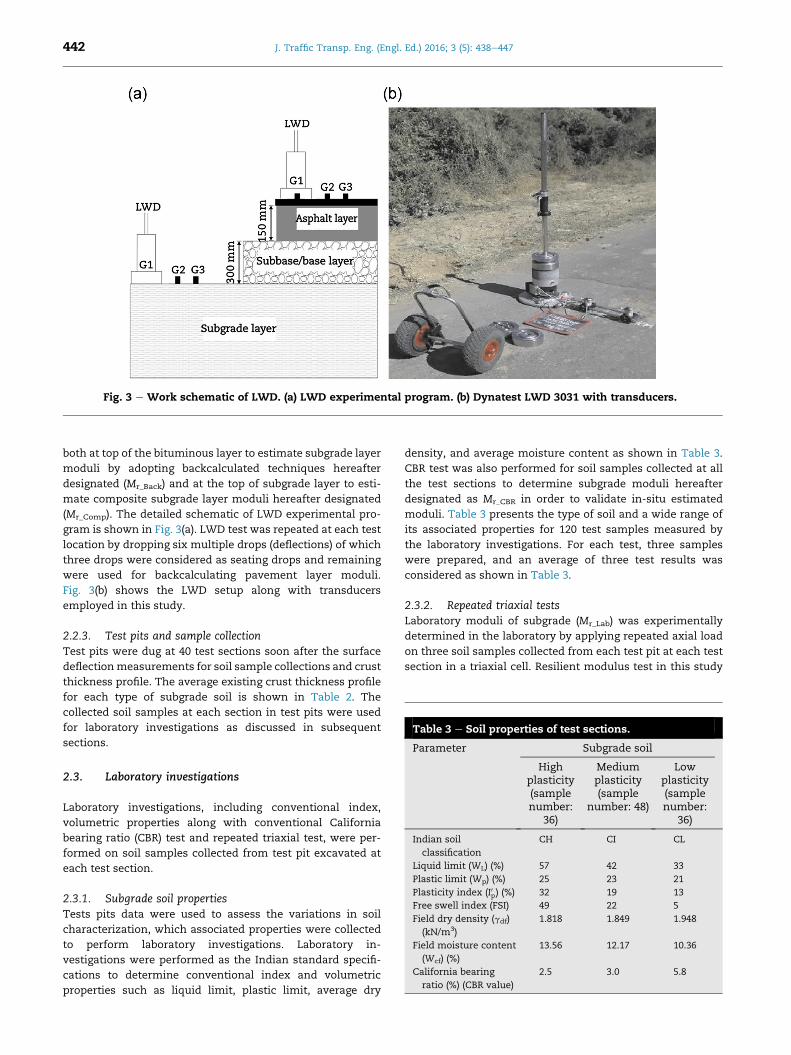
Fig. 3 e Work schematic of LWD. (a) LWD experimental program. (b) Dynatest LWD 3031 with transducers.
Table 3 e Soil properties of test sections.
Parameter Subgrade soil
J. Traffic Transp. Eng. (Engl. Ed.) 2016; 3 (5): 438e447442
both at top of the bituminous layer to estimate subgrade layer
moduli by adopting backcalculated techniques hereafter
designated (Mr_Back) and at the top of subgrade layer to esti-
mate composite subgrade layer moduli hereafter designated
(Mr_Comp). The detailed schematic of LWD experimental pro-
gram is shown in Fig. 3(a). LWD test was repeated at each test
location by dropping six multiple drops (deflections) of which
three drops were considered as seating drops and remaining
were used for backcalculating pavement layer moduli.
Fig. 3(b) shows the LWD setup along with transducers
employed in this study.
2.2.3. Test pits and sample collectionTest pits were dug at 40 test sections soon after the surface
deflectionmeasurements for soil sample collections and crust
thickness profile. The average existing crust thickness profile
for each type of subgrade soil is shown in Table 2. The
collected soil samples at each section in test pits were used
for laboratory investigations as discussed in subsequent
sections.
Highplasticity(samplenumber:
36)
Mediumplasticity(sample
number: 48)
Lowplasticity(samplenumber:
36)
Indian soil
classification
CH CI CL
Liquid limit (WL) (%) 57 42 33
Plastic limit (Wp) (%) 25 23 21
Plasticity index (I0p) (%) 32 19 13
Free swell index (FSI) 49 22 5
Field dry density (gdf)
(kN/m3)
1.818 1.849 1.948
Field moisture content
(Wcf) (%)
13.56 12.17 10.36
California bearing
ratio (%) (CBR value)
2.5 3.0 5.8
2.3. Laboratory investigations
Laboratory investigations, including conventional index,
volumetric properties along with conventional California
bearing ratio (CBR) test and repeated triaxial test, were per-
formed on soil samples collected from test pit excavated at
each test section.
2.3.1. Subgrade soil propertiesTests pits data were used to assess the variations in soil
characterization, which associated properties were collected
to perform laboratory investigations. Laboratory in-
vestigations were performed as the Indian standard specifi-
cations to determine conventional index and volumetric
properties such as liquid limit, plastic limit, average dry
density, and average moisture content as shown in Table 3.
CBR test was also performed for soil samples collected at all
the test sections to determine subgrade moduli hereafter
designated as Mr_CBR in order to validate in-situ estimated
moduli. Table 3 presents the type of soil and a wide range of
its associated properties for 120 test samples measured by
the laboratory investigations. For each test, three samples
were prepared, and an average of three test results was
considered as shown in Table 3.
2.3.2. Repeated triaxial testsLaboratory moduli of subgrade (Mr_Lab) was experimentally
determined in the laboratory by applying repeated axial load
on three soil samples collected from each test pit at each test
section in a triaxial cell. Resilient modulus test in this study
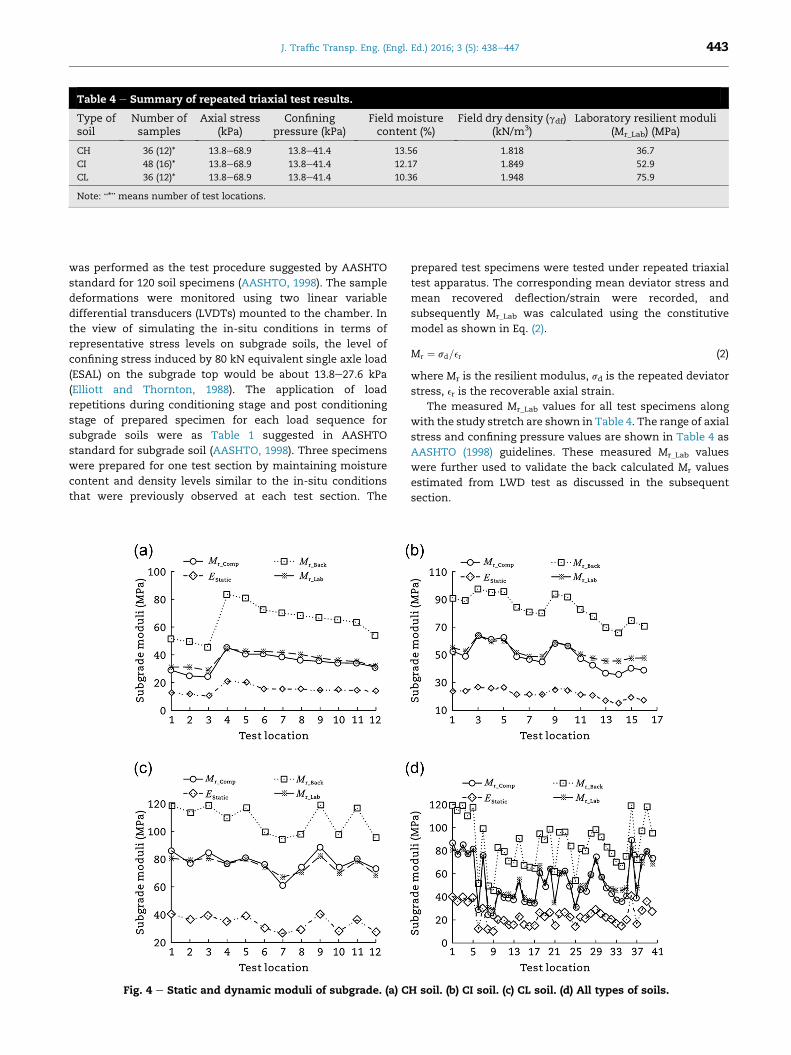
Table 4 e Summary of repeated triaxial test results.
Type ofsoil
Number ofsamples
Axial stress(kPa)
Confiningpressure (kPa)
Field moisturecontent (%)
Field dry density (gdf)(kN/m3)
Laboratory resilient moduli(Mr_Lab) (MPa)
CH 36 (12)* 13.8e68.9 13.8e41.4 13.56 1.818 36.7
CI 48 (16)* 13.8e68.9 13.8e41.4 12.17 1.849 52.9
CL 36 (12)* 13.8e68.9 13.8e41.4 10.36 1.948 75.9
Note: “*” means number of test locations.
J. Traffic Transp. Eng. (Engl. Ed.) 2016; 3 (5): 438e447 443
was performed as the test procedure suggested by AASHTO
standard for 120 soil specimens (AASHTO, 1998). The sample
deformations were monitored using two linear variable
differential transducers (LVDTs) mounted to the chamber. In
the view of simulating the in-situ conditions in terms of
representative stress levels on subgrade soils, the level of
confining stress induced by 80 kN equivalent single axle load
(ESAL) on the subgrade top would be about 13.8e27.6 kPa
(Elliott and Thornton, 1988). The application of load
repetitions during conditioning stage and post conditioning
stage of prepared specimen for each load sequence for
subgrade soils were as Table 1 suggested in AASHTO
standard for subgrade soil (AASHTO, 1998). Three specimens
were prepared for one test section by maintaining moisture
content and density levels similar to the in-situ conditions
that were previously observed at each test section. The
Fig. 4 e Static and dynamic moduli of subgrade. (a) C
prepared test specimens were tested under repeated triaxial
test apparatus. The corresponding mean deviator stress and
mean recovered deflection/strain were recorded, and
subsequently Mr_Lab was calculated using the constitutive
model as shown in Eq. (2).
Mr ¼ sd=er (2)
where Mr is the resilient modulus, sd is the repeated deviator
stress, er is the recoverable axial strain.
The measured Mr_Lab values for all test specimens along
with the study stretch are shown in Table 4. The range of axial
stress and confining pressure values are shown in Table 4 as
AASHTO (1998) guidelines. These measured Mr_Lab values
were further used to validate the back calculated Mr values
estimated from LWD test as discussed in the subsequent
section.
H soil. (b) CI soil. (c) CL soil. (d) All types of soils.
Table 5 e Summary of static and dynamic subgrade moduli analysis.
Subgrade moduli Type of soil CH CI CL
Mr_Comp (MPa) Number of test locations 12 16 12
Mean 34 49 78
Standard deviation 6.2395 9.2229 7.3526
Mr_Back (MPa) Number of test locations 12 16 12
Mean 63 84 108
Standard deviation 11.6888 10.1026 10.5775
EStatic (MPa) Number of test locations 12 16 12
Mean 15 22 34
Standard deviation 3.1111 3.5838 5.4073
Mr_Lab (MPa) Number of soil samples 36 48 36
Mean 37 53 76
Standard deviation 5.1227 5.8019 5.3336
J. Traffic Transp. Eng. (Engl. Ed.) 2016; 3 (5): 438e447444
3. Analysis of static and dynamic moduli ofsubgrade
3.1. BBD test results
In this study, based on the estimated temperature and mois-
ture content along with the study stretch, appropriate cor-
rections were applied to the deflections as per Canadian goods
road association CGRA procedure (Wilkins, 1962; IRC, 1997).
The static deflection values measured on 40 test sections of a
study stretch were analyzed to determine true rebound
deflection values as the CGRA procedure (Wilkins, 1962; IRC,
1997).
3.1.1. Estimation of Static moduli of subgradeThe seasonally corrected rebound deflection values were
further processed to determine static subgrade moduli (EStatic)
as the constitutive equation suggested in AASHTO (AASHTO,
1993; Fleming, 2000; Zhou et al., 2010) as shown in Eq. (3).
EStatic ¼ 0:24P0=drR (3)
where EStatic is the static moduli of subgrade value, P0 is the
applied load, dr is the surface deflection measured at a dis-
tance r from the centre of the loading plate, R is the distance
from the center of load.
The EStatic calculated from Eq. (3) for each test section of
entire stretch was further used to compare with the
estimated dynamic moduli of subgrade using LWD, and
repeated triaxial apparatus as discussed in the subsequent
section. The estimated EStatic values were categorized
according to the soil type. The results are presented in
Fig. 4(a)e(c).
3.2. LWD test results
3.2.1. Estimation of composite moduli of surface andsubgrade layerThe dynamic deflections obtained from LWD test both on top
of bituminous and subgrade layer at were processed to esti-
mate composite moduli of surface and subgrade layer by
considering Boussinesq's static linear-elastic half space the-
ory by using the constitutive equation as shown in Eq. (4)
(Fleming, 2000; Fleming et al., 2007; Livneh and Goldberg,
2001).
E0 ¼ f 0�1� v2
�s00a�d0 (4)
where E0 is the composite moduli of surface/subgrade layer, f0
is the plate rigidity factor (2 is a standard value for a flexible
plate), n is Poisson's ratio, normally 0.35, s00 is the maximum
contact stress, a is the plate radius, d0 is the maximum
deflection.
These estimated composite moduli of surface layer for 40
test samples was further processed to estimate back-
calculated moduli of subgrade (Mr_Back) using appropriate
backcalculation technique. Further, composite moduli of
subgrade (Mr_Comp) were estimated to validate the Mr_Back
considering the potential influencing parameters as discussed
in Section 2.2.2 that governed the deflection and moduli
values while performing LWD test. In this study, all LWD
equipment related factors were taken into consideration as
discussed earlier and the effect of variation in moisture
content upon LWD measurements were considered under
controlled laboratory conditions while performing repeated
triaxial test for the tests samples. The Mr_Comp values were
validated and compared with Mr_Lab values according to the
soil type as shown in Fig. 4(a)e(c).
3.2.2. Backcalculated moduli of subgradeThe deflections measured at each test section was used in
Dynatest's LWDmod programwhich forward calculated based
on the Odemark's layer transformation approach along with
constitutive Boussinesq's equations. Backcalculation proced-
ures adopted in this study include comparison of calculated
deflections considering the non-linearity stress dependent
with measured deflections by considering three layer system.
These calculated and measured deflections along with seed
moduli values were adjusted with an iterative procedure to
obtain layer moduli. Thus, based on the iterative process,
pavement layer moduli was estimated by using LWDmod
program based on the deflection bowl approach which
required layer thickness values as input (Sharma and Das,
2008). The estimated Mr_Back for all the 40 test sections were
further calibrated and validated with Mr_Lab values according
to the soil type as shown in Fig. 4(a)e(c). According to the
soil type, the estimated Mr_Lab, Mr_Back, Mr_Comp and EStaticvalues were compared. The results are presented in

Table 6 e Summary of correlation analysis.
Type of soil Independent variable Mr_Comp Mr_Back Mr_Lab
Dependent variable EStatic EStatic EStatic
Parameter Mr_Comp EStatic Mr_Back EStatic Mr_Lab EStatic
CH Coefficients 1.8446 3.5734 1.4509
Intercept 5.6772 7.7335 14.1925
R2 0.8459 0.8045 0.7764
CI Coefficients 2.4514 2.7700 1.4690
Intercept �5.3822 21.9950 20.0879
R2 0.9074 0.7655 0.8233
CL Coefficients 1.2056 1.9191 0.9620
Intercept 36.1088 41.9316 42.7572
R2 0.7861 0.7639 0.7512
J. Traffic Transp. Eng. (Engl. Ed.) 2016; 3 (5): 438e447 445
Fig. 4(a)e(d). Table 5 presents the summary of estimated static
and dynamic moduli of subgrade values.
3.3. Comparative analysis of static and dynamic moduliof subgrade
Comparative analysis was carried out in two distinct ways: (1)
development of correlations, and (2) analysis of static and
dynamic subgrade moduli values.
3.3.1. Development of correlationsThe detailed comparative analyses were carried out for the
estimated static and dynamic moduli of subgrade by devel-
oping correlations. According to the soil type, correlations
were developed between EStatic and Mr_Lab, Mr_Back, Mr_Comp
values. The summary of the correlation analysis for each soil
type is shown in Table 6.
3.3.2. Validation of CorrelationsThe developed correlations were validatedwith the calculated
Mr value as equation suggested in Indian standard specifica-
tion as shown in Eq. (5) (IRC, 2012). The subgrade moduli
estimated from the equation was designated as Mr_CBR. The
CBR value used in this equation was obtained from the
laboratory investigations as shown in Table 2.
Mr ¼�
10� CBR CBR ¼ 517:6� ðCBRÞ0:64 CBR> 5 (5)
where Mr is the resilient modulus of subgrade soil, CBR is
California bearing ratio.
The average Mr_CBR value for CH, CI and CL soils is 25, 30
and 54 MPa. Based on the calculated Mr_CBR values, the esti-
mated static and dynamic moduli of subgrade was validated
by estimating the correlation index as shown in Table 7.
Table 7 e Summary of validation analysis.
Type of soil Independent variable Mr
Dependent variable M
Parameter Mr_Com
CH R2 0.
CI R2 0.
CL R2 0.
3.3.3. Analysis of Subgrade moduli valuesSubgrade moduli estimated from static and dynamic devices
were compared, and the ratio was determined according to
soil type. Based on the tests results and analyses carried out in
estimating of static and various dynamic moduli of subgrade,
the ratios of static and dynamic moduli of subgrade obtained
in this study is shown in Table 8.
4. Discussion
The test results and analyses of subgrade moduli from static
and dynamic devices illustrates that the static moduli of
subgrade estimated from BBD test is on a lower side as
compared with the dynamic moduli of subgrade estimated
from LWD and repeated triaxial tests for all the soil types.
Further, the composite moduli of subgrade values estimated
from LWD test are approximately consistent with laboratory
estimatedmoduli of subgrade using repeated triaxial test with
an average percentage variation of 7% for CH and CI type soils
whereas 2% for CL type soil respectively.
The backcalculated moduli of subgrade values estimated
by LWD test is on the higher side as compared with the other
subgrade moduli values. However, the convergence of back-
calculated subgrade moduli values is closely dependent upon
the type of backcalculation technique being adopted. Pave-
ment backcalculation process is mathematically an indeed
complex inverse problem that can be approached determin-
istically or probabilistically. Current backcalculation tech-
niques adopts several optimization techniques like artificial
neural networks (ANN), generic algorithm, etc. (Sharma and
Das, 2008). LWDmod program adopts static backcalculating
algorithms in which the data converges to the local minima.
_Comp Mr_Back EStatic
r_CBR Mr_CBR Mr_CBR
p: Mr_CBR Mr_Back: Mr_CBR EStatic: Mr_CBR
8452 0.8370 0.6691
9279 0.8855 0.7195
9306 0.7430 0.7399

Table 8 e Analysis of static and dynamic moduli ofsubgrade.
Parameter Type of soil
CH CI CL
EStatic: Mr_Comp 0.45 0.45 0.44
EStatic: Mr_Back 0.25 0.27 0.32
EStatic: Mr_Lab 0.42 0.42 0.45
J. Traffic Transp. Eng. (Engl. Ed.) 2016; 3 (5): 438e447446
The correlation analysis between static and dynamic
moduli of subgrade values demonstrates good correlations for
each soil type. However, the validation results of estimated
static and dynamic subgrade moduli with Mr_CBR depicts poor
correlation between EStatic and Mr_CBR. Therefore, this states
that the EStatic values are conservative to determine the real-
istic subgrade structural integrity.
The interpretations of estimated static and dynamic
moduli of subgrade are carried out by estimating ratio of static
and dynamic moduli of subgrade in this study as shown in
Table 8. The calculated values were on higher side as
compared with the findings in AASHTO (1993) and the ratios
calculated in other studies using BBD and FWD varies from
0.2 e 0.33 and 0.18 e 0.27 (Ali and Khosla, 1987; Von Quintus
and Killingsworth, 1998; Zhou et al., 2010). However, in this
study the ratio between EStatic and Mr_Back is less than the
previous studies. The ratios between EStatic with Mr_comp and
Mr_Lab are on the higher sides respectively. The less ratio
values are due to over estimated Mr_Back values which can be
improved by adopting more realisting backcalculation
techniques.
5. Conclusions
A comprehensive comparative study is carried out between
Benkelman beam deflectometer and lightweight deflec-
tometer in estimating the subgrade moduli for pavement
structural evaluation of low volume roads in India. Experi-
mental investigations are performed to estimate static moduli
of subgrade using Benkelman beam deflectometer, back-
calculated and composite moduli of subgrade using light-
weight deflectometer. In-situ results are validated with
repeated triaxial results. The test results and analysis illus-
trates the following conclusions.
� Although correlation analysis between static and dynamic
moduli of subgrade exhibits good correlation. Though,
validation analysis with calculated CBR based moduli of
subgrade shows the inability of adopting static moduli of
subgrade as design strength parameter. Whereas the other
measured and backcalculated dynamicmoduli of subgrade
values can show better results.
� The LWD backcalculated and composite dynamic moduli
of subgrade values are validated effectively with laboratory
measured dynamicmoduli of subgrade values. This depicts
the feasibility of LWD device.
� This study helps engineers and researchers to initiate and
extend mechanistic-empirical techniques using dynamic
non-destructive testing devices for the design and preser-
vation of low volume road.
� Therefore, based on this study, it is concluded that LWD
can be used as subgrade strength evaluating tool for the
phases construction and maintenance of the pavement.
r e f e r e n c e s
Ali, N.A., Khosla, N.P., 1987. Determination of layer moduli usinga falling weight deflectometer. Transportation ResearchRecord 1117, 1e10.
American Association of State Highway and TransportationOfficials (AASHTO), 1993. Guide for Design of PavementStructures. AASHTO, Washington DC.
American Association of State Highway and TransportationOfficials (AASHTO), 1998. Standard Specifications forTransportation Materials and Methods of Sampling andTesting, Part-II (Tests), ninth ed. AASHTO, Washington DC.
American Society for Testing and Materials (ASTM), 2007.Standard Test Method for Measuring Deflections with a LightWeight Deflectometer. ASTM E2583-07. ASTM, WestConshohocken.
Barodiya, P., Pateriya, I.K., 2014. Estimating maintenance cost ofrural roads in PMGSY. Journal of Indian Highways 8, 13e27.
Bertuliene, L., Laurinavicius, A., 2008. Research and evaluationmethods for determining modulus of road subgrade andfrost blanket course. Baltic Journal of Road and BridgeEngineering 3 (2), 71e76.
Benedetto, A., Tosti, F., Di Domenico, L., 2012. Elliptic model forprediction of deflections induced by a light falling weightdeflectometer. Journal of Terramechanics 49 (1), 1e12.
Blight, G.E., 1974. Permanent deformation in asphaltic materials.Journal of Transportation Engineering 100 (1), 263e276.
Davies, T., 1997. Assessing the suitability of the Loadman singlepoint falling weight deflectometer to tracking the change instrength in thin asphalt surfaced roads through spring thawin Saskatchewan. In: University of New BrunswickInternational Symposium on Thin Pavements, SurfaceTreatments, and Unbound Roads, New Brunswick, 1997.
Elliott, R.P., Thornton, S.I., 1988. Simplification of subgraderesilient modulus testing. Transportation Research Record1192, 1e7.
Fleming, P.R., 2000. Small-scale dynamic devices for themeasurement of elastic stiffness modulus on pavementfoundation. In: Symposium Nondestructive Testing ofPavements and Backcalculation of Moduli, Seattle, 2000.
Fleming, P.R., 2001. Field measurement of stiffness modulus forpavement foundations. In: 79th Annual Meeting of theTransportation Record Board, Washington DC, 2001.
Fleming, P.R., Frost, M.W., Lambert, J.P., 2007. Review oflightweight deflectometer for routine in-situ assessment ofpavement material stiffness. Transportation ResearchRecord 2004, 80e87.
Grasmick, J.G., Mooney, M.A., Surdahl, R.W., 2014. Capturing alayer response during curing of stabilized earthwork using amulti sensor light weight deflectometer. Journal of Materialsin Civil Engineering 27 (6), 34e45.
Indian Road Congress (IRC), 1997. Guidelines for Strengthening ofFlexible Road Pavements Using Benkelman Beam DeflectionTechnique, first ed. IRC 81. Indian Road Congress, New Delhi.
IRC, 2012. Guidelines for the Design of Flexible Pavements, thirded. IRC 37. Indian Road Congress, New Delhi.
IRC, 2014. Guidelines for Structural Evaluation andStrengthening of Flexible Road Pavements Using Falling
J. Traffic Transp. Eng. (Engl. Ed.) 2016; 3 (5): 438e447 447
Weight Deflectometer (FWD) Technique. IRC 115. Indian RoadCongress, New Delhi.
Kavussi, A., Rafiei, K., Yasrobi, S., 2010. Evaluation of PFWD aspotential quality control tool of pavement layers. Journal ofCivil Engineering and Management 16 (1), 123e129.
Livneh, M., Goldberg, Y., 2001. Quality assessment during roadformation and foundation construction: use of falling-weightdeflectometer and light drop weight. TransportationResearch Record 1755, 69e77.
Livneh, M., Livneh, N.A., Elhadad, E., 1997. Determining apavement modulus from portable FWD testing. GeotechnicalTesting Journal 20 (4), 373e383.
Meier, R.W., Rix, G.J., 1995. Backcalculation of flexible pavementmoduli from dynamic deflection basins using artificialneural networks. Transportation Research Record 1473,72e81.
Murillo Feo, C.A., Urrego, L.E.B., 2013. Correlation betweendeflections measurements on flexible pavements obtainedunder static and dynamic load techniques. In: The 18thInternational Conference on Soil Mechanics andGeotechnical Engineering, Paris, 2013.
Nazzal, M., Abu-Farsakh, M., Alshibli, K., et al., 2007. Evaluatingthe light falling weight deflectometer device for in situmeasurement of elastic modulus of pavement layers.Transportation Research Record 2016, 13e22.
Rajagopal, A.S., Justo, C., 1989. A simple method of measuringpavement rebound deflection bowl data and calculatingmoduli. In: 1st International Symposium on NondestructiveTesting of Pavements and Backcalculation of Moduli,Baltimore, 1988.
Reddy, B.B., Veeraragavan, A., 1997. Structural performance of inservice flexible pavements. Journal of TransportationEngineering 123 (2), 156e167.
Scrivner, F.H., Michalak, C.H., 1969. Flexible PavementPerformancerelated to Deflections, Axle Applications,Temperature, and Foundation Movements. Research Report32-13. Texas Transportation Institute, Arlington.
Senseney, C.T., Krahenbuhl, R.A., Mooney, M.A., 2010. Geneticalgorithm to optimize layer parameters in light weightdeflectometer backcalculation. International Journal ofGeomechanics 13 (4), 473e476.
Senseney, C.T., Mooney, M.A., 2010. Characterization of a two-layer soil system using a lightweight deflectometer withradial sensors. Transportation Research Record 2186, 21e28.
Sharma, S., Das, A., 2008. Backcalculation of pavement layermoduli from falling weight deflectometer data using anartificial neural network. Canadian Journal of CivilEngineering 35 (1), 57e66.
Solanki, P., Zaman, M., Muraleetharan, K.K., et al., 2011.Evaluation of resilient modulus of pavement layer at aninstrumented section on I-35 in Oklahoma. Road Materialsand Pavement Design 10 (S1), 167e188.
Stamp, D., Mooney, M.A., 2013. Influence of lightweightdeflectometer characteristics on deflection measurement.Geotechnical Testing Journal 36 (2), 1e11.
Tehrani, F.,S., Meehan, C.,L., 2010. The effect of water content onlight weight deflectometer measurements. In: GeoFlorida2010: Advances in Analysis, Modeling & Design, Orlando, 2010.
Vennapusa, P.R.K., White, D.J., 2009. Comparison of lightweightdeflectometer measurements for pavement foundationmaterials. Geotechnical Testing Journal 32 (3), 239e251.
Von Quintus, H.L., Killingsworth, B.M., 1998. Comparison oflaboratory and in-situ determined elastic moduli. In: 76thAnnual Meeting of the Transportation Research Board,Washington DC, 1998.
Wilkins, E.B., 1962. Pavement evaluation studies in Canada. In: 1stInternational Conference on Structural Design of AsphaltPavements, Ann Arbor, 1962.
Zhou, L., Wu, Q., Ling, J., 2010. Comparison of FWD andBenkelman beam in evaluation of pavement structurecapacity. In: GeoShanghai ASCE International Conference,Shanghai, 2010.
Sunny Deol Guzzarlapudi is currently a PhDstudent in the Transportation Engineeringand Planning Division, Department of CivilEngineering, Sardar Vallabhbhai NationalInstitute of Technology, Surat. He is a lifemember of Indian Road Congress (IRC) andInstitute of Urban Transport (IUT) in India.His research is focused on NDT methods forpavement evaluating and pavement man-agement, pavement material characteriza-tion, backcalculation of resilient moduli,
non-linear modeling of pavement layers.
Vinod Kumar Adigopula is currently a PhDstudent in the Transportation Engineeringand Planning Division, Department of CivilEngineering, Sardar Vallabhbhai NationalInstitute of Technology, Surat. He is a stu-dent member of American society of CivilEngineers (ASCE) and life member of Insti-tution of Engineers, India. His research isfocused on quality control of pavementlayers, pavement structural evaluation usingNDT methods, mechanistic empirical design
of pavement.
Rakesh Kumar is currently an associateprofessor in the Transportation Engineeringand Planning Division, Department of CivilEngineering, Sardar Vallabhbhai NationalInstitute of Technology, Surat, India. He ob-tained his PhD from Indian Institute ofTechnology Delhi (IITD), India. He is a lifemember of Indian Road Congress (IRC) andInstitute of Urban Transport (IUT) in India.His research is focused on utilization ofinnovative pavement construction mate-
rials, like Flyash, Slags and others non-conventional materials,
pavement material characterization, highway traffic forecasting,freight demand modeling at network level, mechanic empiricaldesign of pavement, NDT methods for pavement evaluation.