comparative studies of two dimensional and three … · · 2015-04-01comparative studies of two...
TRANSCRIPT

An Acad Bras Cienc (2012) 84 (4)
Comparative Studies of Two Dimensional and Three Dimensional Ultrasonic Nuchal Translucency in Trisomy Assessments
LAI K.WEE1,2, HUM Y. CHAI 3, SHARUL R. BIN SAMSURY
2,
NAIZAITHULL F. BINTI MUJAMIL2 and EKO SUPRIYANTO 1,2
1 Biotechnology Research Alliance, Universiti Teknologi Malaysia, 81310 Skudai, Johor, Malaysia
2 Department of Clinical Science and Engineering, Faculty of Health Science and Biomedical Engineering,
Universiti Teknologi Malaysia, 81310 Skudai, Johor, Malaysia3
Materials and Manufacturing Research Alliance, Universiti Teknologi Malaysia, 81310 Skudai, Johor, Malaysia
Manuscript received on June 29, 2011; accepted for publication on March 5, 2012
ABSTRACTCurrent two-dimensional (2D) ultrasonic marker measurements are inherent with intra- and inter-observer variability limitations. The objective of this paper is to investigate the performance of conventional 2D ultrasonic marker measurements and proposed programmable interactive three-dimensional (3D) marker evaluation. This is essentially important to analyze that the measurement on 3D volumetric measurement possesses higher impact and reproducibility vis-à-vis 2D measurement. Twenty three cases of prenatal ultrasound examination were obtained from collaborating hospital after Ethical Committee`s approval. The measured 2D ultrasonic marker is Nuchal Translucency or commonly abbreviated as NT. Descriptive analysis of both 2D and 3D ultrasound measurement were calculated. Three trial measurements were taken for each method. Both data were tested with One-Sample Kolmogorov-Smirnov Test and results indicate that markers measurements were distributed normally with significant parametric values at 0.621 and 0.596 respectively. Computed mean and standard deviation for both measurement methods are 1.4495 ± 0.46490 (2D) and 1.3561 ± 0.50994 (3D). ANOVA test shows that computerized 3D measurements were found to be insignificantly different from the mean of conventional 2D at the significance level of 0.05. With Pearson’s correlation coefficient value or R = 0.861, the result proves strong positive linear correlation between 2D and 3D ultrasonic measurements. Reproducibility and accuracy of 3D ultrasound in NT measurement was significantly increased compared with 2D B-mode ultrasound prenatal assessment. 3D reconstructed imaging has higher clinical values compare to 2D ultrasound images with less diagnostics information.
Key words: three dimensional (3D), ultrasound, nuchal translucency (NT), fold thickness, Trisomy, Down Syndrome.
Correspondence to: Lai Khin WeeEmail: [email protected]
INTRODUCTION
Medical literature has proven that a fetus with congenital disease such as Down syndrome, heart disease and bone disease will have thicker
transparent layer of subcutaneous fetal neck or called Nuchal Translucency. The term Nuchal Translucency was termed by Nicolaides KH, pioneer in prenatal Trisomy 21 early assessment at Fetal Medicine Foundation (FMF), UK (Nicolaides et al. 1992). The formation of this transparent layer
Anais da Academia Brasileira de Ciências (2012) 84(4): 1157-1168(Annals of the Brazilian Academy of Sciences)Printed version ISSN 0001-3765 / Online version ISSN 1678-2690www.scielo.br/aabc

An Acad Bras Cienc (2012) 84 (4)
1158 LAI K.WEE et al.
of skin was due to blockage of blood or lymphatic circulation, resulting accumulation of liquid behind fetus’s neck (Souka et al. 2001, Hyett et al. 1995, Kagan et al. 2009, Snijders et al. 1998). Single marker evaluation of NT can help doctors to evaluate the chances of fetal with Down syndrome up to 70 % (Abuhamad 2006, Zosmer et al. 1999, Todd Rosen and D´Alton 2005). Some previous publication used to assess the risk of Trisomy 21, scientific name of Down syndrome during early pregnancy using NT measurement. Combining with pregnancy-induced plasma protein A (Pregnancy Associated Plasma Protein-A) and free-Beta human chorionic gonadotropin (free beta-human Chorionic Gonadotropin), it is possible to drive the rate up to 90% (one-stop reference trimester Down syndrome screening).
Trisomy 21 disorders or Down syndrome is the most common disease of chromosomal abnormalities, where the patients’ cell have extra copy of 21st chromosomes compared to normal paired chromosomes, leading to abnormal structure and function of many organs which including mental retardation, congenital heart disease, and intestinal plugs. The birthrate of Down’s syndrome is approximately one in every 800 to 1,000 live births. Affected babies are likely to suffer from severe mental disabilities and physical disabilities, affecting in particular the heart, gastrointestinal tract, eyes and ears. Down's syndrome generally lives to adulthood, but they need to receive long-term caregivers.
The primary factor of Trisomy 21 is still unknown, but scientists have proven that the risk of Trisomy is highly associated with mother’s age, whereby chances of fetus developing Down syndrome are higher for aged mothers. There are a few methods to confirm the fetus Trisomy screening: Amniocentesis, Chorionic villus sampling (CVS) and Percutaneous Umbilical Blood Sampling (PUBS) to extract amniotic fluid or fetus blood cell for genetic testing. Both methods are invasive examination with at least 1 percent risk of fetal loss;
therefore, if the fetuses have low chances of being Trisomy 21 babies, these invasive examinations are not recommended for pregnant women. Current practices in clinical field are using ultrasonic prenatal examination, combining with maternal serum markers to assess the preliminary Trisomy 21 risk (Wee et al. 2010a, b, Nicholas et al. 1988).
Ultrasound medical imaging is widely used in clinical application due to its intuitive, convenience, safety, non-invasive, and low cost (Larose et al. 2003, Orlandi et al. 2003, Malone et al. 2004, Wee and Supriyanto 2010, Wee et al. 2010c, d, Otano et al. 2002). Recent studies show that fetal abnormalities can be detected through assessment of specific ultrasound markers such as nuchal translucency (NT), nasal bone, long bone biometry and Doppler assessment of ductus venous (Zoppi et al. 2003, Bekker et al. 2004, Recep et al. 2008, Cicero et al. 2003a, b, 2001). Among these markers, sonographic examination of the nuchal translucency (NT) between 11 and 14 weeks’ gestation has been suggested as the most powerful screening method for trisomies, triploidy, and Turner syndrome (Nicolaides et al. 1999, Szabo and Gallen 1990). Some publications indicate that an increased NT thickness greater than 2.5 mm in between 10 and 13 weeks plus six days has also been associated with an increased risk of congenital heart and genetic syndrome (Pandya et al. 1994).
Meanwhile, some researchers suggested that NT of larger than 3 mm is associated with an increased risk for aneuploidy and other fetal anomalies (Pajkrt et al. 1999, Schwarzler et al. 1999). Trans-abdominal sonographic examinations are widely used to show the mid-sagittal image of the fetal neck to measure the nuchal fold. Trans-vaginal ultrasound of NT appears to be a more accurate method (Braithwaite and Economides 1995) due to increased resolution. Conversely, when using a trans-abdominal probe, the examiner possesses a wider range of maneuverability to obtain the correct mid-sagittal view of the fetus (Cullen et al. 1989).
An Acad Bras Cienc (2012) 84 (4)
1159COMPARATIVE STUDIES OF 3D AND 2D ULTRASONIC MARKER NUCHAL TRANSLUCENCY
According to FMF, this transparent layer of subcutaneous fetal neck can be accurately measured between 11 to 14 weeks with criteria; (a) crown hip length to be within the 45-85 mm, (b) fetus must be in supine position, (c) do not bend the neck of fetal, (d) enlarge fetal image, and (e) note the amniotic membrane or umbilical cord near the impact of measurement. (e) maximum thickness in true sagittal plane is considered as NT thickness. Generally, the measurement of fetal NT layer takes at least 15 minutes (Taipale et al. 1997), if the fetus is not in the right position, the overall prenatal screening will consume longer time.
Nevertheless, special training and experiences for NT marker assessment are required in order to be qualified in manual NT ultrasound screening. Such training is provided by FMF and their competencies need to recertify after each year. Besides, conventional B-mode ultrasound NT measurements have limitations due to inter- and intra-observer variability (Pandya et al. 1995, Kanellopoulos et al. 2003). The measurement consistency cannot be guaranteed and is always subject to human errors, technical difficulties, patient loads, and longer time consumptions. The most obstacles for current 2D assessment are choosing the correct 2D sagittal plane which consists of maximum NT thickness (Supriyanto et al. 2010). Sonographer will choose three best sagittal planes based on their experience, and compute the average of three NT measurements as the final marker thickness.
Efforts have been made by numerous investigators worldwide to find an approach for boundary detection in ultrasonic NT images which is less reliant on human operators. As it reduces the amount of human intervention, it will also reduce inter-observer variability and be expected to reduce intra-observer variability and consequently reduce the drifting problem in measurements over time in longitudinal studies. Therefore, we have extended the current NT measurement from 2D ultrasound to 3D volumetric ultrasound in order to overcome all the limitations above.
In present research, we have implemented the generic computing for 3D volumetric ultrasound reconstruction using open-source visualization toolkits (VTK). We have investigated the 3D NT thickness based on developed cell-pick command derived from 3D Euclidean distance. In order to analyze the significance of proposed method in terms of consistency, accuracy and correlations, conventional 2D and proposed computerized 3D program results were evaluated and compared.
The paper is organized as follows. In Section II, algorithm designs of VTK for extended 3D visualization reconstructions are described. Presentations of 3D NT thickness were simulated on 3D volumetric ultrasound rendering. Section IV shows the result comparison and analysis for conventional B-mode ultrasound and proposed 3D measurement method. Finally, we summarize with discussions and conclusion.
MATERIALS AND METHODS
The developed 3D reconstructions and computerized rendering program are based on open-sources object-oriented visualization toolkit VTK. The integrated IDE environment is Microsoft Visual Studio 8.0 in Windows 7 using C++ language programming, where the initial project file can be built using CMake 2.80 while configuring external libraries including OpenCV 2.2, VTK 5.4, FLTK 1.1, OpenIGTLink 1.0 and ITK 3.2. VTK is a free computer graphics library specialized for 3D image processing and visualization. It has excellent structure and operating mechanism, hence it is widely used in the international visualization research field. We have described the detail algorithm design for 3D reconstruction in previous publication work (Wee et al. 2011, 2012). In this paper, we will focus on Observer command design, and real patient data collection for 3D NT simulation.
VTK rendering scene can be divided into two models, operator 3D widget model and renderer data model. In order to update the

An Acad Bras Cienc (2012) 84 (4)
1160 LAI K.WEE et al.
control information of operator 3D widget model on renderer data model, Callback command is required to activate the response accordingly. The AddObserver acts as an external module to observe and reflects the real time data model status. In current studies, computing 3D measurement of NT is accomplished using vtkPicker widget. Observer will convert the vtkPicker data into geometrical and physical parameters in the rendering scene. Once vtkPicker updates its parameters, Observer will update the data simultaneously through the interface connection established.
Fig. 1 shows the algorithm connection for 3D NT thickness measurements through user mouse’s interaction. The proposed system will send mouse and keyboard input messages to vtkPicker through command updating. For the three dimensional Euclidean distance computation, two world coordinates are required. The point picker in computer screen contains only two dimensional coordinates, which has no direct relation with the three dimensional objects, and therefore, conversion
into world coordinates is necessary. The distinct difference between two dimensional coordinates and world coordinates is the latter contains depth information, which reflects the depth of Z-coordinate spaces. In current studies, the selected two dimensional coordinates will be introduced as a straight line extended into Z spacing, which might penetrate the three dimensional rendering objects followed by acquiring the coordinate intersection with the surface of rendering objects. Straight line may intersect with more than one plane; therefore, several interactions are possible. The algorithms then compare the distance of all the intersecting points with the initial point coordinates. The coordinates with the shortest distance calculated will be selected as the three dimensional world coordinates.
Fig. 2 shows part of the data collection for the same patient with anonymous privacy data, which demonstrated the inconsistency of 2D manual thickness measurement. For instance, these three trials measurement have maximum deviation up to 0.21mm in this example.
Fig. 1 - Algorithm connection between vtkPicker and renderer data channel for 3D Euclidean computation.

An Acad Bras Cienc (2012) 84 (4)
1161COMPARATIVE STUDIES OF 3D AND 2D ULTRASONIC MARKER NUCHAL TRANSLUCENCY
The deviation measurement can be larger, as the operator changes the position of sagittal view during prenatal screening. Selecting the correct sagittal plane is crucial, which is very subjective and relies on personal experiences and technical skills. Fig. 3 shows the simulation of 3D NT measurement using VTK reconstructions.
RESULTS AND ANALYSIS
Total numbers of 23 patient data were collected from collaborated hospital after Ethical Committee approval from November 2010 until February 2011. The measured ultrasonic marker is nuchal translucency, or simply NT, using conventional 2D B-mode prenatal ultrasound scan protocol. The type of transducer implemented in current examination is abdominal probe, with beam form 3.5MHz frequency. The target
group of examined patients was pregnant women in first trimester, or early second trimester singleton pregnancies. Populations included are only Malaysian, and three trials 2D ultrasonic NT measurements for each patient were taken. The three trials 3D measure-ments were carried out using our developed 3D reconstruction and measurement program.
For numerical statistics analyses, Table I and Table II show the difference of their standard deviations. All the statistics analyses were calculated using SPSS 19 software (IBM SPSS Statistics). The range of the deviation from mean in Table I (2D) are much larger compared to Table II (3D), varies from minimum values 0.04041 (P22) to maximum values 0.28449 (P21) in 2D, and minimum values 1.36E-16 (P11) to maximum values 0.110151 (P10) in 3D respectively.
Fig. 2 - Three trials manual B-mode Ultrasound sonogram measurement results large variability, (a) NT thickness = 1.64mm, (b) NT thickness = 1.43mm, (c) = NT thickness = 1.50mm.

An Acad Bras Cienc (2012) 84 (4)
1162 LAI K.WEE et al.
Fig. 3 - Three dimensional nuchal translucency simulation (a) 3D volumetric rendering (b) Slicing view to show for NT segmentation (c) Thickness measurement using 3D Euclidean approach.
TABLE ISummary of 2D data collection for B-mode ultrasonic NT marker measurement.
Patient Trial 1 Trial 2 Trial 3 Trial Mean, χ Standard Deviation, S Variance, σ2 Maximum Range
P1 1.64 1.43 1.50 1.52333 0.10693 0.01143 0.21
P2 1.46 1.66 - 1.56 0.14142 0.02 0.2
P3 1.45 1.60 1.82 1.62333 0.1861 0.03463 0.37
P4 1.16 1.10 1.06 1.10667 0.05033 0.00253 0.1
P5 1.50 1.70 - 1.6 0.14142 0.02 0.2
P6 1.09 0.86 0.80 0.91667 0.15308 0.02343 0.29
P7 1.90 1.83 1.96 1.89667 0.06506 0.00423 0.13
P8 1.33 1.40 - 1.365 0.0495 0.00245 0.07
P9 1.60 1.43 - 1.515 0.12021 0.01445 0.17
P10 1.73 1.88 1.51 1.70667 0.1861 0.03463 0.37
P11 1.04 1.25 1.32 1.20333 0.14572 0.02123 0.28
P12 1.55 1.76 1.69 1.66667 0.10693 0.01143 0.21
P13 0.85 1.09 1.26 1.06667 0.20599 0.04243 0.41
P14 0.99 1.09 - 1.04 0.07071 0.005 0.1
P15 1.20 0.94 1.02 1.05333 0.13317 0.01773 0.26
P16 1.10 1.04 1.26 1.13333 0.11372 0.01293 0.22
P17 1.09 1.27 - 1.18 0.12728 0.0162 0.18
An Acad Bras Cienc (2012) 84 (4)
1163COMPARATIVE STUDIES OF 3D AND 2D ULTRASONIC MARKER NUCHAL TRANSLUCENCY
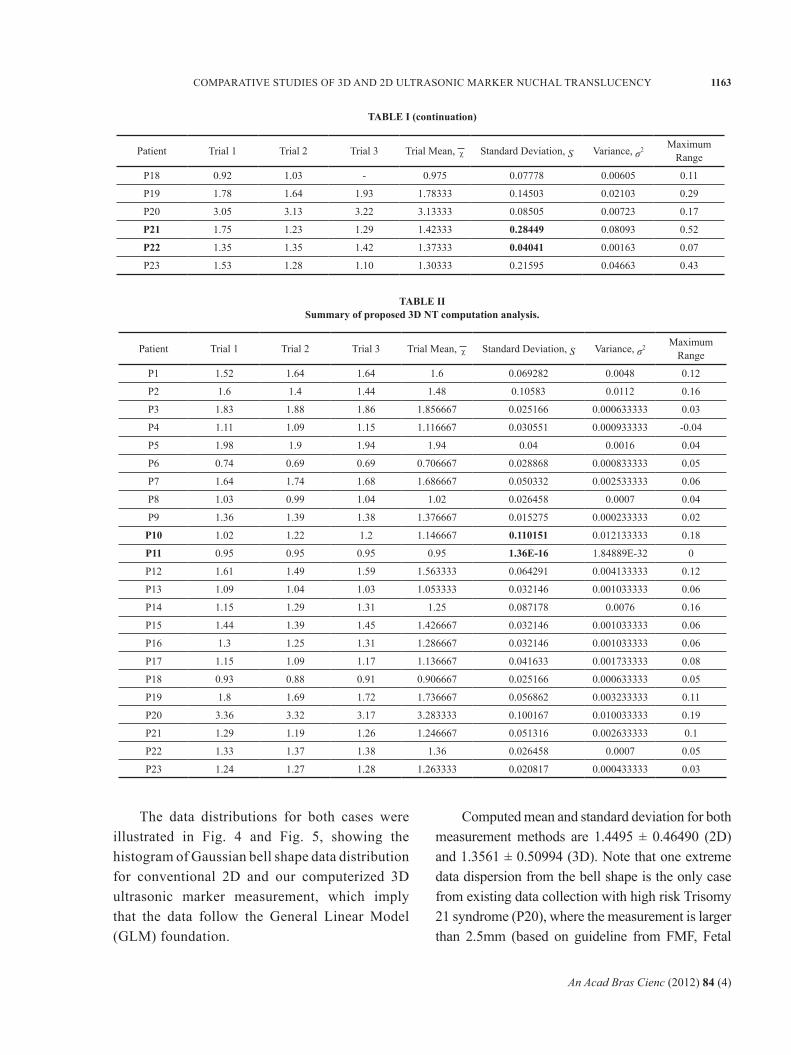
The data distributions for both cases were illustrated in Fig. 4 and Fig. 5, showing the histogram of Gaussian bell shape data distribution for conventional 2D and our computerized 3D ultrasonic marker measurement, which imply that the data follow the General Linear Model (GLM) foundation.
Computed mean and standard deviation for both measurement methods are 1.4495 ± 0.46490 (2D) and 1.3561 ± 0.50994 (3D). Note that one extreme data dispersion from the bell shape is the only case from existing data collection with high risk Trisomy 21 syndrome (P20), where the measurement is larger than 2.5mm (based on guideline from FMF, Fetal
TABLE IISummary of proposed 3D NT computation analysis.
TABLE I (continuation)
Patient Trial 1 Trial 2 Trial 3 Trial Mean, χ Standard Deviation, S Variance, σ2 Maximum Range
P1 1.52 1.64 1.64 1.6 0.069282 0.0048 0.12
P2 1.6 1.4 1.44 1.48 0.10583 0.0112 0.16
P3 1.83 1.88 1.86 1.856667 0.025166 0.000633333 0.03
P4 1.11 1.09 1.15 1.116667 0.030551 0.000933333 -0.04
P5 1.98 1.9 1.94 1.94 0.04 0.0016 0.04
P6 0.74 0.69 0.69 0.706667 0.028868 0.000833333 0.05
P7 1.64 1.74 1.68 1.686667 0.050332 0.002533333 0.06
P8 1.03 0.99 1.04 1.02 0.026458 0.0007 0.04
P9 1.36 1.39 1.38 1.376667 0.015275 0.000233333 0.02
P10 1.02 1.22 1.2 1.146667 0.110151 0.012133333 0.18
P11 0.95 0.95 0.95 0.95 1.36E-16 1.84889E-32 0
P12 1.61 1.49 1.59 1.563333 0.064291 0.004133333 0.12
P13 1.09 1.04 1.03 1.053333 0.032146 0.001033333 0.06
P14 1.15 1.29 1.31 1.25 0.087178 0.0076 0.16
P15 1.44 1.39 1.45 1.426667 0.032146 0.001033333 0.06
P16 1.3 1.25 1.31 1.286667 0.032146 0.001033333 0.06
P17 1.15 1.09 1.17 1.136667 0.041633 0.001733333 0.08
P18 0.93 0.88 0.91 0.906667 0.025166 0.000633333 0.05
P19 1.8 1.69 1.72 1.736667 0.056862 0.003233333 0.11
P20 3.36 3.32 3.17 3.283333 0.100167 0.010033333 0.19
P21 1.29 1.19 1.26 1.246667 0.051316 0.002633333 0.1
P22 1.33 1.37 1.38 1.36 0.026458 0.0007 0.05
P23 1.24 1.27 1.28 1.263333 0.020817 0.000433333 0.03
Patient Trial 1 Trial 2 Trial 3 Trial Mean, χ Standard Deviation, S Variance, σ2 Maximum Range
P18 0.92 1.03 - 0.975 0.07778 0.00605 0.11
P19 1.78 1.64 1.93 1.78333 0.14503 0.02103 0.29
P20 3.05 3.13 3.22 3.13333 0.08505 0.00723 0.17
P21 1.75 1.23 1.29 1.42333 0.28449 0.08093 0.52
P22 1.35 1.35 1.42 1.37333 0.04041 0.00163 0.07
P23 1.53 1.28 1.10 1.30333 0.21595 0.04663 0.43

An Acad Bras Cienc (2012) 84 (4)
1164 LAI K.WEE et al.
Medicine Foundation, UK). To confirm the normal distribution of the analyses data with parametric symmetry, Kolmogorov-Smirnov Test can be used from SPSS, as shown in Table III. 2D and 3D nuchal translucency ultrasonic markers measurements were distributed normally with significant parametric values at 0.621 and 0.596 respectively.
For analysis comparison, we have computed the correlation matrix to reveal the consistency of measurement for all three trials in both cases. Fig. 6 and Fig. 7 illustrate the scattered plot points which are more widely dispersed in 2D measurement
compared to the results of 3D program. Table IV shows the summary of descriptive statistics analysis of overall measurement.
Referring to Table IV, both 2D and 3D measurements show a positive value of skewness, with values 2.168 and 2.538 respectively. This indicates that both distributions have an asymmetric tail extending out to the right, which is referred to as “positively skewed” or “skewed to the right”. Great skewness may also imply the existence of outliers in data.
Besides, both 2D and 3D measurements show positive kurtosis, which indicates a “peaked” distribution or known as leptokurtic distribution. 3D measurement has a higher kurtosis compared to 2D. This implies that the distribution tends to have a distinct peak near the mean, decline rather rapidly with heavy tails.
Fig. 4 - Histogram of two dimensional ultrasound nuchal translucency thicknesses distributions.
Fig. 5 - Histogram of three dimensional ultrasound nuchal translucency thickness distributions. Fig. 6 - Matric scatter plot for three trials 2D
ultrasonic NT measurement (Sample Size N = 23).
Fig. 7 - Matric scatter plot for three trials proposed 3D ultrasonic NT measurement (Sample Size N = 23).
An Acad Bras Cienc (2012) 84 (4)
1165COMPARATIVE STUDIES OF 3D AND 2D ULTRASONIC MARKER NUCHAL TRANSLUCENCY
Based on figures above, we observe that consistencies of 2D ultrasonic measurement using manual sonogram are obviously prone to inter- and intra-observer variability such as subjective human errors, experiences, long measurement time, patient loads and others.
ANOVA is the variance analysis used to test if all means were significantly equal. In our cases, we applied the average values of all three trials 2D measurements as the reference point for each patient assessment. Based on Table V, the measurements were tested in pairs and it showed that two out of three trials 2D measurement (NT_2D_1 = 0.018 and NT_2D_3 = 0.039) were significantly different from the references point with P > 0.05. Meanwhile the latter three trials 3D measurements were found to
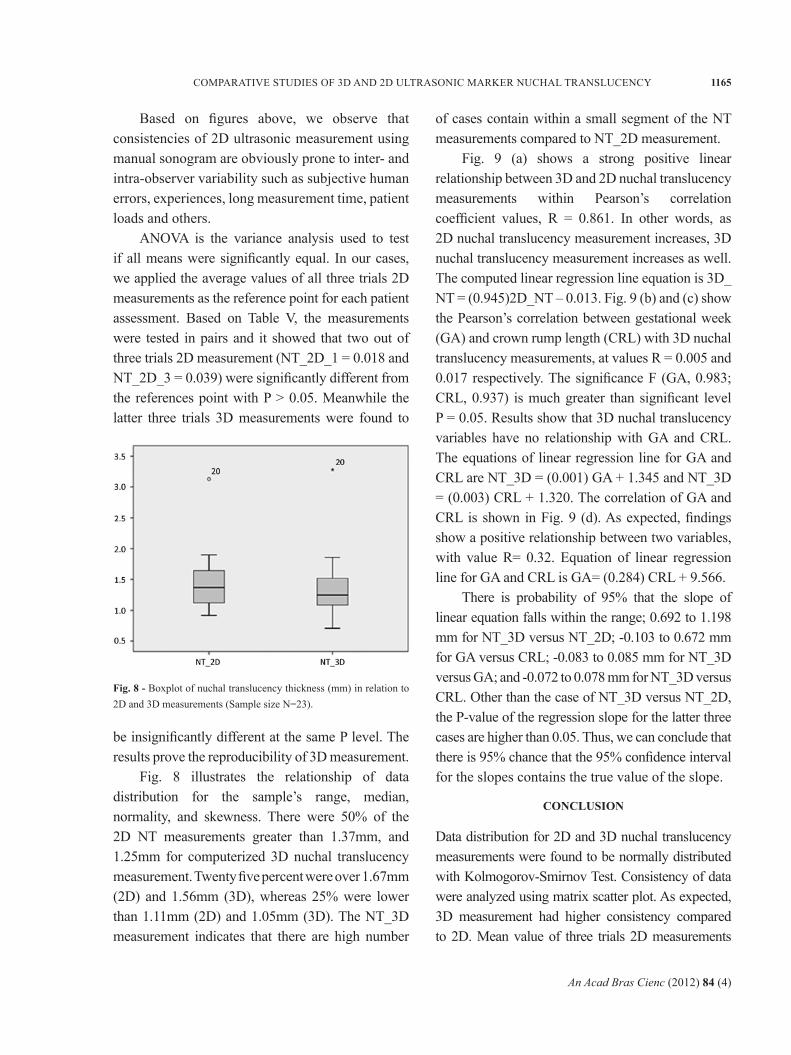
Fig. 8 - Boxplot of nuchal translucency thickness (mm) in relation to 2D and 3D measurements (Sample size N=23).
be insignificantly different at the same P level. The results prove the reproducibility of 3D measurement.
Fig. 8 illustrates the relationship of data distribution for the sample’s range, median, normality, and skewness. There were 50% of the 2D NT measurements greater than 1.37mm, and 1.25mm for computerized 3D nuchal translucency measurement. Twenty five percent were over 1.67mm (2D) and 1.56mm (3D), whereas 25% were lower than 1.11mm (2D) and 1.05mm (3D). The NT_3D measurement indicates that there are high number
of cases contain within a small segment of the NT measurements compared to NT_2D measurement.
Fig. 9 (a) shows a strong positive linear relationship between 3D and 2D nuchal translucency measurements within Pearson’s correlation coefficient values, R = 0.861. In other words, as 2D nuchal translucency measurement increases, 3D nuchal translucency measurement increases as well. The computed linear regression line equation is 3D_NT = (0.945)2D_NT – 0.013. Fig. 9 (b) and (c) show the Pearson’s correlation between gestational week (GA) and crown rump length (CRL) with 3D nuchal translucency measurements, at values R = 0.005 and 0.017 respectively. The significance F (GA, 0.983; CRL, 0.937) is much greater than significant level P = 0.05. Results show that 3D nuchal translucency variables have no relationship with GA and CRL. The equations of linear regression line for GA and CRL are NT_3D = (0.001) GA + 1.345 and NT_3D = (0.003) CRL + 1.320. The correlation of GA and CRL is shown in Fig. 9 (d). As expected, findings show a positive relationship between two variables, with value R= 0.32. Equation of linear regression line for GA and CRL is GA= (0.284) CRL + 9.566.
There is probability of 95% that the slope of linear equation falls within the range; 0.692 to 1.198 mm for NT_3D versus NT_2D; -0.103 to 0.672 mm for GA versus CRL; -0.083 to 0.085 mm for NT_3D versus GA; and -0.072 to 0.078 mm for NT_3D versus CRL. Other than the case of NT_3D versus NT_2D, the P-value of the regression slope for the latter three cases are higher than 0.05. Thus, we can conclude that there is 95% chance that the 95% confidence interval for the slopes contains the true value of the slope.
CONCLUSION
Data distribution for 2D and 3D nuchal translucency measurements were found to be normally distributed with Kolmogorov-Smirnov Test. Consistency of data were analyzed using matrix scatter plot. As expected, 3D measurement had higher consistency compared to 2D. Mean value of three trials 2D measurements

An Acad Bras Cienc (2012) 84 (4)
1166 LAI K.WEE et al.
were used as reference standard. Comparison of 2D and 3D measurements with reference standard were performed using one way ANOVA for accuracy investigation. The relationship among 2D and 3D measurements, GA and CRL were modeled using Pearson product-moment correlation coefficient. Results revealed that 2D measurement is highly correlated with 3D measurement (P = 0.05). There was no significant relationship established between 3D nuchal translucency measurements and GA or CRL.
ACKNOWLEDGMENTS
The researchers are so indebted and would like to express our thankfulness to Prof. Dr. -Ing. habil. Jens Haueisen and Dr. rer. nat. Uwe Graichen for their support, comments and guidance throughout
the project. We would also like to thank Deutscher Akademischer Austausch Dienst (DAAD) for the financial support provided for student who conducts the project at TU-Ilmenau, Germany. Our appreciation also goes to Diagnostics Research Group, and Health Centre Universiti Teknologi Malaysia for data collection.
RESUMO
As atuais medições bidimensionais (2D) com marcadores ultrassônicos com inerentes intra- e interobservadores têm limitações de variabilidade. O objetivo deste trabalho é investigar o desempenho de medições convencionais 2D com marcador ultrassom e uma proposta interativa tridimensional programável de avaliação com marcador (3D). Isto é essencialmente importante para analisar que
Fig. 9 - Correlation analysis among four different variables, (a) correlation between 3D and 2D nuchal translucency measurements, (b) correlation between 3D nuchal translucency and gestation week (GA), (c) correlation between 3D nuchal translucency and crown rump length (CRL), (d) correlation between gestation week and crown rump length.

An Acad Bras Cienc (2012) 84 (4)
1167COMPARATIVE STUDIES OF 3D AND 2D ULTRASONIC MARKER NUCHAL TRANSLUCENCY
a medição em 3D volumétrica possui maior impacto e medição de reprodutibilidade vis-à-vis a 2D. Vinte e três casos de ultrassonografia pré-natal foram obtidos do hospital que colaborou com a pesquisa após a aprovação pela Comissão de Ética. A medida do marcador 2D ultrassônica é Translucência Nucal ou comumente abreviado como NT. A análise descritiva de medição de ultrassom 2D e 3D foram calculados. Três medidas foram obtidas em ensaios para cada método. Ambos os dados foram testados com uma amostra de teste de Kolmogorov-Smirnov e os resultados indicam que as medições de marcadores foram distribuídos normalmente com significativos valores paramétricos de 0,621 e 0,596, respectivamente. A média e o desvio padrão para ambos os métodos de medição são 1,4495 ± 0,46490 (2D) e 1,3561 ± 0,50994 (3D).O teste ANOVA mostrou que medições computadorizadas 3D foram insignificantemente diferentes da média 2D convencional com nível de significância de 0,05. Com coeficiente de correlação de Pearson com valor R = 0,861, o resultado comprova forte correlação linear positiva entre medidas ultrassônicas 2D e 3D . Reprodutibilidade e exatidão do ultrassom 3D na medida da TN foram significativamente aumentadas em comparação com a avaliação ultrassom 2D na modalidade B-pré-natal. Imagem reconstruída em 3D tem maiores valores clínicos em comparção com as imagens de ultrassom 2D que possuem menos informações para diagnóstico.
Palavras-chave: três dimensões (3D), ultrassonografia, medida da translucência nucal (TN), espessura da prega, Trissomia, síndrome de Down.
REFERENCES
ABUHAMAD A. 2006. Technical aspects of nuchal translucencymeasurement. Seminars in perinatology 29: 376-379.
BRAITHWAITE JM AND ECONOMIDES DL. 1995. The measu-rement of nuchal translucency with transabdominal and transvaginal sonography – success rates, repeatability and levels of agreement. Br J Radiol 68: 720-723.
BEKKER MN, TWISK JW AND VAN VGT JM. 2004. Reprodu-cibility of fetal nasal bone length measurement. J Ultrasound Med 23(12): 1613-1618.
CULLEN MT, GREEN JJ, REECE EA AND HOBBINS JC. 1989. Acomparison of transvaginal and abdominal ultrasound in visualizing the first trimester conceptus. J Ultrasound Med 8: 565-569.
CICERO S, CURCIO P, PAPAGEORGHIOU A, SONEK J ANDNICOLAIDES KH. 2001. Absence of nasal bone in fetuses with trisomy 21 at 11-14weeks of gestational observational studies. Lancet 358: 1665-1667.
CICERO S, LONGO D, REMBOUSKOS G, SACCHINI C ANDNICOLAIDES KH. 2003a. Absent nasal bone at 11-14 weeks of gestation and chromosomal defects. Ultrasound Obstet Gynecol 22: 31-35.
CICERO S, DEZEREGA V, ANDRADE E, SCHEIER M ANDNICOLAIDES KH. 2003b. Learning Curve for sonographic examination of fetal nasal bone at 11-14 weeks. Ultrasound Obstet Gynecol 22(2): 135-137.
HYETT J, MOSCOSCO G AND NICOLAIDES KH. 1995. Cardiacdefects in 1st trimester fetus with trisomy 18. Fetal Diag Ther 10(6): 381-386.
KAGAN KO, WRIGHT D AND NICOLAIDES KH. 2009. Fetal NasalBone in Screening for Trisomies 21, 18, 13 and Turner Syndrome at 11-13 Weeks of Gestation. Ultrasound Obstet Gynecol 33: 259-264.
KANELLOPOULOS V, KATSETOS C AND ECONOMIDES DL. 2003.Examination of fetal nasal bone and repeatability of measurement in early pregnancy. Ultrasound Obstet Gynecol 22: 131-134.
LAROSE C, MASSOC P, HILLION Y, BERNARD JP AND VILLE Y. 2003.Comparison of fetal nasal bone assessment by ultrasound at 11-14 weeks and by postmortem X-ray in trisomy 21: a prospective observational study. Ultrasound Obstet Gynecol 22: 27-30.
MALONE FD ET AL. 2004. FASTER Research Consortium, Firsttrimester nasal bone evaluation for aneuploidy in the general population. Obstet Gynecol 104(6): 1222-1228.
NICHOLAS JW, HOWARD SC, JAMES WD, KIRAN N, PATRICKR, TIM C, JAMES EH, GEORGE JK, GLENN EP AND JACOB AC. 1988. Maternal serum screening for Down syndrome in early pregnancy. Brit Med J 297: 883-887.
NICOLAIDES KH, AZAR G, BYRNE D, MANSUR C AND MARKSK. 1992. Fetal nuchal translucency: ultrasound screening for chromosomal defects in first trimester of pregnancy. Br Med J 304: 867-869.
NICOLAIDES KH, SEBIRE N AND SNIJDERS R. 1999. The 11-14weeks scan: the diagnosis of fetal abnormalities. Parthenon Publishing, p. 154-180.
ORLANDI F, BILARDO CM, CAMPOGRANDE M, KRANTZ D,HALLAHAN T, ROSSI C AND VIORA E. 2003. Measurement of nasal bone length at 11–14 weeks of pregnancy and its potential role in Down syndrome risk assessment. Ultrasound Obstet Gynecol 22(1): 36-39.
OTANO L, AIELLO H, IGARZABAL L, MATAYOSHI T AND GADOWEC. 2002. Association between first trimester absence of fetal nasal bone on ultrasound and Down syndrome. Prenat Diagn 22: 930-932.
PANDYA PP, ALTMAN P, BRIZOT D, PETTERSEN M ANDNICOLAIDES KH. 1995. Repeatability of measurement of fetal nuchal translucency thickness. Ultrasound Obstet Gynecol 5: 335-337.
An Acad Bras Cienc (2012) 84 (4)
1168 LAI K.WEE et al.
PANDYA PP, BRIZOT ML, KUHN P, SNIJDERS RJ AND
NICOLAIDES KH. 1994. First-trimester fetal nuchal translucency thickness and risk for trisomies. Obstet Gynecol 84: 420-423.
PAJKRT E, MOL BW, BLEKER OP AND BILARDO CM. 1999.Pregnancy outcome and nuchal translucency measu-rements in fetuses with a normal karyotype. Prenat Diagn 19: 1104-1108.
RECEP HAS, IBRAHIM KALELIOGLU, ATIL YUKSEL, LEMIIBRAHIMOGLU, HAYRI ERMIS AND ALKAN YILDIRIM. 2008. Fetal Nasal Bone Assessment in First Trimester Down Syndrome Screening. Fetal Diagn Ther 24: 61-66.
ROSEN T AND D`ALTON ME. 2005. Down syndrome screeningin first and second trimester: What do the data show? Semin perinatal 29: 367-375.
SCHWARZLER P, CARVALHO JS, SENAT MV, MASROOR T,CAMPBELL S AND VILLE Y. 1999. Screening for fetal aneuploidies and fetal cardiac abnormalities by nuchal translucency thickness measurement at 10–14 weeks of gestation as part of routine antenatal care in an unselected population. Br J Obstet Gynaecol 106: 1029-1034.
SNIJDERS RJ, NOBLE P, SEBIRE N, SOUKA A AND NICOLAIDESKH. 1998. UK multicenter project on assessment of risk of trisomy 21 by maternal age and fetal nuchal translucency thickness at 10-14 weeks of gestation. The Lancet 352: 343-346.
SOUKA AP, KRAMPL E, BAKALIS S, HEATH V AND NICOLAIDESKH. 2001. Outcome of pregnancy in chromosomally normal fetuses with increased nuchal translucency in the first trimester. Ultrasound Obstet Gynecol 18(1): 9-17.
SUPRIYANTO E, WEE LK AND MIN TY. 2010. Ultrasonic MarkerPattern Recognition and Measurement Using Artificial Neural Network. 9th WSEAS International Conference on Signal Processing, p. 35-40.
SZABO J AND GALLEN J. 1990. Nuchal fluid accumulation intrisomy 21 detected by vaginosonography in the first trimester. Lancet 336: 1133.
TAIPALE P, HIILESMAA V, SALONEN R AND YLOSTALO P. 1997.Increased nuchal translucency as a marker for fetal chromosomal defects. N Engl J Med 337: 1654-1658.
WEE LK, ADEELA A AND SUPRIYANTO E. 2010c. ComputerizedAutomatic Nasal Bone Detection based on Ultrasound Fetal Images Using Cross Correlation Techniques. WSEAS Transactions on Information Science and Applications 7(8): 1068-1077.
WEE LK, CHAI HY AND SUPRIYANTO E. 2011. Surface Renderingof Three Dimensional Ultrasound Images using VTK. J Sci Ind Res 70(6): 421-426.
WEE LK, CHAI HY AND SUPRIYANTO E. 2012. Three dimensionalnuchal translucency assessment using magnetic resonance reconstruction imaging. J Sci Ind Res 71(3): 187-194.
WEE LK, MIN TY, ADEELA A AND SUPRIYANTO E. 2010d.Nuchal Translucency Marker Detection Based on Artificial Neural Network and Measurement via Bidirectional Iteration Forward Propagation. WSEAS Transactions on Information Science and Applications 7(8): 1025-1036.
WEE LK, MIIN L AND SUPRIYANTO E. 2010a. Automated Trisomy21 Assessment Based on Maternal Serum Markers Using Trivariate Lognormal Distribution. WSEAS Trans on Systems 8(9):844-853.
WEE LK, MIIN L AND SUPRIYANTO E. 2010b. Automated RiskCalculation for Trisomy 21 Based on Maternal Serum Markers Using Trivariate Lognormal Distribution. WSEAS International Conference on Automatic Control, Modeling & Simulation, Italy, p. 327-332.
WEE LK AND SUPRIYANTO E. 2010. Automatic Detection ofFetal Nasal Bone in 2 Dimensional Ultrasound Image Using Map Matching. 12th WSEAS International Conference on Automatic Control, Modeling & Simulation, p. 305-309.
ZOPPI MA, IBBA RM, AXIANA C, FLORIS M, MANCA F ANDMONNI G. 2003. Absence of fetal nasal bone and aneuploidies at first trimester nuchal translucency screening in unselected pregnancies. Prenat Diagn 23: 496-500.
ZOSMER N, SOUTER VL, CHAN CS, HUGGON IC ANDNICOLAIDES KH. 1999. Early diagnosis of major cardiac defects in chromosomally normal fetuses with increased nuchal translucency. Br J Obstet Gynaecol 106(8): 829-833.