comparative study of nonlinear acoustic and lamb wave techniques for fatigue crack detection in...
DESCRIPTION
Comparative Study of Nonlinear Acoustic and Lamb Wave Techniques for Fatigue Crack Detection in Metallic StructuresTRANSCRIPT

doi:10.1111/j.1460-2695.2008.01253.x
Comparative study of nonlinear acoustic and Lamb wave techniquesfor fatigue crack detection in metallic structures
M. RYLES , F . H . NGAU, I . MCDONALD and W. J . STASZEWSKIDynamics Research Group, Department of Mechanical Engineering, University of Sheffield, Mappin Street, Sheffield S1 3JD, UK
Received in final form 4 June 2008
A B S T R A C T The paper deals with fatigue crack detection in metallic structures. A simple fatigueexperiment is performed to initiate and propagate a crack in an aluminium plate. Theplate is instrumented with two low-profile piezoceramic transducers and one low-profilepiezoceramic stack actuator. Nonlinear acoustics and Lamb waves are used for crackdetection. The former utilizes the high-frequency acoustical wave and low-frequencymodal excitation for damage detection. Modulations sidebands around the acousticalspectral component are used to detect the crack. The latter produces Lamb wave responsesthat are de-correlated due to the presence of the crack. Both effects are due to growingfatigue crack. Two simple signal parameters, namely the intensity of modulation andthe normalized cross-correlation coefficient are used as damage indicators. The studydemonstrates similar sensitivity of both methods to small fatigue cracks.
Keywords fatigue crack detection; Lamb waves; metallic structures; nonlinear acous-tics; piezoceramic transducers.
I N T R O D U C T I O N
Many different techniques based on ultrasonic wave prop-agation have been developed for fatigue crack detec-tion.1,2 Ultrasonic testing, used in non-destructive testingand evaluation (NDT/E), utilizes linear amplitude, phasevariations, mode conversion and energy partitioning ofreflected, transmitted or scattered high-frequency bulkwaves propagating through the thickness of monitoredspecimens. The method is well established and widelyused in practice. In fact, it is the most versatile techniqueused in industrial applications for over 60 years.
Lamb wave inspection is the most widely used dam-age detection technique utilizing ultrasonic-guided waves.The method is based on Lamb waves propagating in plate-like structures. The long-range inspection capability isthe major attraction of this technique for structural dam-age detection. The first application of Lamb waves fordamage detection goes back to 1950s.3 Despite the factthat significant theoretical and experimental laboratoryexperience has been gathered in this area of research overmany years, successful industrial applications are very lim-ited. The complex wave propagation mechanism of Lambwaves is one of the major difficulties. The subtleties of
Correspondence: W. J. Staszewski. E-mail: [email protected]
complex physics (multiple modes, dispersion mechanism)and data interpretation (multiple reflections, mode con-versions, unreliable signal features related to damage) re-quire some experience related to monitoring strategy, asdescribed in Refs [1 and 4–6].
A number of hybrid techniques based on ultrasonicand guided ultrasonic waves have also been proposed fordamage detection to improve the techniques describedabove. These are acousto-ultrasonics,7–9 nonlinear acous-tics,10–22 vibro-acousto-ultrasonics23 and time-reversedacoustics.24–26 The nonlinear acoustics, developed in the1970s is particularly attractive for structural damage de-tection. The method is based on nonlinear effects associ-ated with ultrasonic wave propagation.
There are various studies investigating the sensitivity ofthe method to fatigue cracks in metallic structures. Re-sults from some fundamental work have shown that smallfatigue cracks, or even micro-cracks, can be detected withthe application of nonlinear acoustics. (e.g. Refs. 12,17,19)This level of sensitivity found with the nonlinear acoustictechnique is seen as its major advantage. However, otherinvestigations demonstrate that detection of small cracksis not visible when modulation effects are used.20
Despite various theoretical and experimental investiga-tions related to nonlinear acoustics, no effort has beenmade so far to compare this method with other crack
674 c© 2008 The Authors. Journal compilation c© 2008 Blackwell Publishing Ltd. Fatigue Fract Engng Mater Struct 31, 674–683
Fatigue & Fracture of Engineering Materials & Structures
COMPARATIVE STUDY OF NONLINEAR ACOUSTIC AND LAMB WAVE TECHNIQUES 675
detection techniques based on ultrasonic waves. This isthe major objective of the current investigations. The pa-per aims to compare crack detection techniques based onnonlinear acoustic and Lamb waves. For the sake of com-pleteness, both approaches are briefly described in thenext section. A simple fatigue experiment is performedto propagate a crack in an aluminium plate, as reportedin the section ‘Experimental Investigations’. This sectionalso describes how nonlinear acoustics and Lamb wavesare used for crack detection. It is important to note thatboth methods utilize low-profile piezoceramic transduc-ers for actuating and sensing. The results, presented inthe section ’Crack Detection Results’, demonstrate that– for the case investigated – the nonlinear acoustics hasthe ability to detect cracks of the same order as the Lambwave-based method.
T H E O R E T I C A L B A C K G R O U N D
In what follows, a brief introduction to nonlinear acous-tics and Lamb wave inspection is given. For more detailsrelated to theoretical background, damage detection im-plementation and application examples, the readers areguided to relevant literature.
Nonlinear acoustics for crack detection
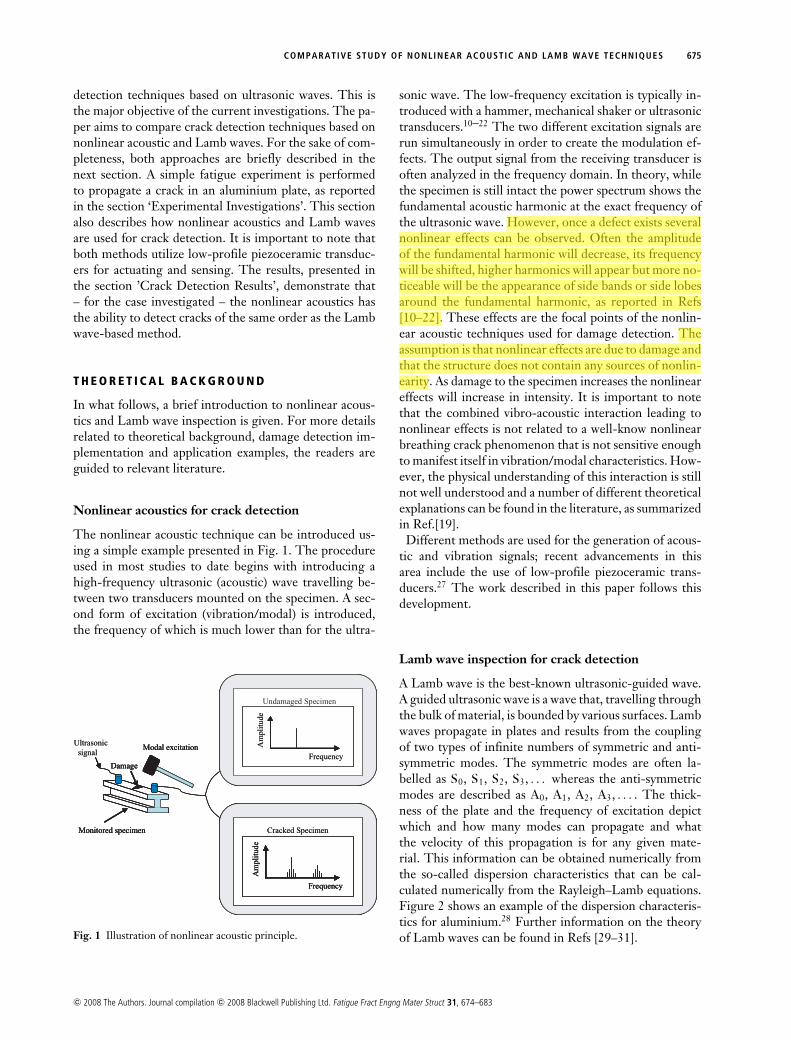
The nonlinear acoustic technique can be introduced us-ing a simple example presented in Fig. 1. The procedureused in most studies to date begins with introducing ahigh-frequency ultrasonic (acoustic) wave travelling be-tween two transducers mounted on the specimen. A sec-ond form of excitation (vibration/modal) is introduced,the frequency of which is much lower than for the ultra-
Ultrasonicsignal
Damage
Frequency
Am
plit
ude
Cracked SpecimenMonitored specimen
Modal excitationFrequency
Am
plitu
de
Undamaged Specimen
Ultrasonicsignal
Damage
Frequency
Am
plit
ude
Cracked SpecimenMonitored specimen
Modal excitationFrequency
Am
plitu
de
Undamaged Specimen
Damage
Frequency
Am
plit
ude
Cracked Specimen
Frequency
Am
plit
ude
Cracked Specimen
Frequency
Am
plit
ude
Cracked Specimen
Frequency
Am
plit
ude
Frequency
Am
plit
ude
Cracked SpecimenMonitored specimen
Modal excitationFrequency
Am
plitu
de
Frequency
Am
plitu
de
Undamaged Specimen
Fig. 1 Illustration of nonlinear acoustic principle.
sonic wave. The low-frequency excitation is typically in-troduced with a hammer, mechanical shaker or ultrasonictransducers.10–22 The two different excitation signals arerun simultaneously in order to create the modulation ef-fects. The output signal from the receiving transducer isoften analyzed in the frequency domain. In theory, whilethe specimen is still intact the power spectrum shows thefundamental acoustic harmonic at the exact frequency ofthe ultrasonic wave. However, once a defect exists severalnonlinear effects can be observed. Often the amplitudeof the fundamental harmonic will decrease, its frequencywill be shifted, higher harmonics will appear but more no-ticeable will be the appearance of side bands or side lobesaround the fundamental harmonic, as reported in Refs[10–22]. These effects are the focal points of the nonlin-ear acoustic techniques used for damage detection. Theassumption is that nonlinear effects are due to damage andthat the structure does not contain any sources of nonlin-earity. As damage to the specimen increases the nonlineareffects will increase in intensity. It is important to notethat the combined vibro-acoustic interaction leading tononlinear effects is not related to a well-know nonlinearbreathing crack phenomenon that is not sensitive enoughto manifest itself in vibration/modal characteristics. How-ever, the physical understanding of this interaction is stillnot well understood and a number of different theoreticalexplanations can be found in the literature, as summarizedin Ref.[19].
Different methods are used for the generation of acous-tic and vibration signals; recent advancements in thisarea include the use of low-profile piezoceramic trans-ducers.27 The work described in this paper follows thisdevelopment.
Lamb wave inspection for crack detection
A Lamb wave is the best-known ultrasonic-guided wave.A guided ultrasonic wave is a wave that, travelling throughthe bulk of material, is bounded by various surfaces. Lambwaves propagate in plates and results from the couplingof two types of infinite numbers of symmetric and anti-symmetric modes. The symmetric modes are often la-belled as S0, S1, S2, S3, . . . whereas the anti-symmetricmodes are described as A0, A1, A2, A3, . . . . The thick-ness of the plate and the frequency of excitation depictwhich and how many modes can propagate and whatthe velocity of this propagation is for any given mate-rial. This information can be obtained numerically fromthe so-called dispersion characteristics that can be cal-culated numerically from the Rayleigh–Lamb equations.Figure 2 shows an example of the dispersion characteris-tics for aluminium.28 Further information on the theoryof Lamb waves can be found in Refs [29–31].
c© 2008 The Authors. Journal compilation c© 2008 Blackwell Publishing Ltd. Fatigue Fract Engng Mater Struct 31, 674–683

676 M. RYLES et al.
Fig. 2 Dispersion characteristic for aluminium.28
structure
Lamb wave
structure
Lamb wave
Fig. 3 Illustration of Lamb wave inspection.
Lamb waves are often used for damage detection inplate-like structures. The waves are introduced by a trans-ducer at one point and sensed by another probe at a dif-ferent location, as illustrated in Fig. 3. Structural damagecan be identified by a change of the response signal. Amajority of current inspection techniques based on Lambwaves utilize wave attenuation, reflection and/or modeconversion for damage detection.
The fact that these waves can travel long distances andcover large areas, while using a relatively small numberof transducers, is highly advantageous. They have the po-tential to reduce inspection times dramatically and evenmake inspections increasingly thorough by interrogatingareas and detecting damage where it was previously notpossible to do so. Lamb waves are also fully penetrative,meaning unlike surface waves, damage and flaws can bedetected no matter what their position is within the thick-ness of monitored specimen. The other advantage of us-ing Lamb waves for health monitoring is that a greatdeal of research has been performed in this area. Thereexist various methodologies, approaches, transducers, sig-nal processing techniques, application examples related todamage detection, as reviewed in Refs [1] and [30].
E X P E R I M E N T A L I N V E S T I G A T I O N S
This section describes all experimental work performedin the current investigations. First, the specimen used andthe work undertaken to initiate and propagate a crack aredescribed. Then, the experimental set-up and proceduresused to detect and monitor the propagating fatigue crackare reported.
Aluminium specimen
The structure under investigation was a rectangular 150 ×290 × 2 mm plate made from NS4 grade aluminium. Asharp-edged notch was created in the centre of the plateto initiate a fatigue crack. The notch was introduced bydrilling a 1 mm diameter hole and then extending thenotch (perpendicular to the later applied fatigue load) by0.5 mm using a hacksaw blade of thickness 0.5 mm. Fiveequally spaced 10 mm holes were also drilled near bothshorter edges of the plate for clamping in the fatigue test.
The plate was instrumented with four PI Ceramics PIC-155 piezoceramic transducers of diameter 10 mm andthickness 1 mm. However, only two transducers (indi-cated as A and B) were used for ultrasonic wave gen-eration and sensing in both crack detection techniques.A PI Ceramics PL-055.31 piezoceramic stack actuator(5 × 5 × 2 mm) was additionally bonded on the plate.This actuator was used for vibration excitation in non-linear acoustics. All transducers were surface-bonded tothe plate using the X60 fast-curing two-component ad-hesive glue. A schematic diagram and a photograph ofthe specimen together with the position of the notch andpiezo-transducers can be seen in Fig. 4.
Modal analysis
A simple modal analysis experiment was performed toestablish frequencies of vibration excitation used in non-linear acoustics. The specimen was freely suspended us-ing rubbers. The specimen was then excited using thepiezoceramic stack actuator with a sweep sine chirp sig-nal starting at 1 Hz and linearly crossing 2 800 Hz in 2s.A two-channel TTi-TGA 1242, 40 MHz arbitrary wave-form generator was used to generate the excitation sig-nal. This signal was amplified with the PI E-505 LVPZTpiezo-amplifier. The amplitude level was equal to 20 V.A voltage meter was used to monitor the DC offset of theexcitation. The output response was measured using oneof the PIC-155 piezoceramic transducers bonded on theplate. The response signal from the transducer was ac-quired using a four-channel LeCroy Waverunner LT264,350, MHz, 1 GS/s digital oscilloscope. Figure 5 gives ex-amples of the excitation and response signals used in theexperimental modal analysis test.
c© 2008 The Authors. Journal compilation c© 2008 Blackwell Publishing Ltd. Fatigue Fract Engng Mater Struct 31, 674–683

COMPARATIVE STUDY OF NONLINEAR ACOUSTIC AND LAMB WAVE TECHNIQUES 677
Fig. 4 Aluminium specimen used for crackdetection.
Sweep sine
-1.5
-1
-0.5
0
0.5
1
1.5
0.82 0.87 0.92 0.97 1.02
Time (s)
Am
pli
tud
e (
V)
Response signal
0
0.0250.02
0.0150.01
0.005
-0.005-0.01
-0.015-0.02
-0.025
0 0.2 0.4 0.6 0.8 1
Time (s)
Am
plitu
de (
V)
Fig. 5 Input and output signals used in modal analysis.
The frequency response function, calculated in MAT-LAB using the input and output signals, is given inFig. 6. This reveals a number of vibration modes of theplate. The 118 Hz frequency mode was used in the non-linear acoustic test for the low-frequency excitation. Thisfrequency corresponded approximately to the theoreticalvalue of the first bending mode of the plate.
Having decided upon the low-frequency excitation theinitial, that is, no crack damage detection data, were ob-tained following the procedures described in the previoussection.
Fatigue tests
In order to initiate and propagate a crack in the plate,fatigue testing was used. The plate was fatigued usingan ESH hydraulic testing machine, as shown in Fig. 7.The specimen was placed under a maximum combineddynamic and static loading of 27 kN. The frequency ofexcitation was equal to 10 Hz. The loading format waskept to a tensile–tensile format to make sure the specimendid not buckle. A simple calculation was performed inorder to estimate the required dynamic loading. Initiallythe load was set to a relatively low level to make sure the
c© 2008 The Authors. Journal compilation c© 2008 Blackwell Publishing Ltd. Fatigue Fract Engng Mater Struct 31, 674–683

678 M. RYLES et al.
FRF
0.001
0.01
0.1
1
10
0 200 400 600 800 1000 1200
Frequency
Am
pli
tud
e
Resonant peak at a frequency of 118 Hz
Fig. 6 Frequency response function for thealuminium specimen.
Fig. 7 Fatigue testing arrangements.
specimen would not fail in the early stages. The load wasthen increased to just above the calculated level. After thecrack had reached a certain length the loading was reducedagain to ensure the specimen did not fail completely.
The crack was observed using a 15× magnification andmeasured using a steel ruler accurate to 0.5 mm. The firstcrack was spotted at 535 000 cycles at a length of 1.0 mm.The specimen was fatigued up to 674 500 cycles. Figure 8shows the crack propagation curve. The maximum crackobserved was 51.5 mm, as shown in Fig. 9.
After subsequent crack length measurements, the spec-imen was unclamped for nonlinear acoustic and Lambwave tests, as described in the next section.
Crack Propagation Curve
0.0
10.0
20.0
30.0
40.0
50.0
60.0
500000 550000 600000 650000 700000
Number of Cycles
Cra
ck le
ngth
[mm
]
Fig. 8 Crack propagation curve.
Experimental set-up and procedures for crackdetection
Experimental set-up
The set-up of the equipment used to monitor the speci-men for fatigue cracks is shown in Fig. 10. A two-channelTTi-TGA 1242, 40 MHz arbitrary waveform generatorwas used to generate all signals, that is, low-frequencyharmonic vibration, high-frequency acoustic sine waveand Lamb waves. The PI E-505 LVPZT piezo-amplifierwas used to amplify the vibration signal from the wave-form generator. This signal was used to drive the piezo-ceramic stack actuator. In order to set and monitor theDC offset of the amplifier, a voltage meter was used en-suring the stack actuator was not overloaded. To displayand store the response waveforms, a four-channel LeCroyWaverunner LT264, 350, MHz, 1 GS/s digital oscillo-scope was used.
c© 2008 The Authors. Journal compilation c© 2008 Blackwell Publishing Ltd. Fatigue Fract Engng Mater Struct 31, 674–683

COMPARATIVE STUDY OF NONLINEAR ACOUSTIC AND LAMB WAVE TECHNIQUES 679
Fig. 9 Photograph for the 51.8 mm crack after 675 800 fatiguecycles.
Experimental procedure – nonlinear acoustics
The nonlinear acoustic technique was applied for differ-ent damage severities. The tests were performed for freeboundary conditions; the specimen was freely suspended.The ultrasonic continuous sine wave was introduced tothe plate using the piezoceramic actuator A. The excita-tion frequency of 60 kHz was selected at a peak-to-peakamplitude of 10 V based on previous studies.27 The spec-imen was simultaneously vibrated with the low-frequencysine wave introduced by the piezoceramic stack actuator.The low-frequency excitation signal was a continuous sinewave of 118 Hz, selected in the previous section. Thepeak-to-peak amplitude of the vibration signal was equalto 20 V. The acoustic responses were sensed using thepiezoceramic sensor B.
Several sets of data were taken before crack initiationand once the crack was observed data were taken every2 mm of crack propagation. The power spectrum for alldata sets was obtained using the oscilloscope. The spectrawere zoomed on the fundamental harmonic of acousticwave.
Fig. 10 Experimental set-up for crackdetection tests.
Experimental procedure – Lamb waves
The five-cycle burst signal was used to excite the piezo-ceramic actuator A. The Haning window enveloped wasused. The peak-to-peak amplitude of the wave was equalto 10 V. The frequency of the signal was equal to 75 kHz.Following the aluminium dispersion curve in Fig. 2, thisfrequency was chosen to obtain the so-called single Lambwave mode propagation. The frequency was selected ex-perimentally to maximize the amplitude of the A0 modeand minimize to negligible levels the amplitude of the S0
mode. The selected Lamb wave frequency was relativelyclosed to the frequency of the ultrasonic wave used inthe nonlinear acoustic tests. Lamb wave responses weresensed by the piezoceramic sensor B.
C R A C K D E T E C T I O N R E S U L T S
Nonlinear acoustics
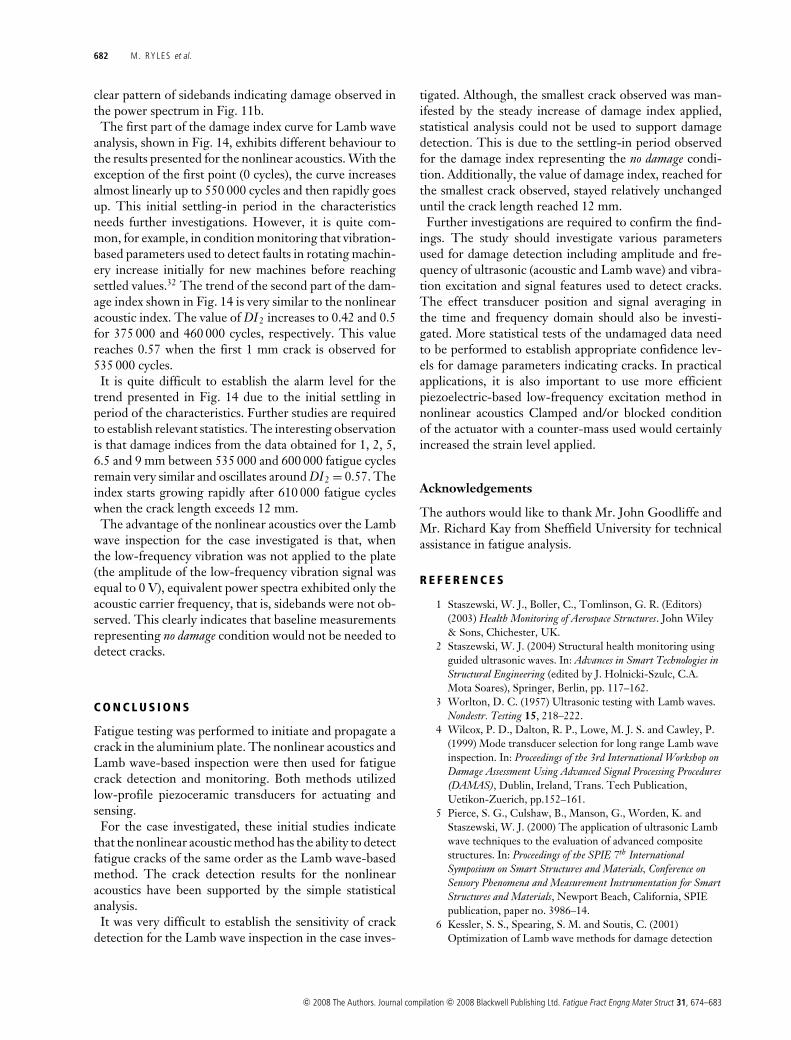
Figure 11 shows examples of power spectra for three dif-ferent damage conditions. Here, the right column demon-strates the spectra that were obtained for the acousticresponses gathered in the presence of the low-frequencyvibration signal. Similar spectra for the acoustic responsesobtained when the plate was not vibrated (i.e. the ampli-tude level of the low-frequency vibration was equal to0 V) are given in the left column for comparison. Theultrasonic carrier frequency of 60 kHz can be observedin all presented spectra. A pattern of sidebands aroundthe carrier frequency can be seen in Fig. 11b and c addi-tionally when the 1mm and 12 mm cracks were observedin the plate and the plate was vibrated. The frequencyspacing of these sidebands corresponds to the 118 Hz fre-quency of the low-frequency vibration excitation. The re-sults in Fig. 11b and c also demonstrate that the number ofsidebands depends on the crack length. Clearly, modula-tion sidebands indicated the presence of the crack in thespecimen.
Various parameters can be used to analyze the modula-tion processes resulting from the combined vibro-acoustic
c© 2008 The Authors. Journal compilation c© 2008 Blackwell Publishing Ltd. Fatigue Fract Engng Mater Struct 31, 674–683

680 M. RYLES et al.
(a)0V
-80
-70
-60
-50
-40
-30
-20
-10
0
50000 55000 60000 65000 70000Frequency (Hz)
Am
plitu
de (
dB)
20V
-80
-70
-60
-50
-40
-30
-20
-10
0
50000 55000 60000 65000 70000Frequency (Hz)
Am
plitu
de (
dB)
(b)0V
-80
-70
-60
-50
-40
-30
-20
-10
0
50000 55000 60000 65000 70000Frequency (Hz)
Am
plitu
de (
dB)
20V
-80
-70
-60
-50
-40
-30
-20
-10
0
50000 55000 60000 65000 70000Frequency (Hz)
Am
plitu
de (
dB)
(c)0V
-80
-70
-60
-50
-40
-30
-20
-10
0
50000 55000 60000 65000 70000Frequency (Hz)
Am
plitu
de (
dB)
20V
-80
-70
-60
-50
-40
-30
-20
-10
0
50000 55000 60000 65000 70000Frequency (Hz)
Am
plitu
de (
dB)
Fig. 11 Power spectra of acoustic responsesfor crack length equal to: (a) 0 mm (b) 1 mm(c) 12 mm.
interaction.10–22,27 The damage index DI1, for all acousticresponses, was calculated using the intensity of modula-tion defined as
DI1 = � ff0
× 100% (1)
where f 0 is the carrier (acoustic frequency) and � f isthe frequency bandwidth covering the pattern of mod-ulation sidebands. The intensity of modulation increasesthe number and amplitude of sidebands, and the ampli-tude of the career frequency decreases. This results inlarger values of the damage index. Figure 12 presentsnormalized damage index results plotted versus fatiguecycles.
Lamb waves
Figure 13 gives examples of the Lamb wave responsesobtained for the undamaged specimen and after 535 000fatigue cycles (crack length 1 mm). The responses forthese two damage conditions are different. The first wave
0 2e+05 4e+05 6e+05Fatigue cycles
0
0.2
0.4
0.6
0.8
1
1.2
Nor
mal
ized
dam
age
inde
x D
I 1
Fig. 12 Normalized damage index DI 1.
package is the incident wave. Other wave packages includereflections from various boundaries. The response for thecracked specimen includes additionally the wave packagereflected from fatigue damage. This study does not aimto identify all these wave packages.
c© 2008 The Authors. Journal compilation c© 2008 Blackwell Publishing Ltd. Fatigue Fract Engng Mater Struct 31, 674–683

COMPARATIVE STUDY OF NONLINEAR ACOUSTIC AND LAMB WAVE TECHNIQUES 681
There are several signal features that can be used to de-scribe the severity of damage that the Lamb wave analysisdetects.1 This study utilizes the damage index based onthe frequency of the Lamb wave response in order tobe compatible with the nonlinear acoustics analysis. Thedamage index DI2 used was defined as
DI2 = Rxy√Rxx Ryy
, (2)
where
Rxy(τ ) = 1T
T/2∫
−T/2
x(t)y(t + τ )dt, (3)
is the cross-correlation function between the x(t) refer-ence Lamb wave response representing the no damagecondition (i.e. the first measurement taken before thespecimen was fatigue cycled) and the y(t) actual Lambwave response and Rxx, Ryy are relevant autocorrelationfunctions.
The assumption is that the cross-correlation detects anyalterations in frequency/phase of the analyzed signal thatmight be caused by the damage. Equation (1) guaran-tees that if the frequency/phase of the two compared sig-nals is identical (for no damage condition), the value ofthe damage index DI2 is equal to 0. If however, the fre-quency/phase is not the same then the cross-correlationis less than 1 and the damage index increases with theseverity of damage and is normalized between 0 and 1.Figure 14 presents damage index results plotted versusfatigue cycles.
Discussion
The results, presented in Figs 12 and 14, were normal-ized in relation to their values at the severest damage stateto allow for direct comparison. Substantial scatter canbe observed due to the fact that the power spectra andLamb wave responses were not averaged. Nevertheless
(a) (b)
0 0.2 0.4 0.6Time [ms]
-30
-20
-10
0
10
20
30
Am
plitu
de [
mV
]
0 0.2 0.4 0.6Time [ms]
-30
-20
-10
0
10
20
30
Am
plitu
de [
mV
]
Fig. 13 Lamb wave responses for after: (a) 0 fatigue cycles (b) 535 00 fatigue cycles.
0 2e+05 4e+05 6e+05Fatigue Cycles
0
0.2
0.4
0.6
0.8
1
1.2
No
rma
lize
d d
am
age
ind
ex
DI 2
Fig. 14 Normalized damage index DI 2.
clear trends can be observed in the behaviour of the an-alyzed damage indices; damage indices increase with thenumber of cycles when the crack is observed.
The damage index DI1 for the nonlinear acoustics testsis scattered between 0 and approximately 0.22 for fatiguecycles less than 300 000. Then the value goes up to 0.3 and0.35 for 375 000 and 460 000 cycles, respectively. Whenthe first 1.0 mm crack is observed for 535 000 cycles, thevalue of damage index increases to 0.4 and then growsrapidly with the large scatter.
The first 10 values of damage index (i.e. up to 275 000fatigue cycles) from the no damage condition (i.e. cracknot present in the specimen) were used to establish thelevel of scatter; the mean μ0 and standard deviation σ 0
were calculated. The alarm or warning level was calcu-lated as μ0+4σ 0
23 to obtain information about possi-ble damage. This alarm level is shown in Fig. 12 as thestraight solid line. Once the damage index reaches thealarm level, it is assumed that the crack is detected. Theanalysis performed shows that 1 mm crack is detected after535 000 fatigue cycles when the nonlinear acoustic is usedfor crack detection. This result can be confirmed by the
c© 2008 The Authors. Journal compilation c© 2008 Blackwell Publishing Ltd. Fatigue Fract Engng Mater Struct 31, 674–683
682 M. RYLES et al.
clear pattern of sidebands indicating damage observed inthe power spectrum in Fig. 11b.
The first part of the damage index curve for Lamb waveanalysis, shown in Fig. 14, exhibits different behaviour tothe results presented for the nonlinear acoustics. With theexception of the first point (0 cycles), the curve increasesalmost linearly up to 550 000 cycles and then rapidly goesup. This initial settling-in period in the characteristicsneeds further investigations. However, it is quite com-mon, for example, in condition monitoring that vibration-based parameters used to detect faults in rotating machin-ery increase initially for new machines before reachingsettled values.32 The trend of the second part of the dam-age index shown in Fig. 14 is very similar to the nonlinearacoustic index. The value of DI2 increases to 0.42 and 0.5for 375 000 and 460 000 cycles, respectively. This valuereaches 0.57 when the first 1 mm crack is observed for535 000 cycles.
It is quite difficult to establish the alarm level for thetrend presented in Fig. 14 due to the initial settling inperiod of the characteristics. Further studies are requiredto establish relevant statistics. The interesting observationis that damage indices from the data obtained for 1, 2, 5,6.5 and 9 mm between 535 000 and 600 000 fatigue cyclesremain very similar and oscillates around DI2 = 0.57. Theindex starts growing rapidly after 610 000 fatigue cycleswhen the crack length exceeds 12 mm.
The advantage of the nonlinear acoustics over the Lambwave inspection for the case investigated is that, whenthe low-frequency vibration was not applied to the plate(the amplitude of the low-frequency vibration signal wasequal to 0 V), equivalent power spectra exhibited only theacoustic carrier frequency, that is, sidebands were not ob-served. This clearly indicates that baseline measurementsrepresenting no damage condition would not be needed todetect cracks.
C O N C L U S I O N S
Fatigue testing was performed to initiate and propagate acrack in the aluminium plate. The nonlinear acoustics andLamb wave-based inspection were then used for fatiguecrack detection and monitoring. Both methods utilizedlow-profile piezoceramic transducers for actuating andsensing.
For the case investigated, these initial studies indicatethat the nonlinear acoustic method has the ability to detectfatigue cracks of the same order as the Lamb wave-basedmethod. The crack detection results for the nonlinearacoustics have been supported by the simple statisticalanalysis.
It was very difficult to establish the sensitivity of crackdetection for the Lamb wave inspection in the case inves-
tigated. Although, the smallest crack observed was man-ifested by the steady increase of damage index applied,statistical analysis could not be used to support damagedetection. This is due to the settling-in period observedfor the damage index representing the no damage condi-tion. Additionally, the value of damage index, reached forthe smallest crack observed, stayed relatively unchangeduntil the crack length reached 12 mm.
Further investigations are required to confirm the find-ings. The study should investigate various parametersused for damage detection including amplitude and fre-quency of ultrasonic (acoustic and Lamb wave) and vibra-tion excitation and signal features used to detect cracks.The effect transducer position and signal averaging inthe time and frequency domain should also be investi-gated. More statistical tests of the undamaged data needto be performed to establish appropriate confidence lev-els for damage parameters indicating cracks. In practicalapplications, it is also important to use more efficientpiezoelectric-based low-frequency excitation method innonlinear acoustics Clamped and/or blocked conditionof the actuator with a counter-mass used would certainlyincreased the strain level applied.
Acknowledgements
The authors would like to thank Mr. John Goodliffe andMr. Richard Kay from Sheffield University for technicalassistance in fatigue analysis.
R E F E R E N C E S
1 Staszewski, W. J., Boller, C., Tomlinson, G. R. (Editors)(2003) Health Monitoring of Aerospace Structures. John Wiley& Sons, Chichester, UK.
2 Staszewski, W. J. (2004) Structural health monitoring usingguided ultrasonic waves. In: Advances in Smart Technologies inStructural Engineering (edited by J. Holnicki-Szulc, C.A.Mota Soares), Springer, Berlin, pp. 117–162.
3 Worlton, D. C. (1957) Ultrasonic testing with Lamb waves.Nondestr. Testing 15, 218–222.
4 Wilcox, P. D., Dalton, R. P., Lowe, M. J. S. and Cawley, P.(1999) Mode transducer selection for long range Lamb waveinspection. In: Proceedings of the 3rd International Workshop onDamage Assessment Using Advanced Signal Processing Procedures(DAMAS), Dublin, Ireland, Trans. Tech Publication,Uetikon-Zuerich, pp.152–161.
5 Pierce, S. G., Culshaw, B., Manson, G., Worden, K. andStaszewski, W. J. (2000) The application of ultrasonic Lambwave techniques to the evaluation of advanced compositestructures. In: Proceedings of the SPIE 7th InternationalSymposium on Smart Structures and Materials, Conference onSensory Phenomena and Measurement Instrumentation for SmartStructures and Materials, Newport Beach, California, SPIEpublication, paper no. 3986–14.
6 Kessler, S. S., Spearing, S. M. and Soutis, C. (2001)Optimization of Lamb wave methods for damage detection
c© 2008 The Authors. Journal compilation c© 2008 Blackwell Publishing Ltd. Fatigue Fract Engng Mater Struct 31, 674–683

COMPARATIVE STUDY OF NONLINEAR ACOUSTIC AND LAMB WAVE TECHNIQUES 683
in composite materials. In: Proceedings of the 3rd Workshop onStructural Health Monitoring, Stanford, California, CRCPress, pp. 870–879.
7 Vary, A. (1988) The acousto-ultrasonic approach. In:Acousto-Ultrasonics: Theory and Application (edited by J.C.Duke Jr.), Plenum Press, New York.
8 Biemans, C., Staszewski, W. J., Boller, C. and Tomlinson, G.R. (2001). Crack detection in metallic structures usingbroadband excitation of acousto-ultrasonics. J Intel. Mat.Syst. Struct. 12, 589–597.
9 Lu, Y. and Michaels, J. E. (2005) A methodology forstructural health monitoring with diffuse ultrasonic waves inthe presence of temperature variations. Ultrasonics 43,717–731.
10 Richardson, M. (1979) Harmonic generation at an unboundinterface. Part I: planar interface between semi-infinitemedia. Int. J. Eng. Sci. 17, 73–75.
11 Morris, W. L., Buck, O. and Inman, R. V. (1979) Acousticharmonic generation due to fatigue damage in high-strengthaluminium. J. Applied Physics 50, 6737–6741.
12 Antonets, V. A., Donskoy, D. M. and Sutin, A. M. (1986)Nonlinear-vibro diagnostics of flaw in multilayeredstructures. Compos. Mat. 15, 934–937.
13 Nagy, P. B., McGowan, P. and Adler, L. (1990) Acousticnonlinearities in adhesive joints. Rev. Prog. QNDE 10B,1685–1692.
14 Nazarov, V. E. and Sutin, A. M. (1997) Nonlinear elasticconstants of solids with cracks. J. Acoust. Soc. Am. 102,3349–3354.
15 Guyer, R. A., McCall, K. R. and Van Den Abeele, K. (1998)Slow elastic dynamics in a resonant bar of rock. Geophys. Res.Letters 25, 1585–1588.
16 Johnson, P. (1999) The new wave in acoustic testing.Materials World, The J. Inst. Materials 7, 544–546.
17 Van Den Abeele, K., Johnson, P. A. and Sutin, A. M. (2000)Nonlinear elastic wave spectroscopy (NEWS) technique todiscern material damage. part I: nonlinear wave modulationspectroscopy. Rev. Prog. QNDE 12, 17–30.
18 Van Den Abeele, K. and De Visscher, J. (2000) Damageassessment in reinforced concrete using spectral andtemporal nonlinear vibration techniques. Cem. Conr. Res. 30,1453–1464.
19 Rudenko, O. V. (2006) Giant nonlinearities in structurallyinhomogeneous media and the fundamentals of nonlinearacoustic diagnostic techniques. Physics – Uspekhi 49, 69–87.
20 Duffour, P., Morbidini, M. and Cawley, P. (2006) A study ofthe vibro-acoustic modulation technique for the detection ofcracks in metals. J. Acoust. Soc. Am. 119, 1463–1475.
21 Duffour, P., Cawley, P. and Morbidini, M. (2006)Comparison between vibro-acoustic modulation anddamping measurement as NDT techniques. NDT&E Int. 39,123–131.
22 Murayama, R. and Ayaka, K. (2007) Evaluation of fatiguespecimens using EMATs for Nonlinear ultrasonic wavedetection. J. Nondestructive Evaluation 26, 115–122.
23 Staszewski, W. J. and Buderath, M. (2004)Vibro-acousto-ultrasonics for fatigue crack detection andmonitoring in aircraft components. In: Proceedings of the 2ndEuropean Workshop in Structural Health Monitoring, Munich,Germany, DEStech Publications Inc., Lancaster, PA, USA,pp.374–381.
24 Ing, R. and Fink, M. (1996) Time recompression ofdispersive Lamb waves using a time reversal mirror —application to flaw detection in thin plates. In: Proceedings ofthe IEEE Ultrasonics Symposium, Bellingham, WA, USA,Volume 1, pp. 659–663.
25 Wang, C. H., Rose, J. T. and Chang, F. K. (2003) ‘Acomputerized time-reversal method for structural healthmonitoring. In: Proceedings of the 10th SPIE Conference onSmart Structures and NDE, San Diego, CA, USA.
26 Sohn, H, Park, H. W., Law, K. H. and Farrar, C. R. (2007)Combination of a Time Reversal Process and a ConsecutiveOutlier Analysis for Baseline-free Damage Diagnosis. J. Intel.Mat. Syst. Struct. 18, 335–346.
27 Parsons, Z. and Staszewski, W. J. (2006) Nonlinear acousticswith low-profile piezoceramic excitation for crack detectionin metallic structures. Smart Mat. Struct. 15, 1110–1118.
28 Lee, B. C. (2005) Local interaction simulation approach fordamage detection with Lamb waves. PhD thesis, SheffieldUniversity, Department of Mechanical Engineering.
29 Rose, J. L. (1999) Ultrasonic Waves in Solid Media. CambridgeUniversity Press, Cambridge, UK.
30 Chimenti, D. E. (2003) Guided waves in plates and their usein materials characterization. Appl. Mech. Rev. 50, 247–284.
31 Cheeke, J. D. N. (2002) Fundamentals and Applications ofUltrasonic Waves. CRC Press, Boca Raton, Florida, USA.
32 Cempel, C. (1993) Vibroacoustic Condition Monitoring. EllisHorwood, London, UK.
c© 2008 The Authors. Journal compilation c© 2008 Blackwell Publishing Ltd. Fatigue Fract Engng Mater Struct 31, 674–683