comparing and combining sentiment analysis methods · comparing and combining sentiment analysis...
TRANSCRIPT
Comparing and Combining Sentiment Analysis Methods
Pollyanna GonçalvesUFMG
Belo Horizonte, [email protected]
Matheus AraújoUFMG
Belo Horizonte, [email protected]
Fabrício BenevenutoUFMG
Belo Horizonte, [email protected]
Meeyoung ChaKAIST
Daejeon, [email protected]
ABSTRACTSeveral messages express opinions about events, products,and services, political views or even their author’s emotionalstate and mood. Sentiment analysis has been used in severalapplications including analysis of the repercussions of eventsin social networks, analysis of opinions about products andservices, and simply to better understand aspects of socialcommunication in Online Social Networks (OSNs). Thereare multiple methods for measuring sentiments, includinglexical-based approaches and supervised machine learningmethods. Despite the wide use and popularity of somemethods, it is unclear which method is better for identi-fying the polarity (i.e., positive or negative) of a message asthe current literature does not provide a method of compar-ison among existing methods. Such a comparison is crucialfor understanding the potential limitations, advantages, anddisadvantages of popular methods in analyzing the contentof OSNs messages. Our study aims at filling this gap bypresenting comparisons of eight popular sentiment analysismethods in terms of coverage (i.e., the fraction of messageswhose sentiment is identified) and agreement (i.e., the frac-tion of identified sentiments that are in tune with groundtruth). We develop a new method that combines existingapproaches, providing the best coverage results and compet-itive agreement. We also present a free Web service callediFeel, which provides an open API for accessing and com-paring results across different sentiment methods for a giventext.
Categories and Subject DescriptorsJ.4 [Computer Applications]: Social and Behavioral Sci-ences; H.3.5 [Online Information Services]: Web-basedservices
General TermsHuman Factors, Measurement
Permission to make digital or hard copies of all or part of this work for personal orclassroom use is granted without fee provided that copies are not made or distributedfor profit or commercial advantage and that copies bear this notice and the full citationon the first page. Copyrights for components of this work owned by others than theauthor(s) must be honored. Abstracting with credit is permitted. To copy otherwise, orrepublish, to post on servers or to redistribute to lists, requires prior specific permissionand/or a fee. Request permissions from [email protected]’13, October 07–08, 2013, Boston, MA, USA.Copyright is held by the owner/author(s). Publication rights licensed to ACM.ACM 978-1-4503-2084-9/13/10 ...$15.00.http://dx.doi.org/10.1145/2512938.2512951.
KeywordsSentiment analysis, social networks, public mood
1. INTRODUCTIONOnline Social Networks (OSNs) have become popular com-
munication platforms for the public to logs thoughts, opin-ions, and sentiments about everything from social eventsto daily chatter. The size of the active user bases and thevolume of data created daily on OSNs are massive. Twit-ter, a popular micro-blogging site, has 200 million activeusers, who post more than 400 million tweets a day [32].Notably, a large fraction of OSN users make their contentpublic (e.g., 90% in case of Twitter), allowing researchersand companies to gather and analyze data at scale [12]. Asa result, a big number of studies have monitored the trend-ing topics, memes, and notable events on OSNs, includingpolitical events [29], stock marketing fluctuations [7], diseaseepidemics [15,19], and natural disasters [25].
One important tool used in this context is methods for de-tecting sentiments expressed in OSN messages. While a widerange of human moods can be captured through sentimentanalysis, a large majority of studies focus on identifying thepolarity of a given text—that is to automatically identifyif a message about a certain topic is positive or negative.Polarity analysis has numerous applications especially forreal time systems that rely on analyzing public opinions ormood fluctuations (e.g., social network analytics on productlaunches) [17].
Broadly, there exist two types of methods for sentimentanalysis: machine-learning-based and lexical-based. Ma-chine learning methods often rely on supervised classifica-tion approaches, where sentiment detection is framed as abinary (i.e., positive or negative). This approach requireslabeled data to train classifiers [22]. While one advantageof learning-based methods is their ability to adapt and cre-ate trained models for specific purposes and contexts, theirdrawback is the availability of labeled data and hence thelow applicability of the method on new data. This is be-cause labeling data might be costly or even prohibitive forsome tasks.
On the other hand, lexical-based methods make use ofa predefined list of words, where each word is associatedwith a specific sentiment. The lexical methods vary ac-cording to the context in which they were created. Forinstance, LIWC [27] was originally proposed to analyze sen-timent patterns in formally written English texts, whereas
arX
iv:1
406.
0032
v1 [
cs.C
L]
30
May
201
4
PANAS-t [16] and POMS-ex [8] were proposed as psycho-metric scales adapted to the Web context. Although lexicalmethods do not rely on labeled data, it is hard to create aunique lexical-based dictionary to be used for different con-texts. For instance, slang is common in OSNs but is rarelysupported in lexical methods [18].
Despite business potentials, little is known about how var-ious sentiment methods work in the context of OSNs. Inpractice, sentiment methods have been widely used for devel-oping applications without an understanding either of theirapplicability in the context of OSNs, or their advantages,disadvantages, and limitations in comparison with one an-other. In fact, many of these methods were proposed forcomplete sentences, not for real-time short messages, yet lit-tle eff-ort has been paid to apple-to-apple comparison of themost widely used sentiment analysis methods. The limitedavailable research shows machine learning approaches (NaıveBayes, Maximum Entropy, and SVM) to be more suitablefor Twitter than the lexical-based LIWC method [27]. Sim-ilarly, classification methods (SVM, and Multinomial NaıveBayes) are more suitable than SentiWordNet for Twitter [6].However, it is hard to conclude whether a single classifica-tion method is better than all lexical methods across differ-ent scenarios nor if it can achieve the same level of coverageas some lexical methods.
In this paper, we aim to fill this research gap. We usetwo different sets of OSN data to compare eight widely usedsentiment analysis methods: LIWC, Happiness Index, Senti-WordNet, SASA, PANAS-t, Emoticons, SenticNet, and Sen-tiStrength. As a first step comparison, we focus on deter-mining the polarity (i.e., positive and negative affects) of agiven social media text, which is an overlapping dimensionacross all eight sentiment methods and provides desirableinformation for a number of different applications. The twodatasets we employ are large in scale. The first consistsof about 1.8 billion Twitter messages [12], from which wepresent six major events, including tragedies, product re-leases, politics, health, and sports. The second dataset is anextensive collection of texts, whose sentiments were labeledby humans [28]. Based on these datasets, we compare theeight sentiment methods in terms of coverage (i.e., the frac-tion of messages whose sentiment is identified) and agree-ment (i.e., the fraction of identified sentiments that are intune with results from others).
We summarize some of our main results:
1. Existing sentiment analysis methods have varying de-grees of coverage, ranging between 4% and 95% whenapplied to real events. This means that dependingon the sentiment method used, only a small fractionof data may be analyzed, leading to a bias or under-representation of data.
2. No single existing sentiment analysis method had highcoverage and correspondingly high agreement. Emoti-cons achieve the highest agreement of above 85%, buthave extremely low agreement of between 4% to 13%.
3. When it comes to the predicted polarity, existing meth-ods varied widely in their agreement, ranging from 33%to 80%. This suggests that the same social media textcould be interpreted very differently depending on thechoice of a sentiment method.
4. Existing methods varied widely in their sentiment pre-diction of notable social events. For the case of anairplane crash, half of the methods predicted the rel-evant tweets to contain positive affect, instead of neg-ative affect. For the case of a disease outbreak, onlytwo out of eight methods predicted the relevant tweetsto contain negative affect.
Finally, based on these observations, we developed a newsentiment analysis method that combines all eight existingapproaches in order to provide the best coverage and com-petitive agreement. We further implement a public WebAPI, called iFeel (http://www.ifeel.dcc.ufmg.br), whichprovides comparative results among the different sentimentmethods for a given text. We hope that our tool will helpthose researchers and companies interested in an open APIfor accessing and comparing a wide range of sentiment anal-ysis techniques.
The rest of this paper is organized as follows. In Section 2,we describe the eight methods that are used for comparison,as we cover a wide set of related work. Section 3 outlines thecomparison methodology as well as the data used for com-parison, and Section 4 highlights the comparison results. InSection 5, we propose a newly combined method of sen-timent analysis that has the highest coverage in handlingOSN data, while having reasonable agreement. We presentthe iFeel system and conclude in Section 6.
2. SENTIMENT ANALYSIS METHODSThis section provides a brief description of the eight sen-
timent analysis methods investigated in this paper. Thesemethods are the most popular in the literature (i.e., the mostcited and widely used) and they cover diverse techniquessuch as the use of Natural Language Processing (NLP) inassigning polarity, the use of Amazon’s Mechanical Turk(AMT) to create labeled datasets, the use of psychometricscales to identify mood-based sentiments, the use of super-vised and unsupervised machine learning techniques, and soon. Validation of these methods also varies greatly, fromusing toy examples to a large collection of labeled data.
2.1 EmoticonsThe simplest to detect the way polarity (i.e., positive and
negative affect) of a message is based on the emoticons itcontains. Emoticons have become popular in recent years,to the extent that some (e.g. <3) are now included in EnglishOxford Dictionary [3]. Emoticons are primarily face-basedand represent happy or sad feelings, although a wide rangeof non-facial variations exist: for instance, <3 represents aheart and expresses love or affection.
To extract polarity from emoticons, we utilize a set ofcommon emoticons from [1, 2, 4] as listed in Table 1. Thistable also includes the popular variations that express theprimary polarities of positive, negative, and neutral. Mes-sages with more than one emoticon were associated to thepolarity of the first emoticon that appeared in the text, al-though we encountered only a small number of such cases inthe data.
As one may expect, the rate of OSN messages containingat least one emoticon is very low compared to the total num-ber of messages that could express emotion. A recent workhas identified that this rate is less than 10% [23]. Therefore,emoticons have been often used in combination with other
Table 1: Emoticons and their variationsEmoticon Polarity Symbols
:) :] :} :o) :o] :o}:-] :-) :-} =) =] =}=^] =^) =^} :B :-D :-B
Positive :^D :^B =B =^B =^D :’):’] :’} =’) =’] =’} <3^.^ ^-^ ^_^ ^^ :* =*:-* ;) ;] ;} :-p :-P:-b :^p :^P :^b =P=p \o\ /o/ :P :p :b =b=^p =^P =^b \o/
D: D= D-: D^: D^= :( :[:{ :o( :o[ :^( :^[ :^{=^( =^{ >=( >=[ >={ >=(>:-{ >:-[ >:-( >=^[ >:-(
Negative :-[ :-( =( =[ ={ =^[>:-=( >=[ >=^( :’( :’[:’{ =’{ =’( =’[ =\ :\=/ :/ =$ o.O O_o Oo:$:-{ >:-{ >=^{ :o{
:| =| :-| >.< >< >_< :o
Neutral :0 =O :@ =@ :^o :^@ -.--.-’ -_- -_-’ :x =X :#=# :-x :-@ :-# :^x :^#
techniques for building a training dataset in supervised ma-chine learning techniques [24].
2.2 LIWCLIWC (Linguistic Inquiry and Word Count) [27] is a text
analysis tool that evaluates emotional, cognitive, and struc-tural components of a given text based on the use of a dic-tionary containing words and their classified categories. Inaddition to detecting positive and negative affects in a giventext, LIWC provides other sets of sentiment categories. Forexample, the word“agree”belongs to the following word cat-egories: assent, affective, positive emotion, positive feeling,and cognitive process.
The LIWC software is commercial and provides optimiza-tion options such as allowing users to include customizeddictionaries instead of the standard ones. For this paper,we used the LIWC2007 version and its English dictionary,which is the most current version and contains labels formore than 4,500 words and 100 word categories. The LIWCsoftware is available at http://www.liwc.net/. In order tomeasure polarity, we examined the relative rate of positiveand negative affects in the feeling categories.
2.3 SentiStrengthMachine-learning-based methods are suitable for applica-
tions that need content-driven or adaptive polarity identifi-cation models. Several key classifiers for identifying polarityin OSN data have been proposed in the literature [6,21,28].
The most comprehensive work [28] compared a wide rangeof supervised and unsupervised classification methods, in-cluding simple logistic regression, SVM, J48 classificationtree, JRip rule-based classifier, SVM regression, AdaBoost,Decision Table, Multilayer Perception, and Naıve Bayes.The core classification of this work relies on the set of wordsin the LIWC dictionary [27], and the authors expanded this
baseline by adding new features for the OSN context. Thefeatures added include a list of negative and positive words,a list of booster words to strengthen (e.g., “very”) or weaken(e.g., “somewhat”) sentiments, a list of emoticons, and theuse of repeated punctuation (e.g., “Cool!!!!”) to strengthensentiments. For evaluation, the authors used labeled textmessages from six different Web 2.0 sources, including MyS-pace, Twitter, Digg, BBC Forum, Runners World Forum,and YouTube Comments.
The authors released a tool named SentiStrengh, whichimplements a combination of learning techniques that pro-duces the best results and the best training model empiri-cally obtained [28]. Therefore, SentiStrengh implements thestate-of-the-art machine learning method in the context ofOSNs. We used SentiStrength version 2.0, which is availableat http://sentistrength.wlv.ac.uk/Download.
2.4 SentiWordNetSentiWordNet [14] is a tool that is widely used in opin-
ion mining, and is based on an English lexical dictionarycalled WordNet [20]. This lexical dictionary groups adjec-tives, nouns, verbs and other grammatical classes into syn-onym sets called synsets. SentiWordNet associates threescores with synset from the WordNet dictionary to indicatethe sentiment of the text: positive, negative, and objective(neutral). The scores, which are in the values of [0, 1] andadd up to 1, are obtained using a semi-supervised machinelearning method. For example, suppose that a given synsets = [bad, wicked, terrible] has been extracted from a tweet.SentiWordNet then will give scores of 0.0 for positive, 0.850for negative, and 0.150 for objective sentiments, respectively.SentiWordNet was evaluated with a labeled lexicon dictio-nary.
In this paper, we used SentiWordNet version 3.0, whichis available at http://sentiwordnet.isti.cnr.it/. To as-sign polarity based on this method, we considered the av-erage scores of all associated synsets of a given text andconsider it to be positive, if the average score of the positiveaffect is greater than that of the negative affect. Scores fromobjective sentiment were not used in determining polarity.
2.5 SenticNetSenticNet [11] is a method of opinion mining and sen-
timent analysis that explores artificial intelligence and se-mantic Web techniques. The goal of SenticNet is to inferthe polarity of common sense concepts from natural lan-guage text at a semantic level, rather than at the syntacticlevel. The method uses Natural Language Processing (NLP)techniques to create a polarity for nearly 14,000 concepts.For instance, to interpret a message “Boring, it’s Mondaymorning”, SenticNet first tries to identify concepts, whichare “boring” and “Monday morning” in this case. Then itgives polarity score to each concept, in this case, -0.383 for“boring”, and +0.228 for “Monday morning”. The result-ing sentiment score of SenticNet for this example is -0.077,which is the average of these values.
SenticNet was tested and evaluated as a tool to measurethe level of polarity in opinions of patients about the Na-tional Health Service in England [10]. The authors alsotested SenticNet with data from LiveJournal blogs, whereposts were labeled by the authors with over 130 moods, thencategorized as either positive or negative [24, 26]. We use
SenticNet version 2.0, which is available at http://sentic.net/.
2.6 SASAWe employ one more machine learning-based tool called
the SailAil Sentiment Analyzer (SASA) [30]. SASA is amethod based on machine learning techniques such as Sen-tiStrengh and was evaluated with 17,000 labeled tweets onthe 2012 U.S. Elections. The open source tool was eval-uated by the Amazon Mechanical Turk (AMT) [5], where“turkers” were invited to label tweets as positive, negative,neutral, or undefined. We include SASA in particular be-cause it is an open source tool and further because therehad been no apple-to-apple comparison of this tool againstother methods in the sentiment analysis literature. We usedthe SASA python package version 0.1.3, which is availableat https://pypi.python.org/pypi/sasa/0.1.3.
2.7 Happiness IndexHappiness Index [13] is a sentiment scale that uses the
popular Affective Norms for English Words (ANEW) [9].ANEW is a collection of 1,034 words commonly used as-sociated with their affective dimensions of valence, arousal,and dominance. Happiness Index was constructed based onthe ANEW terms and has scores for a given text between1 and 9, indicating the amount of happiness existing in thetext. The authors calculated the frequency that each wordfrom the ANEW appears in the text and then computed aweighted average of the valence of the ANEW study words.The validation of the Happiness Index score is based on ex-amples. In particular, the authors applied it to a dataset ofsong lyrics, song titles, and blog sentences. They found thatthe happiness score for song lyrics had declined from 1961to 2007, while the score for blog posts in the same periodhad increased.
In order to adapt Happiness Index for detecting polarity,we considered any text that is classified with this method inthe range of [1..5) to be negative and in the range of [5..9])to be positive.
2.8 PANAS-tThe PANAS-t [16] is a psychometric scale proposed by us
for detecting mood fluctuations of users on Twitter. Themethod consists of an adapted version of the Positive AffectNegative Affect Scale (PANAS) [31], which is a well-knownmethod in psychology. The PANAS-t is based on a large setof words associated with eleven moods: joviality, assurance,serenity, surprise, fear, sadness, guilt, hostility, shyness, fa-tigue, and attentiveness. The method is designed to trackany increase or decrease in sentiments over time.
To associate text to a specific sentiment, PANAS-t firstutilizes a baseline or the normative values of each sentimentbased on the entire data. Then the method computes theP (s) score for each sentiment s for a given time period asvalues between [−1.0, 1.0] to indicate the change. For exam-ple, if a given set of tweets contain P (“surprise”) as 0.250,then sentiments related to “surprise” increased by 25% com-pared to a typical day. Similarly, P (s) = −0.015 means thatthe sentiment s decreased by 1.5% compared to a typicalday. For evaluation, we presented evidence that the methodworks for tweets about noteworthy events. In this paper,we consider joviality, assurance, serenity, and surprise to bepositive affect and fear, sadness, guilt, hostility, shyness, and
fatigue to be negative affect. We consider attentiveness tobe neutral.
Another method similar to PANAS-t is an adaptation ofthe Profile of Mood States (POMS) [8], a psychological rat-ing scale that measures certain mood states consisting of 65adjectives that qualify the following feelings: tension, de-pression, anger, vigor, fatigue and confusion. However, wecould not include this method for comparison as it was notmade publicly available upon request.
3. METHODOLOGYHaving introduced the eight sentiment analysis methods,
we now describe the datasets and metrics used for compar-ison.
3.1 DatasetsWe employ two different datasets in this paper.
3.1.1 Near-complete Twitter logsThe first dataset is a near-complete log of Twitter mes-
sages posted by all users from March 2006 to August 2009 [12].This dataset contains 54 million users who had 1.9 billionfollow links among themselves and posted 1.7 billion tweetsover the course of 3.5 years. This dataset is appropriatefor the purpose of this work as it contains all users who settheir account publicly available (excluding those users whoset their accounts private) and their tweets, which is notbased on sampling and hence alleviates any sampling bias.Additionally, this dataset allows us to study the reactions tonoteworthy past events and evaluate our methods on datafrom real scenarios.
We chose six events covered by Twitter users1. Theseevents, summarized in Table 2, span topics related to tragedies,product and movie releases, politics, health and sports events.To extract tweets relevant to these events, we first identi-fied the sets of keywords describing the topics by consultingnews websites, blogs, Wikipedia, and informed individuals.Given our selected list of keywords, we identified the topicsby searching for keywords in the tweet dataset. This processis very similar to the way in which mining and monitoringtools to crawl data about specific topics.
We limited the duration of each event because popularkeywords are typically hijacked by spammers after a certainamount of time. Table 2 displays the keywords used andthe total number of tweets for each topic. The first columncontains a short name for the event, which we use to re-fer to them in the rest of the paper. While the table doesnot show the ground truth sentiment of the six events, wecan utilize these events to compare the predicted sentimentsacross different methods.
3.1.2 Labeled Web 2.0 dataThe second dataset is six sets of messages labeled as pos-
itive and negative by humans, and was made available inthe SentiStrength research [28]. These datasets include awide range of social web texts from: MySpace, Twitter,Digg, BBC forum, Runners World forum, and YouTubecomments. Table 3 summarizes the number of messages ineach dataset along with the fraction of positive and negativeground truth.
1Top Twitter trends at http://tinyurl.com/yb4965e

Table 2: Summary information of the six major topics events studied
Topic Period KeywordsAirFrance 06.01–06.2009 victims, passengers, a330, 447, crash, airplane, airfrance2008US-Elect 11.02–06.2008 voting, vote, candidate, campaign, mccain, democrat*, republican*, obama, bush2008Olympics 08.06–26.2008 olympics, medal*, china, beijing, sports, peking, sponsorSusan Boyle 04.11–16.2009 susan boyle, I dreamed a dream, britain’s got talent, les miserablesH1N1 06.09–26.2009 outbreak, virus, influenza, pandemi*, h1n1, swine, world health organizationHarry-Potter 07.13–17.2009 harry potter, half-blood prince, rowling
Table 3: Labeled datasetsData type # Messages Pos / NegTwitter 4,242 58.58% / 41.42%MySpace 1,041 84.17% / 15.83%YouTube 3,407 68.44% / 31.56%BBC forum 1,000 13.16% / 86.84%Runners world 1,046 68.65% / 31.35%Digg 1,077 26.85% / 73.15%
With this human-labeled data, we are able to quantifythe extent to which different sentiment analysis methods canaccurately predict polarity of content. We do not measurethis for SentiStrength, since this method is trained on thesame dataset.
3.2 Comparison MeasuresIn order to define the metrics used to evaluate the methods
we are analyzing, we consider the following metrics:
Actual observationPositive Negative
Predicted Positive a bexpectation Negative c d
Let a represent the number of messages correctly classi-fied as positive (i.e., true positive), b the number of nega-tive messages classified as positive (i.e., false positive), c thenumber of positive messages classified as negative (i.e., falsenegative), and d the number of messages correctly classi-fied as negative (i.e., true negative). In order to compareand evaluate the methods, we consider the following met-rics, commonly used in information retrieval: true positiverate or recall: R = a/(a + c), false positive rate or preci-sion: P = a/(a + b), accuracy: A = (a + d)/(a + b + c + d),and F-measure: F = 2 · (P · R)/(P + R). We will in manycases simply use the F-measure, as it is a measure of a test’saccuracy and relies on both precision and recall.
We report all the metrics listed above since they have di-rect interpretation in practice. The true positive rate or re-call can be understood as the rate at which positive messagesare predicted to be positive (R), whereas the true negativerate is the rate at which negative messages are predicted tobe negative. The accuracy represents the rate at which themethod predicts results correctly (A). The precision rate,also called the positive predictive rate, calculates how closethe measured values are to each other (P ). We also use theF-measure to compare results, since it is a standard wayof summarizing precision and recall (F ). Ideally, a polarityidentification method reaches the maximum value of the F-measure, which is 1, meaning that its polarity classificationis perfect.
Finally, we define coverage as the fraction of messages in agiven dataset that a method is able to classify as either pos-itive or negative. Ideally, polarity detection methods shouldretain high coverage to avoid bias in the results, due to theunidentified messages. For instance, suppose that a senti-ment method has classified only 10% of a given set of tweets.The remaining 90% consisting of unidentified tweets maycompletely change the result, that is, whether the contextdrawn from tweets should be positive or negative. There-fore, having high coverage in data is essential in analyzingOSN data. In addition to high coverage, it is also desirableto have a high F-measure as discussed above.
4. COMPARISON RESULTSIn order to understand the advantages, disadvantages, and
limitations of the various sentiment analysis methods, wepresent comparison results among them.
4.1 CoverageWe begin by comparing the coverage of all methods across
the representative events from Twitter and also examine theintersection of the covered tweets across the methods.
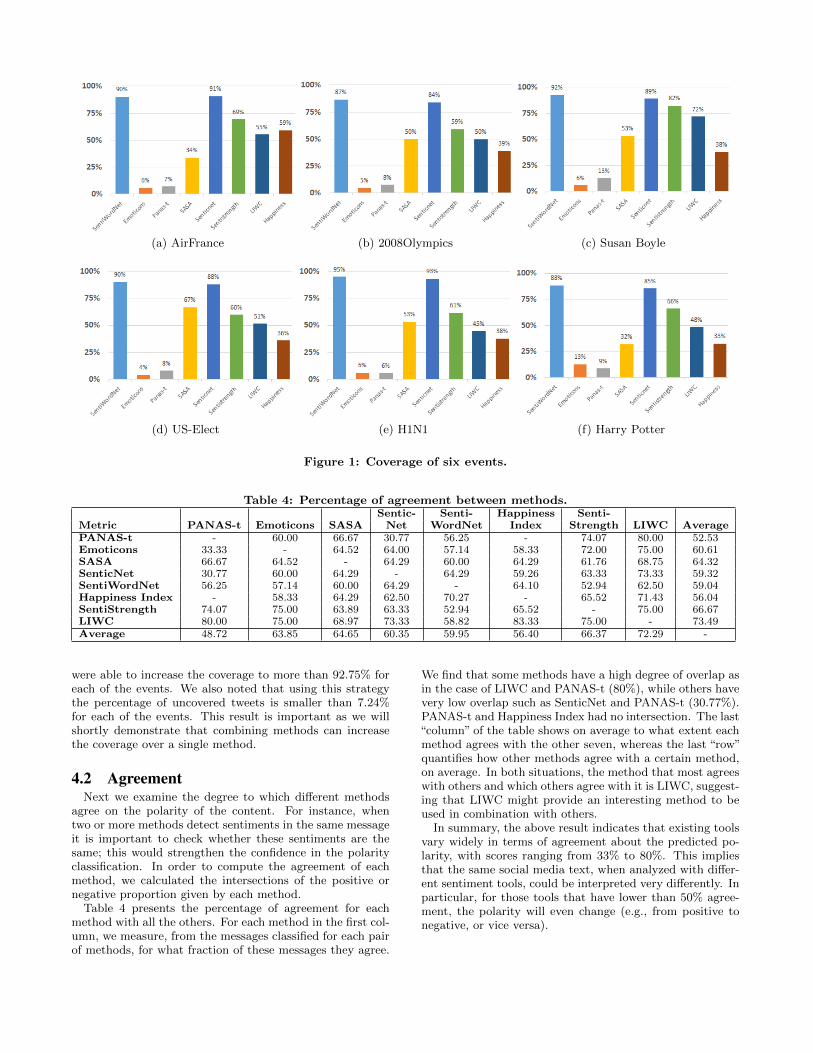
For each topic described in Table 2, we computed the cov-erage of each of the eight sentiment analysis methods. Fig-ure 1(a) shows the result for the AirFrance event, a tragicplane crash in 2009. As shown in the figure, SentiWordNetand SenticNet have the highest coverage with 90% and 91%,respectively, followed by SentiStrength with 69%. Emoti-cons and PANAS-t can interpret less than 10% of all rele-vant tweets. In the case of the U.S. Election event depictedin Figure 1(d), SentiWordNet, SenticNet and SASA havethe highest coverage percentages with 90%, 88% and 67%,respectively.
In fact, either SentiWordNet and SenticNet had the high-est coverage for every event from Table 2. In the other eventsSentiStrength, LIWC, and SASA had ranked in third andfourth positions.
Figure 1(e) shows the result for the outbreak of the H1N1influenza, a worldwide epidemic declared by the World HealthOrganization in 2009. In this case, SentiWordNet and Sen-ticNet have the highest coverage with 95% and 93%, respec-tively, followed by SentiStrength with 61%. The rankingof coverage across the methods is similar to the AirFranceevent.
The analysis above shows that despite a few methods hav-ing high coverage, the percentage of tweets left unidentifiedis significant for most of methods, which is a serious prob-lem for sentiment analysis. We next examine what fractionof the tweets can be identified if we combine more than onemethod. For each event, we combined all methods one byone, beginning from the one with the highest coverage to theone with the lowest coverage. Combining two methods, we
(a) AirFrance (b) 2008Olympics (c) Susan Boyle
(d) US-Elect (e) H1N1 (f) Harry Potter
Figure 1: Coverage of six events.
Table 4: Percentage of agreement between methods.Sentic- Senti- Happiness Senti-
Metric PANAS-t Emoticons SASA Net WordNet Index Strength LIWC AveragePANAS-t - 60.00 66.67 30.77 56.25 - 74.07 80.00 52.53Emoticons 33.33 - 64.52 64.00 57.14 58.33 72.00 75.00 60.61SASA 66.67 64.52 - 64.29 60.00 64.29 61.76 68.75 64.32SenticNet 30.77 60.00 64.29 - 64.29 59.26 63.33 73.33 59.32SentiWordNet 56.25 57.14 60.00 64.29 - 64.10 52.94 62.50 59.04Happiness Index - 58.33 64.29 62.50 70.27 - 65.52 71.43 56.04SentiStrength 74.07 75.00 63.89 63.33 52.94 65.52 - 75.00 66.67LIWC 80.00 75.00 68.97 73.33 58.82 83.33 75.00 - 73.49Average 48.72 63.85 64.65 60.35 59.95 56.40 66.37 72.29 -
were able to increase the coverage to more than 92.75% foreach of the events. We also noted that using this strategythe percentage of uncovered tweets is smaller than 7.24%for each of the events. This result is important as we willshortly demonstrate that combining methods can increasethe coverage over a single method.
4.2 AgreementNext we examine the degree to which different methods
agree on the polarity of the content. For instance, whentwo or more methods detect sentiments in the same messageit is important to check whether these sentiments are thesame; this would strengthen the confidence in the polarityclassification. In order to compute the agreement of eachmethod, we calculated the intersections of the positive ornegative proportion given by each method.
Table 4 presents the percentage of agreement for eachmethod with all the others. For each method in the first col-umn, we measure, from the messages classified for each pairof methods, for what fraction of these messages they agree.
We find that some methods have a high degree of overlap asin the case of LIWC and PANAS-t (80%), while others havevery low overlap such as SenticNet and PANAS-t (30.77%).PANAS-t and Happiness Index had no intersection. The last“column” of the table shows on average to what extent eachmethod agrees with the other seven, whereas the last “row”quantifies how other methods agree with a certain method,on average. In both situations, the method that most agreeswith others and which others agree with it is LIWC, suggest-ing that LIWC might provide an interesting method to beused in combination with others.
In summary, the above result indicates that existing toolsvary widely in terms of agreement about the predicted po-larity, with scores ranging from 33% to 80%. This impliesthat the same social media text, when analyzed with differ-ent sentiment tools, could be interpreted very differently. Inparticular, for those tools that have lower than 50% agree-ment, the polarity will even change (e.g., from positive tonegative, or vice versa).
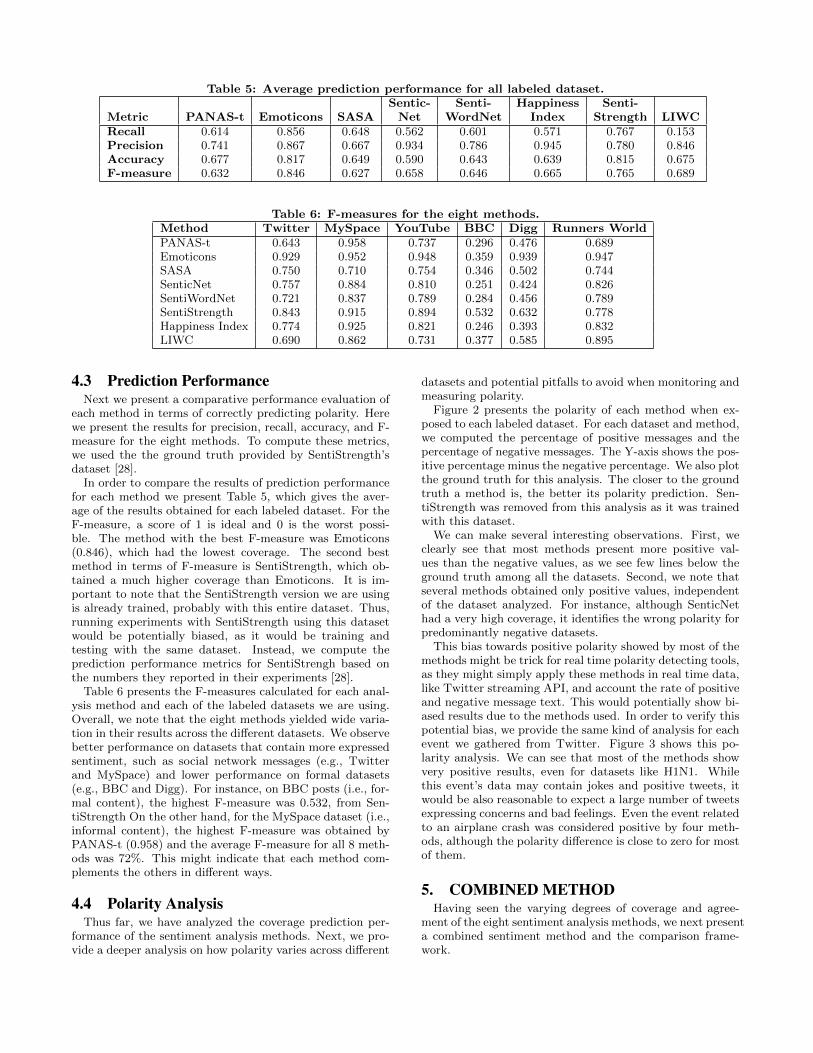
Table 5: Average prediction performance for all labeled dataset.Sentic- Senti- Happiness Senti-
Metric PANAS-t Emoticons SASA Net WordNet Index Strength LIWCRecall 0.614 0.856 0.648 0.562 0.601 0.571 0.767 0.153Precision 0.741 0.867 0.667 0.934 0.786 0.945 0.780 0.846Accuracy 0.677 0.817 0.649 0.590 0.643 0.639 0.815 0.675F-measure 0.632 0.846 0.627 0.658 0.646 0.665 0.765 0.689
Table 6: F-measures for the eight methods.Method Twitter MySpace YouTube BBC Digg Runners WorldPANAS-t 0.643 0.958 0.737 0.296 0.476 0.689Emoticons 0.929 0.952 0.948 0.359 0.939 0.947SASA 0.750 0.710 0.754 0.346 0.502 0.744SenticNet 0.757 0.884 0.810 0.251 0.424 0.826SentiWordNet 0.721 0.837 0.789 0.284 0.456 0.789SentiStrength 0.843 0.915 0.894 0.532 0.632 0.778Happiness Index 0.774 0.925 0.821 0.246 0.393 0.832LIWC 0.690 0.862 0.731 0.377 0.585 0.895
4.3 Prediction PerformanceNext we present a comparative performance evaluation of
each method in terms of correctly predicting polarity. Herewe present the results for precision, recall, accuracy, and F-measure for the eight methods. To compute these metrics,we used the the ground truth provided by SentiStrength’sdataset [28].
In order to compare the results of prediction performancefor each method we present Table 5, which gives the aver-age of the results obtained for each labeled dataset. For theF-measure, a score of 1 is ideal and 0 is the worst possi-ble. The method with the best F-measure was Emoticons(0.846), which had the lowest coverage. The second bestmethod in terms of F-measure is SentiStrength, which ob-tained a much higher coverage than Emoticons. It is im-portant to note that the SentiStrength version we are usingis already trained, probably with this entire dataset. Thus,running experiments with SentiStrength using this datasetwould be potentially biased, as it would be training andtesting with the same dataset. Instead, we compute theprediction performance metrics for SentiStrengh based onthe numbers they reported in their experiments [28].
Table 6 presents the F-measures calculated for each anal-ysis method and each of the labeled datasets we are using.Overall, we note that the eight methods yielded wide varia-tion in their results across the different datasets. We observebetter performance on datasets that contain more expressedsentiment, such as social network messages (e.g., Twitterand MySpace) and lower performance on formal datasets(e.g., BBC and Digg). For instance, on BBC posts (i.e., for-mal content), the highest F-measure was 0.532, from Sen-tiStrength On the other hand, for the MySpace dataset (i.e.,informal content), the highest F-measure was obtained byPANAS-t (0.958) and the average F-measure for all 8 meth-ods was 72%. This might indicate that each method com-plements the others in different ways.
4.4 Polarity AnalysisThus far, we have analyzed the coverage prediction per-
formance of the sentiment analysis methods. Next, we pro-vide a deeper analysis on how polarity varies across different
datasets and potential pitfalls to avoid when monitoring andmeasuring polarity.
Figure 2 presents the polarity of each method when ex-posed to each labeled dataset. For each dataset and method,we computed the percentage of positive messages and thepercentage of negative messages. The Y-axis shows the pos-itive percentage minus the negative percentage. We also plotthe ground truth for this analysis. The closer to the groundtruth a method is, the better its polarity prediction. Sen-tiStrength was removed from this analysis as it was trainedwith this dataset.
We can make several interesting observations. First, weclearly see that most methods present more positive val-ues than the negative values, as we see few lines below theground truth among all the datasets. Second, we note thatseveral methods obtained only positive values, independentof the dataset analyzed. For instance, although SenticNethad a very high coverage, it identifies the wrong polarity forpredominantly negative datasets.
This bias towards positive polarity showed by most of themethods might be trick for real time polarity detecting tools,as they might simply apply these methods in real time data,like Twitter streaming API, and account the rate of positiveand negative message text. This would potentially show bi-ased results due to the methods used. In order to verify thispotential bias, we provide the same kind of analysis for eachevent we gathered from Twitter. Figure 3 shows this po-larity analysis. We can see that most of the methods showvery positive results, even for datasets like H1N1. Whilethis event’s data may contain jokes and positive tweets, itwould be also reasonable to expect a large number of tweetsexpressing concerns and bad feelings. Even the event relatedto an airplane crash was considered positive by four meth-ods, although the polarity difference is close to zero for mostof them.
5. COMBINED METHODHaving seen the varying degrees of coverage and agree-
ment of the eight sentiment analysis methods, we next presenta combined sentiment method and the comparison frame-work.

Figure 2: Polarity of the eight sentiment methods across the labeled datasets, indicating that existing methodsvary widely in their agreement.
Figure 3: Polarity of the eight sentiment methods across several real notable events, indicating that existingmethods vary widely in their agreement.
(a) Comparison (b) Tradeoff
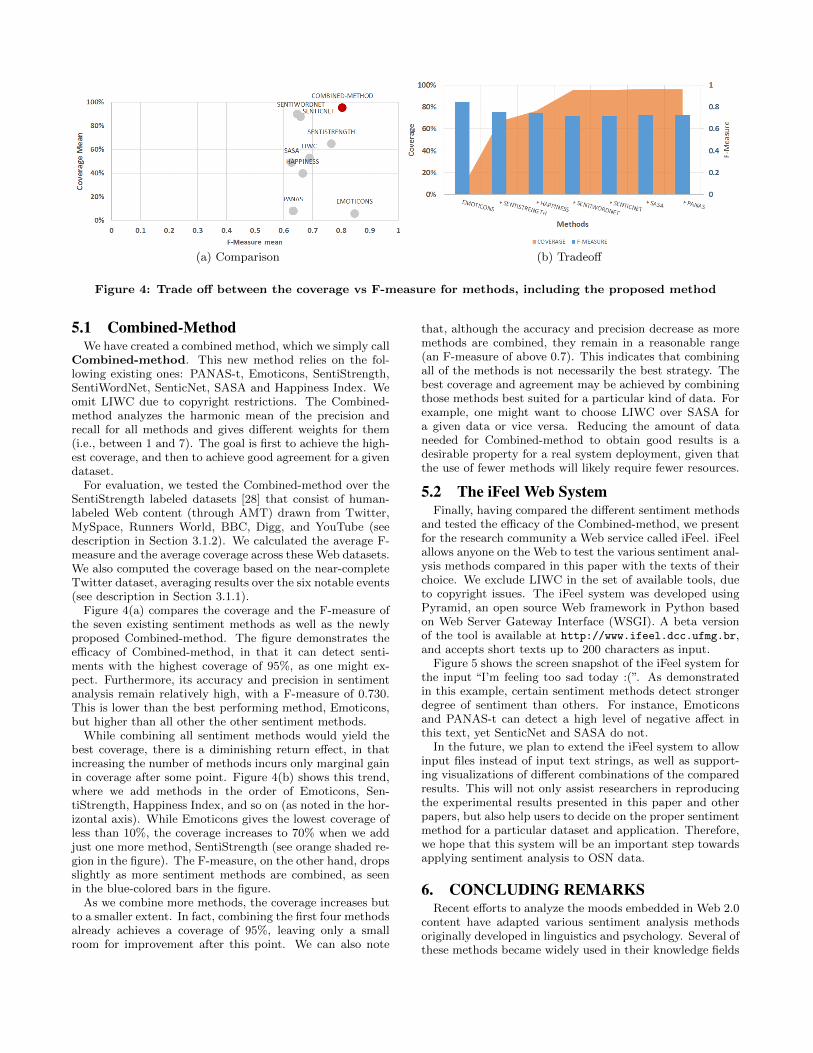
Figure 4: Trade off between the coverage vs F-measure for methods, including the proposed method
5.1 Combined-MethodWe have created a combined method, which we simply call
Combined-method. This new method relies on the fol-lowing existing ones: PANAS-t, Emoticons, SentiStrength,SentiWordNet, SenticNet, SASA and Happiness Index. Weomit LIWC due to copyright restrictions. The Combined-method analyzes the harmonic mean of the precision andrecall for all methods and gives different weights for them(i.e., between 1 and 7). The goal is first to achieve the high-est coverage, and then to achieve good agreement for a givendataset.
For evaluation, we tested the Combined-method over theSentiStrength labeled datasets [28] that consist of human-labeled Web content (through AMT) drawn from Twitter,MySpace, Runners World, BBC, Digg, and YouTube (seedescription in Section 3.1.2). We calculated the average F-measure and the average coverage across these Web datasets.We also computed the coverage based on the near-completeTwitter dataset, averaging results over the six notable events(see description in Section 3.1.1).
Figure 4(a) compares the coverage and the F-measure ofthe seven existing sentiment methods as well as the newlyproposed Combined-method. The figure demonstrates theefficacy of Combined-method, in that it can detect senti-ments with the highest coverage of 95%, as one might ex-pect. Furthermore, its accuracy and precision in sentimentanalysis remain relatively high, with a F-measure of 0.730.This is lower than the best performing method, Emoticons,but higher than all other the other sentiment methods.
While combining all sentiment methods would yield thebest coverage, there is a diminishing return effect, in thatincreasing the number of methods incurs only marginal gainin coverage after some point. Figure 4(b) shows this trend,where we add methods in the order of Emoticons, Sen-tiStrength, Happiness Index, and so on (as noted in the hor-izontal axis). While Emoticons gives the lowest coverage ofless than 10%, the coverage increases to 70% when we addjust one more method, SentiStrength (see orange shaded re-gion in the figure). The F-measure, on the other hand, dropsslightly as more sentiment methods are combined, as seenin the blue-colored bars in the figure.
As we combine more methods, the coverage increases butto a smaller extent. In fact, combining the first four methodsalready achieves a coverage of 95%, leaving only a smallroom for improvement after this point. We can also note
that, although the accuracy and precision decrease as moremethods are combined, they remain in a reasonable range(an F-measure of above 0.7). This indicates that combiningall of the methods is not necessarily the best strategy. Thebest coverage and agreement may be achieved by combiningthose methods best suited for a particular kind of data. Forexample, one might want to choose LIWC over SASA fora given data or vice versa. Reducing the amount of dataneeded for Combined-method to obtain good results is adesirable property for a real system deployment, given thatthe use of fewer methods will likely require fewer resources.
5.2 The iFeel Web SystemFinally, having compared the different sentiment methods
and tested the efficacy of the Combined-method, we presentfor the research community a Web service called iFeel. iFeelallows anyone on the Web to test the various sentiment anal-ysis methods compared in this paper with the texts of theirchoice. We exclude LIWC in the set of available tools, dueto copyright issues. The iFeel system was developed usingPyramid, an open source Web framework in Python basedon Web Server Gateway Interface (WSGI). A beta versionof the tool is available at http://www.ifeel.dcc.ufmg.br,and accepts short texts up to 200 characters as input.
Figure 5 shows the screen snapshot of the iFeel system forthe input “I’m feeling too sad today :(”. As demonstratedin this example, certain sentiment methods detect strongerdegree of sentiment than others. For instance, Emoticonsand PANAS-t can detect a high level of negative affect inthis text, yet SenticNet and SASA do not.
In the future, we plan to extend the iFeel system to allowinput files instead of input text strings, as well as support-ing visualizations of different combinations of the comparedresults. This will not only assist researchers in reproducingthe experimental results presented in this paper and otherpapers, but also help users to decide on the proper sentimentmethod for a particular dataset and application. Therefore,we hope that this system will be an important step towardsapplying sentiment analysis to OSN data.
6. CONCLUDING REMARKSRecent efforts to analyze the moods embedded in Web 2.0
content have adapted various sentiment analysis methodsoriginally developed in linguistics and psychology. Several ofthese methods became widely used in their knowledge fields
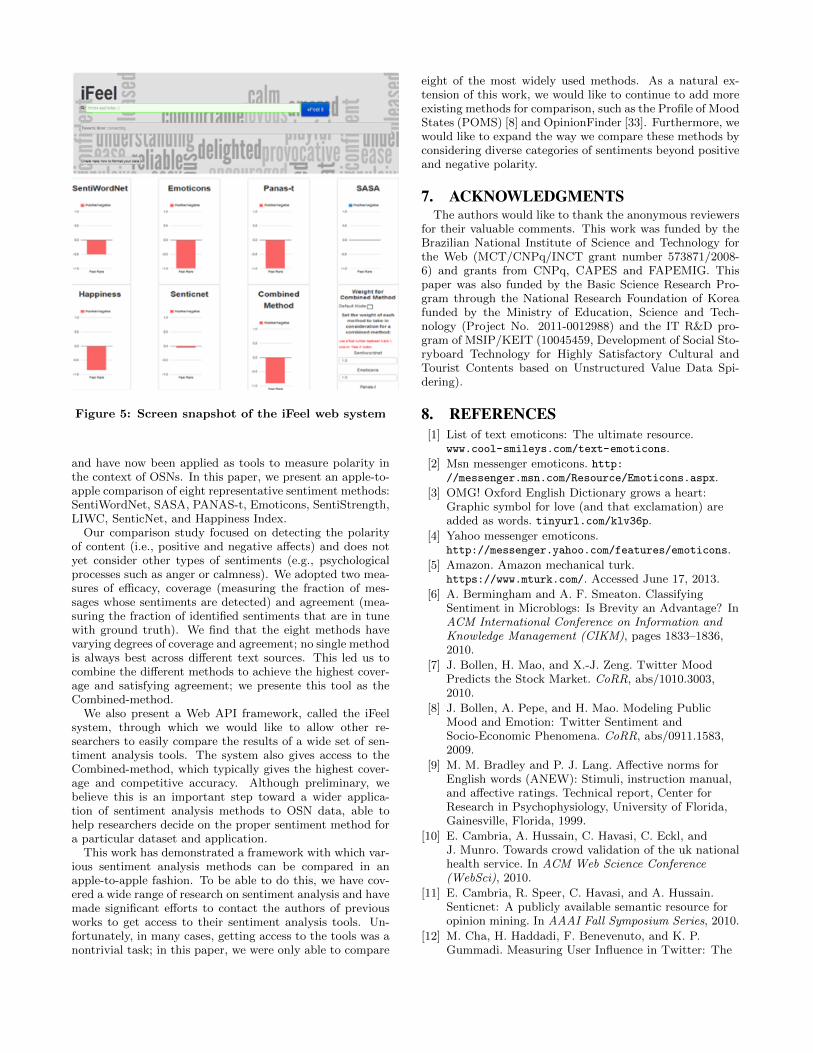
Figure 5: Screen snapshot of the iFeel web system
and have now been applied as tools to measure polarity inthe context of OSNs. In this paper, we present an apple-to-apple comparison of eight representative sentiment methods:SentiWordNet, SASA, PANAS-t, Emoticons, SentiStrength,LIWC, SenticNet, and Happiness Index.
Our comparison study focused on detecting the polarityof content (i.e., positive and negative affects) and does notyet consider other types of sentiments (e.g., psychologicalprocesses such as anger or calmness). We adopted two mea-sures of efficacy, coverage (measuring the fraction of mes-sages whose sentiments are detected) and agreement (mea-suring the fraction of identified sentiments that are in tunewith ground truth). We find that the eight methods havevarying degrees of coverage and agreement; no single methodis always best across different text sources. This led us tocombine the different methods to achieve the highest cover-age and satisfying agreement; we presente this tool as theCombined-method.
We also present a Web API framework, called the iFeelsystem, through which we would like to allow other re-searchers to easily compare the results of a wide set of sen-timent analysis tools. The system also gives access to theCombined-method, which typically gives the highest cover-age and competitive accuracy. Although preliminary, webelieve this is an important step toward a wider applica-tion of sentiment analysis methods to OSN data, able tohelp researchers decide on the proper sentiment method fora particular dataset and application.
This work has demonstrated a framework with which var-ious sentiment analysis methods can be compared in anapple-to-apple fashion. To be able to do this, we have cov-ered a wide range of research on sentiment analysis and havemade significant efforts to contact the authors of previousworks to get access to their sentiment analysis tools. Un-fortunately, in many cases, getting access to the tools was anontrivial task; in this paper, we were only able to compare
eight of the most widely used methods. As a natural ex-tension of this work, we would like to continue to add moreexisting methods for comparison, such as the Profile of MoodStates (POMS) [8] and OpinionFinder [33]. Furthermore, wewould like to expand the way we compare these methods byconsidering diverse categories of sentiments beyond positiveand negative polarity.
7. ACKNOWLEDGMENTSThe authors would like to thank the anonymous reviewers
for their valuable comments. This work was funded by theBrazilian National Institute of Science and Technology forthe Web (MCT/CNPq/INCT grant number 573871/2008-6) and grants from CNPq, CAPES and FAPEMIG. Thispaper was also funded by the Basic Science Research Pro-gram through the National Research Foundation of Koreafunded by the Ministry of Education, Science and Tech-nology (Project No. 2011-0012988) and the IT R&D pro-gram of MSIP/KEIT (10045459, Development of Social Sto-ryboard Technology for Highly Satisfactory Cultural andTourist Contents based on Unstructured Value Data Spi-dering).
8. REFERENCES[1] List of text emoticons: The ultimate resource.
www.cool-smileys.com/text-emoticons.
[2] Msn messenger emoticons. http://messenger.msn.com/Resource/Emoticons.aspx.
[3] OMG! Oxford English Dictionary grows a heart:Graphic symbol for love (and that exclamation) areadded as words. tinyurl.com/klv36p.
[4] Yahoo messenger emoticons.http://messenger.yahoo.com/features/emoticons.
[5] Amazon. Amazon mechanical turk.https://www.mturk.com/. Accessed June 17, 2013.
[6] A. Bermingham and A. F. Smeaton. ClassifyingSentiment in Microblogs: Is Brevity an Advantage? InACM International Conference on Information andKnowledge Management (CIKM), pages 1833–1836,2010.
[7] J. Bollen, H. Mao, and X.-J. Zeng. Twitter MoodPredicts the Stock Market. CoRR, abs/1010.3003,2010.
[8] J. Bollen, A. Pepe, and H. Mao. Modeling PublicMood and Emotion: Twitter Sentiment andSocio-Economic Phenomena. CoRR, abs/0911.1583,2009.
[9] M. M. Bradley and P. J. Lang. Affective norms forEnglish words (ANEW): Stimuli, instruction manual,and affective ratings. Technical report, Center forResearch in Psychophysiology, University of Florida,Gainesville, Florida, 1999.
[10] E. Cambria, A. Hussain, C. Havasi, C. Eckl, andJ. Munro. Towards crowd validation of the uk nationalhealth service. In ACM Web Science Conference(WebSci), 2010.
[11] E. Cambria, R. Speer, C. Havasi, and A. Hussain.Senticnet: A publicly available semantic resource foropinion mining. In AAAI Fall Symposium Series, 2010.
[12] M. Cha, H. Haddadi, F. Benevenuto, and K. P.Gummadi. Measuring User Influence in Twitter: The
Million Follower Fallacy. In International AAAIConference on Weblogs and Social Media (ICWSM),2010.
[13] P. S. Dodds and C. M. Danforth. Measuring thehappiness of large-scale written expression: songs,blogs, and presidents. Journal of Happiness Studies,11(4):441–456, 2009.
[14] Esuli and Sebastiani. Sentwordnet: A publiclyavailable lexical resource for opinion mining. InInternational Conference on Language Resources andEvaluation (LREC), pages 417–422, 2006.
[15] J. Gomide, A. Veloso, W. M. Jr., V. Almeida,F. Benevenuto, F. Ferraz, and M. Teixeira. Denguesurveillance based on a computational model ofspatio-temporal locality of twitter. In ACM WebScience Conference (WebSci), 2011.
[16] P. Goncalves, F. Benevenuto, and M. Cha. PANAS-t:A Pychometric Scale for Measuring Sentiments onTwitter. abs/1308.1857v1, 2013.
[17] A. Hannak, E. Anderson, L. F. Barrett, S. Lehmann,A. Mislove, and M. Riedewald. Tweetin’ in the rain:Exploring societal-scale effects of weather on mood. InInt’l AAAI Conference on Weblogs and Social Media(ICWSM), 2012.
[18] X. Hu, J. Tang, H. Gao, and H. Liu. Unsupervisedsentiment analysis with emotional signals. InInternational Conference on World Wide Web(WWW), 2013.
[19] A. Lamb, M. J. Paul, and M. Dredze. Separating Factfrom Fear: Tracking Flu Infections on Twitter. InConference of the North American Chapter of theAssociation for Computational Linguistics: HumanLanguage Technologies, pages 789–795, June 2013.
[20] G. A. Miller. Wordnet: a lexical database for english.Communications of the ACM, 38(11):39–41, 1995.
[21] G. Paltoglou and M. Thelwall. Twitter, MySpace,Digg: Unsupervised Sentiment Analysis in SocialMedia. ACM Transactions on Intelligent Systems andTechnology (TIST), 3(4):66:1–66:19, 2012.
[22] B. Pang, L. Lee, and S. Vaithyanathan. Thumbs up?:sentiment classification using machine learningtechniques. In ACL Conference on Empirical Methodsin Natural Language Processing, pages 79–86, 2002.
[23] J. Park, V. Barash, C. Fink, and M. Cha. Emoticonstyle: Interpreting differences in emoticons acrosscultures. In International AAAI Conference onWeblogs and Social Media (ICWSM), 2013.
[24] J. Read. Using emoticons to reduce dependency inmachine learning techniques for sentimentclassification. In ACL Student Research Workshop,pages 43–48, 2005.
[25] T. Sakaki, M. Okazaki, and Y. Matsuo. Earthquakeshakes twitter users: real-time event detection bysocial sensors. In Int’l Conference on World wide web(WWW), pages 851–860, 2010.
[26] S. Somasundaran, J. Wiebe, and J. Ruppenhofer.Discourse level opinion interpretation. In Int’lConference on Computational Linguistics (COLING),pages 801–808, 2008.
[27] Y. R. Tausczik and J. W. Pennebaker. Thepsychological meaning of words: Liwc andcomputerized text analysis methods. Journal ofLanguage and Social Psychology, 29(1):24–54, 2010.
[28] M. Thelwall. Heart and soul: Sentiment strengthdetection in the social web with sentistrength.http://sentistrength.wlv.ac.uk/documentation/
SentiStrengthChapter.pdf.
[29] A. Tumasjan, T. O. Sprenger, P. G. Sandner, andI. M. Welpe. Predicting Elections with Twitter: What140 Characters Reveal about Political Sentiment. InInternational AAAI Conference on Weblogs and SocialMedia (ICWSM), 2010.
[30] H. Wang, D. Can, A. Kazemzadeh, F. Bar, andS. Narayanan. A system for real-time twitter sentimentanalysis of 2012 u.s. presidential election cycle. InACL System Demonstrations, pages 115–120, 2012.
[31] D. Watson and L. Clark. Development and validationof brief measures of positive and negative affect: thepanas scales. Journal of Personality and SocialPsychology, 54(1):1063–1070, 1985.
[32] K. Wickre. Celebrating Twitter7. http://blog.twitter.com/2013/03/celebrating-twitter7.html.Accessed March 25, 2013.
[33] T. Wilson, P. Hoffmann, S. Somasundaran, J. Kessler,J. Wiebe, Y. Choi, C. Cardie, E. Riloff, andS. Patwardhan. Opinionfinder: a system forsubjectivity analysis. In HLT/EMNLP on InteractiveDemonstrations, pages 34–35, 2005.