comparing areas to stimulate progress in road safety … · 29 november 2012 benchmarking road...
TRANSCRIPT

Benchmarking road safety 1 29 november 2012
Comparing areas to stimulate progress in road safety
dr. Letty Aarts (SWOV) ing. Rob van den Ban (city of Amsterdam)
29 november 2012 Benchmarking road safety 2
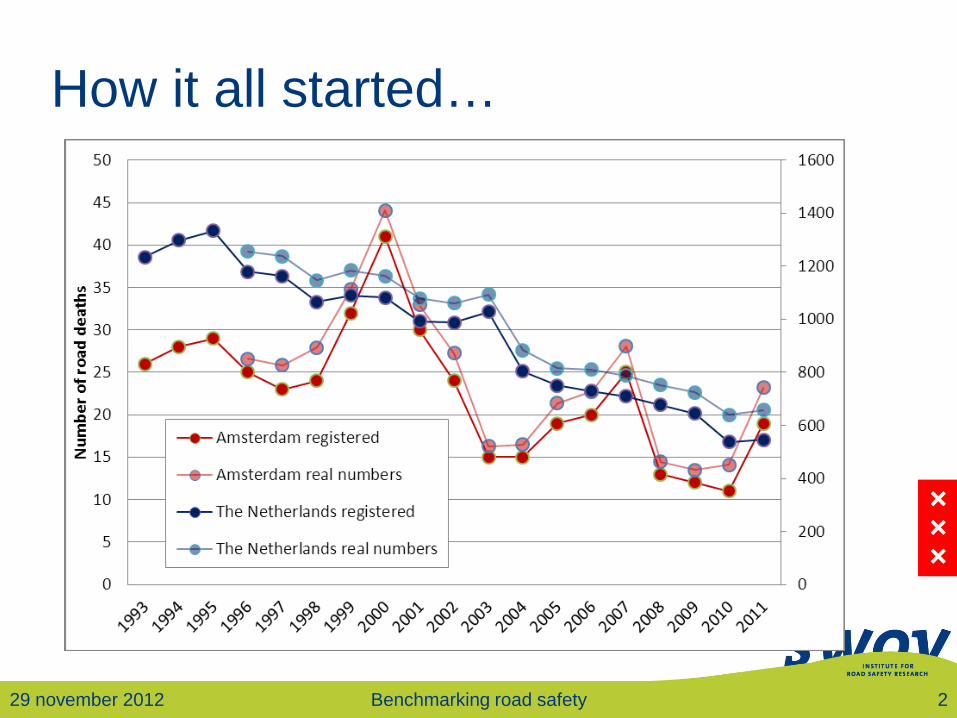
How it all started…

29 November 2012 Benchmarking road safety 3
Amsterdam 0.79 million inhabitants 0.88 million bikes

29 november 2012 Benchmarking road safety 4
Differences and similarities between areas…
29 november 2012 Benchmarking road safety 5
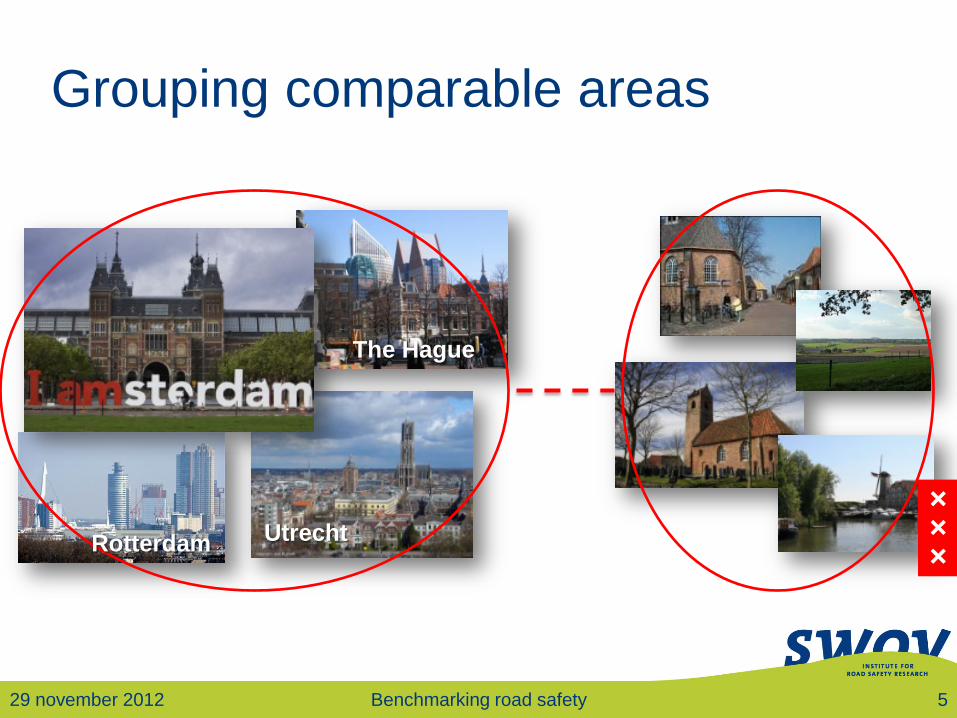
Grouping comparable areas
The Hague
Utrecht Rotterdam
29 november 2012 Benchmarking road safety 6
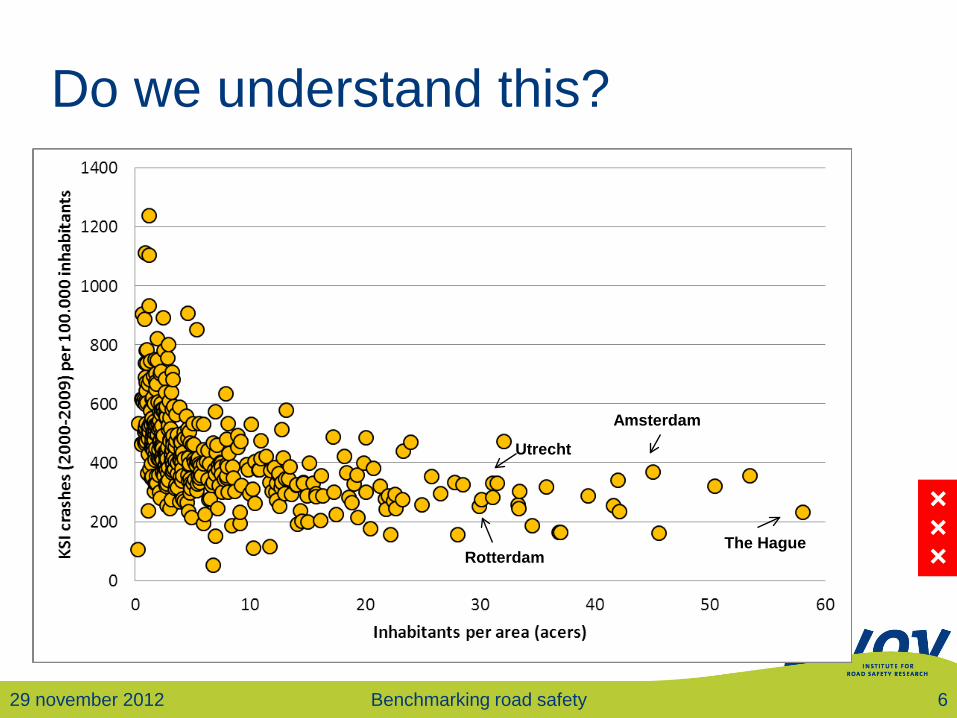
Do we understand this?
The Hague
Amsterdam
Utrecht
Rotterdam
29 november 2012 Benchmarking road safety 7
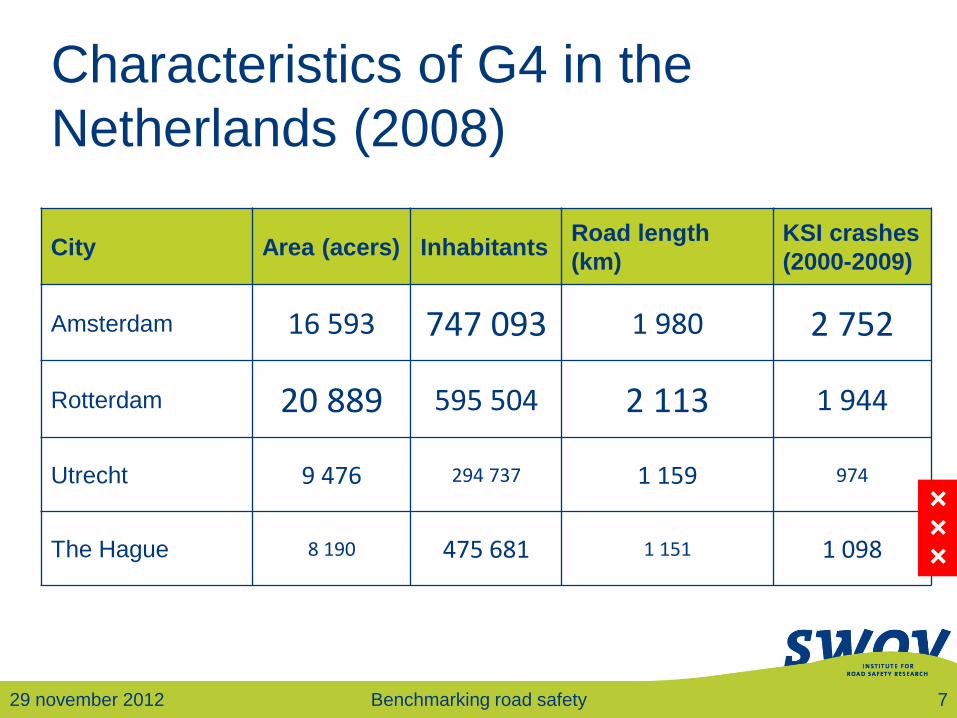
Characteristics of G4 in the Netherlands (2008)
City Area (acers) Inhabitants Road length (km)
KSI crashes (2000-2009)
Amsterdam 16 593 747 093 1 980 2 752
Rotterdam 20 889 595 504 2 113 1 944
Utrecht 9 476 294 737 1 159 974
The Hague 8 190 475 681 1 151 1 098

29 november 2012 Benchmarking road safety 8
Explanations for differences (2008)
City Inhabitants/ area
Road length/1000 inhabitants
KSI crashes/ inhabitants
KSI-crashes/ road length
Amsterdam 45 2.65 3.68 1.39
Rotterdam 29 3.55 3.26 0.92
Utrecht 30 3.93 3.30 0.84
The Hague 58 2.42 2.31 0.95

29 november 2012 Benchmarking road safety 9
Road safety patterns in G4

29 november 2012 Benchmarking road safety 10
Share of fatal road crashes (1990-2011)
29 november 2012 Benchmarking road safety 11
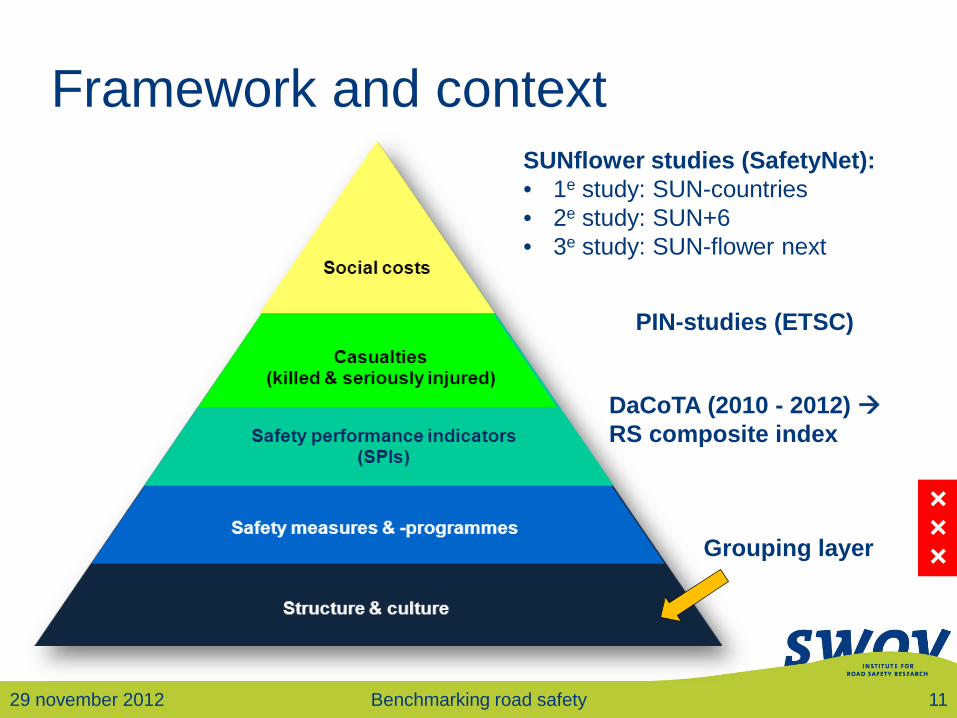
Framework and context
SUNflower studies (SafetyNet): • 1e study: SUN-countries • 2e study: SUN+6 • 3e study: SUN-flower next
PIN-studies (ETSC)
DaCoTA (2010 - 2012) RS composite index
Grouping layer
29 november 2012 Benchmarking road safety 12
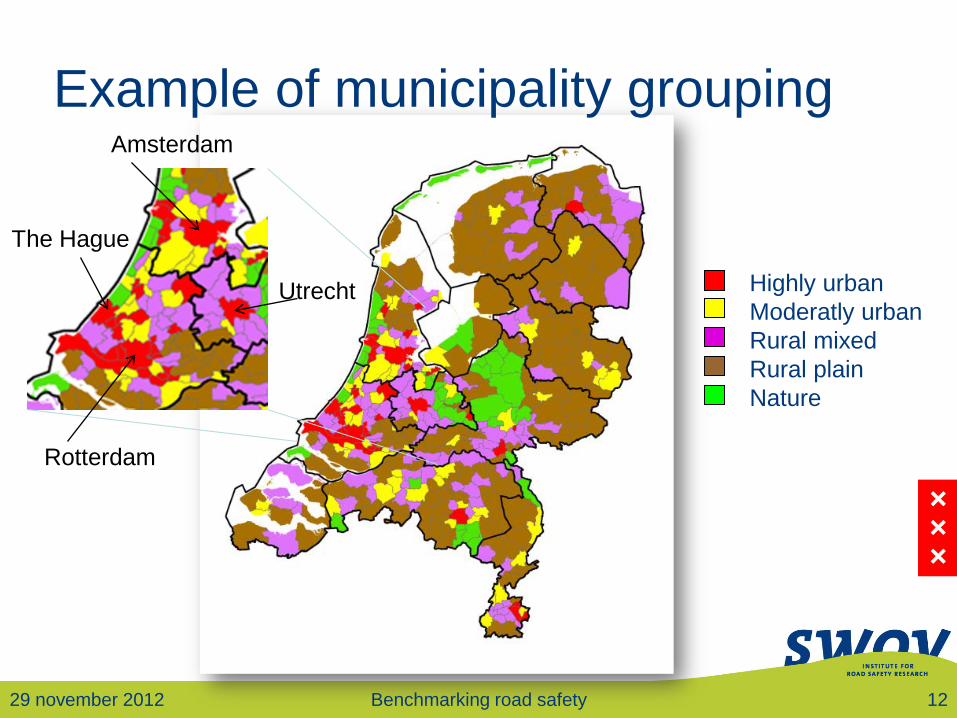
Highly urban Moderatly urban Rural mixed Rural plain Nature
Example of municipality grouping Amsterdam
Rotterdam
Utrecht
The Hague

29 november 2012 Comparing areas 13
Shares per area type Area type Share of land Share of serious
crashes
Highly urban 4.0% 22.4%
Moderately urban 9.5% 22.3%
Rural mixed 21.3% 20.0%
Rural plain 55.9% 26.7%
Nature 9.3% 8.5%

Name Title 14
Example: serious pedestrian crashes
Highly urban
municipalities
Very low share Low share Moderate share High share Very high share

29 November 2012 Benchmarking road safety 15
Concluding
• Further steps – Explanations in better exposure measures (data!) – Further in-depth explanations (risks SPIs)
• Benchmarking road safety – Grouping of homogeneous areas – Basic similarities: structure and culture layer – Tune to relevant characteristics & local views – Normalize for exposure differences in risk? policy making?

29 November 2012 Benchmarking road safety
THANK YOU FOR YOUR ATTENTION
Further information
[email protected] +31 70 317 33 79